©cmbi 2006 the www of clustering in bioinformatics. or, how homo-sapiens thinks clustering hokjes
Post on 18-Dec-2015
214 views
TRANSCRIPT

©CMBI 2006
The WWW of clustering in Bioinformatics.
or,
How homo-sapiens thinks
Clustering
hokjes

©CMBI 2006
Disclaimer
I know nothing about the actual clustering techniques; for that you must ask Lutgarde, or Ron, or any of their colleagues.
I will talk today about fields, mainly bioinformatics, where clustering is being used.

©CMBI 2006
My daily clustering

©CMBI 2006
Remember bioinformatics 1?
The main reason for aligning sequences is that that allows us to transfer information.
If there are many sequences available, clustering can help us figure out from which of those sequences we can best transfer that information.
Why clustering sequences?
D
E
C
A
B
D
E
C
D
E
D
E
C
A
B
A
B

©CMBI 2006
My daily clusteringTake, for example, the three sequences:1 ASWTFGHK2 GTWSFANR3 ATWAFADRand you see immediately that 2 and 3 are close, while 1 is further away. So the three will look roughly like:
321

©CMBI 2006
A B C D E
A 0 6 9 11 9
B 6 0 7 9 7
C 9 7 0 8 6
D 11 9 8 0 4
E 9 7 6 4 0
Clustering sequences; start with distances
D
E
Matrix of pair-wise distances between five sequences.
10 8 7
D and E are the closest pair. Take them, and collapse the matrix by one row/column.

©CMBI 2006
Clustering sequences
A B C DE
A 0 6 9 10
B 6 0 7 8
C 9 7 0 7
DE 10 8 7 0
D
E
A
B

©CMBI 2006
Clustering sequences
AB C DE
AB 0 8 9
C 8 0 7
DE 9 7 0
D
E
C
A
B

©CMBI 2006
Clustering sequences
AB CDE
AB 0 8.5
CDE 8.5 0
D
E
C
A
B
So it really looks as if we have two clusters, AB and C,DE.
But feel free to call it three clusters…

©CMBI 2006
So, nice tree, but what did we actually do?
1)We determined a distance measure2)We measured all pair-wise distances3)We collapsed everything in ~1½ dimension4)We used an algorithm to visualize things5)We decided on the number of clusters
And that, ladies and gentleman, is called clustering…

©CMBI 2006
Back to my daily clustering
1 ASWTFGHK2 GTWSFANR3 ATWAFADRActually I cheated a bit. 1 is closer to 3 than to 2 because of the A at position 1. How can we express this in the tree? For example:
3 2
1
3
21
I will call thistree-flipping

©CMBI 2006
Can we generalize tree-flipping?
To generalize tree flipping, sequences must be placed ‘distance-correct’ in 1 dimension:
2 3 1
And then connect them, as we did before: So, now most info
sits in the horizontaldimension. Can we use the verticaldimension usefully?

©CMBI 2006
The problem is actually bigger
1 ASWTFGHK2 GTWSFANR3 ATWAFADR
d(i,j) is the distance between sequences i and j.
d(1,2)=6; d(1,3)=5; d(2,3)=3.
But what if a 4th sequence is added with d(1,4)=4, d(2,4)=5, d(3,4)=4? Where would that sequence sit?
So a perfect representation would be:
1
3
2

©CMBI 2006
Projection to visualize clusters
Fuller projection; Unfolded Dymaxion mapGnomonic projection: Correct distances
Political projection
Source: Wikepedia Mercator projection

©CMBI 2006
Back to sequences:
ASASDFDFGHKMGHS 1ASASDFDFRRRLRHS 2ASASDFDFRRRLRIT 5ASLPDFLPGHSIGHS 3ASLPDFLPGHSIGIT 6ASLPDFLPRRRVRIT 4
The more dimensions we retain, the less information we loose. The tree is now in 3D…

©CMBI 2006
Projection to visualize clusters
We want to reduce the dimensionality with minimal distortion of the pair-wise distances. One way is Eigenvector determination, or PCA.

©CMBI 2006
PCA to the rescue
Now we have made the data one-dimensional, while the second, vertical, dimension is noise. If we did this correctly, we kept as much data as possible.

©CMBI 2006
One problem, though…
Can we actually draw a straight line through the points? To me it looks that the best line is not straight but bend; and if that’s true we lost some kind of information! But that is a data-modelling / clustering problem, not a PCA problem…

©CMBI 2006
Back to sequences:
In we have N sequences, we can only draw their distance matrix in an N-1 dimensional space. By the time it is a tree, how many dimensions, and how much information have we lost?
Perhaps we should cluster in a different way?

©CMBI 2006
Cluster on critical residues?
QWERTYAKDFGRGHAWTRTYAKDFGRPMSWTRTNMKDTHRKCQWGRTNMKDTHRVWGray = conservedRed = variableGreen = correlated
No informationfor clustering
No noise

©CMBI 2006
Cluster based on correlated residues

©CMBI 2006
Conclusion about sequence clustering
Important topics:1. Distance measure (~ data selection)2. Data-modelling / algorithm3. Visualization4. Dimensionality reduction

©CMBI 2006
We don’t only cluster sequences…
Other cluster procedures are found in e.g.:1.Structure prediction, analysis, etc;2.Cell-sorting;3.HIV medication choice;4.Cancer radiation and chemotherapy regimes;5.Design of food taste product combinations;and many more, often very different, fields of bio-related topics.The next few slides show some examples.

©CMBI 2006
Other sciences that cluster:
Determination of a structure from massive averaging of very low resolution data.
This is often iterative.

©CMBI 2006
Micro array data
http://gap.stat.sinica.edu.tw/Bioinformatics/

©CMBI 2006
Brain imaging
Donders instituut and
One way of measuring is via hemoglobin.Mane patients or test persons must be averaged. Clustering determines who can be averaged.
Distance measure?Donders, Waisman, and MPG websites.
Cluster with picture deformation

©CMBI 2006
Molecular dynamics
These actually are many superposed motions acting at the same time. Essential dynamics, eigenvector analysis in distance space, separates those motions.
Bert de Groot

©CMBI 2006
Essential dynamics
Daan van AaltenMotion along eigenvector 1
©CMBI 2006
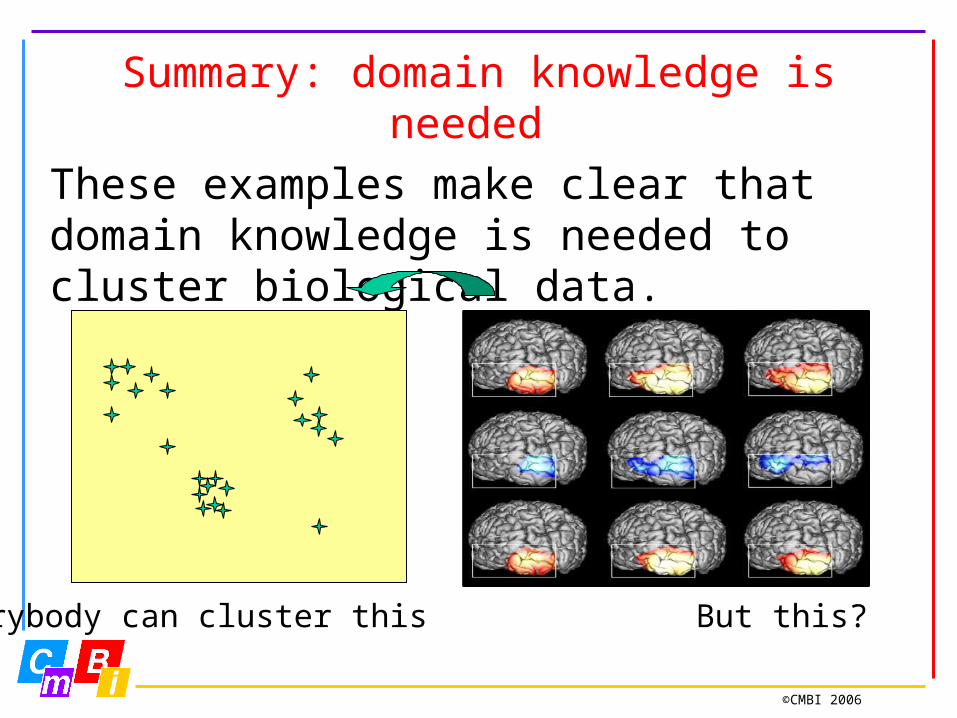
Summary: domain knowledge is needed
These examples make clear that domain knowledge is needed to cluster biological data.
Everybody can cluster this But this?

©CMBI 2006
Even informatics now knows: Michele Ceccarelli and Antonio Maratea (2006) Improving Fuzzy Clustering of Biological Data by Side Information*International Journal on Approximate Reasoning :.AbstractSemi Supervised methods use a small amount of auxiliary information as a guide in the learning process in presence of unlabeled data. When using a clustering algorithm, the auxiliary information has the form of Side Information, that is a list of co-clustered points. Recent literature shows better performance of these methods with respect to totally unsupervised ones even with a small amount of Side Information. This fact suggests that the use of Semi Supervised methods may be useful especially in very difficult and noisy tasks where little a priori information is available, as is the case of data deriving from biological experiments.
http://www.scoda.unisannio.it/Papers/Publications/JAR_2006
* “Side knowledge” is informatics-speak for domain knowledge

©CMBI 2006
Cluster techniques: K-means
Simply speaking k-means clustering is an algorithm to classify or to group your objects based on attributes/features into K number of group. K is positive integer number. The grouping is done by minimizing the sum of squares of distances between data and the corresponding cluster centroid. Thus the purpose of K-mean clustering is to classify the data.
But how many clusters?
DE
C
AB
Elbow rule-of-thumb

©CMBI 2006
-0.312.40.0112.1-7.35.16…..
Cluster techniques: Neural nets
For example: self organizing maps.
Every data-point must be represented by a vector of length N. Every square in this map becomes a random vector of length N. For every data-point the in-product is calculated with every map-vector. The best fitting map-vector is averaged with 1/q times the data vector. The neighbours in the map are averaged with 1/p.q times the data vector.This is iterated N times with normalisations in between.
1/q
1/p.q
1/p.q 1/p.q
1/p.q

©CMBI 2006
Support Vector MachinesThe idea is to split a dataset in two parts, for example binding ligands in green and non-binding ones in red. The parameters P and Q describe the ligands. The SVN finds the best separating line.
Obviously this must be used in N dimensional space with an N-1 dimensional hyper plane.
I believe that a mathematical theorem exists that tells us that this still works if N is (much) bigger than the number of data points.
P
Q

©CMBI 2006
Summary
There are many ways to describe the data.There are many clustering techniques.There are many visualisation methods.
What to use depends each time on the biological question. Domain knowledge is a prerequisite for success.