cmp close contact report
TRANSCRIPT

Covid-19 Contact Management Programme (CMP)
1
Authors: Dr Ciara Carroll, Ms.Davinia O’Donnell, Dr. Jennifer Martin
Owner: Dr Sarah Doyle – Clinical Lead CMP, Medical Officer for Health (MCRN 19055)
Date Created: 23/11/20
Version: v1.1
CMP Close Contact Report
November 16th to 22nd

Covid-19 Contact Management Programme (CMP)
2
Authors: Dr Ciara Carroll, Ms.Davinia O’Donnell, Dr. Jennifer Martin
Contents Introduction ............................................................................................................3
Key Findings ............................................................................................................4
Part 1: Close contact circumstances and demographics – August 31st to November 15th ............... 4
Positivity rate by circumstances of contact ............................................................................................... 4
Positivity rate by contact demographics .................................................................................................... 4
Part 2: Close contacts created on the Covidcare Tracker week ending 22nd November .................. 4
Volume of Contacts ...................................................................................................................................... 4
Volume of Cases .......................................................................................................................................... 4
Attendance at Testing .................................................................................................................................. 4
Positivity Rates for contacts created week ending 11th October 2020 ........................................................... 4
Part 1: Close Contact Outcomes – 31st August to 15th November .............................5
Positivity Rate by Circumstances of Contact ........................................................................................... 5
Positivity Rate by Contact Age Group ....................................................................................................... 7
Positivity Rate by Gender ............................................................................................................................ 8
Part 2: Close and Complex Contacts 15th to 22nd November 2020 .......................... 14
Volume of Contacts .................................................................................................................................... 14
Complex Contacts ...................................................................................................................................... 14
Volume of Cases ........................................................................................................................................ 16
Attendance at Testing ................................................................................................................................ 16
Close Contact Positivity Rates* ................................................................................................................ 17
Close Contact Overview – 9th to 15th November .................................................................................... 18
Close Contacts per Case ................................................................................................................................ 18
Contacts by Region ........................................................................................................................................ 19
Close Contact: Demographic Details ............................................................................................................. 20
Close Contact Demographic Details .............................................................................................................. 20
Close Contacts: Circumstances and Symptoms ............................................................................................ 21
Complex Contacts Overview .................................................................................................................... 22

Covid-19 Contact Management Programme (CMP)
3
Authors: Dr Ciara Carroll, Ms.Davinia O’Donnell, Dr. Jennifer Martin
Introduction
This report is in two parts:
Part 1 provides a breakdown of positivity rates by circumstances of contact and contact demographic details for contacts created between the 31st of August and 15th of November.
Part 2 involves a more detailed analysis of close and complex contacts created on the Covidcare tracker for the week ending November 22nd.
Day 0 testing of all close contacts commenced on 19th May. Day 7 testing commenced on 28th May
(for those whose last date of exposure was 21st May). Data are provisional. Analysis is based on the
following data sources as of 3pm, 23rd November:
CovidCareTracker
Swiftqueue
Lablink
Clarifications:
Day 0 testing is arranged as soon as a Contact is informed they have been in close contact with a
confirmed case. Day 7 testing is arranged on the true seventh day from last contact with the
confirmed case where a Day 0 test was earlier than sixth day since last contact with case.
Limitations:
While attempts were made to identify alternative COVID-19 IDs for patients where data was
incomplete, it was not possible in all instances.
Acknowledgements
Contact tracing for cases and contacts on the Covidcare Tracker is a collaborative effort between staff
in the CMP and in regional Departments of Public Health.

Covid-19 Contact Management Programme (CMP)
4
Authors: Dr Ciara Carroll, Ms.Davinia O’Donnell, Dr. Jennifer Martin
Key Findings
Part 1: Close contact circumstances and demographics – August 31st to November 15th
Positivity rate by circumstances of contact
Positivity rates range are highest at 19.6% amongst household contacts, followed by transport:non-
flight related (10.8%) and social (9.0%) contacts. Transmission rates appear to be lower amongst close
contacts related to educational settings, workplaces and flights. Household contacts account for over
40% of close contacts with positive test results, with social contacts accounting for a further 15%.
Positivity rate by contact demographics
The positivity rate is highest amongst contacts aged 80 or greater (14.6%) and lowest in those aged 0
to 9 (9.8%). Positivity rate is similar between male (11.8%) and female (11.4%) contacts. The
proportion of contacts testing positive by county ranged from 7.4% in Offaly to 15.2% in Cavan.
Part 2: Close contacts created on the Covidcare Tracker week ending 22nd November
Volume of Contacts
The number of close contacts captured during the week ending November 15th was 6,490, a 12%
decrease compared to the previous week. The number of complex contacts also decreased by 12%
this week, from 1,473 to 1294.
Volume of Cases
The total number of cases managed by the Contact Management Programme for the week ending
November 22nd was 2,274, a week on week decrease of 22%.
Attendance at Testing
Of the close contacts created between 16th and 21st November, to date 85% have attended their Day
0 Test and 65% have attended their Day 7 Test.
Positivity Rates
The current positivity rates for close contacts created between the 16th and 22nd of November are
13.9% and 3.1% at day 0 and day 7 testing respectively.

Covid-19 Contact Management Programme (CMP)
5
Authors: Dr Ciara Carroll, Ms.Davinia O’Donnell, Dr. Jennifer Martin
Part 1: Close Contact Outcomes – 31st August to 15th November
This report provides an overview of the outcomes for the 92,618 close contacts created on the Covid
Care Tracker between the 31st of August and the 15th of November where lab results were available
at the time of report preparation. Definitions of the different circumstances of contact are provided
in the Appendix.
Positivity Rate by Circumstances of Contact
Total Number
of Results
Number of Positive Results
Proportion of Positive Results
Household 32648 6392 19.6%
Social 18133 1635 9.0%
Primary School 8863 308 3.5%
Workplace 5924 331 5.6%
Second Level Education 4437 131 3.0%
Early years Register 3591 185 5.2%
Transport: flight 1123 65 5.8%
Sport 1054 48 4.6%
Other Educational Setting 653 40 6.1%
Transport: non-flight 595 64 10.8%
Healthcare Setting: Patient* 293 21 7.1%
Healthcare Setting: Staff* 210 15 7.2%
Other 1851 145 7.8%
Not recorded 13885 1398 10.1%
Total 92618 10778 11.6% Table 1.1 - Positivity Rate by Circumstances

Covid-19 Contact Management Programme (CMP)
6
Authors: Dr Ciara Carroll, Ms.Davinia O’Donnell, Dr. Jennifer Martin
Figure 1.1 - Positivity Rates by Circumstances
Secondary Cases by Circumstances of Contact
Circumstances of Contact Number Proportion of Cases
Household 6392 41.9%
Social 1635 15.2%
Workplace 331 3.1%
Primary School 308 2.9%
Early years Register 185 1.7%
Second Level Education 131 1.2%
Transport: flight 65 0.6%
Transport: non-flight 64 0.6%
Sport 48 0.4%
Other Educational Setting 40 0.4%
Healthcare Setting: Patient* 21 0.2%
Healthcare Setting: Staff* 15 0.1%
Other 145 1.3%
Not recorded 1398 13.0%
Total 15264 100% Table 1.2 - Secondary Cases by Circumstances of Contact
Household
SocialPrimarySchool
Workplace
SecondLevel
Education
Earlyyears
Register
Transport:
flightSport
OtherEducati
onalSetting
Transport:non-flight
Healthcare
Setting:Patient
*
Healthcare
Setting:Staff*
OtherNot
recorded
Column2 19.60% 9.00% 3.50% 5.60% 3.00% 5.20% 5.80% 4.60% 6.10% 10.80% 7.10% 7.20% 7.80% 10.10%
0.00%
5.00%
10.00%
15.00%
20.00%
25.00%
POSITIVE RESULTS BY CIRCUMSTANCES (%)

Covid-19 Contact Management Programme (CMP)
7
Authors: Dr Ciara Carroll, Ms.Davinia O’Donnell, Dr. Jennifer Martin
Figure 1.2 - Secondary Cases by Circumstances of Contact
Positivity Rate by Contact Age Group
Age Group Total Number of
Results Number of Positive
Results Proportion of
Positive Results 0 to 9 16964 1656 9.8%
10 to 19 20472 2356 11.5%
20 to 29 16652 2099 12.6%
30 to 39 10715 1228 11.5%
40 to 49 10109 1197 11.8%
50 to 59 9808 1174 12.0%
60 to 69 5131 683 13.3%
70 to 79 2066 283 13.7%
80+ 701 102 14.6%
Total 92618 10778 11.6% Table 1.3 - Positivity Rate by Age Group
1398
145
15
21
40
48
64
65
131
185
308
331
1635
6392
Not recorded
Other
Healthcare Setting: Staff*
Healthcare Setting: Patient*
Other Educational Setting
Sport
Transport: non-flight
Transport: flight
Second Level Education
Early years Register
Primary School
Workplace
Social
Household
0 1000 2000 3000 4000 5000 6000 7000
NUMBER OF SECONDARY CASES BY CIRCUMSTANCES OF CONTACT

Covid-19 Contact Management Programme (CMP)
8
Authors: Dr Ciara Carroll, Ms.Davinia O’Donnell, Dr. Jennifer Martin
Figure 1.3- Proportion of Positive Results by Age Group
Positivity Rate by Gender
Gender Total Number of Results Number of
Positive Results Proportion of Positive Results
(95% Confidence Interval)
Female 46826 5341 11.4% Male 45668 5424 11.8% Other 124 13 10.5% Total 92618 10778 11.6%
Table 1.4 -Positivity Rate by Gender
Figure 1.4 - Positive Results by Gender with 95% Confidence Intervals
0.00%
2.00%
4.00%
6.00%
8.00%
10.00%
12.00%
14.00%
16.00%
0 to 9 10 to 19 20 to 29 30 to 39 40 to 49 50 to 59 60 to 69 70 to 79 80+ Total
POSITIVE RESULTS BY AGE GROUP (%)
9.50% 10.00% 10.50% 11.00% 11.50% 12.00%
Fem…
Male
Other
POSITIVE RESULTS BY GENDER (%)

Covid-19 Contact Management Programme (CMP)
9
Authors: Dr Ciara Carroll, Ms.Davinia O’Donnell, Dr. Jennifer Martin
Proportion of Secondary Cases by Age Group and Gender
Female Male Other Total
Number % Number % Number % Number %
0 to 9 845 15.8% 809 14.9% 2 15.4% 1656 15.4%
10 to 19 1109 20.8% 1239 22.8% 8 61.5% 2356 21.9%
20 to 29 995 18.6% 1104 20.3% 0 0.0% 2099 19.5%
30 to 39 635 11.9% 590 10.9% 3 23.1% 1228 11.4%
40 to 49 623 11.7% 574 10.6% 0 0.0% 1197 11.1%
50 to 59 596 11.2% 578 10.7% 0 0.0% 1174 10.9%
60 to 69 331 6.2% 352 6.5% 0 0.0% 683 6.3%
70 to 79 145 2.7% 138 2.5% 0 0.0% 283 2.6%
80+ 52 1.2% 42 0.8% 0 0.0% 104 1.0% Table 1.5 - Secondary Cases by Age Group and Gender
Figure 1.5 - Secondary Cases by Age Group and Gender
0
500
1000
1500
2000
2500
0 to 9 10 to 19 20 to 29 30 to 39 40 to 49 50 to 59 60 to 69 70 to 79 80+
NUMBER OF CASES BY AGE GROUP AND GENDER
Other
Male
Female

Covid-19 Contact Management Programme (CMP)
10
Authors: Dr Ciara Carroll, Ms.Davinia O’Donnell, Dr. Jennifer Martin
Positivity Rate by County
County Total Number of
Contacts with Results Number of Positive
Results Proportion of Positive
Results Carlow 748 98 13.1%
Cavan 2215 337 15.2%
Clare 2782 253 9.1%
Cork 9711 1296 13.3%
Donegal 3759 466 12.4%
Dublin 27865 3507 12.6%
Galway 5247 527 10.0%
Kerry 1932 228 11.8%
Kildare 3774 406 10.8%
Kilkenny 1040 135 13.0%
Laois 1491 143 9.6%
Leitrim 353 35 9.9%
Limerick 4651 463 10.0%
Longford 916 78 8.5%
Louth 2134 275 12.9%
Mayo 1832 182 9.9%
Meath 4325 564 13.0%
Monaghan 1356 193 14.2%
Offaly 1796 133 7.4%
Roscommon 1260 145 11.5%
Sligo 1033 129 12.5%
Tipperary 1590 151 9.5%
Waterford 1655 231 14.0%
Westmeath 2249 211 9.4%
Wexford 1745 181 10.4%
Wicklow 2194 196 8.9%
Not Recorded 2965 215 7.3%
Total 92618 10778 11.6% Table 1.6- Positivity Rate by County

Covid-19 Contact Management Programme (CMP)
11
Authors: Dr Ciara Carroll, Ms.Davinia O’Donnell, Dr. Jennifer Martin
Figure 1.6 - Contact Results by County of Residence
0.00% 2.00% 4.00% 6.00% 8.00% 10.00% 12.00% 14.00% 16.00%
Total
Not Recorded
Wicklow
Wexford
Westmeath
Waterford
Tipperary
Sligo
Roscommon
Offaly
Monaghan
Meath
Mayo
Louth
Longford
Limerick
Leitrim
Laois
Kilkenny
Kildare
Kerry
Galway
Dublin
Donegal
Cork
Clare
Cavan
Carlow
POSITIVE RESULTS BY COUNTY (%)
Positivity Rate
Covid-19 Contact Management Programme (CMP)
12
Authors: Dr Ciara Carroll, Ms.Davinia O’Donnell, Dr. Jennifer Martin
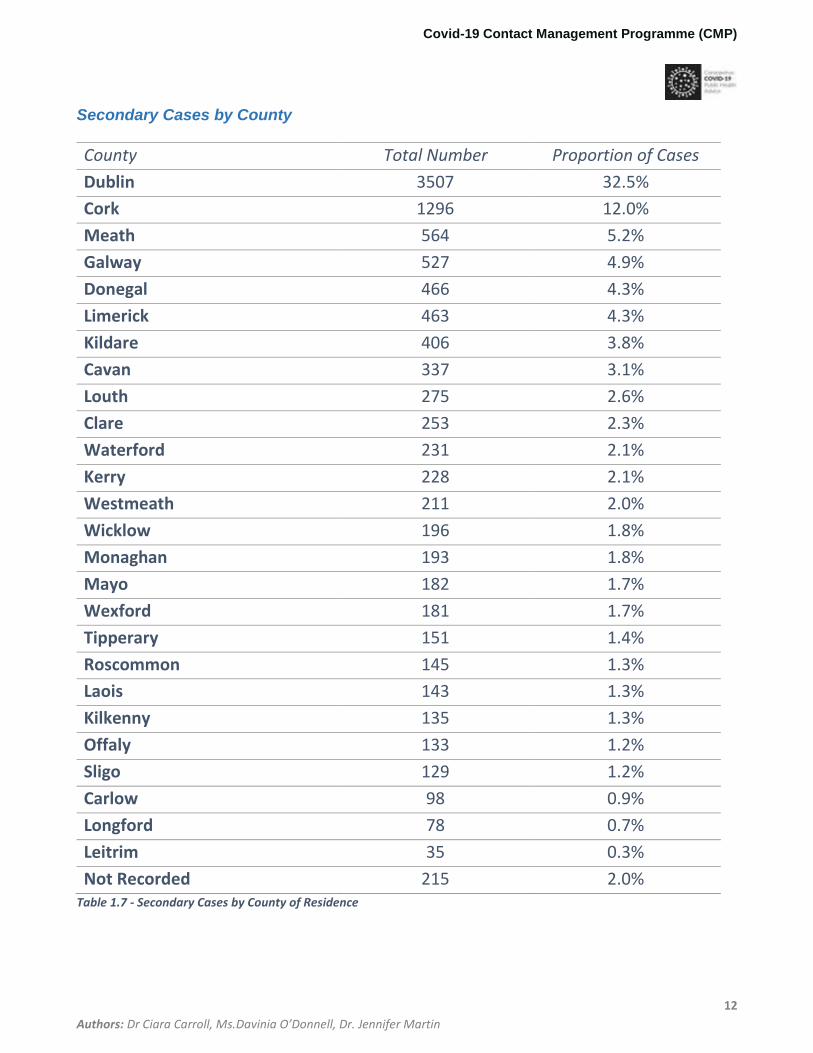
Secondary Cases by County
County Total Number Proportion of Cases
Dublin 3507 32.5%
Cork 1296 12.0%
Meath 564 5.2%
Galway 527 4.9%
Donegal 466 4.3%
Limerick 463 4.3%
Kildare 406 3.8%
Cavan 337 3.1%
Louth 275 2.6%
Clare 253 2.3%
Waterford 231 2.1%
Kerry 228 2.1%
Westmeath 211 2.0%
Wicklow 196 1.8%
Monaghan 193 1.8%
Mayo 182 1.7%
Wexford 181 1.7%
Tipperary 151 1.4%
Roscommon 145 1.3%
Laois 143 1.3%
Kilkenny 135 1.3%
Offaly 133 1.2%
Sligo 129 1.2%
Carlow 98 0.9%
Longford 78 0.7%
Leitrim 35 0.3%
Not Recorded 215 2.0% Table 1.7 - Secondary Cases by County of Residence

Covid-19 Contact Management Programme (CMP)
13
Authors: Dr Ciara Carroll, Ms.Davinia O’Donnell, Dr. Jennifer Martin
Figure 1.7 - Secondary Cases by County of Residence
0 500 1000 1500 2000 2500 3000 3500 4000
Not Recorded
Leitrim
Longford
Carlow
Sligo
Offaly
Kilkenny
Laois
Roscommon
Tipperary
Wexford
Mayo
Monaghan
Wicklow
Westmeath
Kerry
Waterford
Clare
Louth
Cavan
Kildare
Limerick
Donegal
Galway
Meath
Cork
Dublin
NUMBER OF CASES BY COUNTY OF RESIDENCE

Covid-19 Contact Management Programme (CMP)
14
Authors: Dr Ciara Carroll, Ms.Davinia O’Donnell, Dr. Jennifer Martin
Part 2: Close and Complex Contacts 15th to 22nd November 2020
Volume of Contacts
The number of close contacts captured during the week ending November 15th was 6,490, a 12%
decrease compared to the previous week. To date, 94% of these contacts have been successfully
informed of their close contact status. The number of complex contacts* also decreased by 12% this
week, from 1,473 to 1294.
*Note: a complex contact is created when a case has been in contact with a setting or group of people during their
infectious period. Individual close contacts arising from these complex episodes of contact are included in analysis of close
contacts. Further definitions for close and complex contacts are provided in the appendix.
Figure 2.1 - Close and Complex Contact Numbers
Complex Contacts
The number of nursing homes captured as complex contacts decreased by 54% to 98. A 5% decrease
was also seen in the number of hospital-related contact episodes.
WE30/08
WE06/09
WE13/09
WE20/09
WE27/09
WE04/10
WE11/10
WE18/10
WE25/10
WE01/11
WE08/11
WE15/11
WE22/11
Close Contacts 3854 4203 7183 8887 10587 11614 15224 19337 21131 11099 7415 7374 6490
Complex Contacts 350 487 660 905 1226 1565 1926 2281 2250 1477 1262 1473 1294
0
5000
10000
15000
20000
25000
Total Number of Contacts by Week

Covid-19 Contact Management Programme (CMP)
15
Authors: Dr Ciara Carroll, Ms.Davinia O’Donnell, Dr. Jennifer Martin
Figure 2.2 - Reason for Complexity
Social VenueEducational
Institute
PotentialOutbreak in
Another SettingHospital Flight Nursing Home
WE 27/09 324 229 424 57 21 32
WE 04/10 274 315 685 101 64 86
WE 11/10 382 314 822 126 33 123
WE 18/10 343 583 938 150 21 72
WE 25/10 207 681 838 244 25 119
WE 01/11 82 350 408 280 50 140
WE 08/11 42 215 319 377 47 145
WE 15/11 54 265 358 402 57 211
WE 22/11 28 266 378 383 36 98
0
100
200
300
400
500
600
700
800
900
1000
Reason for Complexity

Covid-19 Contact Management Programme (CMP)
16
Authors: Dr Ciara Carroll, Ms.Davinia O’Donnell, Dr. Jennifer Martin
Volume of Cases
The total number of cases managed by the Contact Management Programme for the week ending
November 22nd was 2,274, a week on week decrease of 22%. This represents 94% of the cases
reported via the CCT during this period.
Figure 2.3 - Volume of Cases Managed using CCT
Attendance at Testing
Of the close contacts created between 16th and 21st November, to date 85% have attended their Day
0 Test and 65% have attended their Day 7 Test.
Figure 2.4 - Close Contact Attendance Rates at Day and Day 7 Tests
WE 2709 WE 0410 WE 1110 WE 1810 WE 2510 WE 0111 WE 0811 WE 1511 WE 2211
Number of Cases 2225 3222 4408 4969 7356 4182 3168 2930 2274
0
1000
2000
3000
4000
5000
6000
7000
8000
Number of Cases Managed by CMP by Week
8083 83 83
8381
85 84 85
85
5658
63
55
6675 80 79
73 65
30
40
50
60
70
80
90
WE 2009 WE 2709 WE 0410 WE 1110 WE 1810 WE 2510 WE 0111 WE 0811 WE 1511 WE 2211
TEST ATTENDANCE RATES
Day 0 Day 7
Covid-19 Contact Management Programme (CMP)
17
Authors: Dr Ciara Carroll, Ms.Davinia O’Donnell, Dr. Jennifer Martin
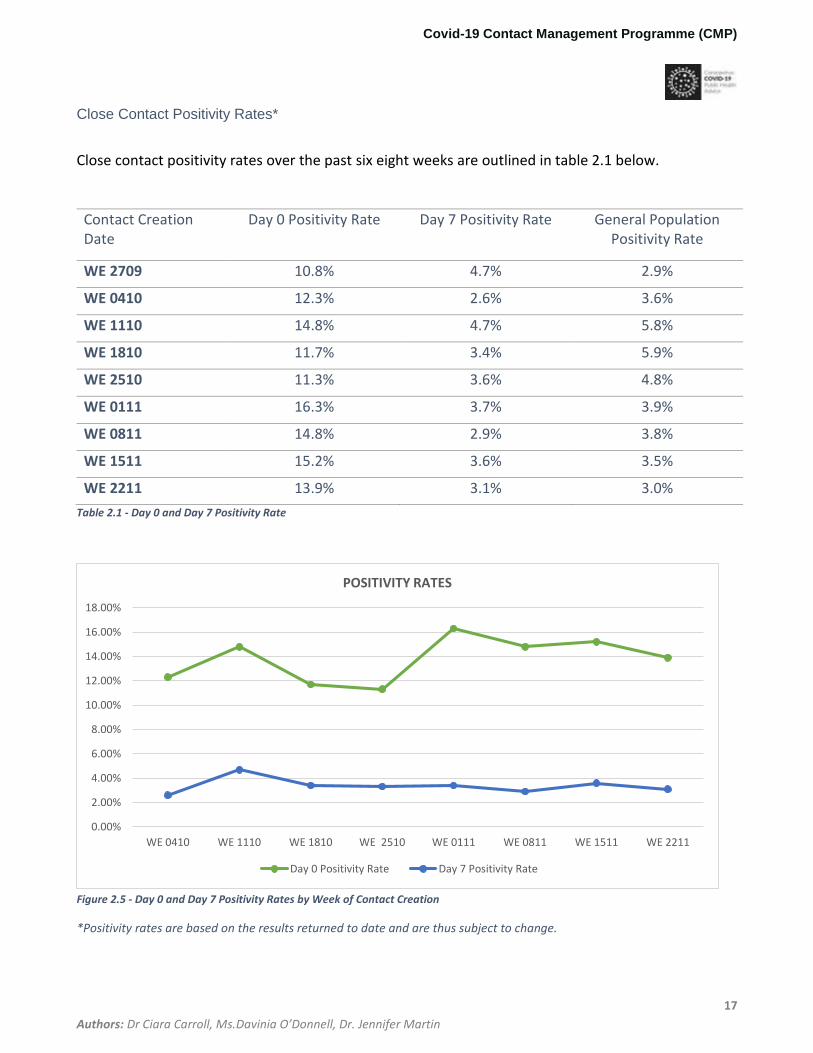
Close Contact Positivity Rates*
Close contact positivity rates over the past six eight weeks are outlined in table 2.1 below.
Contact Creation Date
Day 0 Positivity Rate Day 7 Positivity Rate General Population Positivity Rate
WE 2709 10.8% 4.7% 2.9%
WE 0410 12.3% 2.6% 3.6%
WE 1110 14.8% 4.7% 5.8%
WE 1810 11.7% 3.4% 5.9%
WE 2510 11.3% 3.6% 4.8%
WE 0111 16.3% 3.7% 3.9%
WE 0811 14.8% 2.9% 3.8%
WE 1511 15.2% 3.6% 3.5%
WE 2211 13.9% 3.1% 3.0%
Table 2.1 - Day 0 and Day 7 Positivity Rate
Figure 2.5 - Day 0 and Day 7 Positivity Rates by Week of Contact Creation
*Positivity rates are based on the results returned to date and are thus subject to change.
0.00%
2.00%
4.00%
6.00%
8.00%
10.00%
12.00%
14.00%
16.00%
18.00%
WE 0410 WE 1110 WE 1810 WE 2510 WE 0111 WE 0811 WE 1511 WE 2211
POSITIVITY RATES
Day 0 Positivity Rate Day 7 Positivity Rate

Covid-19 Contact Management Programme (CMP)
18
Authors: Dr Ciara Carroll, Ms.Davinia O’Donnell, Dr. Claire Buckley ,Dr Jennifer Martin
Close Contact Overview – 9th to 15th November
Tables 2.2 to 2.6 and figures 2.7 to 2.10 below provide more detailed illustration of numbers,
geographic location, circumstances and symptomatic status of close contacts.
Figure 2.6 - Close Contacts per Case
Close Contacts per Case
The mean and median number of close contacts per case recorded on the CCT for the last week, is
outlined, below.
Week Median Mean 16/11/2020 2.0 3.8
17/11/2020 3.0 3.8 18/11/2020 3.0 3.8
19/11/2020 3.0 3.9 20/11/2020 3.0 4.0
21/11/2020 3.0 3.5
22/11/2020 3.0 3.9 Table 2.2 - Median and Mean Close Contacts per Case

Covid-19 Contact Management Programme (CMP)
19
Authors: Dr Ciara Carroll, Ms.Davinia O’Donnell, Dr. Claire Buckley ,Dr Jennifer Martin
Contacts by Region
Region No. of Close Contacts
East 2078
Midlands 207 Midwest 742
Northeast 781 Northwest 501
South 926 Southeast 509
West 496
Not Recorded 250 Total 6490
Table 2.3 - Contacts by Region
Figure 2.7 - Close Contacts by Region
0 500 1000 1500 2000 2500
Not Recorded
West
Southeast
South
Northwest
Northeast
Midwest
Midlands
East
Close Contacts by Region

Covid-19 Contact Management Programme (CMP)
20
Authors: Dr Ciara Carroll, Ms.Davinia O’Donnell, Dr. Claire Buckley ,Dr Jennifer Martin
Close Contact: Demographic Details
Age Group Female Male Other Not Recorded Total 0-9 362 385 2 27 776
10-19 662 577 0 39 1278 20-29 506 469 2 25 1002
30-39 412 353 2 27 794 40-49 395 377 0 23 795
50-59 344 322 0 20 686
60-69 201 201 0 7 409 70-79 65 89 0 8 162
80+ 46 36 0 3 85 Not Recorded 174 183 3 143 503
Total 3167 2992 9 322 6490 Table 2.4 - Age and Gender of Close Contacts
Close Contact Demographic Details
Figure 2.8 - Breakdown of Close Contacts by Age and Gender
0
200
400
600
800
1000
1200
1400
0-9 10-19. 20-29 30-39 40-49 50-59 60-69 70-79 80-89 NotRecorded
Close Contact Demogragphic Details
Female Male Other Not Recorded

Covid-19 Contact Management Programme (CMP)
21
Authors: Dr Ciara Carroll, Ms.Davinia O’Donnell, Dr. Claire Buckley ,Dr Jennifer Martin
Close Contacts: Circumstances and Symptoms
Circumstances and Symptoms
Circumstance
Symptoms
Total Symptomatic Asymptomatic
Unable To Verify
Not Recorded
Household 535 2383 150 48 3116
Social: other 139 561 37 33 770
Social contact with extended family
105 581 31 9 726
Workplace 43 321 19 17 400
Healthcare Setting: Patient
7 65 11 0 83
Transport: other 10 53 1 2 66
Healthcare Setting: Staff
9 39 1 0 49
Third level education 12 31 1 1 45
Secondary level education
2 13 0 0 15
Sport Outdoor activity
3 8 0 0 11
Restaurant/café 1 6 1 3 11
Transport: flight 0 7 1 0 8
Pre-school 0 5 2 0 7
Primary school 1 4 0 1 6
Special school 0 4 0 0 4
Sport Indoor activity 1 0 0 0 1
Other 18 89 10 1 118
Not Recorded 144 789 94 27 1054
Total 1030 4959 359 142 6490
Table 2.5 - Contact Circumstances and Symptoms

Covid-19 Contact Management Programme (CMP)
22
Authors: Dr Ciara Carroll, Ms.Davinia O’Donnell, Dr. Claire Buckley ,Dr Jennifer Martin
Figure 2.9 - Circumstances of Contact
Complex Contacts Overview
Reason for Complexity Number Hospital 383 Potential outbreak in another setting 378
Educational Institute 266 Nursing Home 98
Flight 36
Public transport 35 Other Residential Care Setting 32
Social Venue 28 Home Help Services 22
Member of the Traveller Community 6
Asylum Seeker Accommodation 4 Homeless Accommodation 3
Prison 3 Total 1294
Table 2.6 - Reason for Complexity
0 500 1000 1500 2000 2500 3000 3500
Other
Not Recorded
Transport
Educational Setting
Healthcare Related
Workplace
Social
Household
Circumstances of Contact with Symptom Status
Symptomatic Asymptomatic Unable To Verify Not Recorded

Covid-19 Contact Management Programme (CMP)
23
Authors: Dr Ciara Carroll, Ms.Davinia O’Donnell, Dr. Claire Buckley ,Dr Jennifer Martin
Figure 2.10 - Complex Contact Reason for Complexity
Data are provisional - Some close contacts are managed off the CCT.
0 50 100 150 200 250 300 350 400 450
Homeless Accommodation
Prison
Asylum Seeker Accommodation
Member of the Traveller Community
Home Help Services
Social Venue
Other Residential Care Setting
Public transport
Flight
Nursing Home
Educational Institute
Potential outbreak in another setting
Hospital
Reason for Complexity

Covid-19 Contact Management Programme (CMP)
24
Authors: Dr Ciara Carroll, Ms.Davinia O’Donnell, Dr. Claire Buckley ,Dr Jennifer Martin
Appendix: Contact Definitions
Close Contacts
Close Contacts are defined as:
Any person that the case has been in face to face contact for longer than 15
minutes in any setting.
Any person who shared a closed space for longer than 2 hours.
Contact tracers select one of the following circumstances of contact:
Household contacts are defined as living or sleeping in the same house,
individuals in shared accommodation sharing kitchen and bathroom facilities
and sexual partners.
Workplace contacts are close contacts from the workplace.
Social contacts include close contacts from the extended family, close contacts
in restaurants, cafés and public houses, and other social contacts.
Sport contacts include close contacts from sporting and recreational activities.
Primary School contacts include staff and students in primary schools.
Second Level Education contacts include staff and students in second level
schools.
Early years register contacts include staff and students in crèches and pre-
schools.
Other Educational Setting contacts include close contacts from third-level
institutes and universities, English language schools and special schools.
Transport: flight contacts are close contacts from flights.
Transport: non-flight contacts include close contacts from public transport, taxis
and cars.
Healthcare Setting: Patient are close contacts who were patients in healthcare
settings where the contact has only occurred in that setting. Most patients in
healthcare settings are managed off the CCT by Infection Prevention & Control.
Healthcare Setting: Staff are close contacts who work in healthcare settings and
the contact was limited to those settings. Most staff in healthcare settings are
managed off the CCT by Occupational Health.
Other: these are close contacts where the circumstances of contact are known
but not included in one of the categories above.

Covid-19 Contact Management Programme (CMP)
25
Authors: Dr Ciara Carroll, Ms.Davinia O’Donnell, Dr. Claire Buckley ,Dr Jennifer Martin
Not recorded: no circumstances of contact recorded
Complex Contacts
A complex contact is a situation where the contact is not a known named individual
but relates to, for example, a congregate setting where an individual could be called
and a list of contacts constructed.
Contact tracers select one of the following reasons for complexity:
Hospital: case has been a patient, member of staff or visitor to a hospital during
their infectious period.
Nursing home: case is a resident, member of staff or has visited a nursing home
during their infectious period.
Other Residential Care Setting: case is a resident, member of staff or has visited
a residential care setting that is not a nursing home during their infectious
period.
Flight: the case was on a flight (as staff or as a passenger) during their infectious
period.
Homeless Accommodation/hostel: case is a resident or member of staff in
homeless accommodation.
Asylum Seeker Accommodation (Direct Provision Centre): case is a resident or
member of staff in asylum seeker accommodation.
Prison: case was an inmate or worked in a prison during their infectious period.
Public transport: case used public transport during their infectious period.
Social Venue: case attended or worked in a social venue such as a restaurant,
cinema or bar during their infectious period.
Member of the Traveller Community: case is a resident in a halting site or a
member of the Traveller community.
Educational Institute: case attended or worked in a crèche, school, university or
other educational setting during their infectious period.
Home Help Services: case interacted with or provided home help services during
their infectious period.
Member of Roma Community: case is a member of the Roma community.

Covid-19 Contact Management Programme (CMP)
26
Authors: Dr Ciara Carroll, Ms.Davinia O’Donnell, Dr. Claire Buckley ,Dr Jennifer Martin
Potential outbreak in another setting: case worked in or attended a setting that is not included in the list above during their infectious period. These include hairdressers and beauty salons and food production factories.
Ends.