cms stats 2015 final 2 · administrator and cms chief medical officer ......
TRANSCRIPT

2015 CMS
Statistics
59720148
US DEPARTMENT OF
HEALTH AND HUMAN SERVICES
US Department of Health amp Human Services
Sylvia Mathews Burwell Secretary
Centers for Medicare amp Medicaid Services
Andrew Slavitt Acting Administrator
Patrick Conway MD Acting Principal Deputy Administrator and CMS Chief Medical Officer
Mandy Cohen Chief Operating Officer and Chief of Staff
Office of Enterprise Data and Analytics
Niall Brennan Director amp CMS Chief Data Officer
Christine Cox Deputy Director
Information Products Group
Christopher Powers Director
Publication Coordinators
Maria Diacogiannis Tony Dean Publication Staff Wendy Hildt
Press inquiries should be directed to the CMS Media Relations Group (202) 690-6145 or presscmshhsgov
National health expenditure inquiries cmsdnhscmshhsgov Data availability httpswwwcmsgovResearch-Statistics-Data-and-SystemsStatistics-Trends-and-ReportsCMS-Statistics-Reference-Bookletindexhtml Submit questions on this publication httpsquestionscmsgov
Preface This reference booklet provides significant summary information about health expenditures and Centers for Medicare amp Medicaid Services (CMS) programs The information presented was the most current available at the time of publication and may not always reflect changes due to recent legislation Significant time lags may occur between the end of a data year and aggregation of data for that year Similar reported statistics may differ because of differences in sources andor methodology
The data are organized as follows
Page
Highlights - Growth in CMS Programs and Health Expenditures 1
I Populations 5
II ProvidersSuppliers 19
III Expenditures 25
IV Utilization 35
V AdministrativeOperating 43
Reference 49
i
AFDC
BETOS
CAHs
CBC
CCPs
CHIP
CM
CMCS
CMS
DHHS
DME MACs
DME
DMEPOS
ESRD
FFS
ii
Glossary of Acronyms
Aid to Families with Dependent Children
Berenson-Eggers Type of Service
Critical Access Hospitals
Community-Based Care
Coordinated Care Plans
Childrenrsquos Health Insurance Program
Center for Medicare
Center for Medicaid and CHIP Services
Centers for Medicare amp Medicaid Services
Department of Health amp Human Services
DME Medicare Administrative Contractors
Durable Medical Equipment
Durable Medical Equipment Prosthetics Orthotics and Supplies
End Stage Renal Disease
Fee-For-Service
Glossary of Acronyms (continued)
GDP Gross Domestic Product
HCPP Health Care Prepayment Plan
HI Hospital Insurance (Part A)
HIT Health Information Technology
HMO Health Maintenance Organization
ICFIID Intermediate Care Facility for Individuals with Intellectual Disabilities ICF-MR Intermediate Care Facility for Mentally Retarded IPAB Independent Payment Advisory
Board MA Medicare Advantage MACs Medicare Administrative Contractors MA-PD Medicare Advantage Prescription Drug Plans MEDPAR Medicare Provider Analysis and
Review MIF Medicare Improvement Fund MSA Medical Savings Account
MSIS Medicaid Statistical Information System
iii
NF Nursing Facility NHE National Health Expenditures OACT Office of the Actuary PACE Program of All-Inclusive Care for the Elderly PCCM Primary Care Case Management PDP Prescription Drug Plan PFFS Private Fee for Service Plans PHP Prepaid Health Plans PPS Prospective Payment System QIO Quality Improvement Organization RDS Retiree Drug Subsidy RPPOs Regional Preferred Provider Organizations SMI Supplementary Medical Insurance (Part B) SNF Skilled Nursing Facility SSA Social Security Administration TANF Temporary Assistance for Needy Families VA Veteranrsquos Affairs
Glossary of Acronyms (continued)
iv
Highlights Growth in CMS programs and health expenditures
Populations
Persons enrolled for Medicare coverage increased from 191 million in 1966 to a projected 558 million in 2015 a 192 percent increase (I1)
Medicare enrollees with end-stage renal disease increased from 1100 thousand in 1985 to 4969 thousand in 2014 an increase of 352 percent (I5)
By 2014 over 377 million Medicare enrollees had Part D drug coverage 697 percent of all enrollees and an additional 27 million had RDS (I10 ampI12)
On average the number of Medicaid monthly enrollees in 2015 is estimated to be about 689 million the largest group being children (296 million or 430 percent) (I16)
In 2012 23 percent of the population was at some point enrolled in the Medicaid program (I18)
1
Medicare State buy-ins have grown from about 28 million beneficiaries in 1975 to 93 million beneficiaries in 2014 an increase of about 232 percent (I19)
ProvidersSuppliers
The number of inpatient hospital facilities decreased from 6522 in December 1990 to 6142 in December 2014 Total inpatient hospital beds have dropped from 328 beds per 1000 enrolled in 1990 to 173 in 2014 a decrease of 47 percent (II1)
The total number of Medicare certified beds in short-stay hospitals has decreased to about 784000 in 2014 from 970000 in 1990 The average number of short-stay hospital beds per 1000 enrolled in 2014 is 146 down from 288 in 1990 (II1)
The number of hospice facilities increased from 772 in 1990 to 4140 in 2014 (II5)
The number of participating home health agencies has fluctuated considerably over the years almost doubling in number from 1990 to almost 11000 in 1997 when the Balanced Budget Act was passed The number decreased sharply but has since stabilized reaching 12268 in 2014 (II5 amp II6)
2
Expenditures
In fiscal year 2014 total net Federal outlays for CMS programs were $8158 billion 233 percent of the Federal budget (III1)
Medicare Part A benefit payments are projected to increase to $2681 billion for fiscal year 2015 up from $2618 billion for fiscal year 2014 and Medicare Part B benefit payments are projected to increase to $2729 billion for fiscal year 2015 up from $2566 billion for fiscal year 2014 (III5)
Medicare hospice benefit payments are projected to be $161 billion for fiscal year 2015 down from $168 billion in 2014 (III6)
National health expenditures (NHE) were $29191 billion in calendar year 2013 comprising 174 percent of the gross domestic product (GDP) Comparably NHE amounted to $7243 billion or 121 percent of the GDP in calendar year 1990 NHE per person were $147 in calendar year 1960 and grew steadily to reach $9255 by calendar year 2013 (III7)
Utilization of Medicare and Medicaid services
Between 1990 and 2014 the number of short-stay hospital discharges per 1000 enrollees decreased from 320 to 280 a decrease of 13 percent (IV1)
The PPS short-stay hospital average length of stay decreased significantly from 90 days in 1990 to 50 days in 2014 a decrease of 44 percent (IV3)
3
The ratio of Medicare aged users of any type of covered service has grown from 528 per 1000 enrolled in 1975 to 890 per 1000 enrolled in 2014 (IV4)
About 339 million persons received a reimbursed service under Medicare fee-for-service during 2014 Comparably almost 633 million persons used Medicaid services or had a premium paid on their behalf in 2012 (IV6a amp IV9)
64 million persons received reimbursable fee-for-service inpatient hospital services under Medicare in 2014 (IV6a)
327 million persons received reimbursable fee-for-services physician services under Medicare during 2014 428 million persons received reimbursable physician services under Medicaid during 2012 (IV6a amp IV9)
251 million persons received reimbursable fee-for-service outpatient hospital services under Medicare during 2014 During 2012 263 million persons received Medicaid reimbursable outpatient hospital services (IV6a amp IV9)
Over 18 million persons received care in SNFs covered by Medicare during 2014 14 million persons received care in nursing facilities which include SNFs and all other nursing facilities excluding ICFIID covered by Medicaid during 2012 (IV6a amp IV9)
Over 38 million persons received prescribed drugs under Medicaid during 2012 (IV9)
4
Populations
Information about persons covered by Medicare Medicaid or CHIP
For Medicare statistics are based on persons enrolled for coverage Original Medicare enrollees are also referred to as fee-for-service enrollees Historically for Medicaid recipient (beneficiary) counts were used as a surrogate of persons eligible for coverage as well as for persons utilizing services Current data systems now allow the reporting of total eligibles for Medicaid and for Childrenrsquos Health Insurance Program (CHIP) Statistics are available by major program categories by demographic and geographic variables and as proportions of the US population Utilization data organized by persons served may be found in the Utilization section
5
Table I1 Medicare EnrollmentTrends
Total Aged Disabled Persons Persons Persons
July In millions 1966 191 191 --1970 204 204 --1975 249 227 22 1980 284 255 30 1985 311 281 29 1990 343 310 33 1995 376 332 44
Average monthly 2000 397 343 54 2005 426 358 68 2010 477 396 81 2012 509 422 87 2013 525 436 88 2014 538 449 89 2015 558 468 91
NOTES Represents those enrolled in HI (Part A) andor SMI (Part B and Part D) of Medicare Data for 1966-1995 are as of July Data for calendar years 2000-2015 represent average actual or projected monthly enrollment Numbers may not add to totals because of rounding Based on 2015 Trustees Report
SOURCE CMS Office of the Actuary
Table I2 Medicare EnrollmentCoverage
HI andor SMI HI P
SMI
art B Part D
HI and SMI
HI Only
SMI Only
In millions
All persons
Aged persons
Disabled persons
553
463
90
550
460
90
504
422
82
415
--
--
501
419
82
49
41
08
03
03
00 NOTES Projected average monthly enrollment during fiscal year 2015 Ageddisabled split of Part D enrollment not available Based on 2015 Trustees Report Numbers may not add to totals because of rounding
SOURCE CMS Office of the Actuary
6
Table I3 Medicare EnrollmentDemographics
Total Male Female In thousands
All persons 54096 24560 29536 Aged 45312 20019 25293 65-74 years 25124 11828 13295 75-84 years 13723 5981 7743 85 years and over 6465 2210 4255Disabled 8783 4541 4243 Under 45 years 1929 1035 894 45-54 years 2467 1265 1203 55-64 years 4386 2240 2146 White 40904 18536 22368 Black 5565 2401 3164 All Other 7116 3289 3826 Native American 243 108 134 AsianPacific 1616 725 892 Hispanic 4798 2230 2567 Other 459 226 233
Unknown Race 511 333 178 NOTES Person-year enrollee counts for 2014 Numbers may not add to totals because of round-ing Race information is based on Research Triangle Institute (RTI) race codes
SOURCE CMS Office of Enterprise Data and Analytics
Table I4 Medicare Part D EnrollmentDemographics
Total Male Female In thousands
All persons 37721 15938 21783
Aged 65-74 years 16543 7156 9387 75-84 years 9992 4087 5905 85 years and over 4555 1406 3150
Disabled Under 45 years 1572 823 750 45-54 years 1887 948 939 55-64 years 3171 1518 1653 NOTES Person-year enrollee counts for 2014 as reported in the CMS Chronic Conditions Data Warehouse Totals may not add because of rounding
SOURCE CMS Office of Enterprise Data and Analytics
7
Table I5 Medicare ESRD EnrollmentTrends
HI andor SMI HI SMI
In thousands Year 1985 1100 1091 1065 1990 1721 1706 1637 1995 2557 2536 2438 2000 2909 2904 2728 2005 3699 3698 3516 2010 4369 4368 4161 2014 4969 4938 4725
NOTE Data as of July 1 for years 1985-2010 Enrollee counts for 2014 are determined using a person-year methodology
SOURCE CMS Office of Enterprise Data and Analytics
Table I6 Medicare ESRD EnrollmentDemographics
Number of Enrollees (in thousands)
All persons 5475 Age Under 35 years 245 35-44 years 405 45-64 years 2106 65 years and over 2719
Sex Male 3121 Female 2354
Race White 2323 Black 1841
Other 1270 Unknown 41
NOTES CMS Chronic Conditions Data Warehouse Represents persons with ESRD ever enrolled during calendar year 2014
SOURCE CMS Office of Enterprise Data and Analytics
8
Table I7 Medicare Advantage Cost PACE Demo amp Prescription Drug
Number of MA only Drug Plan Total Contracts (Enrollees in thousands)
Total prepaid1 741 2094 15600 17694 Local CCPs 507 1543 13598 15140 PFFS 8 78 177 254 1876 Cost 16 297 269 566
1833 Cost (HCPP) 9 51 -- 51 PACE 117 -- 33 33 Other plans2 84 126 1524 1650
Total PDPs1 76 -- 24180 24180 Total 817 2094 39781 41875 1Totals include beneficiaries enrolled in employerunion-only group plans (contracts with 800 series plan IDs) Where a beneficiary is enrolled in both an 1876 cost or PFFS plan and a PDP plan both enrollments are reflected in these counts 2Includes MSA Pilot Medicare-Medicaid Plans and RPPOs
NOTE Data as of October 2015
SOURCE CMS Center for Medicare
Table I8 Medicare EnrollmentCMS Region
Enrollees as Resident Medicare Percent
Population1 Enrollees2 of Population
In thousands
All regions 318857 52882 166 Boston 14681 2699 184 New York 28684 4753 166 Philadelphia 30535 5385 176 Atlanta 63573 11535 181
Chicago 52196 9034 173 Dallas 40537 5903 146 Kansas City 13956 2459 176 Denver 11499 1644 143 San Francisco 49793 7246 146 Seattle 13403 2225 166 1Preliminary annual estimate July 1 2014 resident population 2Medicare enrollment data for 2014 are determined using a person-year methodology Excludes beneficiaries living in territories possessions foreign countries or with residence unknown
NOTES Resident population is a provisional estimate based on 50 States and the District of Columbia Numbers may not add to totals because of rounding For regional breakouts see Reference section SOURCES CMS Office of Enterprise Data and Analytics US Bureau of the Census Population Estimates Branch
9
Table I9 Medicare Enrollment by Health DeliveryCMS Region
MA and Other Total Original Medicare Health Plan
Enrollees Enrollees Enrollees
In thousands All regions 54096 37665 16430 Boston 2699 2142 558 New York 5520 3564 1956 Philadelphia 5385 3952 1432 Atlanta 11535 8009 3525 Chicago 9034 6199 2836 Dallas 5903 4298 1604 Kansas City 2459 1974 485 Denver 1644 1178 466 San Francisco 7267 4447 2820 Seattle 2225 1481 743 NOTES Person-year enrollee counts for 2014 Totals may not add because of rounding Foreign residents and unknowns are not included in the regions but included in the total figure
SOURCE CMS Office of Enterprise Data and Analytics
Table I9a Medicare Enrollment by Health DeliveryDemographics
Original MA and Other Total Medicare Health Plans
In thousands All persons 54096 37665 16430 Aged 45312 31038 14274 65-74 years 25124 17279 7844 75-84 years 13723 9119 4604 85 years and over 6465 4640 1825 Disabled 8783 6627 2156 Under 45 years 1929 1612 317 45-54 years 2467 1902 566 55-64 years 4386 3113 1273 Male 24560 17433 7127 Female 29536 20232 9304 White 40904 29298 11606 Black 5565 3743 1822 All Other 7116 4226 2890 Native American 243 210 33 AsianPacific 1616 1068 548 Hispanic 4798 2632 2165 Other 459 315 144 Unknown Race 511 399 112 NOTES Person-year enrollee counts for 2014 Numbers may not add to totals because of rounding Race information based on Research Triangle Institute race codes SOURCE CMS Office of Enterprise Data and Analytics
10
Table I10
Medicare Part D Enrollment by CMS Region
Total Medicare Total Part D of Total Enrollees Enrollees Enrollees
In thousands
All regions1 54096 37721 697
Boston 2699 1805 669 New York 5520 4054 734 Philadelphia 5385 3572 663 Atlanta 11535 8191 710 Chicago 9034 6496 719 Dallas 5903 3979 674 Kansas City 2459 1753 713 Denver 1644 1090 663 San Francisco 7267 5341 735 Seattle 2225 1425 641 1 Foreign residents and unknowns are not included in the regions but included in the total figure
NOTE Data for calendar year 2014 as reported in the CMS Chronic Conditions Data Warehouse SOURCE CMS Office of Enterprise Data and Analytics
Table I11 Medicare Part D Enrollment by Plan TypeCMS Region
Total Part D Total PDP Total MA-PD Enrollees Enrollees Enrollees
In thousands All regions1 37721 23437 14284
Boston 1805 1289 517 New York 4054 2228 1825 Philadelphia 3572 2385 1186 Atlanta 8191 4922 3269 Chicago 6496 4563 1933 Dallas 3979 2645 1334 Kansas City 1753 1320 433 Denver 1090 679 411 San Francisco 5341 2620 2721 Seattle 1425 774 651 1 Foreign residents and unknowns are not included in the regions but included in the total figure
NOTE Data for calendar year 2014 as reported in the CMS Chronic Conditions Data Warehouse
SOURCE CMS Office of Enterprise Data and Analytics
11
Table I12
Medicare Part D and RDS EnrollmentCMS Region
Total Part D and Total Part D Total RDS RDS Enrollees Enrollees Enrollees
In thousands All regions1 40379 37721 2657
Boston 2042 1805 237 New York 4351 4054 298 Philadelphia 3845 3572 273 Atlanta 8665 8191 474 Chicago 7000 6496 504 Dallas 4256 3979 278 Kansas City 1833 1753 80 Denver 1154 1090 64 San Francisco 5634 5341 293 Seattle 1583 1425 157 1 Foreign residents and unknowns are not included in the regions but included in the total figure
NOTE Data for calendar year 2014 as reported in the CMS Chronic Conditions Data Warehouse Totals may not add because of rounding
SOURCE CMS Office of Enterprise Data and Analytics
Table I13
Projected Population1
2010 2020 2040 2060 2080 2100
In millions
Total 315 342 392 430 471 511
Under 20 86 88 98 105 113 121
20-64 188 198 212 232 251 269
65 years and over 41 56 82 93 106 121 1 As of July 1
NOTE Numbers may not add to totals because of rounding
SOURCE Social Security Administration Office of the Chief Actuary based on the 2015 Trustees Report Intermediate Alternative
12
Table I14
Period Life Expectancy at Age 65
Historical and Projected
Male Female
Year In years
1965 129 163
1980 140 184
1990 151 191
2000 159 190
2010 176 202
20201 188 211
20301 195 217
20401 201 222
20501 207 228
20601 213 233
20701 218 237
20801 222 242
20901 227 246
21001 231 250 1 Projected
SOURCE Social Security Administration Office of the Chief Actuary based on the 2015 Trustees Report Intermediate Alternative
13
Table I15
Life Expectancy at Birth and at Age 65 by RaceTrends
Calendar Year All Races White Black
At Birth
1960 697 706 636
1980 737 744 681
1990 754 761 691
2000 768 773 718
2005 776 780 730
2010 787 789 751
2011 787 790 753
2012 788 791 755
2013 788 791 755
At Age 65
1960 143 144 139
1980 164 165 151
1990 172 173 154
2000 176 177 161
2005 184 185 169
2010 191 192 178
2011 192 192 180
2012 193 193 181
2013 193 193 181
SOURCE Centers for Disease Control and Prevention National Center for Health Statistics National Vital Statistics System
14
Table I16 Medicaid and CHIP Enrollment
Fiscal Year 1995 2000 2005 2010 2014 2015
Average monthly enrollment in millions Total 342 345 465 535 648 689 Age 65 years and over 37 37 46 47 54 56 BlindDisabled 58 67 81 95 98 102 Children 165 162 223 263 294 296 Adults 67 69 106 121 192 224 Other Title XIX1 06 NA NA NA NA NA Territories 08 09 10 10 10 10
CHIP NA 20 59 54 60 58
1In 1997 the Other Title XIX category was dropped and the enrollees therein were subsumed in the remaining categories
NOTES Aged and BlindDisabled eligibility groups include Qualified Medicare Beneficiaries (QMB) and Specified Low-Income Medicare Beneficiaries (SLMB) Children and Adult groups include both AFDCTANF and poverty-related recipients who are not disabled Medicaid enrollment excludes Medicaid expansion and CHIP programs CHIP numbers include adults covered under waivers Medicaid and CHIP figures for FY 2014-2015 are estimates from the Presidents FY 2016 budget Enrollment for Territories for FY 2000 and later is estimated Numbers may not add to totals because of rounding
SOURCES CMS Office of the Actuary and the Center for Medicaid and CHIP Services
15
Table I17 Medicaid EligiblesDemographics
Medicaid Percent Eligibles Distribution
In millions Total eligibles 709 1000
Age 709 1000 Under 21 353 499 21-64 years 272 384 65 years and over 67 95
Unknown 16 22
Sex 709 1000 Male 296 418 Female 412 581 Unknown 01 01
Race 709 1000 White not Hispanic 285 403
Black not Hispanic 155 218 Am IndianAlaskan Native 09 12
Asian 24 33 HawaiianPacific Islander 07 09
Hispanic 175 247 Other 03 05 Unknown 51 72
NOTES Fiscal Year 2012 data derived from MSIS Granular Database The percent distribution is based on unrounded numbers Totals do not necessarily equal the sum of rounded components Eligible is defined as anyone eligible and enrolled in the Medicaid program at some point during the fiscal year regardless of duration of enrollment receipt of a paid medical service or whether or not a capitated premium for managed care or private health insurance coverage has been made Age groups are determined using the eligiblersquos age at the end of the fiscal year Excludes beneficiaries ever enrolled in separate Title XXI Childrenrsquos Health Insurance Program (CHIP) Excludes data for Colorado Idaho and Maine and includes partial data for Arizona and Washington DC
SOURCE CMS Center for Medicaid and CHIP Services
16
Table I18 Medicaid EligiblesCMS Region
Enrollment as Resident
population1 Medicaid
enrollment2 percent of population
In thousands
All regions 305996 70895 232 Boston 13250 2964 224
New York 28483 7452 262 Philadelphia 30264 5828 193 Atlanta 62387 13582 218 Chicago 51953 11767 226 Dallas 39550 9206 233 Kansas City 13843 2578 186 Denver 5973 830 139
San Francisco 48767 14453 296 Seattle 11526 2235 194
1Estimated July 1 2012 population 2Persons ever enrolled in Medicaid during fiscal year 2012
NOTES Numbers may not add to totals because of rounding Excludes data for Colorado Idaho and Maine and includes partial data for Arizona and Washington DC Excludes enrollees ever enrolled in separate Title XXI Childrens Health Insurance Program (CHIP)
SOURCES CMS Center for Medicaid and CHIP Services US Department of Commerce Bureau of the Census
Table I19 Medicaid BeneficiariesState Buy-Ins for Medicare
1975 1 1980 1 2000 2 2014 2
Type of Beneficiary In thousands All buy-ins 2846 2954 5549 9273 Aged 2483 2449 3632 5340 Disabled 363 504 1917 3932
Percent of SMI enrollees All buy-ins 120 109 149 185 Aged 114 100 111 127 Disabled 187 189 402 481
1Beneficiaries for whom the State paid the SMI premium during the year 2Beneficiaries in person years
NOTES Numbers may not add to totals because of rounding Includes outlying areas foreign countries and unknown
SOURCE CMS Office of Enterprise Data and Analytics
17
18
ProvidersSuppliers
Information about institutions agencies or professionals who provide health care services and individuals or organizations who furnish health care equipment or supplies
These data are distributed by major providersupplier categories by geographic region and by type of program participation Utilization data organized by type of providersupplier may be found in the Utilization section
19
Table II1 Inpatient HospitalsTrends
1990 2000 2010 2014 Total hospitals 6522 5985 6169 6142 Beds in thousands 1105 991 928 931 Beds per 1000 enrollees1 328 253 196 173 Short-stay 5549 4900 3566 3466 Beds in thousands 970 873 785 784 Beds per 1000 enrollees1 288 223 166 146 Critical access hospitals NA NA 1325 1334 Beds in thousands --- --- 30 31 Beds per 1000 enrollees1 --- --- 06 06 Other non-short-stay 973 1085 1278 1342 Beds in thousands 135 118 113 116 Beds per 1000 enrollees1 40 30 24 22 1Based on number of total HI enrollees as of July 1 for years 1990 2000 and 2010 Based on person-year HI enrollee count for 2014
NOTES Facility data are as of December 31 and represent essentially those facilities eligible to participate at the start of the next calendar year Facilities certified for Medicare are deemed to meet Medicaid standards
SOURCE CMS Office of Enterprise Data and Analytics
Table II2 Inpatient HospitalsCMS Region
Short-stay Beds per Non Beds per and CAH 1000 Short-stay 1000 hospitals enrollees hospitals enrollees
All regions 4800 152 1342 22
Boston 178 119 64 35 New York 300 159 73 21 Philadelphia 360 133 131 24 Atlanta 883 156 249 18 Chicago 857 165 204 18 Dallas 764 179 350 38 Kansas City 460 189 62 18 Denver 312 160 50 25 San Francisco 475 133 130 16 Seattle 211 108 29 14 NOTES Critical Access Hospitals have been grouped with short stay Facility data as of Decem-ber 31 2014 Rates based on person-year hospital insurance enrollee count for 2014
SOURCE CMS Office of Enterprise Data and Analytics
20
Table II3 Medicare Hospital and SNFNFICF Facility Counts
Total participating hospitals 6142
Short-term hospitals 3466 Psychiatric units 1114 Rehabilitation units 915
Swing bed units 502 Psychiatric 551 Long-term 423 Rehabilitation 255
Childrenrsquos 98 Religious non-medical 15 Critical access 1334
Non-participating Hospitals 788 Emergency 436 Federal 352
All SNFsSNF-NFsNFs only 15637 All SNFsSNF-NFs 15179
Title 18 Only SNF 767 Hospital-based 188 Free-standing 579 Title 1819 SNFNF 14412 Hospital-based 573 Free-standing 13839
Title 19 only NFs 458 Hospital-based 102
Free-standing 356
All ICFIID facilities 6323
NOTES Data as of December 31 2014 Numbers may differ from other reports and program memoranda
SOURCE CMS Office of Enterprise Data and Analytics
21
Table II4 Long-Term FacilitiesCMS Region
Title XVIII and Nursing XVIIIXIX SNFs Facilities ICFIIDs
All regions 1 15179 458 6323
Boston 934 9 123 New York 995 2 586 Philadelphia 1366 39 389 Atlanta 2649 44 697 Chicago 3346 94 1387 Dallas 2050 50 1552 Kansas City 1405 113 200 Denver 591 35 111 San Francisco 1406 54 1198 Seattle 437 18 80 1 Includes outlying areas
NOTE Data as of December 2014
SOURCE CMS Office of Enterprise Data and Analytics
Table II5 Other Medicare Providers and SuppliersTrends
1980 1990 2010 2014
Home health agencies 2924 5661 10914 12268 Independent and Clinical Lab Improvement Act Facilities NA 4828 224679 250247 End stage renal disease facilities 999 1987 5631 6374 Outpatient physical therapy andor speech pathology 419 1144 2536 2102 Portable X-ray 216 435 561 536 Rural health clinics 391 517 3845 4062 Comprehensive outpatient rehabilitation facilities NA 184 354 216 Ambulatory surgical centers NA 1165 5316 5444 Hospices NA 772 3509 4140 NOTES Facility data for 1980 are as of July 1 Facility data for 1990 2010 and 2014 are as of December 31
SOURCE CMS Office of Enterprise Data and Analytics
22
Table II6 Selected FacilitiesType of Control
Skilled Short-stay nursing Home health hospitals facilities agencies
Total facilities 3466 15179 12268
Percent of total
Non-profit 595 239 152
Proprietary 213 706 798
Government 192 55 49
NOTES Data as of December 31 2014 Facilities certified for Medicare are deemed to meet Medicaid standards
SOURCE CMS Office of Enterprise Data and Analytics
Table II7 Periodic Interim Payment (PIP) FacilitiesTrends
1980 1990 2000 2012 2014
Hospitals Number of PIP
Percent of total participating
2276
338
1352
206
869
144
568
92
478
78
Skilled nursing facilities Number of PIP
Percent of total participating
203
39
774
73
1236
83
345
23
332
22
Home health agencies Number of PIP
Percent of total participating
481
160
1211
210
1038
144
141
12
146
12
NOTES These are facilities receiving Periodic Interim Payments (PIP) under Medicare Effec-tive for claims received on or after July 1 1987 the Omnibus Budget Reconciliation Act of 1986 eliminates PIP for many PPS hospitals when the servicing Part A MAC meets specified processing time standards
SOURCE CMS Center for Medicare
23
Table II8 Medicare Non-Institutional Providers by Specialty1
Count Total Providers 1173802
Primary Care 221469
Surgical Specialties 108447 Medical Specialties 142488
Anesthesiology 40453
ObstetricsGynecology 34606
Radiology 36713
Emergency Medicine 44399
Non-Physician Practitioners 332556
Limited Licensed Practitioners 104702
All Other Providers 131570
1 Providers utilized by Original Medicare beneficiaries for all Part B non-institutional provider services Providers may be counted in more than one specialty classification but are reported as a single provider in the Total Providers count
NOTE Data for calendar year 2014 as reported on the Original Medicare claims
SOURCE CMS Office of Enterprise Data and Analytics
Table II9
Medicare DMEPOS Providers by Specialty1
Count Total DMEPOS Providers 88033
Pharmacy 50338
Medical Supply Company 11257 Optometry 6276
Podiatry 5575
Individual Certified ProsthetistOrthotist 2704
Optician 2460
All Other DMEPOS Providers 9895
1Providers utilized by Original Medicare beneficiaries for all Part B non-institutional DMEPOS services Providers may be counted in more than one specialty classification but are reported as a single provider in the Total DMEPOS Providers count
NOTE Data for calendar year 2014 as reported on the Original Medicare claims
SOURCE CMS Office of Enterprise Data and Analytics
24
Expenditures
Information about spending for health care services by Medicare Medicaid CHIP and for the Nation as a whole
Health care spending at the aggregate levels is distributed by source of funds types of service geographic area and broad beneficiary or eligibility categories Direct out-of-pocket other private and non-CMS-related expenditures are also covered in this section Expenditures on a per-unit-of-service level are covered in the Utilization section
25
Table III1 CMS and Total Federal Outlays
Fiscal year Fiscal year 2013 2014
$ in billions Gross domestic product (current dollars) $166186 $172440 Total Federal outlays1 34546 35061 Percent of gross domestic product 208 203 Dept of Health and Human Services1 8863 9360 Percent of Federal Budget 257 267 CMS Budget (Federal Outlays)
Medicare benefit payments 5774 5913 SMI transfer to Medicaid2 05 07
Medicaid benefit payments 2488 3015 Medicaid State and local admin 145 152 Medicaid offsets3 -05 -07
Childrens Health Ins Prog 95 90 CMS program management 37 36 Other Medicare admin expenses4 20 20 State Eligibility Determinations for Part D 00 00 Quality Improvement Organizations5 05 05 Health Care Fraud and Abuse Control 16 14 State Grants and Demonstrations6 05 05 User Fees and Reimbursables 07 05 Total CMS outlays (unadjusted) 8447 9103 Offsetting receipts7 -970 -945 Total net CMS outlays 7477 8158 Percent of Federal budget 216 233 1Net of offsetting receipts 2SMI transfers to Medicaid for Medicare Part B premium assistance ( $477 million in FY 2013 and $688 million in FY 2014) 3SMI transfers for low-income premium assistance 4Medicare administrative expenses of the Social Security Administration and other Federal agen-cies 5Formerly peer review organizations (PROs) 6Includes grants and demonstrations for various free-standing programs such as the Ticket to Work and Work Incentives Improvement Act (PL 106-170) emergency health services for undocument-ed aliens (PL108-173) and Medicaids Money Follows the Person Rebalancing Demonstration (PL 109-171)7Almost entirely Medicare premiums Also includes offsetting collections for user fee and reim-bursable activities as well as refunds to the trust funds
SOURCE CMS Office of Financial Management
26
Table III2 Program ExpendituresTrends
Total Medicare1 Medicaid2 CHIP3
$ in billions Fiscal year
1980 $608 $350 $258 --
1990 1822 1097 725 --
2000 4287 2190 2080 $17
2010 9409 5256 4039 114
2014 10820 5987 4703 130
1Medicare amounts reflect gross outlays (ie not net of offsetting receipts) These amounts include outlays for benefits administration Health Care Fraud and Abuse Control (HCFAC) activities Quality Improvement Organizations (QIOs) the SMI transfer to Medicaid for Medicare Part B premium assistance for low-income Medicare beneficiaries and since FY 2004 the admin-istrative and benefit costs of the Transitional Assistance and Part D Drug benefits under the Medicare Modernization Act of 2003
2The Medicaid amounts include total computable outlays (Federal and State shares) for benefits and administration the Federal and State shares of the cost of Medicaid surveycertification and State Medicaid fraud control units and outlays for the Vaccines for Children program These amounts do not include the SMI transfer to Medicaid for Medicare Part B premium assistance for low-income beneficiaries nor do they include the Medicare Part D compensation to States for low-income eligibility determinations in the Part D Drug program
3The CHIP amounts reflect both Federal and State shares of Title XXI outlays Please note that CHIP-related Medicaid began to be financed under Title XXI in 2001
NOTE Numbers may not add to totals because of rounding
SOURCE CMS Office of Financial Management
27
Table III3 Annual Benefit Outlays by Program
1967 1980 2010 2014
Amounts in billions CMS program outlays $51 $578 $915 $1081
Federal outlays NA 472 793 891
Medicare1 32 339 518 598
HI 25 238 250 271
SMI 07 101 209 262
Prescription (Part D) NA NA 59 65
Medicaid2 19 239 386 470
Federal share NA 132 266 284
CHIP3 NA NA 11 13
Federal share NA NA 8 9
1The Medicare benefit amounts reflect gross outlays (ie not net of offsetting premiums) These amounts exclude outlays for the SMI transfer to Medicaid for premium assistance and the Quality Improvement Organizations (QIOs)
2The Medicaid amounts include total computable outlays (Federal and State shares) for Medicaid benefits and outlays for the Vaccines for Children program
3The CHIP amounts reflect both Federal and State shares of Title XXI outlays as reported by the States on line 4 of the CMS-21 Please note that CHIP-related Medicaid expansions began to be financed under CHIP (Title XXI) in FY 2001
NOTES Fiscal year data Numbers may not add to totals because of rounding
SOURCE CMS Office of Financial Management
28
Table III4 Program Benefit PaymentsCMS Region
Fiscal Year 2013 Net Expenditures Reported1
Medicaid Total Payments Computable for Federal funding Federal Share
In millions All regions $433131 $248800
Boston 26805 13956 New York 64834 32757 Philadelphia 42670 23556 Atlanta 67823 44435 Chicago 68180 40640 Dallas 46561 29266 Kansas City 16822 10134 Denver 10214 5812 San Francisco 73363 39201 Seattle 15859 9043 1Data from Form CMS-64--Net Expenditures Reported by the States Medical assistance payments only excludes administrative expenses and Childrens Health Insurance Program (CHIP) Unad-justed by CMS NOTE Numbers may not add to totals because of rounding
SOURCE CMS Office of Enterprise Data and Analytics
Table III5 Medicare Benefit Outlays
Fiscal Year 2013 2014 2015
In billions Part A benefit payments $2618 $2618 $2681
Aged 2179 2176 2232
Disabled 439 442 449
Part B benefit payments 2431 2566 2729 Aged 1971 2079 2215 Disabled 459 487 513
Part D 680 722 838 NOTES Based on 2015 Trustees Report Part A benefits include additional payments for HIT CBC IPAB and Sequester Part B benefits include additional payments for HIT IPAB and Sequester Part D benefits include additional payments for IPAB Ageddisabled split of Part D benefit outlays not available Totals do not necessarily equal the sum of rounded components
SOURCE CMS Office of the Actuary 29
Table III6 MedicareType of Benefit
Fiscal Year 2015 Benefit Percent Payments1 in millions Distribution
Total Part A23 $268084 1000 Inpatient hospital 136415 509 Skilled nursing facility Home health agency4
29928 6865
11226
Hospice 16056 60 Managed care Total Part B35
78821 272877
294 1000
Physicianother suppliers6 69199 254 DME 6502 24 Other carrier 21184 78 Outpatient hospital Home health agency4
43574 11491
16042
Other intermediary 19459 71 Laboratory 8534 31 Managed care Total Part D7
92934 83845
341 1000
1Includes the effects of regulatory items and recent legislation but not proposed law 2Includes HIT CBC IPAB and Sequester expenditures 3Excludes QIO expenditures 4Distribution of home health benefits between the trust funds estimated based on outlays reported to date by the Treasury 5Includes HIT IPAB and Sequester expenditures 6Includes payments made for HIT 7Includes payments made for IPAB
NOTES Based on 2015 Trustees Report Benefits by type of service are estimated and are subject to change Totals do not necessarily equal the sum of rounded components
SOURCE CMS Office of the Actuary
Table III7 National Health CareTrends
Calendar Year 1990 2000 2013
National total in billions $7243 $13780 $29191 Percent of GDP 121 134 174 Per capita amount $2855 $4881 $9255 Sponsor Percent of total Private Business 246 251 209 Household 349 315 282 Other Private Revenues 79 78 75 Governments 326 355 434 Federal government 173 190 259 State and local government 153 165 174 NOTE Numbers may not add to totals because of rounding
SOURCES CMS Office of the Actuary US Department of Commerce Bureau of Economic Analysis and US Bureau of the Census
30
Table III8 MedicaidType of Service
Fiscal Year 2011 2012 2013
In billions Total medical assistance payments1 $4075 $4088 $4331
Percent of Total Inpatient services 157 145 145 General hospitals 148 137 137
Mental hospitals 09 08 08 Nursing facility services 125 123 117 ICFIID services 33 33 28 Community-based long term care svs2 135 135 130 Prescribed drugs3 36 21 15 Physician and other practitioner services 40 35 33 Dental services 13 11 09 Outpatient hospital services 42 38 39 Clinic services4 27 26 24 Laboratory and radiological services 04 04 04 Early and periodic screening 03 03 03 Case management services 07 07 07 Capitation payments (non-Medicare) 252 291 319 Medicare premiums 35 33 32 Disproportionate share hosp payments 42 42 38 Other services 66 72 74 Collections5 -18 -20 -16 1Excludes payments under CHIP
2Comprised of home health home and community-based waivers personal care and home and community-based services for functionally disabled elderly
3Net of prescription drug rebates 4Federally qualified health clinics rural health clinics and other clinics 5Includes third party liability probate fraud and abuse overpayments and other collections
NOTE Numbers may not add to totals because of rounding
SOURCES CMS CMCS and OACT
31
Table III9 Medicare Savings Attributable to Secondary Payer
Provisions by Type of Provision Fiscal Year
2012 2013 2014 In millions Total $78622 $89258 $81999 Workers Compensation1 18419 18885 17117 Working Aged 31265 38384 35458 ESRD 2960 3031 2709 Auto 2122 1901 1729 Disability 18406 21196 19968 Liability 5232 5663 4885 VAOther 217 198 133 1Includes Workersrsquo Compensation set-asides
NOTES Includes Liability savings of the global settlements recovered by CMS Numbers may not add to totals because of rounding
SOURCE CMS Office of Financial Management
Table III10 MedicaidPayments by Eligibility Status
Fiscal Year 2013 Medical Assistance Percent
Payments Distribution In billions Total1 $4331 1000
Age 65 years and over 815 188 Blinddisabled 1752 404 Dependent children under 21 years of age 782 180 Adults in families with dependent children 645 149 Disproportionate share hospital and other unallocated payments2 338 78 1Excludes payments under Childrens Health Insurance Program (CHIP)
2Includes collections prior period adjustments and payments to territories
SOURCE CMS Office of the Actuary
32
Table III11 MedicareDMEPOS1
BETOS Category Allowed Charges2
2013 2014 In thousands
Total $10147264 $8686710
Medicalsurgical supplies 193817 204469 Hospital beds 183537 119600 Oxygen and supplies 1679612 1429545 Wheelchairs 806018 617261 Prostheticorthotic devices Drugs admin through DME3
2444878 770702
2363720 827574
Parenteral and enteral nutrition 604248 512214 Other DME 3464453 2612327 1Data are for calendar year DME=durable medical equipment POS=Prosthetic orthotic and supplies
2The allowed charge is the Medicare approved payment reported on a line item on the physician supplier claim
3Includes inhalation drugs administered through nebulizers only and does not include drugs administered through other DME such as infusion pumps
NOTE Over time the composition of BETOS categories has changed with the reassignment of selected procedures services and supplies Data for 2013 and 2014 as reported in the CMS Chronic Conditions Data Warehouse
SOURCE CMS Office of Enterprise Data and Analytics
33
Table III12 National Health CareType of Expenditure
National Per Percent Paid Total capita
in billions amount Total Medicare Medicaid Total $29191 $9255 355 201 154 Health Consumption Expenditures 27545 8733 376 213 163 Personal health care 24686 7826 389 223 166 Hospital care 9369 2970 434 259 175 Prof services 7779 2466 272 191 81 Physclinical 5867 1860 307 222 85 Other Professional 802 254 287 225 62 Dental 1110 352 72 04 68 Other Health Residential amp Personal Care 1482 470 591 34 557 Nursing Care Facilities amp
Continuing Care Retirement Communities 1558 494 523 222 301
Home Health 798 253 796 431 365 Retail outlet sales 3700 1173 300 230 70 Admn Net Cost and public health 2860 907 258 123 135 Investment 1646 522 -- -- --NOTE Data are as of calendar year 2013
SOURCE CMS Office of the Actuary Table III13
Personal Health CarePayment Source Calendar Year
1980 1990 2000 2013 In billions Total $2172 $6168 $11657 $24686
PercentTotal 1000 1000 1000 1000 Out of pocket 269 225 173 137 Health Insurance 607 654 725 773 Private Health Insurance 283 332 349 343 Medicare 167 174 186 223 Medicaid (Title XIX) 114 113 160 166 Total CHIP (Title XIX and Title XXI) -- -- 02 05 Department of Defense 18 17 11 15 Department of Veterans Affairs 26 18 16 22 Other Third Party Payers and Programs 124 121 102 90 NOTES Excludes administrative expenses the net cost of insurance non-commercial medical research investment in structures and equipment and public health expenditures Numbers may not add to totals because of rounding SOURCE CMS Office of the Actuary
34
Utilization
Information about the use of health care services
Utilization information is organized by persons receiving services and alternately by services rendered Measures of health care usage include persons served units of service (eg discharges days of care etc) and dimensions of the services rendered (eg average length of stay charge per person or per unit of service) These utilization measures are aggregated by program coverage categories provider characteristics type of service and demographic and geographic variables
35
Table IV1 MedicareShort-Stay Hospital Utilization
1990 2000 2013 2014 Discharges Total in millions 105 117 107 104 Rate per 1000 enrollees1 320 362 289 280
Days of care Total in millions 94 70 58 56 Rate per 1000 enrollees1 2866 2175 1548 1500
Average length of stay All short-stay 90 60 54 54 Excluded units 195 123 119 119
Total charges per day $1060 $2720 $8873 $9338
1The population base for the denominator is the July 1 HI Original Medicare enrollment for years 1990 and 2000 For 2013 and 2014 the HI Original Medicare enrollee counts are based on a person-year methodology
NOTES Data may reflect underreporting due to a variety of reasons including operational difficulties experienced by intermediaries no-pay at-risk managed care utilization no-pay Medi-care secondary payer bills and for certain years discharges where the beneficiary received services out of State Data may differ from other sources or from the same source with a different update cycle
SOURCE CMS Office of Enterprise Data and Analytics
Table IV2 Medicare Long-Term CareTrends
Skilled Nursing Facilities Home Health Agencies
Persons Served Persons Served Served in per 1000 Served in per 1000 thousands enrollees thousands enrollees
Calendar year 1985 315 10 1576 51 1990 638 19 1978 58 1995 1233 37 3468 103 2000 1468 451 2461 751
2005 1847 511 2976 811
2010 1839 521 3605 1001
2014 1827 491 3601 961
1Managed care enrollees excluded in determining rate
SOURCE CMS Office of Enterprise Data and Analytics
36
Table IV3 Medicare Average Length of StayTrends
Fiscal Year
1990 1995 2000 2010 2014 All short-stay and excluded units Short-stay PPS units 90 71 60 51 50 Short-stay hospital non-PPS units 89 71 60 51 56 Excluded units 195 148 123 118 119
NOTES Fiscal year data Average length of stay is shown in days Data for 1990 through 2014 are based on 100-percent MEDPAR stay record file Data may differ from other sources or from the same source with a different update cycle
SOURCE CMS Office of Enterprise Data and Analytics
Table IV4 Medicare Persons ServedTrends
Calendar Year 1975 1985 1995 2005 2010 2014
Aged persons served per 1000 enrollees
HI andor SMI 528 722 826 923 919 890 HI 221 219 218 234 237 197
SMI 536 739 858 979 988 979
Disabled persons served per 1000 enrollees
HI andor SMI 450 669 759 865 897 943 HI 219 228 212 205 213 198
SMI 471 715 837 977 1007 1028
NOTES Prior to 2000 data were obtained from the Annual Person Summary Record and were not yet modified to exclude persons enrolled in managed care Beginning in 2000 the rates were adjusted to exclude managed care enrollees Persons served represents estimates of beneficiaries receiving services under Original Medicare during the calendar year
SOURCE CMS Office of Enterprise Data and Analytics
37
Table IV5 Original Medicare Persons Served
Year
2010 2011 2012 2013 2014 HI Aged
Original Medicare Enrollees 290 293 300 305 307 Persons served 69 63 63 62 61 Rate per 1000 237 217 208 202 197
Disabled Original Medicare Enrollees 66 68 69 67 66
Persons served 14 14 14 13 13 Rate per 1000 213 201 196 197 198
SMI Aged
Original Medicare Enrollees 264 266 270 276 278 Persons served 261 262 267 270 272 Rate per 1000 988 987 989 977 979
Disabled Original Medicare Enrollees 58 60 60 61 60
Persons served 58 61 62 62 62 Rate per 1000 1007 1023 1027 1019 1028
NOTES For years 2010-2012 enrollment represents persons enrolled in Original Medicare as of July For 2013 and 2014 Medicare enrollment is based on a person-year methodology Persons served represents counts of beneficiaries receiving reimbursed services under Original Medicare during the calendar year Rate is the ratio of persons served during the calendar year to the number of Original Medicare enrollees
Original Medicare enrollees and persons served counts are in millions
SOURCE CMS Office of Enterprise Data and Analytics
38
Table IV6 Medicare Persons ServedCMS Region
Disabled Aged Persons Served Persons Served
Served per 1000 Served in per 1000 in thousands Enrollees thousands Enrollees
All Regions1 27634 890 6251 943 Boston 1533 878 376 948
New York 2513 847 518 870 Philadelphia 2928 893 639 949 Atlanta 6018 927 1482 975 Chicago 4832 967 1174 976 Dallas 3107 887 745 935 Kansas City 1503 919 325 961 Denver 926 923 168 966
San Francisco 3196 845 598 897 Seattle 1063 862 225 906
1Includes utilization for residents of outlying territories possessions foreign countries and unknown NOTES Data are based on counts of beneficiaries receiving HI andor SMI reimbursed services under Original Medicare during calendar year 2014 Numbers may not add to totals because of rounding
SOURCE CMS Office of Enterprise Data and Analytics
Table IV6a Original Medicare Persons Served by Type of Service
Disabled Total Persons Aged Persons Persons
Served in Served in Served in thousands thousands thousands
Parts A andor B 33885 27634 6251
Part A 7372 6061 1312 Inpatient hospital 6383 5134 1248 Skilled nursing facility 1827 1650 177 Home health agency 1657 1440 217 Hospice 1331 1257 73
Part B 33401 27211 6190 Physiciansupplier 32745 26745 6000 Outpatient 25083 20280 4803
Home health agency 1945 1677 268
NOTES Data are as of calendar year 2014 Persons served represents counts of beneficiaries receiving services under Original Medicare during the calendar year
SOURCE CMS Office of Enterprise Data and Analytics
39
Table IV7 Medicare End Stage Renal Disease (ESRD) by Treatment Modalities
Medicare Entitled Dialysis Transplant
Year Total Patients Patients 1991 180625 141069 39556 1999 316167 244869 71298 2000 332885 257686 75199 2001 349207 270016 79191 2002 364956 281327 83629 2003 377592 291782 85810 2004 393301 301866 91435 2005 408378 312008 96370 2006 425039 323545 101494 2007 441030 334995 106035 2008 457660 347212 110448 2009 475292 360537 114755 2010 492713 373483 119230 2011 507324 383420 123904
SOURCE United States Renal Data System
Table IV8 Medicare End Stage Renal Disease (ESRD)
by Treatment Modalities and Demographics 2010 Medicare Entitled
Total Dialysis Patients
Transplant Patients
Total--all patients 492713 373483 119230 Age 0-19 years 3196 1452 1744 20-64 years 278262 195727 82535 65-74 years 118721 90823 27898 75 years and over 92534 85481 7048 Sex Male 280229 208505 71724
Female 212484 164978 47506 Race
White 295864 211046 84818 Black 164299 137796 26503 Native American 6646 5428 1218 AsianPacific 23830 17901 5929 OtherUnknown 2074 1312 762 SOURCE United States Renal Data System
40
Table IV9 MedicaidType of Service
Fiscal year 2012 Medicaid Beneficiaries
In thousands Total eligibles 70895
Number using service
Total beneficiaries any service1 63312
Inpatient services General hospitals 7601
Mental hospitals Nursing facility services2
42 1415
ICFIID services 95 Physician services 42770 Dental services 18223 Other practitioner services 9399 Outpatient hospital services 26292 Clinic services 15744 Laboratory and radiological services 28131 Home health services 1696 Prescribed drugs 38695 Personal care support services 1189 Sterilization services 285 PCCM capitation 9266 HMO capitation 39360 PHP capitation 19301 Targeted case management 2579 Other services unspecified 15873 Additional service categories 12848 Unknown 524
1Excludes gross adjustment claims for services received by individual patients that come in the form of a lump sum payment covering services to more than one patient 2All nursing facility services Unlike Medicare there is no distinction for SNFs
NOTES The methodology used is different from previous updates for this table and data were derived from the MSIS Granular Database Beneficiary counts include Medicaid eligibles enrolled in fee-for-service and Medicaid managed care Excludes data for Colorado Idaho and Maine and includes partial data for Arizona and Washington DC Excludes CHIP
SOURCE CMS Center for Medicaid and CHIP Services
41
Table IV10 MedicaidUnits of Service
Fiscal Year 2012 Units of Service
In thousands Inpatient hospital Total discharges 7536
Beneficiaries discharged 6778 Total days of care 43765
Nursing facility Total days of care 290962
ICFIID Total days of care 26733
NOTES Data are derived from the MSIS Granular Database Service counts produced using inpatient and long term care original fee-for-service and Medicaid managed care claims Excludes enrollees ever enrolled in separate Title XXI CHIP program and beneficiaries that had claims but no matching Medicaid enrollment in 2012 Excludes data for Colorado Idaho and Maine and includes partial data for Arizona and Washington DC
SOURCE CMS Center for Medicaid and CHIP Services
42
AdministrativeOperating
Information on activities and services related to oversight of the day-to-day operations of CMS programs
Included are data on Medicare contractors contractor activities and performance CMS and State agency administrative costs quality control and summaries of the operation of the Medicare trust funds
43
Table V1 Medicare Administrative ExpensesTrends
Administrative Expenses As a Percent of
Fiscal Year Amount in millions Benefit Payments HI Trust Fund 1967 $89 35 1970 149 31 1980 497 21 1990 774 12 1995 1300 11 2000 1 2350 18 2005 1 2850 16 2010 3328 14 2012 3696 15 2013 4135 16 2014 4332 17
SMI Trust Fund2
1967 1353 203 1970 217 110 1980 593 58 1990 1524 37 1995 1722 27 2000 1780 20 2005 2348 16 2010 3513 13 2012 4130 14 2013 3756 12 2014 4297 13
1Includes non-expenditure transfers for Health Care Fraud and Abuse Control
2Starting in FY 2004 includes the transactions of the Part D account
3Includes expenses paid in fiscal years 1966 and 1967
SOURCE CMS Office of Actuary
44
Table V2 Medicare Administrative Contractors
Number
AB MACs 13
DME MACs 4
NOTE Data as of August 2015
SOURCE CMS Center for Medicare
Table V3 Medicare Redeterminations
Intermediary Intermediary Carrier Redeterminations Redeterminations Redeterminations
(Part A Cases Involved)
(Part B Cases Involved)
(Part B Cases Involved)
Number Processed 385016 229134 2624982
Percent Reversed 123 463 392 (Includes Fully amp Partially Reversed Cases)
NOTES Data for fiscal year 2014 Data presented in cases
SOURCE CMS Center for Medicare
Table V4 Medicare PhysicianSupplier Claims Assignment Rates
2000 2005 2010 2012 2013 2014 In millions
Claims total 7205 9516 9727 10032 9946 9952 Claims assigned 7057 9407 9657 9974 9892 9899 Claims unassigned 153 109 70 58 54 53
Percent assigned 979 989 993 994 995 995
NOTE Calendar year data (includes Carriers Part B AB MACs DME MACs) Due to the ongoing transition from Carriers to Part B MACs this table has been altered to solely reflect assignment rates at the National level
SOURCE CMS Center for Medicare
45
Table V5 Medicare Claims Processing
Fiscal Year 2014
Part A claims processed in millions 2100
Part B claims processed in millions1 10030
1Includes replicate claims (as reported in prior years)
SOURCE CMS Center for Medicare
Table V6 Medicare Claims Received
Claims received
Intermediary claims
received in millions 2113
Percent of total
Inpatient hospital 70
Outpatient hospital 546
Home health agency 73
Skilled nursing facility 27
Other 284
Carrier claims received in millions 9904
Percent of total
Assigned 995
Unassigned 05
NOTE Data for calendar year 2014
SOURCE CMS Center for Medicare
46
Table V7 Medicare Charge Reductions
Assigned Unassigned
Claims approved
Number in millions 8806 42
Percent reduced 951 790
Total covered charges
Amount in millions $347953 $519
Percent reduced 634 216
Amount reduced per claim $25034 $2678 NOTES Data for calendar year 2014 Charge reductions include reasonable charge medical necessity and global feerebundling reductions
SOURCE CMS Center for Medicare
Table V8 Medicaid Administration
Fiscal Year 2013 2014
In millions Total payments computable for Federal funding1 $22938 $24418
Federal share1
Family Planning 32 30 Design development or
installation of MMIS2 533 663 Skilled professional
medical personnel 440 487 Operation of an
approved MMIS2 1550 1569 All other 11588 12359 Mechanized systems not approved under MMIS2 73 85
Total Federal Share $14216 $15193
Net adjusted Federal share3 $13682 $14675 1Source Form CMS-64 (Net Expenditures ReportedmdashAdministration) 2Medicaid Management Information System 3Includes CMS adjustments
SOURCE CMS Office of Enterprise Data and Analytics
47
48
Reference
Selected reference material including program financing cost-sharing features of the Medicare program and Medicaid Federal medical assistance percentages
49
Pro
gram
Fin
anci
ng
Cos
t S
har
ing
and
Lim
itat
ion
s
Med
icar
eS
ourc
e of
In
com
e
Med
icar
e P
art
A H
ospi
tal I
nsur
ance
trus
t fun
d 1
P
ayro
ll ta
xes
2
Inc
ome
from
taxa
tion
of
soci
al s
ecur
ity
bene
fits
3
Tra
nsfe
rs f
rom
rai
lroa
d re
tire
men
t acc
ount
4
Gen
eral
rev
enue
for
uni
nsur
ed p
erso
ns a
nd m
ilit
ary
wag
e c
redi
ts
5 P
rem
ium
s fr
om v
olun
tary
enr
olle
es
6 I
nter
est o
n in
vest
men
ts
Con
trib
utio
n ra
te
2014
20
15
2016
Per
cent
Em
ploy
ees
and
empl
oyer
s e
ach
145
1
45
145
S
elf-
empl
oyed
2
90
2
90
29
0
Max
imum
taxa
ble
amou
nt (
CY
201
6)
Non
e1
Vol
unta
ry H
I m
onth
ly p
rem
ium
2 $
411
00
Par
t A
(ef
fect
ive
dat
e)
Inpa
tien
t hos
pita
l
ded
ucti
ble
(11
16)
Reg
ular
coi
nsur
ance
d
ays
(11
16)
L
ifet
ime
rese
rve
days
(1
116
) S
NF
coi
nsur
ance
day
s
(11
16)
B
lood
ded
ucti
ble
Vol
unta
ry h
ospi
tal i
nsur
ance
prem
ium
(1
116
)2
Lim
itat
ion
s
Inpa
tien
t psy
chia
tric
hos
pita
ls
Am
oun
t
$12
88b
enef
it p
erio
d
$3
22d
ay f
or 6
1st
th
roug
h 90
th d
ay
$644
day
(60
non
-
rene
wab
le d
ays)
$161
day
for
21s
t
thro
ugh
100t
h da
y
firs
t 3 p
ints
cal
enda
r ye
ar
$411
mon
th $
226
mo
wit
h 30
-39
quar
ters
of c
over
age
19
0 no
nren
ewab
le d
ays
1 The
Om
nibu
s R
econ
cili
atio
n A
ct o
f 19
93 e
lim
inat
ed th
e A
nnua
l Max
imum
Tax
able
Ear
ning
s am
ount
s fo
r 19
94 a
nd la
ter
For
thes
e ye
ars
the
co
ntri
buti
on r
ate
is a
ppli
ed to
all
ear
ning
s in
cov
ered
em
ploy
men
t
2 Prem
ium
pai
d fo
r vo
lunt
ary
part
icip
atio
n of
indi
vidu
als
aged
65
and
over
not
oth
erw
ise
entit
led
to h
ospi
tal i
nsur
ance
and
cer
tain
dis
able
d in
divi
dual
sw
ho h
ave
exha
uste
d ot
her
enti
tlem
ent
A r
educ
ed p
rem
ium
of
$226
is a
vail
able
to in
divi
dual
s ag
ed 6
5 an
d ov
er w
ho a
re n
ot o
ther
wis
e en
titl
ed to
ho
spit
al in
sura
nce
but w
ho h
ave
or
who
se s
pous
e ha
s or
had
30-
39 q
uart
ers
of c
over
age
unde
r T
itle
II
of th
e So
cial
Sec
urit
y A
ct
SO
UR
CE
C
MS
Off
ice
of th
e A
ctua
ry
Pro
gram
Fin
anci
ng
Cos
t S
har
ing
and
Lim
itat
ion
s
Med
icar
e P
art
B
Sup
plem
enta
ry M
edic
al I
nsur
ance
trus
t fun
d 1
P
rem
ium
s pa
id b
y or
on
beha
lf o
f en
roll
ees
2 G
ener
al r
even
ue
3 I
nter
est o
n in
vest
men
ts
Par
t B
(ef
fect
ive
dat
e)
Am
oun
t D
educ
tibl
e (1
11
6) $
166
in a
llow
ed c
harg
esy
ear
Blo
od d
educ
tibl
e f
irst
3 p
ints
cal
enda
r ye
ar
Coi
nsur
ance
1 20
per
cent
of
allo
wed
cha
rges
M
onth
ly s
tand
ard
prem
ium
(1
116
) $
104
90m
onth
Lim
itat
ion
s O
utpa
tien
t tre
atm
ent f
or m
enta
l ill
ness
N
o li
mit
atio
ns
1 The
Par
t B d
educ
tibl
e an
d co
insu
ranc
e ap
plie
s to
mos
t ser
vice
s I
tem
s an
dor
ser
vice
s no
t sub
ject
to e
ithe
r th
e de
duct
ible
or
coin
sura
nce
are
cl
inic
al d
iagn
osti
c la
b te
sts
subj
ect t
o a
fee
sche
dule
hom
e he
alth
ser
vice
s it
ems
and
serv
ices
fur
nish
ed in
con
nect
ion
to o
btai
ning
a s
econ
d or
th
ird
opin
ion
and
som
e pr
even
tive
serv
ices
SO
UR
CE
C
MS
Off
ice
of th
e A
ctua
ry
Pro
gram
Fin
anci
ng
Cos
t S
har
ing
and
Lim
itat
ion
s
Med
icar
e P
art
B (
con
tin
ued
)
Lis
ted
belo
w a
re th
e 20
16 P
art B
mon
thly
pre
miu
m r
ates
to b
e pa
id b
y be
nefi
ciar
ies
who
fil
e an
indi
vidu
al ta
x re
turn
(inc
ludi
ng th
ose
who
are
sin
gle
hea
d of
hou
seho
ld q
ualif
ying
wid
ow(e
r) w
ith
depe
nden
t chi
ld o
r m
arri
ed f
ilin
g se
para
tely
w
ho li
ved
apar
t fro
m th
eir
spou
se f
or th
e en
tire
taxa
ble
year
) o
r a
join
t tax
ret
urn
Ben
efic
iari
es w
ho f
ile
an in
divi
dual
B
enef
icia
ries
who
fil
e a
join
t tax
In
com
e-re
late
d m
onth
lyT
otal
mon
thly
tax
retu
rn w
ith
inco
me
re
turn
wit
h in
com
e
adju
stm
ent a
mou
nt
prem
ium
am
ount
Les
s th
an o
r eq
ual t
o $8
500
0 L
ess
than
or
equa
l to
$170
000
$0
00
$121
80
Gre
ater
than
$85
000
and
less
than
Gre
ater
than
$17
000
0 an
d le
ss th
an
or e
qual
to $
107
000
or e
qual
to $
214
000
$4
870
$1
705
0
Gre
ater
than
$10
700
0 an
d le
ss th
an
G
reat
er th
an $
214
000
and
less
than
or
equ
al to
$16
000
0 or
equ
al to
$32
000
0
$121
80
$243
60
Gre
ater
than
$16
000
0 an
d le
ss th
an
G
reat
er th
an $
320
000
and
less
than
or
equ
al to
$21
400
0 or
equ
al to
$42
800
0
$194
90
$316
70
Gre
ater
than
$21
400
0 G
reat
er th
an $
428
000
$268
00
$389
80
In a
ddit
ion
the
mon
thly
pre
miu
m r
ates
to b
e pa
id b
y be
nefi
ciar
ies
who
are
mar
ried
and
live
d w
ith
thei
r sp
ouse
at a
ny ti
me
duri
ng th
e ta
xabl
e ye
ar b
ut f
ile
a se
para
te ta
x re
turn
fro
m th
eir
spou
se a
re li
sted
bel
ow
Tot
al m
onth
ly
spou
se a
nd f
iled
a s
epar
ate
tax
retu
rn
adju
stm
ent a
mou
nt
prem
ium
am
ount
M
arri
ed b
enef
icia
ries
who
live
d w
ith
thei
r In
com
e-re
late
d m
onth
ly
$121
80
Les
s th
an o
r eq
ual t
o $8
500
0 $0
00
$316
70
Gre
ater
than
$85
000
and
less
than
or
equa
l to
$129
000
$194
90
$389
80
Gre
ater
than
$12
900
0 $2
680
0
SO
UR
CE
C
MS
Off
ice
of th
e A
ctua
ry
Pro
gram
Fin
anci
ng
Cos
t S
har
ing
and
Lim
itat
ion
s
Med
icar
e P
art
D S
tan
dar
d B
enef
its
Ded
ucti
ble
(11
201
6)
$360
in c
harg
esy
ear
Init
ial c
over
age
lim
it (
11
2016
) $3
310
in c
harg
esy
ear
Out
-of-
pock
et th
resh
old
(11
201
6)
$48
50 in
cha
rges
yea
r B
ase
bene
fici
ary
prem
ium
(1
120
16)1
$34
10m
onth
Med
icai
d F
inan
cin
g 1
F
eder
al c
ontr
ibut
ions
(ra
ngin
g fr
om 5
0 to
74
perc
ent f
or f
isca
l yea
r 20
16)
2
Sta
te c
ontr
ibut
ions
(ra
ngin
g fr
om 2
6 to
50
perc
ent f
or f
isca
l yea
r 20
16)
1 The
bas
e be
nefi
ciar
y pr
emiu
m w
as c
alcu
late
d ba
sed
on a
nat
iona
l ave
rage
pla
n bi
d T
he a
ctua
l pre
miu
m th
at a
ben
efic
iary
pay
s va
ries
ac
cord
ing
to th
e pl
an in
whi
ch th
e be
nefi
ciar
y is
enr
olle
d
NO
TE
S
The
ben
efic
iari
es w
ho q
uali
fy f
or th
e lo
w-i
ncom
e su
bsid
y un
der
Par
t D p
ay a
red
uced
or
zero
pre
miu
m
In a
ddit
ion
low
-inc
ome
bene
fici
arie
s ar
e su
bjec
t to
only
min
imal
cop
aym
ent a
mou
nts
in m
ost i
nsta
nces
SO
UR
CE
C
MS
Off
ice
of th
e A
ctua
ry
Geographical Jurisdictions of CMS Regional Offices and Medicaid Federal Medical Assistance Percentages (FMAP) fiscal year 2016
I Boston FMAP II New York FMAP ConnecticutMaine
5000 6267
New Jersey New York
5000 5000
Massachusetts 5000 Puerto Rico 5500 New Hampshire 5000 Virgin Islands 5500 Rhode Island 5042 Vermont 5390 IV Atlanta
Alabama 6987 III Philadelphia
Delaware 5483 Dist of Columbia 7000
Maryland 5000 Pennsylvania 5201 Virginia 5000
West Virginia 7142
Florida Georgia
Kentucky Mississippi North Carolina South Carolina Tennessee
6067 6755 7032 7417 6624 7108 6505
V Chicago Illinois 5089
VI Dallas Arkansas 7000
Indiana 6660 Louisiana 6221 Michigan Minnesota
6560 5000
New Mexico Oklahoma
7037 6099
Ohio 6247 Texas 5713 Wisconsin 5823
VIII DenverVII Kansas City
Iowa 5491 Colorado
Montana 5072 6524
Kansas 5596 North Dakota 5000 Missouri 6328 South Dakota 5161 Nebraska 5116 Utah 7024
Wyoming 5000IX San Francisco
Arizona 6892 X Seattle California 5000 Alaska 5000
Hawaii 5398 Idaho 7124 Nevada 6493 Oregon 6438 American Samoa 5500 Washington 5000 Guam 5500 N Mariana Islds 5500
NOTE FMAPs are used in determining the amount of Federal matchingfunds for State expenditures for assistance payments
SOURCE DHHS Assistant Secretary for Planning and Evaluation
US Department of Health amp Human Services Centers for Medicare amp Medicaid Services Office of Enterprise Data and Analytics CMS Pub No 03512 December 2015
- Structure Bookmarks
-
- 2015 CMS Statistics
- Centers for Medicare amp Medicaid Services
- Office of Enterprise Data and Analytics
- Information Products Group
- Publication Coordinators
- Publication Staff
- Preface
- I Populations 5
- GDP
- NF
- Table I1
- Table I2 Medicare EnrollmentCoverage
- Table I3
- Table I5 Medicare ESRD EnrollmentTrends
- Table I6 Medicare ESRD EnrollmentDemographics
- All regions
- In thousands
- Table I10 Medicare Part D Enrollment by CMS Region
- Table I12 Medicare Part D and RDS EnrollmentCMS Region
- Table I13 Projected Population
- Table I14
- Table I15 Life Expectancy at Birth and at Age 65 by RaceTrends
- Table I18
- Table I19 Medicaid BeneficiariesState Buy-Ins for Medicare
- Total hospitals
- All regions
- Total participating hospitals
- Home health agencies
- Table II6
- Hospitals Number of PIP Percent of total participating
- Count
- Count
- Total
- 1967
- In millions
- 2013
- Total Part A23
- National total in billions
- Table III8
- In millions
- Total
- Discharges
- 1975
- 2010
- Table IV6
- Disabled
- Parts A andor B
- Dialysis
- Table
- In thousands
- (Part A Cases Involved)
- Table V4 Medicare PhysicianSupplier Claims Assignment Rates
- Table V6 Medicare Claims Received
- Table V7
- for Federal funding1
- I Boston
-
Glossary of Acronyms (continued)
GDP Gross Domestic Product
HCPP Health Care Prepayment Plan
HI Hospital Insurance (Part A)
HIT Health Information Technology
HMO Health Maintenance Organization
ICFIID Intermediate Care Facility for Individuals with Intellectual Disabilities ICF-MR Intermediate Care Facility for Mentally Retarded IPAB Independent Payment Advisory
Board MA Medicare Advantage MACs Medicare Administrative Contractors MA-PD Medicare Advantage Prescription Drug Plans MEDPAR Medicare Provider Analysis and
Review MIF Medicare Improvement Fund MSA Medical Savings Account
MSIS Medicaid Statistical Information System
iii
NF Nursing Facility NHE National Health Expenditures OACT Office of the Actuary PACE Program of All-Inclusive Care for the Elderly PCCM Primary Care Case Management PDP Prescription Drug Plan PFFS Private Fee for Service Plans PHP Prepaid Health Plans PPS Prospective Payment System QIO Quality Improvement Organization RDS Retiree Drug Subsidy RPPOs Regional Preferred Provider Organizations SMI Supplementary Medical Insurance (Part B) SNF Skilled Nursing Facility SSA Social Security Administration TANF Temporary Assistance for Needy Families VA Veteranrsquos Affairs
Glossary of Acronyms (continued)
iv
Highlights Growth in CMS programs and health expenditures
Populations
Persons enrolled for Medicare coverage increased from 191 million in 1966 to a projected 558 million in 2015 a 192 percent increase (I1)
Medicare enrollees with end-stage renal disease increased from 1100 thousand in 1985 to 4969 thousand in 2014 an increase of 352 percent (I5)
By 2014 over 377 million Medicare enrollees had Part D drug coverage 697 percent of all enrollees and an additional 27 million had RDS (I10 ampI12)
On average the number of Medicaid monthly enrollees in 2015 is estimated to be about 689 million the largest group being children (296 million or 430 percent) (I16)
In 2012 23 percent of the population was at some point enrolled in the Medicaid program (I18)
1
Medicare State buy-ins have grown from about 28 million beneficiaries in 1975 to 93 million beneficiaries in 2014 an increase of about 232 percent (I19)
ProvidersSuppliers
The number of inpatient hospital facilities decreased from 6522 in December 1990 to 6142 in December 2014 Total inpatient hospital beds have dropped from 328 beds per 1000 enrolled in 1990 to 173 in 2014 a decrease of 47 percent (II1)
The total number of Medicare certified beds in short-stay hospitals has decreased to about 784000 in 2014 from 970000 in 1990 The average number of short-stay hospital beds per 1000 enrolled in 2014 is 146 down from 288 in 1990 (II1)
The number of hospice facilities increased from 772 in 1990 to 4140 in 2014 (II5)
The number of participating home health agencies has fluctuated considerably over the years almost doubling in number from 1990 to almost 11000 in 1997 when the Balanced Budget Act was passed The number decreased sharply but has since stabilized reaching 12268 in 2014 (II5 amp II6)
2
Expenditures
In fiscal year 2014 total net Federal outlays for CMS programs were $8158 billion 233 percent of the Federal budget (III1)
Medicare Part A benefit payments are projected to increase to $2681 billion for fiscal year 2015 up from $2618 billion for fiscal year 2014 and Medicare Part B benefit payments are projected to increase to $2729 billion for fiscal year 2015 up from $2566 billion for fiscal year 2014 (III5)
Medicare hospice benefit payments are projected to be $161 billion for fiscal year 2015 down from $168 billion in 2014 (III6)
National health expenditures (NHE) were $29191 billion in calendar year 2013 comprising 174 percent of the gross domestic product (GDP) Comparably NHE amounted to $7243 billion or 121 percent of the GDP in calendar year 1990 NHE per person were $147 in calendar year 1960 and grew steadily to reach $9255 by calendar year 2013 (III7)
Utilization of Medicare and Medicaid services
Between 1990 and 2014 the number of short-stay hospital discharges per 1000 enrollees decreased from 320 to 280 a decrease of 13 percent (IV1)
The PPS short-stay hospital average length of stay decreased significantly from 90 days in 1990 to 50 days in 2014 a decrease of 44 percent (IV3)
3
The ratio of Medicare aged users of any type of covered service has grown from 528 per 1000 enrolled in 1975 to 890 per 1000 enrolled in 2014 (IV4)
About 339 million persons received a reimbursed service under Medicare fee-for-service during 2014 Comparably almost 633 million persons used Medicaid services or had a premium paid on their behalf in 2012 (IV6a amp IV9)
64 million persons received reimbursable fee-for-service inpatient hospital services under Medicare in 2014 (IV6a)
327 million persons received reimbursable fee-for-services physician services under Medicare during 2014 428 million persons received reimbursable physician services under Medicaid during 2012 (IV6a amp IV9)
251 million persons received reimbursable fee-for-service outpatient hospital services under Medicare during 2014 During 2012 263 million persons received Medicaid reimbursable outpatient hospital services (IV6a amp IV9)
Over 18 million persons received care in SNFs covered by Medicare during 2014 14 million persons received care in nursing facilities which include SNFs and all other nursing facilities excluding ICFIID covered by Medicaid during 2012 (IV6a amp IV9)
Over 38 million persons received prescribed drugs under Medicaid during 2012 (IV9)
4
Populations
Information about persons covered by Medicare Medicaid or CHIP
For Medicare statistics are based on persons enrolled for coverage Original Medicare enrollees are also referred to as fee-for-service enrollees Historically for Medicaid recipient (beneficiary) counts were used as a surrogate of persons eligible for coverage as well as for persons utilizing services Current data systems now allow the reporting of total eligibles for Medicaid and for Childrenrsquos Health Insurance Program (CHIP) Statistics are available by major program categories by demographic and geographic variables and as proportions of the US population Utilization data organized by persons served may be found in the Utilization section
5
Table I1 Medicare EnrollmentTrends
Total Aged Disabled Persons Persons Persons
July In millions 1966 191 191 --1970 204 204 --1975 249 227 22 1980 284 255 30 1985 311 281 29 1990 343 310 33 1995 376 332 44
Average monthly 2000 397 343 54 2005 426 358 68 2010 477 396 81 2012 509 422 87 2013 525 436 88 2014 538 449 89 2015 558 468 91
NOTES Represents those enrolled in HI (Part A) andor SMI (Part B and Part D) of Medicare Data for 1966-1995 are as of July Data for calendar years 2000-2015 represent average actual or projected monthly enrollment Numbers may not add to totals because of rounding Based on 2015 Trustees Report
SOURCE CMS Office of the Actuary
Table I2 Medicare EnrollmentCoverage
HI andor SMI HI P
SMI
art B Part D
HI and SMI
HI Only
SMI Only
In millions
All persons
Aged persons
Disabled persons
553
463
90
550
460
90
504
422
82
415
--
--
501
419
82
49
41
08
03
03
00 NOTES Projected average monthly enrollment during fiscal year 2015 Ageddisabled split of Part D enrollment not available Based on 2015 Trustees Report Numbers may not add to totals because of rounding
SOURCE CMS Office of the Actuary
6
Table I3 Medicare EnrollmentDemographics
Total Male Female In thousands
All persons 54096 24560 29536 Aged 45312 20019 25293 65-74 years 25124 11828 13295 75-84 years 13723 5981 7743 85 years and over 6465 2210 4255Disabled 8783 4541 4243 Under 45 years 1929 1035 894 45-54 years 2467 1265 1203 55-64 years 4386 2240 2146 White 40904 18536 22368 Black 5565 2401 3164 All Other 7116 3289 3826 Native American 243 108 134 AsianPacific 1616 725 892 Hispanic 4798 2230 2567 Other 459 226 233
Unknown Race 511 333 178 NOTES Person-year enrollee counts for 2014 Numbers may not add to totals because of round-ing Race information is based on Research Triangle Institute (RTI) race codes
SOURCE CMS Office of Enterprise Data and Analytics
Table I4 Medicare Part D EnrollmentDemographics
Total Male Female In thousands
All persons 37721 15938 21783
Aged 65-74 years 16543 7156 9387 75-84 years 9992 4087 5905 85 years and over 4555 1406 3150
Disabled Under 45 years 1572 823 750 45-54 years 1887 948 939 55-64 years 3171 1518 1653 NOTES Person-year enrollee counts for 2014 as reported in the CMS Chronic Conditions Data Warehouse Totals may not add because of rounding
SOURCE CMS Office of Enterprise Data and Analytics
7
Table I5 Medicare ESRD EnrollmentTrends
HI andor SMI HI SMI
In thousands Year 1985 1100 1091 1065 1990 1721 1706 1637 1995 2557 2536 2438 2000 2909 2904 2728 2005 3699 3698 3516 2010 4369 4368 4161 2014 4969 4938 4725
NOTE Data as of July 1 for years 1985-2010 Enrollee counts for 2014 are determined using a person-year methodology
SOURCE CMS Office of Enterprise Data and Analytics
Table I6 Medicare ESRD EnrollmentDemographics
Number of Enrollees (in thousands)
All persons 5475 Age Under 35 years 245 35-44 years 405 45-64 years 2106 65 years and over 2719
Sex Male 3121 Female 2354
Race White 2323 Black 1841
Other 1270 Unknown 41
NOTES CMS Chronic Conditions Data Warehouse Represents persons with ESRD ever enrolled during calendar year 2014
SOURCE CMS Office of Enterprise Data and Analytics
8
Table I7 Medicare Advantage Cost PACE Demo amp Prescription Drug
Number of MA only Drug Plan Total Contracts (Enrollees in thousands)
Total prepaid1 741 2094 15600 17694 Local CCPs 507 1543 13598 15140 PFFS 8 78 177 254 1876 Cost 16 297 269 566
1833 Cost (HCPP) 9 51 -- 51 PACE 117 -- 33 33 Other plans2 84 126 1524 1650
Total PDPs1 76 -- 24180 24180 Total 817 2094 39781 41875 1Totals include beneficiaries enrolled in employerunion-only group plans (contracts with 800 series plan IDs) Where a beneficiary is enrolled in both an 1876 cost or PFFS plan and a PDP plan both enrollments are reflected in these counts 2Includes MSA Pilot Medicare-Medicaid Plans and RPPOs
NOTE Data as of October 2015
SOURCE CMS Center for Medicare
Table I8 Medicare EnrollmentCMS Region
Enrollees as Resident Medicare Percent
Population1 Enrollees2 of Population
In thousands
All regions 318857 52882 166 Boston 14681 2699 184 New York 28684 4753 166 Philadelphia 30535 5385 176 Atlanta 63573 11535 181
Chicago 52196 9034 173 Dallas 40537 5903 146 Kansas City 13956 2459 176 Denver 11499 1644 143 San Francisco 49793 7246 146 Seattle 13403 2225 166 1Preliminary annual estimate July 1 2014 resident population 2Medicare enrollment data for 2014 are determined using a person-year methodology Excludes beneficiaries living in territories possessions foreign countries or with residence unknown
NOTES Resident population is a provisional estimate based on 50 States and the District of Columbia Numbers may not add to totals because of rounding For regional breakouts see Reference section SOURCES CMS Office of Enterprise Data and Analytics US Bureau of the Census Population Estimates Branch
9
Table I9 Medicare Enrollment by Health DeliveryCMS Region
MA and Other Total Original Medicare Health Plan
Enrollees Enrollees Enrollees
In thousands All regions 54096 37665 16430 Boston 2699 2142 558 New York 5520 3564 1956 Philadelphia 5385 3952 1432 Atlanta 11535 8009 3525 Chicago 9034 6199 2836 Dallas 5903 4298 1604 Kansas City 2459 1974 485 Denver 1644 1178 466 San Francisco 7267 4447 2820 Seattle 2225 1481 743 NOTES Person-year enrollee counts for 2014 Totals may not add because of rounding Foreign residents and unknowns are not included in the regions but included in the total figure
SOURCE CMS Office of Enterprise Data and Analytics
Table I9a Medicare Enrollment by Health DeliveryDemographics
Original MA and Other Total Medicare Health Plans
In thousands All persons 54096 37665 16430 Aged 45312 31038 14274 65-74 years 25124 17279 7844 75-84 years 13723 9119 4604 85 years and over 6465 4640 1825 Disabled 8783 6627 2156 Under 45 years 1929 1612 317 45-54 years 2467 1902 566 55-64 years 4386 3113 1273 Male 24560 17433 7127 Female 29536 20232 9304 White 40904 29298 11606 Black 5565 3743 1822 All Other 7116 4226 2890 Native American 243 210 33 AsianPacific 1616 1068 548 Hispanic 4798 2632 2165 Other 459 315 144 Unknown Race 511 399 112 NOTES Person-year enrollee counts for 2014 Numbers may not add to totals because of rounding Race information based on Research Triangle Institute race codes SOURCE CMS Office of Enterprise Data and Analytics
10
Table I10
Medicare Part D Enrollment by CMS Region
Total Medicare Total Part D of Total Enrollees Enrollees Enrollees
In thousands
All regions1 54096 37721 697
Boston 2699 1805 669 New York 5520 4054 734 Philadelphia 5385 3572 663 Atlanta 11535 8191 710 Chicago 9034 6496 719 Dallas 5903 3979 674 Kansas City 2459 1753 713 Denver 1644 1090 663 San Francisco 7267 5341 735 Seattle 2225 1425 641 1 Foreign residents and unknowns are not included in the regions but included in the total figure
NOTE Data for calendar year 2014 as reported in the CMS Chronic Conditions Data Warehouse SOURCE CMS Office of Enterprise Data and Analytics
Table I11 Medicare Part D Enrollment by Plan TypeCMS Region
Total Part D Total PDP Total MA-PD Enrollees Enrollees Enrollees
In thousands All regions1 37721 23437 14284
Boston 1805 1289 517 New York 4054 2228 1825 Philadelphia 3572 2385 1186 Atlanta 8191 4922 3269 Chicago 6496 4563 1933 Dallas 3979 2645 1334 Kansas City 1753 1320 433 Denver 1090 679 411 San Francisco 5341 2620 2721 Seattle 1425 774 651 1 Foreign residents and unknowns are not included in the regions but included in the total figure
NOTE Data for calendar year 2014 as reported in the CMS Chronic Conditions Data Warehouse
SOURCE CMS Office of Enterprise Data and Analytics
11
Table I12
Medicare Part D and RDS EnrollmentCMS Region
Total Part D and Total Part D Total RDS RDS Enrollees Enrollees Enrollees
In thousands All regions1 40379 37721 2657
Boston 2042 1805 237 New York 4351 4054 298 Philadelphia 3845 3572 273 Atlanta 8665 8191 474 Chicago 7000 6496 504 Dallas 4256 3979 278 Kansas City 1833 1753 80 Denver 1154 1090 64 San Francisco 5634 5341 293 Seattle 1583 1425 157 1 Foreign residents and unknowns are not included in the regions but included in the total figure
NOTE Data for calendar year 2014 as reported in the CMS Chronic Conditions Data Warehouse Totals may not add because of rounding
SOURCE CMS Office of Enterprise Data and Analytics
Table I13
Projected Population1
2010 2020 2040 2060 2080 2100
In millions
Total 315 342 392 430 471 511
Under 20 86 88 98 105 113 121
20-64 188 198 212 232 251 269
65 years and over 41 56 82 93 106 121 1 As of July 1
NOTE Numbers may not add to totals because of rounding
SOURCE Social Security Administration Office of the Chief Actuary based on the 2015 Trustees Report Intermediate Alternative
12
Table I14
Period Life Expectancy at Age 65
Historical and Projected
Male Female
Year In years
1965 129 163
1980 140 184
1990 151 191
2000 159 190
2010 176 202
20201 188 211
20301 195 217
20401 201 222
20501 207 228
20601 213 233
20701 218 237
20801 222 242
20901 227 246
21001 231 250 1 Projected
SOURCE Social Security Administration Office of the Chief Actuary based on the 2015 Trustees Report Intermediate Alternative
13
Table I15
Life Expectancy at Birth and at Age 65 by RaceTrends
Calendar Year All Races White Black
At Birth
1960 697 706 636
1980 737 744 681
1990 754 761 691
2000 768 773 718
2005 776 780 730
2010 787 789 751
2011 787 790 753
2012 788 791 755
2013 788 791 755
At Age 65
1960 143 144 139
1980 164 165 151
1990 172 173 154
2000 176 177 161
2005 184 185 169
2010 191 192 178
2011 192 192 180
2012 193 193 181
2013 193 193 181
SOURCE Centers for Disease Control and Prevention National Center for Health Statistics National Vital Statistics System
14
Table I16 Medicaid and CHIP Enrollment
Fiscal Year 1995 2000 2005 2010 2014 2015
Average monthly enrollment in millions Total 342 345 465 535 648 689 Age 65 years and over 37 37 46 47 54 56 BlindDisabled 58 67 81 95 98 102 Children 165 162 223 263 294 296 Adults 67 69 106 121 192 224 Other Title XIX1 06 NA NA NA NA NA Territories 08 09 10 10 10 10
CHIP NA 20 59 54 60 58
1In 1997 the Other Title XIX category was dropped and the enrollees therein were subsumed in the remaining categories
NOTES Aged and BlindDisabled eligibility groups include Qualified Medicare Beneficiaries (QMB) and Specified Low-Income Medicare Beneficiaries (SLMB) Children and Adult groups include both AFDCTANF and poverty-related recipients who are not disabled Medicaid enrollment excludes Medicaid expansion and CHIP programs CHIP numbers include adults covered under waivers Medicaid and CHIP figures for FY 2014-2015 are estimates from the Presidents FY 2016 budget Enrollment for Territories for FY 2000 and later is estimated Numbers may not add to totals because of rounding
SOURCES CMS Office of the Actuary and the Center for Medicaid and CHIP Services
15
Table I17 Medicaid EligiblesDemographics
Medicaid Percent Eligibles Distribution
In millions Total eligibles 709 1000
Age 709 1000 Under 21 353 499 21-64 years 272 384 65 years and over 67 95
Unknown 16 22
Sex 709 1000 Male 296 418 Female 412 581 Unknown 01 01
Race 709 1000 White not Hispanic 285 403
Black not Hispanic 155 218 Am IndianAlaskan Native 09 12
Asian 24 33 HawaiianPacific Islander 07 09
Hispanic 175 247 Other 03 05 Unknown 51 72
NOTES Fiscal Year 2012 data derived from MSIS Granular Database The percent distribution is based on unrounded numbers Totals do not necessarily equal the sum of rounded components Eligible is defined as anyone eligible and enrolled in the Medicaid program at some point during the fiscal year regardless of duration of enrollment receipt of a paid medical service or whether or not a capitated premium for managed care or private health insurance coverage has been made Age groups are determined using the eligiblersquos age at the end of the fiscal year Excludes beneficiaries ever enrolled in separate Title XXI Childrenrsquos Health Insurance Program (CHIP) Excludes data for Colorado Idaho and Maine and includes partial data for Arizona and Washington DC
SOURCE CMS Center for Medicaid and CHIP Services
16
Table I18 Medicaid EligiblesCMS Region
Enrollment as Resident
population1 Medicaid
enrollment2 percent of population
In thousands
All regions 305996 70895 232 Boston 13250 2964 224
New York 28483 7452 262 Philadelphia 30264 5828 193 Atlanta 62387 13582 218 Chicago 51953 11767 226 Dallas 39550 9206 233 Kansas City 13843 2578 186 Denver 5973 830 139
San Francisco 48767 14453 296 Seattle 11526 2235 194
1Estimated July 1 2012 population 2Persons ever enrolled in Medicaid during fiscal year 2012
NOTES Numbers may not add to totals because of rounding Excludes data for Colorado Idaho and Maine and includes partial data for Arizona and Washington DC Excludes enrollees ever enrolled in separate Title XXI Childrens Health Insurance Program (CHIP)
SOURCES CMS Center for Medicaid and CHIP Services US Department of Commerce Bureau of the Census
Table I19 Medicaid BeneficiariesState Buy-Ins for Medicare
1975 1 1980 1 2000 2 2014 2
Type of Beneficiary In thousands All buy-ins 2846 2954 5549 9273 Aged 2483 2449 3632 5340 Disabled 363 504 1917 3932
Percent of SMI enrollees All buy-ins 120 109 149 185 Aged 114 100 111 127 Disabled 187 189 402 481
1Beneficiaries for whom the State paid the SMI premium during the year 2Beneficiaries in person years
NOTES Numbers may not add to totals because of rounding Includes outlying areas foreign countries and unknown
SOURCE CMS Office of Enterprise Data and Analytics
17
18
ProvidersSuppliers
Information about institutions agencies or professionals who provide health care services and individuals or organizations who furnish health care equipment or supplies
These data are distributed by major providersupplier categories by geographic region and by type of program participation Utilization data organized by type of providersupplier may be found in the Utilization section
19
Table II1 Inpatient HospitalsTrends
1990 2000 2010 2014 Total hospitals 6522 5985 6169 6142 Beds in thousands 1105 991 928 931 Beds per 1000 enrollees1 328 253 196 173 Short-stay 5549 4900 3566 3466 Beds in thousands 970 873 785 784 Beds per 1000 enrollees1 288 223 166 146 Critical access hospitals NA NA 1325 1334 Beds in thousands --- --- 30 31 Beds per 1000 enrollees1 --- --- 06 06 Other non-short-stay 973 1085 1278 1342 Beds in thousands 135 118 113 116 Beds per 1000 enrollees1 40 30 24 22 1Based on number of total HI enrollees as of July 1 for years 1990 2000 and 2010 Based on person-year HI enrollee count for 2014
NOTES Facility data are as of December 31 and represent essentially those facilities eligible to participate at the start of the next calendar year Facilities certified for Medicare are deemed to meet Medicaid standards
SOURCE CMS Office of Enterprise Data and Analytics
Table II2 Inpatient HospitalsCMS Region
Short-stay Beds per Non Beds per and CAH 1000 Short-stay 1000 hospitals enrollees hospitals enrollees
All regions 4800 152 1342 22
Boston 178 119 64 35 New York 300 159 73 21 Philadelphia 360 133 131 24 Atlanta 883 156 249 18 Chicago 857 165 204 18 Dallas 764 179 350 38 Kansas City 460 189 62 18 Denver 312 160 50 25 San Francisco 475 133 130 16 Seattle 211 108 29 14 NOTES Critical Access Hospitals have been grouped with short stay Facility data as of Decem-ber 31 2014 Rates based on person-year hospital insurance enrollee count for 2014
SOURCE CMS Office of Enterprise Data and Analytics
20
Table II3 Medicare Hospital and SNFNFICF Facility Counts
Total participating hospitals 6142
Short-term hospitals 3466 Psychiatric units 1114 Rehabilitation units 915
Swing bed units 502 Psychiatric 551 Long-term 423 Rehabilitation 255
Childrenrsquos 98 Religious non-medical 15 Critical access 1334
Non-participating Hospitals 788 Emergency 436 Federal 352
All SNFsSNF-NFsNFs only 15637 All SNFsSNF-NFs 15179
Title 18 Only SNF 767 Hospital-based 188 Free-standing 579 Title 1819 SNFNF 14412 Hospital-based 573 Free-standing 13839
Title 19 only NFs 458 Hospital-based 102
Free-standing 356
All ICFIID facilities 6323
NOTES Data as of December 31 2014 Numbers may differ from other reports and program memoranda
SOURCE CMS Office of Enterprise Data and Analytics
21
Table II4 Long-Term FacilitiesCMS Region
Title XVIII and Nursing XVIIIXIX SNFs Facilities ICFIIDs
All regions 1 15179 458 6323
Boston 934 9 123 New York 995 2 586 Philadelphia 1366 39 389 Atlanta 2649 44 697 Chicago 3346 94 1387 Dallas 2050 50 1552 Kansas City 1405 113 200 Denver 591 35 111 San Francisco 1406 54 1198 Seattle 437 18 80 1 Includes outlying areas
NOTE Data as of December 2014
SOURCE CMS Office of Enterprise Data and Analytics
Table II5 Other Medicare Providers and SuppliersTrends
1980 1990 2010 2014
Home health agencies 2924 5661 10914 12268 Independent and Clinical Lab Improvement Act Facilities NA 4828 224679 250247 End stage renal disease facilities 999 1987 5631 6374 Outpatient physical therapy andor speech pathology 419 1144 2536 2102 Portable X-ray 216 435 561 536 Rural health clinics 391 517 3845 4062 Comprehensive outpatient rehabilitation facilities NA 184 354 216 Ambulatory surgical centers NA 1165 5316 5444 Hospices NA 772 3509 4140 NOTES Facility data for 1980 are as of July 1 Facility data for 1990 2010 and 2014 are as of December 31
SOURCE CMS Office of Enterprise Data and Analytics
22
Table II6 Selected FacilitiesType of Control
Skilled Short-stay nursing Home health hospitals facilities agencies
Total facilities 3466 15179 12268
Percent of total
Non-profit 595 239 152
Proprietary 213 706 798
Government 192 55 49
NOTES Data as of December 31 2014 Facilities certified for Medicare are deemed to meet Medicaid standards
SOURCE CMS Office of Enterprise Data and Analytics
Table II7 Periodic Interim Payment (PIP) FacilitiesTrends
1980 1990 2000 2012 2014
Hospitals Number of PIP
Percent of total participating
2276
338
1352
206
869
144
568
92
478
78
Skilled nursing facilities Number of PIP
Percent of total participating
203
39
774
73
1236
83
345
23
332
22
Home health agencies Number of PIP
Percent of total participating
481
160
1211
210
1038
144
141
12
146
12
NOTES These are facilities receiving Periodic Interim Payments (PIP) under Medicare Effec-tive for claims received on or after July 1 1987 the Omnibus Budget Reconciliation Act of 1986 eliminates PIP for many PPS hospitals when the servicing Part A MAC meets specified processing time standards
SOURCE CMS Center for Medicare
23
Table II8 Medicare Non-Institutional Providers by Specialty1
Count Total Providers 1173802
Primary Care 221469
Surgical Specialties 108447 Medical Specialties 142488
Anesthesiology 40453
ObstetricsGynecology 34606
Radiology 36713
Emergency Medicine 44399
Non-Physician Practitioners 332556
Limited Licensed Practitioners 104702
All Other Providers 131570
1 Providers utilized by Original Medicare beneficiaries for all Part B non-institutional provider services Providers may be counted in more than one specialty classification but are reported as a single provider in the Total Providers count
NOTE Data for calendar year 2014 as reported on the Original Medicare claims
SOURCE CMS Office of Enterprise Data and Analytics
Table II9
Medicare DMEPOS Providers by Specialty1
Count Total DMEPOS Providers 88033
Pharmacy 50338
Medical Supply Company 11257 Optometry 6276
Podiatry 5575
Individual Certified ProsthetistOrthotist 2704
Optician 2460
All Other DMEPOS Providers 9895
1Providers utilized by Original Medicare beneficiaries for all Part B non-institutional DMEPOS services Providers may be counted in more than one specialty classification but are reported as a single provider in the Total DMEPOS Providers count
NOTE Data for calendar year 2014 as reported on the Original Medicare claims
SOURCE CMS Office of Enterprise Data and Analytics
24
Expenditures
Information about spending for health care services by Medicare Medicaid CHIP and for the Nation as a whole
Health care spending at the aggregate levels is distributed by source of funds types of service geographic area and broad beneficiary or eligibility categories Direct out-of-pocket other private and non-CMS-related expenditures are also covered in this section Expenditures on a per-unit-of-service level are covered in the Utilization section
25
Table III1 CMS and Total Federal Outlays
Fiscal year Fiscal year 2013 2014
$ in billions Gross domestic product (current dollars) $166186 $172440 Total Federal outlays1 34546 35061 Percent of gross domestic product 208 203 Dept of Health and Human Services1 8863 9360 Percent of Federal Budget 257 267 CMS Budget (Federal Outlays)
Medicare benefit payments 5774 5913 SMI transfer to Medicaid2 05 07
Medicaid benefit payments 2488 3015 Medicaid State and local admin 145 152 Medicaid offsets3 -05 -07
Childrens Health Ins Prog 95 90 CMS program management 37 36 Other Medicare admin expenses4 20 20 State Eligibility Determinations for Part D 00 00 Quality Improvement Organizations5 05 05 Health Care Fraud and Abuse Control 16 14 State Grants and Demonstrations6 05 05 User Fees and Reimbursables 07 05 Total CMS outlays (unadjusted) 8447 9103 Offsetting receipts7 -970 -945 Total net CMS outlays 7477 8158 Percent of Federal budget 216 233 1Net of offsetting receipts 2SMI transfers to Medicaid for Medicare Part B premium assistance ( $477 million in FY 2013 and $688 million in FY 2014) 3SMI transfers for low-income premium assistance 4Medicare administrative expenses of the Social Security Administration and other Federal agen-cies 5Formerly peer review organizations (PROs) 6Includes grants and demonstrations for various free-standing programs such as the Ticket to Work and Work Incentives Improvement Act (PL 106-170) emergency health services for undocument-ed aliens (PL108-173) and Medicaids Money Follows the Person Rebalancing Demonstration (PL 109-171)7Almost entirely Medicare premiums Also includes offsetting collections for user fee and reim-bursable activities as well as refunds to the trust funds
SOURCE CMS Office of Financial Management
26
Table III2 Program ExpendituresTrends
Total Medicare1 Medicaid2 CHIP3
$ in billions Fiscal year
1980 $608 $350 $258 --
1990 1822 1097 725 --
2000 4287 2190 2080 $17
2010 9409 5256 4039 114
2014 10820 5987 4703 130
1Medicare amounts reflect gross outlays (ie not net of offsetting receipts) These amounts include outlays for benefits administration Health Care Fraud and Abuse Control (HCFAC) activities Quality Improvement Organizations (QIOs) the SMI transfer to Medicaid for Medicare Part B premium assistance for low-income Medicare beneficiaries and since FY 2004 the admin-istrative and benefit costs of the Transitional Assistance and Part D Drug benefits under the Medicare Modernization Act of 2003
2The Medicaid amounts include total computable outlays (Federal and State shares) for benefits and administration the Federal and State shares of the cost of Medicaid surveycertification and State Medicaid fraud control units and outlays for the Vaccines for Children program These amounts do not include the SMI transfer to Medicaid for Medicare Part B premium assistance for low-income beneficiaries nor do they include the Medicare Part D compensation to States for low-income eligibility determinations in the Part D Drug program
3The CHIP amounts reflect both Federal and State shares of Title XXI outlays Please note that CHIP-related Medicaid began to be financed under Title XXI in 2001
NOTE Numbers may not add to totals because of rounding
SOURCE CMS Office of Financial Management
27
Table III3 Annual Benefit Outlays by Program
1967 1980 2010 2014
Amounts in billions CMS program outlays $51 $578 $915 $1081
Federal outlays NA 472 793 891
Medicare1 32 339 518 598
HI 25 238 250 271
SMI 07 101 209 262
Prescription (Part D) NA NA 59 65
Medicaid2 19 239 386 470
Federal share NA 132 266 284
CHIP3 NA NA 11 13
Federal share NA NA 8 9
1The Medicare benefit amounts reflect gross outlays (ie not net of offsetting premiums) These amounts exclude outlays for the SMI transfer to Medicaid for premium assistance and the Quality Improvement Organizations (QIOs)
2The Medicaid amounts include total computable outlays (Federal and State shares) for Medicaid benefits and outlays for the Vaccines for Children program
3The CHIP amounts reflect both Federal and State shares of Title XXI outlays as reported by the States on line 4 of the CMS-21 Please note that CHIP-related Medicaid expansions began to be financed under CHIP (Title XXI) in FY 2001
NOTES Fiscal year data Numbers may not add to totals because of rounding
SOURCE CMS Office of Financial Management
28
Table III4 Program Benefit PaymentsCMS Region
Fiscal Year 2013 Net Expenditures Reported1
Medicaid Total Payments Computable for Federal funding Federal Share
In millions All regions $433131 $248800
Boston 26805 13956 New York 64834 32757 Philadelphia 42670 23556 Atlanta 67823 44435 Chicago 68180 40640 Dallas 46561 29266 Kansas City 16822 10134 Denver 10214 5812 San Francisco 73363 39201 Seattle 15859 9043 1Data from Form CMS-64--Net Expenditures Reported by the States Medical assistance payments only excludes administrative expenses and Childrens Health Insurance Program (CHIP) Unad-justed by CMS NOTE Numbers may not add to totals because of rounding
SOURCE CMS Office of Enterprise Data and Analytics
Table III5 Medicare Benefit Outlays
Fiscal Year 2013 2014 2015
In billions Part A benefit payments $2618 $2618 $2681
Aged 2179 2176 2232
Disabled 439 442 449
Part B benefit payments 2431 2566 2729 Aged 1971 2079 2215 Disabled 459 487 513
Part D 680 722 838 NOTES Based on 2015 Trustees Report Part A benefits include additional payments for HIT CBC IPAB and Sequester Part B benefits include additional payments for HIT IPAB and Sequester Part D benefits include additional payments for IPAB Ageddisabled split of Part D benefit outlays not available Totals do not necessarily equal the sum of rounded components
SOURCE CMS Office of the Actuary 29
Table III6 MedicareType of Benefit
Fiscal Year 2015 Benefit Percent Payments1 in millions Distribution
Total Part A23 $268084 1000 Inpatient hospital 136415 509 Skilled nursing facility Home health agency4
29928 6865
11226
Hospice 16056 60 Managed care Total Part B35
78821 272877
294 1000
Physicianother suppliers6 69199 254 DME 6502 24 Other carrier 21184 78 Outpatient hospital Home health agency4
43574 11491
16042
Other intermediary 19459 71 Laboratory 8534 31 Managed care Total Part D7
92934 83845
341 1000
1Includes the effects of regulatory items and recent legislation but not proposed law 2Includes HIT CBC IPAB and Sequester expenditures 3Excludes QIO expenditures 4Distribution of home health benefits between the trust funds estimated based on outlays reported to date by the Treasury 5Includes HIT IPAB and Sequester expenditures 6Includes payments made for HIT 7Includes payments made for IPAB
NOTES Based on 2015 Trustees Report Benefits by type of service are estimated and are subject to change Totals do not necessarily equal the sum of rounded components
SOURCE CMS Office of the Actuary
Table III7 National Health CareTrends
Calendar Year 1990 2000 2013
National total in billions $7243 $13780 $29191 Percent of GDP 121 134 174 Per capita amount $2855 $4881 $9255 Sponsor Percent of total Private Business 246 251 209 Household 349 315 282 Other Private Revenues 79 78 75 Governments 326 355 434 Federal government 173 190 259 State and local government 153 165 174 NOTE Numbers may not add to totals because of rounding
SOURCES CMS Office of the Actuary US Department of Commerce Bureau of Economic Analysis and US Bureau of the Census
30
Table III8 MedicaidType of Service
Fiscal Year 2011 2012 2013
In billions Total medical assistance payments1 $4075 $4088 $4331
Percent of Total Inpatient services 157 145 145 General hospitals 148 137 137
Mental hospitals 09 08 08 Nursing facility services 125 123 117 ICFIID services 33 33 28 Community-based long term care svs2 135 135 130 Prescribed drugs3 36 21 15 Physician and other practitioner services 40 35 33 Dental services 13 11 09 Outpatient hospital services 42 38 39 Clinic services4 27 26 24 Laboratory and radiological services 04 04 04 Early and periodic screening 03 03 03 Case management services 07 07 07 Capitation payments (non-Medicare) 252 291 319 Medicare premiums 35 33 32 Disproportionate share hosp payments 42 42 38 Other services 66 72 74 Collections5 -18 -20 -16 1Excludes payments under CHIP
2Comprised of home health home and community-based waivers personal care and home and community-based services for functionally disabled elderly
3Net of prescription drug rebates 4Federally qualified health clinics rural health clinics and other clinics 5Includes third party liability probate fraud and abuse overpayments and other collections
NOTE Numbers may not add to totals because of rounding
SOURCES CMS CMCS and OACT
31
Table III9 Medicare Savings Attributable to Secondary Payer
Provisions by Type of Provision Fiscal Year
2012 2013 2014 In millions Total $78622 $89258 $81999 Workers Compensation1 18419 18885 17117 Working Aged 31265 38384 35458 ESRD 2960 3031 2709 Auto 2122 1901 1729 Disability 18406 21196 19968 Liability 5232 5663 4885 VAOther 217 198 133 1Includes Workersrsquo Compensation set-asides
NOTES Includes Liability savings of the global settlements recovered by CMS Numbers may not add to totals because of rounding
SOURCE CMS Office of Financial Management
Table III10 MedicaidPayments by Eligibility Status
Fiscal Year 2013 Medical Assistance Percent
Payments Distribution In billions Total1 $4331 1000
Age 65 years and over 815 188 Blinddisabled 1752 404 Dependent children under 21 years of age 782 180 Adults in families with dependent children 645 149 Disproportionate share hospital and other unallocated payments2 338 78 1Excludes payments under Childrens Health Insurance Program (CHIP)
2Includes collections prior period adjustments and payments to territories
SOURCE CMS Office of the Actuary
32
Table III11 MedicareDMEPOS1
BETOS Category Allowed Charges2
2013 2014 In thousands
Total $10147264 $8686710
Medicalsurgical supplies 193817 204469 Hospital beds 183537 119600 Oxygen and supplies 1679612 1429545 Wheelchairs 806018 617261 Prostheticorthotic devices Drugs admin through DME3
2444878 770702
2363720 827574
Parenteral and enteral nutrition 604248 512214 Other DME 3464453 2612327 1Data are for calendar year DME=durable medical equipment POS=Prosthetic orthotic and supplies
2The allowed charge is the Medicare approved payment reported on a line item on the physician supplier claim
3Includes inhalation drugs administered through nebulizers only and does not include drugs administered through other DME such as infusion pumps
NOTE Over time the composition of BETOS categories has changed with the reassignment of selected procedures services and supplies Data for 2013 and 2014 as reported in the CMS Chronic Conditions Data Warehouse
SOURCE CMS Office of Enterprise Data and Analytics
33
Table III12 National Health CareType of Expenditure
National Per Percent Paid Total capita
in billions amount Total Medicare Medicaid Total $29191 $9255 355 201 154 Health Consumption Expenditures 27545 8733 376 213 163 Personal health care 24686 7826 389 223 166 Hospital care 9369 2970 434 259 175 Prof services 7779 2466 272 191 81 Physclinical 5867 1860 307 222 85 Other Professional 802 254 287 225 62 Dental 1110 352 72 04 68 Other Health Residential amp Personal Care 1482 470 591 34 557 Nursing Care Facilities amp
Continuing Care Retirement Communities 1558 494 523 222 301
Home Health 798 253 796 431 365 Retail outlet sales 3700 1173 300 230 70 Admn Net Cost and public health 2860 907 258 123 135 Investment 1646 522 -- -- --NOTE Data are as of calendar year 2013
SOURCE CMS Office of the Actuary Table III13
Personal Health CarePayment Source Calendar Year
1980 1990 2000 2013 In billions Total $2172 $6168 $11657 $24686
PercentTotal 1000 1000 1000 1000 Out of pocket 269 225 173 137 Health Insurance 607 654 725 773 Private Health Insurance 283 332 349 343 Medicare 167 174 186 223 Medicaid (Title XIX) 114 113 160 166 Total CHIP (Title XIX and Title XXI) -- -- 02 05 Department of Defense 18 17 11 15 Department of Veterans Affairs 26 18 16 22 Other Third Party Payers and Programs 124 121 102 90 NOTES Excludes administrative expenses the net cost of insurance non-commercial medical research investment in structures and equipment and public health expenditures Numbers may not add to totals because of rounding SOURCE CMS Office of the Actuary
34
Utilization
Information about the use of health care services
Utilization information is organized by persons receiving services and alternately by services rendered Measures of health care usage include persons served units of service (eg discharges days of care etc) and dimensions of the services rendered (eg average length of stay charge per person or per unit of service) These utilization measures are aggregated by program coverage categories provider characteristics type of service and demographic and geographic variables
35
Table IV1 MedicareShort-Stay Hospital Utilization
1990 2000 2013 2014 Discharges Total in millions 105 117 107 104 Rate per 1000 enrollees1 320 362 289 280
Days of care Total in millions 94 70 58 56 Rate per 1000 enrollees1 2866 2175 1548 1500
Average length of stay All short-stay 90 60 54 54 Excluded units 195 123 119 119
Total charges per day $1060 $2720 $8873 $9338
1The population base for the denominator is the July 1 HI Original Medicare enrollment for years 1990 and 2000 For 2013 and 2014 the HI Original Medicare enrollee counts are based on a person-year methodology
NOTES Data may reflect underreporting due to a variety of reasons including operational difficulties experienced by intermediaries no-pay at-risk managed care utilization no-pay Medi-care secondary payer bills and for certain years discharges where the beneficiary received services out of State Data may differ from other sources or from the same source with a different update cycle
SOURCE CMS Office of Enterprise Data and Analytics
Table IV2 Medicare Long-Term CareTrends
Skilled Nursing Facilities Home Health Agencies
Persons Served Persons Served Served in per 1000 Served in per 1000 thousands enrollees thousands enrollees
Calendar year 1985 315 10 1576 51 1990 638 19 1978 58 1995 1233 37 3468 103 2000 1468 451 2461 751
2005 1847 511 2976 811
2010 1839 521 3605 1001
2014 1827 491 3601 961
1Managed care enrollees excluded in determining rate
SOURCE CMS Office of Enterprise Data and Analytics
36
Table IV3 Medicare Average Length of StayTrends
Fiscal Year
1990 1995 2000 2010 2014 All short-stay and excluded units Short-stay PPS units 90 71 60 51 50 Short-stay hospital non-PPS units 89 71 60 51 56 Excluded units 195 148 123 118 119
NOTES Fiscal year data Average length of stay is shown in days Data for 1990 through 2014 are based on 100-percent MEDPAR stay record file Data may differ from other sources or from the same source with a different update cycle
SOURCE CMS Office of Enterprise Data and Analytics
Table IV4 Medicare Persons ServedTrends
Calendar Year 1975 1985 1995 2005 2010 2014
Aged persons served per 1000 enrollees
HI andor SMI 528 722 826 923 919 890 HI 221 219 218 234 237 197
SMI 536 739 858 979 988 979
Disabled persons served per 1000 enrollees
HI andor SMI 450 669 759 865 897 943 HI 219 228 212 205 213 198
SMI 471 715 837 977 1007 1028
NOTES Prior to 2000 data were obtained from the Annual Person Summary Record and were not yet modified to exclude persons enrolled in managed care Beginning in 2000 the rates were adjusted to exclude managed care enrollees Persons served represents estimates of beneficiaries receiving services under Original Medicare during the calendar year
SOURCE CMS Office of Enterprise Data and Analytics
37
Table IV5 Original Medicare Persons Served
Year
2010 2011 2012 2013 2014 HI Aged
Original Medicare Enrollees 290 293 300 305 307 Persons served 69 63 63 62 61 Rate per 1000 237 217 208 202 197
Disabled Original Medicare Enrollees 66 68 69 67 66
Persons served 14 14 14 13 13 Rate per 1000 213 201 196 197 198
SMI Aged
Original Medicare Enrollees 264 266 270 276 278 Persons served 261 262 267 270 272 Rate per 1000 988 987 989 977 979
Disabled Original Medicare Enrollees 58 60 60 61 60
Persons served 58 61 62 62 62 Rate per 1000 1007 1023 1027 1019 1028
NOTES For years 2010-2012 enrollment represents persons enrolled in Original Medicare as of July For 2013 and 2014 Medicare enrollment is based on a person-year methodology Persons served represents counts of beneficiaries receiving reimbursed services under Original Medicare during the calendar year Rate is the ratio of persons served during the calendar year to the number of Original Medicare enrollees
Original Medicare enrollees and persons served counts are in millions
SOURCE CMS Office of Enterprise Data and Analytics
38
Table IV6 Medicare Persons ServedCMS Region
Disabled Aged Persons Served Persons Served
Served per 1000 Served in per 1000 in thousands Enrollees thousands Enrollees
All Regions1 27634 890 6251 943 Boston 1533 878 376 948
New York 2513 847 518 870 Philadelphia 2928 893 639 949 Atlanta 6018 927 1482 975 Chicago 4832 967 1174 976 Dallas 3107 887 745 935 Kansas City 1503 919 325 961 Denver 926 923 168 966
San Francisco 3196 845 598 897 Seattle 1063 862 225 906
1Includes utilization for residents of outlying territories possessions foreign countries and unknown NOTES Data are based on counts of beneficiaries receiving HI andor SMI reimbursed services under Original Medicare during calendar year 2014 Numbers may not add to totals because of rounding
SOURCE CMS Office of Enterprise Data and Analytics
Table IV6a Original Medicare Persons Served by Type of Service
Disabled Total Persons Aged Persons Persons
Served in Served in Served in thousands thousands thousands
Parts A andor B 33885 27634 6251
Part A 7372 6061 1312 Inpatient hospital 6383 5134 1248 Skilled nursing facility 1827 1650 177 Home health agency 1657 1440 217 Hospice 1331 1257 73
Part B 33401 27211 6190 Physiciansupplier 32745 26745 6000 Outpatient 25083 20280 4803
Home health agency 1945 1677 268
NOTES Data are as of calendar year 2014 Persons served represents counts of beneficiaries receiving services under Original Medicare during the calendar year
SOURCE CMS Office of Enterprise Data and Analytics
39
Table IV7 Medicare End Stage Renal Disease (ESRD) by Treatment Modalities
Medicare Entitled Dialysis Transplant
Year Total Patients Patients 1991 180625 141069 39556 1999 316167 244869 71298 2000 332885 257686 75199 2001 349207 270016 79191 2002 364956 281327 83629 2003 377592 291782 85810 2004 393301 301866 91435 2005 408378 312008 96370 2006 425039 323545 101494 2007 441030 334995 106035 2008 457660 347212 110448 2009 475292 360537 114755 2010 492713 373483 119230 2011 507324 383420 123904
SOURCE United States Renal Data System
Table IV8 Medicare End Stage Renal Disease (ESRD)
by Treatment Modalities and Demographics 2010 Medicare Entitled
Total Dialysis Patients
Transplant Patients
Total--all patients 492713 373483 119230 Age 0-19 years 3196 1452 1744 20-64 years 278262 195727 82535 65-74 years 118721 90823 27898 75 years and over 92534 85481 7048 Sex Male 280229 208505 71724
Female 212484 164978 47506 Race
White 295864 211046 84818 Black 164299 137796 26503 Native American 6646 5428 1218 AsianPacific 23830 17901 5929 OtherUnknown 2074 1312 762 SOURCE United States Renal Data System
40
Table IV9 MedicaidType of Service
Fiscal year 2012 Medicaid Beneficiaries
In thousands Total eligibles 70895
Number using service
Total beneficiaries any service1 63312
Inpatient services General hospitals 7601
Mental hospitals Nursing facility services2
42 1415
ICFIID services 95 Physician services 42770 Dental services 18223 Other practitioner services 9399 Outpatient hospital services 26292 Clinic services 15744 Laboratory and radiological services 28131 Home health services 1696 Prescribed drugs 38695 Personal care support services 1189 Sterilization services 285 PCCM capitation 9266 HMO capitation 39360 PHP capitation 19301 Targeted case management 2579 Other services unspecified 15873 Additional service categories 12848 Unknown 524
1Excludes gross adjustment claims for services received by individual patients that come in the form of a lump sum payment covering services to more than one patient 2All nursing facility services Unlike Medicare there is no distinction for SNFs
NOTES The methodology used is different from previous updates for this table and data were derived from the MSIS Granular Database Beneficiary counts include Medicaid eligibles enrolled in fee-for-service and Medicaid managed care Excludes data for Colorado Idaho and Maine and includes partial data for Arizona and Washington DC Excludes CHIP
SOURCE CMS Center for Medicaid and CHIP Services
41
Table IV10 MedicaidUnits of Service
Fiscal Year 2012 Units of Service
In thousands Inpatient hospital Total discharges 7536
Beneficiaries discharged 6778 Total days of care 43765
Nursing facility Total days of care 290962
ICFIID Total days of care 26733
NOTES Data are derived from the MSIS Granular Database Service counts produced using inpatient and long term care original fee-for-service and Medicaid managed care claims Excludes enrollees ever enrolled in separate Title XXI CHIP program and beneficiaries that had claims but no matching Medicaid enrollment in 2012 Excludes data for Colorado Idaho and Maine and includes partial data for Arizona and Washington DC
SOURCE CMS Center for Medicaid and CHIP Services
42
AdministrativeOperating
Information on activities and services related to oversight of the day-to-day operations of CMS programs
Included are data on Medicare contractors contractor activities and performance CMS and State agency administrative costs quality control and summaries of the operation of the Medicare trust funds
43
Table V1 Medicare Administrative ExpensesTrends
Administrative Expenses As a Percent of
Fiscal Year Amount in millions Benefit Payments HI Trust Fund 1967 $89 35 1970 149 31 1980 497 21 1990 774 12 1995 1300 11 2000 1 2350 18 2005 1 2850 16 2010 3328 14 2012 3696 15 2013 4135 16 2014 4332 17
SMI Trust Fund2
1967 1353 203 1970 217 110 1980 593 58 1990 1524 37 1995 1722 27 2000 1780 20 2005 2348 16 2010 3513 13 2012 4130 14 2013 3756 12 2014 4297 13
1Includes non-expenditure transfers for Health Care Fraud and Abuse Control
2Starting in FY 2004 includes the transactions of the Part D account
3Includes expenses paid in fiscal years 1966 and 1967
SOURCE CMS Office of Actuary
44
Table V2 Medicare Administrative Contractors
Number
AB MACs 13
DME MACs 4
NOTE Data as of August 2015
SOURCE CMS Center for Medicare
Table V3 Medicare Redeterminations
Intermediary Intermediary Carrier Redeterminations Redeterminations Redeterminations
(Part A Cases Involved)
(Part B Cases Involved)
(Part B Cases Involved)
Number Processed 385016 229134 2624982
Percent Reversed 123 463 392 (Includes Fully amp Partially Reversed Cases)
NOTES Data for fiscal year 2014 Data presented in cases
SOURCE CMS Center for Medicare
Table V4 Medicare PhysicianSupplier Claims Assignment Rates
2000 2005 2010 2012 2013 2014 In millions
Claims total 7205 9516 9727 10032 9946 9952 Claims assigned 7057 9407 9657 9974 9892 9899 Claims unassigned 153 109 70 58 54 53
Percent assigned 979 989 993 994 995 995
NOTE Calendar year data (includes Carriers Part B AB MACs DME MACs) Due to the ongoing transition from Carriers to Part B MACs this table has been altered to solely reflect assignment rates at the National level
SOURCE CMS Center for Medicare
45
Table V5 Medicare Claims Processing
Fiscal Year 2014
Part A claims processed in millions 2100
Part B claims processed in millions1 10030
1Includes replicate claims (as reported in prior years)
SOURCE CMS Center for Medicare
Table V6 Medicare Claims Received
Claims received
Intermediary claims
received in millions 2113
Percent of total
Inpatient hospital 70
Outpatient hospital 546
Home health agency 73
Skilled nursing facility 27
Other 284
Carrier claims received in millions 9904
Percent of total
Assigned 995
Unassigned 05
NOTE Data for calendar year 2014
SOURCE CMS Center for Medicare
46
Table V7 Medicare Charge Reductions
Assigned Unassigned
Claims approved
Number in millions 8806 42
Percent reduced 951 790
Total covered charges
Amount in millions $347953 $519
Percent reduced 634 216
Amount reduced per claim $25034 $2678 NOTES Data for calendar year 2014 Charge reductions include reasonable charge medical necessity and global feerebundling reductions
SOURCE CMS Center for Medicare
Table V8 Medicaid Administration
Fiscal Year 2013 2014
In millions Total payments computable for Federal funding1 $22938 $24418
Federal share1
Family Planning 32 30 Design development or
installation of MMIS2 533 663 Skilled professional
medical personnel 440 487 Operation of an
approved MMIS2 1550 1569 All other 11588 12359 Mechanized systems not approved under MMIS2 73 85
Total Federal Share $14216 $15193
Net adjusted Federal share3 $13682 $14675 1Source Form CMS-64 (Net Expenditures ReportedmdashAdministration) 2Medicaid Management Information System 3Includes CMS adjustments
SOURCE CMS Office of Enterprise Data and Analytics
47
48
Reference
Selected reference material including program financing cost-sharing features of the Medicare program and Medicaid Federal medical assistance percentages
49
Pro
gram
Fin
anci
ng
Cos
t S
har
ing
and
Lim
itat
ion
s
Med
icar
eS
ourc
e of
In
com
e
Med
icar
e P
art
A H
ospi
tal I
nsur
ance
trus
t fun
d 1
P
ayro
ll ta
xes
2
Inc
ome
from
taxa
tion
of
soci
al s
ecur
ity
bene
fits
3
Tra
nsfe
rs f
rom
rai
lroa
d re
tire
men
t acc
ount
4
Gen
eral
rev
enue
for
uni
nsur
ed p
erso
ns a
nd m
ilit
ary
wag
e c
redi
ts
5 P
rem
ium
s fr
om v
olun
tary
enr
olle
es
6 I
nter
est o
n in
vest
men
ts
Con
trib
utio
n ra
te
2014
20
15
2016
Per
cent
Em
ploy
ees
and
empl
oyer
s e
ach
145
1
45
145
S
elf-
empl
oyed
2
90
2
90
29
0
Max
imum
taxa
ble
amou
nt (
CY
201
6)
Non
e1
Vol
unta
ry H
I m
onth
ly p
rem
ium
2 $
411
00
Par
t A
(ef
fect
ive
dat
e)
Inpa
tien
t hos
pita
l
ded
ucti
ble
(11
16)
Reg
ular
coi
nsur
ance
d
ays
(11
16)
L
ifet
ime
rese
rve
days
(1
116
) S
NF
coi
nsur
ance
day
s
(11
16)
B
lood
ded
ucti
ble
Vol
unta
ry h
ospi
tal i
nsur
ance
prem
ium
(1
116
)2
Lim
itat
ion
s
Inpa
tien
t psy
chia
tric
hos
pita
ls
Am
oun
t
$12
88b
enef
it p
erio
d
$3
22d
ay f
or 6
1st
th
roug
h 90
th d
ay
$644
day
(60
non
-
rene
wab
le d
ays)
$161
day
for
21s
t
thro
ugh
100t
h da
y
firs
t 3 p
ints
cal
enda
r ye
ar
$411
mon
th $
226
mo
wit
h 30
-39
quar
ters
of c
over
age
19
0 no
nren
ewab
le d
ays
1 The
Om
nibu
s R
econ
cili
atio
n A
ct o
f 19
93 e
lim
inat
ed th
e A
nnua
l Max
imum
Tax
able
Ear
ning
s am
ount
s fo
r 19
94 a
nd la
ter
For
thes
e ye
ars
the
co
ntri
buti
on r
ate
is a
ppli
ed to
all
ear
ning
s in
cov
ered
em
ploy
men
t
2 Prem
ium
pai
d fo
r vo
lunt
ary
part
icip
atio
n of
indi
vidu
als
aged
65
and
over
not
oth
erw
ise
entit
led
to h
ospi
tal i
nsur
ance
and
cer
tain
dis
able
d in
divi
dual
sw
ho h
ave
exha
uste
d ot
her
enti
tlem
ent
A r
educ
ed p
rem
ium
of
$226
is a
vail
able
to in
divi
dual
s ag
ed 6
5 an
d ov
er w
ho a
re n
ot o
ther
wis
e en
titl
ed to
ho
spit
al in
sura
nce
but w
ho h
ave
or
who
se s
pous
e ha
s or
had
30-
39 q
uart
ers
of c
over
age
unde
r T
itle
II
of th
e So
cial
Sec
urit
y A
ct
SO
UR
CE
C
MS
Off
ice
of th
e A
ctua
ry
Pro
gram
Fin
anci
ng
Cos
t S
har
ing
and
Lim
itat
ion
s
Med
icar
e P
art
B
Sup
plem
enta
ry M
edic
al I
nsur
ance
trus
t fun
d 1
P
rem
ium
s pa
id b
y or
on
beha
lf o
f en
roll
ees
2 G
ener
al r
even
ue
3 I
nter
est o
n in
vest
men
ts
Par
t B
(ef
fect
ive
dat
e)
Am
oun
t D
educ
tibl
e (1
11
6) $
166
in a
llow
ed c
harg
esy
ear
Blo
od d
educ
tibl
e f
irst
3 p
ints
cal
enda
r ye
ar
Coi
nsur
ance
1 20
per
cent
of
allo
wed
cha
rges
M
onth
ly s
tand
ard
prem
ium
(1
116
) $
104
90m
onth
Lim
itat
ion
s O
utpa
tien
t tre
atm
ent f
or m
enta
l ill
ness
N
o li
mit
atio
ns
1 The
Par
t B d
educ
tibl
e an
d co
insu
ranc
e ap
plie
s to
mos
t ser
vice
s I
tem
s an
dor
ser
vice
s no
t sub
ject
to e
ithe
r th
e de
duct
ible
or
coin
sura
nce
are
cl
inic
al d
iagn
osti
c la
b te
sts
subj
ect t
o a
fee
sche
dule
hom
e he
alth
ser
vice
s it
ems
and
serv
ices
fur
nish
ed in
con
nect
ion
to o
btai
ning
a s
econ
d or
th
ird
opin
ion
and
som
e pr
even
tive
serv
ices
SO
UR
CE
C
MS
Off
ice
of th
e A
ctua
ry
Pro
gram
Fin
anci
ng
Cos
t S
har
ing
and
Lim
itat
ion
s
Med
icar
e P
art
B (
con
tin
ued
)
Lis
ted
belo
w a
re th
e 20
16 P
art B
mon
thly
pre
miu
m r
ates
to b
e pa
id b
y be
nefi
ciar
ies
who
fil
e an
indi
vidu
al ta
x re
turn
(inc
ludi
ng th
ose
who
are
sin
gle
hea
d of
hou
seho
ld q
ualif
ying
wid
ow(e
r) w
ith
depe
nden
t chi
ld o
r m
arri
ed f
ilin
g se
para
tely
w
ho li
ved
apar
t fro
m th
eir
spou
se f
or th
e en
tire
taxa
ble
year
) o
r a
join
t tax
ret
urn
Ben
efic
iari
es w
ho f
ile
an in
divi
dual
B
enef
icia
ries
who
fil
e a
join
t tax
In
com
e-re
late
d m
onth
lyT
otal
mon
thly
tax
retu
rn w
ith
inco
me
re
turn
wit
h in
com
e
adju
stm
ent a
mou
nt
prem
ium
am
ount
Les
s th
an o
r eq
ual t
o $8
500
0 L
ess
than
or
equa
l to
$170
000
$0
00
$121
80
Gre
ater
than
$85
000
and
less
than
Gre
ater
than
$17
000
0 an
d le
ss th
an
or e
qual
to $
107
000
or e
qual
to $
214
000
$4
870
$1
705
0
Gre
ater
than
$10
700
0 an
d le
ss th
an
G
reat
er th
an $
214
000
and
less
than
or
equ
al to
$16
000
0 or
equ
al to
$32
000
0
$121
80
$243
60
Gre
ater
than
$16
000
0 an
d le
ss th
an
G
reat
er th
an $
320
000
and
less
than
or
equ
al to
$21
400
0 or
equ
al to
$42
800
0
$194
90
$316
70
Gre
ater
than
$21
400
0 G
reat
er th
an $
428
000
$268
00
$389
80
In a
ddit
ion
the
mon
thly
pre
miu
m r
ates
to b
e pa
id b
y be
nefi
ciar
ies
who
are
mar
ried
and
live
d w
ith
thei
r sp
ouse
at a
ny ti
me
duri
ng th
e ta
xabl
e ye
ar b
ut f
ile
a se
para
te ta
x re
turn
fro
m th
eir
spou
se a
re li
sted
bel
ow
Tot
al m
onth
ly
spou
se a
nd f
iled
a s
epar
ate
tax
retu
rn
adju
stm
ent a
mou
nt
prem
ium
am
ount
M
arri
ed b
enef
icia
ries
who
live
d w
ith
thei
r In
com
e-re
late
d m
onth
ly
$121
80
Les
s th
an o
r eq
ual t
o $8
500
0 $0
00
$316
70
Gre
ater
than
$85
000
and
less
than
or
equa
l to
$129
000
$194
90
$389
80
Gre
ater
than
$12
900
0 $2
680
0
SO
UR
CE
C
MS
Off
ice
of th
e A
ctua
ry
Pro
gram
Fin
anci
ng
Cos
t S
har
ing
and
Lim
itat
ion
s
Med
icar
e P
art
D S
tan
dar
d B
enef
its
Ded
ucti
ble
(11
201
6)
$360
in c
harg
esy
ear
Init
ial c
over
age
lim
it (
11
2016
) $3
310
in c
harg
esy
ear
Out
-of-
pock
et th
resh
old
(11
201
6)
$48
50 in
cha
rges
yea
r B
ase
bene
fici
ary
prem
ium
(1
120
16)1
$34
10m
onth
Med
icai
d F
inan
cin
g 1
F
eder
al c
ontr
ibut
ions
(ra
ngin
g fr
om 5
0 to
74
perc
ent f
or f
isca
l yea
r 20
16)
2
Sta
te c
ontr
ibut
ions
(ra
ngin
g fr
om 2
6 to
50
perc
ent f
or f
isca
l yea
r 20
16)
1 The
bas
e be
nefi
ciar
y pr
emiu
m w
as c
alcu
late
d ba
sed
on a
nat
iona
l ave
rage
pla
n bi
d T
he a
ctua
l pre
miu
m th
at a
ben
efic
iary
pay
s va
ries
ac
cord
ing
to th
e pl
an in
whi
ch th
e be
nefi
ciar
y is
enr
olle
d
NO
TE
S
The
ben
efic
iari
es w
ho q
uali
fy f
or th
e lo
w-i
ncom
e su
bsid
y un
der
Par
t D p
ay a
red
uced
or
zero
pre
miu
m
In a
ddit
ion
low
-inc
ome
bene
fici
arie
s ar
e su
bjec
t to
only
min
imal
cop
aym
ent a
mou
nts
in m
ost i
nsta
nces
SO
UR
CE
C
MS
Off
ice
of th
e A
ctua
ry
Geographical Jurisdictions of CMS Regional Offices and Medicaid Federal Medical Assistance Percentages (FMAP) fiscal year 2016
I Boston FMAP II New York FMAP ConnecticutMaine
5000 6267
New Jersey New York
5000 5000
Massachusetts 5000 Puerto Rico 5500 New Hampshire 5000 Virgin Islands 5500 Rhode Island 5042 Vermont 5390 IV Atlanta
Alabama 6987 III Philadelphia
Delaware 5483 Dist of Columbia 7000
Maryland 5000 Pennsylvania 5201 Virginia 5000
West Virginia 7142
Florida Georgia
Kentucky Mississippi North Carolina South Carolina Tennessee
6067 6755 7032 7417 6624 7108 6505
V Chicago Illinois 5089
VI Dallas Arkansas 7000
Indiana 6660 Louisiana 6221 Michigan Minnesota
6560 5000
New Mexico Oklahoma
7037 6099
Ohio 6247 Texas 5713 Wisconsin 5823
VIII DenverVII Kansas City
Iowa 5491 Colorado
Montana 5072 6524
Kansas 5596 North Dakota 5000 Missouri 6328 South Dakota 5161 Nebraska 5116 Utah 7024
Wyoming 5000IX San Francisco
Arizona 6892 X Seattle California 5000 Alaska 5000
Hawaii 5398 Idaho 7124 Nevada 6493 Oregon 6438 American Samoa 5500 Washington 5000 Guam 5500 N Mariana Islds 5500
NOTE FMAPs are used in determining the amount of Federal matchingfunds for State expenditures for assistance payments
SOURCE DHHS Assistant Secretary for Planning and Evaluation
US Department of Health amp Human Services Centers for Medicare amp Medicaid Services Office of Enterprise Data and Analytics CMS Pub No 03512 December 2015
- Structure Bookmarks
-
- 2015 CMS Statistics
- Centers for Medicare amp Medicaid Services
- Office of Enterprise Data and Analytics
- Information Products Group
- Publication Coordinators
- Publication Staff
- Preface
- I Populations 5
- GDP
- NF
- Table I1
- Table I2 Medicare EnrollmentCoverage
- Table I3
- Table I5 Medicare ESRD EnrollmentTrends
- Table I6 Medicare ESRD EnrollmentDemographics
- All regions
- In thousands
- Table I10 Medicare Part D Enrollment by CMS Region
- Table I12 Medicare Part D and RDS EnrollmentCMS Region
- Table I13 Projected Population
- Table I14
- Table I15 Life Expectancy at Birth and at Age 65 by RaceTrends
- Table I18
- Table I19 Medicaid BeneficiariesState Buy-Ins for Medicare
- Total hospitals
- All regions
- Total participating hospitals
- Home health agencies
- Table II6
- Hospitals Number of PIP Percent of total participating
- Count
- Count
- Total
- 1967
- In millions
- 2013
- Total Part A23
- National total in billions
- Table III8
- In millions
- Total
- Discharges
- 1975
- 2010
- Table IV6
- Disabled
- Parts A andor B
- Dialysis
- Table
- In thousands
- (Part A Cases Involved)
- Table V4 Medicare PhysicianSupplier Claims Assignment Rates
- Table V6 Medicare Claims Received
- Table V7
- for Federal funding1
- I Boston
-
Expenditures
In fiscal year 2014 total net Federal outlays for CMS programs were $8158 billion 233 percent of the Federal budget (III1)
Medicare Part A benefit payments are projected to increase to $2681 billion for fiscal year 2015 up from $2618 billion for fiscal year 2014 and Medicare Part B benefit payments are projected to increase to $2729 billion for fiscal year 2015 up from $2566 billion for fiscal year 2014 (III5)
Medicare hospice benefit payments are projected to be $161 billion for fiscal year 2015 down from $168 billion in 2014 (III6)
National health expenditures (NHE) were $29191 billion in calendar year 2013 comprising 174 percent of the gross domestic product (GDP) Comparably NHE amounted to $7243 billion or 121 percent of the GDP in calendar year 1990 NHE per person were $147 in calendar year 1960 and grew steadily to reach $9255 by calendar year 2013 (III7)
Utilization of Medicare and Medicaid services
Between 1990 and 2014 the number of short-stay hospital discharges per 1000 enrollees decreased from 320 to 280 a decrease of 13 percent (IV1)
The PPS short-stay hospital average length of stay decreased significantly from 90 days in 1990 to 50 days in 2014 a decrease of 44 percent (IV3)
3
The ratio of Medicare aged users of any type of covered service has grown from 528 per 1000 enrolled in 1975 to 890 per 1000 enrolled in 2014 (IV4)
About 339 million persons received a reimbursed service under Medicare fee-for-service during 2014 Comparably almost 633 million persons used Medicaid services or had a premium paid on their behalf in 2012 (IV6a amp IV9)
64 million persons received reimbursable fee-for-service inpatient hospital services under Medicare in 2014 (IV6a)
327 million persons received reimbursable fee-for-services physician services under Medicare during 2014 428 million persons received reimbursable physician services under Medicaid during 2012 (IV6a amp IV9)
251 million persons received reimbursable fee-for-service outpatient hospital services under Medicare during 2014 During 2012 263 million persons received Medicaid reimbursable outpatient hospital services (IV6a amp IV9)
Over 18 million persons received care in SNFs covered by Medicare during 2014 14 million persons received care in nursing facilities which include SNFs and all other nursing facilities excluding ICFIID covered by Medicaid during 2012 (IV6a amp IV9)
Over 38 million persons received prescribed drugs under Medicaid during 2012 (IV9)
4
Populations
Information about persons covered by Medicare Medicaid or CHIP
For Medicare statistics are based on persons enrolled for coverage Original Medicare enrollees are also referred to as fee-for-service enrollees Historically for Medicaid recipient (beneficiary) counts were used as a surrogate of persons eligible for coverage as well as for persons utilizing services Current data systems now allow the reporting of total eligibles for Medicaid and for Childrenrsquos Health Insurance Program (CHIP) Statistics are available by major program categories by demographic and geographic variables and as proportions of the US population Utilization data organized by persons served may be found in the Utilization section
5
Table I1 Medicare EnrollmentTrends
Total Aged Disabled Persons Persons Persons
July In millions 1966 191 191 --1970 204 204 --1975 249 227 22 1980 284 255 30 1985 311 281 29 1990 343 310 33 1995 376 332 44
Average monthly 2000 397 343 54 2005 426 358 68 2010 477 396 81 2012 509 422 87 2013 525 436 88 2014 538 449 89 2015 558 468 91
NOTES Represents those enrolled in HI (Part A) andor SMI (Part B and Part D) of Medicare Data for 1966-1995 are as of July Data for calendar years 2000-2015 represent average actual or projected monthly enrollment Numbers may not add to totals because of rounding Based on 2015 Trustees Report
SOURCE CMS Office of the Actuary
Table I2 Medicare EnrollmentCoverage
HI andor SMI HI P
SMI
art B Part D
HI and SMI
HI Only
SMI Only
In millions
All persons
Aged persons
Disabled persons
553
463
90
550
460
90
504
422
82
415
--
--
501
419
82
49
41
08
03
03
00 NOTES Projected average monthly enrollment during fiscal year 2015 Ageddisabled split of Part D enrollment not available Based on 2015 Trustees Report Numbers may not add to totals because of rounding
SOURCE CMS Office of the Actuary
6
Table I3 Medicare EnrollmentDemographics
Total Male Female In thousands
All persons 54096 24560 29536 Aged 45312 20019 25293 65-74 years 25124 11828 13295 75-84 years 13723 5981 7743 85 years and over 6465 2210 4255Disabled 8783 4541 4243 Under 45 years 1929 1035 894 45-54 years 2467 1265 1203 55-64 years 4386 2240 2146 White 40904 18536 22368 Black 5565 2401 3164 All Other 7116 3289 3826 Native American 243 108 134 AsianPacific 1616 725 892 Hispanic 4798 2230 2567 Other 459 226 233
Unknown Race 511 333 178 NOTES Person-year enrollee counts for 2014 Numbers may not add to totals because of round-ing Race information is based on Research Triangle Institute (RTI) race codes
SOURCE CMS Office of Enterprise Data and Analytics
Table I4 Medicare Part D EnrollmentDemographics
Total Male Female In thousands
All persons 37721 15938 21783
Aged 65-74 years 16543 7156 9387 75-84 years 9992 4087 5905 85 years and over 4555 1406 3150
Disabled Under 45 years 1572 823 750 45-54 years 1887 948 939 55-64 years 3171 1518 1653 NOTES Person-year enrollee counts for 2014 as reported in the CMS Chronic Conditions Data Warehouse Totals may not add because of rounding
SOURCE CMS Office of Enterprise Data and Analytics
7
Table I5 Medicare ESRD EnrollmentTrends
HI andor SMI HI SMI
In thousands Year 1985 1100 1091 1065 1990 1721 1706 1637 1995 2557 2536 2438 2000 2909 2904 2728 2005 3699 3698 3516 2010 4369 4368 4161 2014 4969 4938 4725
NOTE Data as of July 1 for years 1985-2010 Enrollee counts for 2014 are determined using a person-year methodology
SOURCE CMS Office of Enterprise Data and Analytics
Table I6 Medicare ESRD EnrollmentDemographics
Number of Enrollees (in thousands)
All persons 5475 Age Under 35 years 245 35-44 years 405 45-64 years 2106 65 years and over 2719
Sex Male 3121 Female 2354
Race White 2323 Black 1841
Other 1270 Unknown 41
NOTES CMS Chronic Conditions Data Warehouse Represents persons with ESRD ever enrolled during calendar year 2014
SOURCE CMS Office of Enterprise Data and Analytics
8
Table I7 Medicare Advantage Cost PACE Demo amp Prescription Drug
Number of MA only Drug Plan Total Contracts (Enrollees in thousands)
Total prepaid1 741 2094 15600 17694 Local CCPs 507 1543 13598 15140 PFFS 8 78 177 254 1876 Cost 16 297 269 566
1833 Cost (HCPP) 9 51 -- 51 PACE 117 -- 33 33 Other plans2 84 126 1524 1650
Total PDPs1 76 -- 24180 24180 Total 817 2094 39781 41875 1Totals include beneficiaries enrolled in employerunion-only group plans (contracts with 800 series plan IDs) Where a beneficiary is enrolled in both an 1876 cost or PFFS plan and a PDP plan both enrollments are reflected in these counts 2Includes MSA Pilot Medicare-Medicaid Plans and RPPOs
NOTE Data as of October 2015
SOURCE CMS Center for Medicare
Table I8 Medicare EnrollmentCMS Region
Enrollees as Resident Medicare Percent
Population1 Enrollees2 of Population
In thousands
All regions 318857 52882 166 Boston 14681 2699 184 New York 28684 4753 166 Philadelphia 30535 5385 176 Atlanta 63573 11535 181
Chicago 52196 9034 173 Dallas 40537 5903 146 Kansas City 13956 2459 176 Denver 11499 1644 143 San Francisco 49793 7246 146 Seattle 13403 2225 166 1Preliminary annual estimate July 1 2014 resident population 2Medicare enrollment data for 2014 are determined using a person-year methodology Excludes beneficiaries living in territories possessions foreign countries or with residence unknown
NOTES Resident population is a provisional estimate based on 50 States and the District of Columbia Numbers may not add to totals because of rounding For regional breakouts see Reference section SOURCES CMS Office of Enterprise Data and Analytics US Bureau of the Census Population Estimates Branch
9
Table I9 Medicare Enrollment by Health DeliveryCMS Region
MA and Other Total Original Medicare Health Plan
Enrollees Enrollees Enrollees
In thousands All regions 54096 37665 16430 Boston 2699 2142 558 New York 5520 3564 1956 Philadelphia 5385 3952 1432 Atlanta 11535 8009 3525 Chicago 9034 6199 2836 Dallas 5903 4298 1604 Kansas City 2459 1974 485 Denver 1644 1178 466 San Francisco 7267 4447 2820 Seattle 2225 1481 743 NOTES Person-year enrollee counts for 2014 Totals may not add because of rounding Foreign residents and unknowns are not included in the regions but included in the total figure
SOURCE CMS Office of Enterprise Data and Analytics
Table I9a Medicare Enrollment by Health DeliveryDemographics
Original MA and Other Total Medicare Health Plans
In thousands All persons 54096 37665 16430 Aged 45312 31038 14274 65-74 years 25124 17279 7844 75-84 years 13723 9119 4604 85 years and over 6465 4640 1825 Disabled 8783 6627 2156 Under 45 years 1929 1612 317 45-54 years 2467 1902 566 55-64 years 4386 3113 1273 Male 24560 17433 7127 Female 29536 20232 9304 White 40904 29298 11606 Black 5565 3743 1822 All Other 7116 4226 2890 Native American 243 210 33 AsianPacific 1616 1068 548 Hispanic 4798 2632 2165 Other 459 315 144 Unknown Race 511 399 112 NOTES Person-year enrollee counts for 2014 Numbers may not add to totals because of rounding Race information based on Research Triangle Institute race codes SOURCE CMS Office of Enterprise Data and Analytics
10
Table I10
Medicare Part D Enrollment by CMS Region
Total Medicare Total Part D of Total Enrollees Enrollees Enrollees
In thousands
All regions1 54096 37721 697
Boston 2699 1805 669 New York 5520 4054 734 Philadelphia 5385 3572 663 Atlanta 11535 8191 710 Chicago 9034 6496 719 Dallas 5903 3979 674 Kansas City 2459 1753 713 Denver 1644 1090 663 San Francisco 7267 5341 735 Seattle 2225 1425 641 1 Foreign residents and unknowns are not included in the regions but included in the total figure
NOTE Data for calendar year 2014 as reported in the CMS Chronic Conditions Data Warehouse SOURCE CMS Office of Enterprise Data and Analytics
Table I11 Medicare Part D Enrollment by Plan TypeCMS Region
Total Part D Total PDP Total MA-PD Enrollees Enrollees Enrollees
In thousands All regions1 37721 23437 14284
Boston 1805 1289 517 New York 4054 2228 1825 Philadelphia 3572 2385 1186 Atlanta 8191 4922 3269 Chicago 6496 4563 1933 Dallas 3979 2645 1334 Kansas City 1753 1320 433 Denver 1090 679 411 San Francisco 5341 2620 2721 Seattle 1425 774 651 1 Foreign residents and unknowns are not included in the regions but included in the total figure
NOTE Data for calendar year 2014 as reported in the CMS Chronic Conditions Data Warehouse
SOURCE CMS Office of Enterprise Data and Analytics
11
Table I12
Medicare Part D and RDS EnrollmentCMS Region
Total Part D and Total Part D Total RDS RDS Enrollees Enrollees Enrollees
In thousands All regions1 40379 37721 2657
Boston 2042 1805 237 New York 4351 4054 298 Philadelphia 3845 3572 273 Atlanta 8665 8191 474 Chicago 7000 6496 504 Dallas 4256 3979 278 Kansas City 1833 1753 80 Denver 1154 1090 64 San Francisco 5634 5341 293 Seattle 1583 1425 157 1 Foreign residents and unknowns are not included in the regions but included in the total figure
NOTE Data for calendar year 2014 as reported in the CMS Chronic Conditions Data Warehouse Totals may not add because of rounding
SOURCE CMS Office of Enterprise Data and Analytics
Table I13
Projected Population1
2010 2020 2040 2060 2080 2100
In millions
Total 315 342 392 430 471 511
Under 20 86 88 98 105 113 121
20-64 188 198 212 232 251 269
65 years and over 41 56 82 93 106 121 1 As of July 1
NOTE Numbers may not add to totals because of rounding
SOURCE Social Security Administration Office of the Chief Actuary based on the 2015 Trustees Report Intermediate Alternative
12
Table I14
Period Life Expectancy at Age 65
Historical and Projected
Male Female
Year In years
1965 129 163
1980 140 184
1990 151 191
2000 159 190
2010 176 202
20201 188 211
20301 195 217
20401 201 222
20501 207 228
20601 213 233
20701 218 237
20801 222 242
20901 227 246
21001 231 250 1 Projected
SOURCE Social Security Administration Office of the Chief Actuary based on the 2015 Trustees Report Intermediate Alternative
13
Table I15
Life Expectancy at Birth and at Age 65 by RaceTrends
Calendar Year All Races White Black
At Birth
1960 697 706 636
1980 737 744 681
1990 754 761 691
2000 768 773 718
2005 776 780 730
2010 787 789 751
2011 787 790 753
2012 788 791 755
2013 788 791 755
At Age 65
1960 143 144 139
1980 164 165 151
1990 172 173 154
2000 176 177 161
2005 184 185 169
2010 191 192 178
2011 192 192 180
2012 193 193 181
2013 193 193 181
SOURCE Centers for Disease Control and Prevention National Center for Health Statistics National Vital Statistics System
14
Table I16 Medicaid and CHIP Enrollment
Fiscal Year 1995 2000 2005 2010 2014 2015
Average monthly enrollment in millions Total 342 345 465 535 648 689 Age 65 years and over 37 37 46 47 54 56 BlindDisabled 58 67 81 95 98 102 Children 165 162 223 263 294 296 Adults 67 69 106 121 192 224 Other Title XIX1 06 NA NA NA NA NA Territories 08 09 10 10 10 10
CHIP NA 20 59 54 60 58
1In 1997 the Other Title XIX category was dropped and the enrollees therein were subsumed in the remaining categories
NOTES Aged and BlindDisabled eligibility groups include Qualified Medicare Beneficiaries (QMB) and Specified Low-Income Medicare Beneficiaries (SLMB) Children and Adult groups include both AFDCTANF and poverty-related recipients who are not disabled Medicaid enrollment excludes Medicaid expansion and CHIP programs CHIP numbers include adults covered under waivers Medicaid and CHIP figures for FY 2014-2015 are estimates from the Presidents FY 2016 budget Enrollment for Territories for FY 2000 and later is estimated Numbers may not add to totals because of rounding
SOURCES CMS Office of the Actuary and the Center for Medicaid and CHIP Services
15
Table I17 Medicaid EligiblesDemographics
Medicaid Percent Eligibles Distribution
In millions Total eligibles 709 1000
Age 709 1000 Under 21 353 499 21-64 years 272 384 65 years and over 67 95
Unknown 16 22
Sex 709 1000 Male 296 418 Female 412 581 Unknown 01 01
Race 709 1000 White not Hispanic 285 403
Black not Hispanic 155 218 Am IndianAlaskan Native 09 12
Asian 24 33 HawaiianPacific Islander 07 09
Hispanic 175 247 Other 03 05 Unknown 51 72
NOTES Fiscal Year 2012 data derived from MSIS Granular Database The percent distribution is based on unrounded numbers Totals do not necessarily equal the sum of rounded components Eligible is defined as anyone eligible and enrolled in the Medicaid program at some point during the fiscal year regardless of duration of enrollment receipt of a paid medical service or whether or not a capitated premium for managed care or private health insurance coverage has been made Age groups are determined using the eligiblersquos age at the end of the fiscal year Excludes beneficiaries ever enrolled in separate Title XXI Childrenrsquos Health Insurance Program (CHIP) Excludes data for Colorado Idaho and Maine and includes partial data for Arizona and Washington DC
SOURCE CMS Center for Medicaid and CHIP Services
16
Table I18 Medicaid EligiblesCMS Region
Enrollment as Resident
population1 Medicaid
enrollment2 percent of population
In thousands
All regions 305996 70895 232 Boston 13250 2964 224
New York 28483 7452 262 Philadelphia 30264 5828 193 Atlanta 62387 13582 218 Chicago 51953 11767 226 Dallas 39550 9206 233 Kansas City 13843 2578 186 Denver 5973 830 139
San Francisco 48767 14453 296 Seattle 11526 2235 194
1Estimated July 1 2012 population 2Persons ever enrolled in Medicaid during fiscal year 2012
NOTES Numbers may not add to totals because of rounding Excludes data for Colorado Idaho and Maine and includes partial data for Arizona and Washington DC Excludes enrollees ever enrolled in separate Title XXI Childrens Health Insurance Program (CHIP)
SOURCES CMS Center for Medicaid and CHIP Services US Department of Commerce Bureau of the Census
Table I19 Medicaid BeneficiariesState Buy-Ins for Medicare
1975 1 1980 1 2000 2 2014 2
Type of Beneficiary In thousands All buy-ins 2846 2954 5549 9273 Aged 2483 2449 3632 5340 Disabled 363 504 1917 3932
Percent of SMI enrollees All buy-ins 120 109 149 185 Aged 114 100 111 127 Disabled 187 189 402 481
1Beneficiaries for whom the State paid the SMI premium during the year 2Beneficiaries in person years
NOTES Numbers may not add to totals because of rounding Includes outlying areas foreign countries and unknown
SOURCE CMS Office of Enterprise Data and Analytics
17
18
ProvidersSuppliers
Information about institutions agencies or professionals who provide health care services and individuals or organizations who furnish health care equipment or supplies
These data are distributed by major providersupplier categories by geographic region and by type of program participation Utilization data organized by type of providersupplier may be found in the Utilization section
19
Table II1 Inpatient HospitalsTrends
1990 2000 2010 2014 Total hospitals 6522 5985 6169 6142 Beds in thousands 1105 991 928 931 Beds per 1000 enrollees1 328 253 196 173 Short-stay 5549 4900 3566 3466 Beds in thousands 970 873 785 784 Beds per 1000 enrollees1 288 223 166 146 Critical access hospitals NA NA 1325 1334 Beds in thousands --- --- 30 31 Beds per 1000 enrollees1 --- --- 06 06 Other non-short-stay 973 1085 1278 1342 Beds in thousands 135 118 113 116 Beds per 1000 enrollees1 40 30 24 22 1Based on number of total HI enrollees as of July 1 for years 1990 2000 and 2010 Based on person-year HI enrollee count for 2014
NOTES Facility data are as of December 31 and represent essentially those facilities eligible to participate at the start of the next calendar year Facilities certified for Medicare are deemed to meet Medicaid standards
SOURCE CMS Office of Enterprise Data and Analytics
Table II2 Inpatient HospitalsCMS Region
Short-stay Beds per Non Beds per and CAH 1000 Short-stay 1000 hospitals enrollees hospitals enrollees
All regions 4800 152 1342 22
Boston 178 119 64 35 New York 300 159 73 21 Philadelphia 360 133 131 24 Atlanta 883 156 249 18 Chicago 857 165 204 18 Dallas 764 179 350 38 Kansas City 460 189 62 18 Denver 312 160 50 25 San Francisco 475 133 130 16 Seattle 211 108 29 14 NOTES Critical Access Hospitals have been grouped with short stay Facility data as of Decem-ber 31 2014 Rates based on person-year hospital insurance enrollee count for 2014
SOURCE CMS Office of Enterprise Data and Analytics
20
Table II3 Medicare Hospital and SNFNFICF Facility Counts
Total participating hospitals 6142
Short-term hospitals 3466 Psychiatric units 1114 Rehabilitation units 915
Swing bed units 502 Psychiatric 551 Long-term 423 Rehabilitation 255
Childrenrsquos 98 Religious non-medical 15 Critical access 1334
Non-participating Hospitals 788 Emergency 436 Federal 352
All SNFsSNF-NFsNFs only 15637 All SNFsSNF-NFs 15179
Title 18 Only SNF 767 Hospital-based 188 Free-standing 579 Title 1819 SNFNF 14412 Hospital-based 573 Free-standing 13839
Title 19 only NFs 458 Hospital-based 102
Free-standing 356
All ICFIID facilities 6323
NOTES Data as of December 31 2014 Numbers may differ from other reports and program memoranda
SOURCE CMS Office of Enterprise Data and Analytics
21
Table II4 Long-Term FacilitiesCMS Region
Title XVIII and Nursing XVIIIXIX SNFs Facilities ICFIIDs
All regions 1 15179 458 6323
Boston 934 9 123 New York 995 2 586 Philadelphia 1366 39 389 Atlanta 2649 44 697 Chicago 3346 94 1387 Dallas 2050 50 1552 Kansas City 1405 113 200 Denver 591 35 111 San Francisco 1406 54 1198 Seattle 437 18 80 1 Includes outlying areas
NOTE Data as of December 2014
SOURCE CMS Office of Enterprise Data and Analytics
Table II5 Other Medicare Providers and SuppliersTrends
1980 1990 2010 2014
Home health agencies 2924 5661 10914 12268 Independent and Clinical Lab Improvement Act Facilities NA 4828 224679 250247 End stage renal disease facilities 999 1987 5631 6374 Outpatient physical therapy andor speech pathology 419 1144 2536 2102 Portable X-ray 216 435 561 536 Rural health clinics 391 517 3845 4062 Comprehensive outpatient rehabilitation facilities NA 184 354 216 Ambulatory surgical centers NA 1165 5316 5444 Hospices NA 772 3509 4140 NOTES Facility data for 1980 are as of July 1 Facility data for 1990 2010 and 2014 are as of December 31
SOURCE CMS Office of Enterprise Data and Analytics
22
Table II6 Selected FacilitiesType of Control
Skilled Short-stay nursing Home health hospitals facilities agencies
Total facilities 3466 15179 12268
Percent of total
Non-profit 595 239 152
Proprietary 213 706 798
Government 192 55 49
NOTES Data as of December 31 2014 Facilities certified for Medicare are deemed to meet Medicaid standards
SOURCE CMS Office of Enterprise Data and Analytics
Table II7 Periodic Interim Payment (PIP) FacilitiesTrends
1980 1990 2000 2012 2014
Hospitals Number of PIP
Percent of total participating
2276
338
1352
206
869
144
568
92
478
78
Skilled nursing facilities Number of PIP
Percent of total participating
203
39
774
73
1236
83
345
23
332
22
Home health agencies Number of PIP
Percent of total participating
481
160
1211
210
1038
144
141
12
146
12
NOTES These are facilities receiving Periodic Interim Payments (PIP) under Medicare Effec-tive for claims received on or after July 1 1987 the Omnibus Budget Reconciliation Act of 1986 eliminates PIP for many PPS hospitals when the servicing Part A MAC meets specified processing time standards
SOURCE CMS Center for Medicare
23
Table II8 Medicare Non-Institutional Providers by Specialty1
Count Total Providers 1173802
Primary Care 221469
Surgical Specialties 108447 Medical Specialties 142488
Anesthesiology 40453
ObstetricsGynecology 34606
Radiology 36713
Emergency Medicine 44399
Non-Physician Practitioners 332556
Limited Licensed Practitioners 104702
All Other Providers 131570
1 Providers utilized by Original Medicare beneficiaries for all Part B non-institutional provider services Providers may be counted in more than one specialty classification but are reported as a single provider in the Total Providers count
NOTE Data for calendar year 2014 as reported on the Original Medicare claims
SOURCE CMS Office of Enterprise Data and Analytics
Table II9
Medicare DMEPOS Providers by Specialty1
Count Total DMEPOS Providers 88033
Pharmacy 50338
Medical Supply Company 11257 Optometry 6276
Podiatry 5575
Individual Certified ProsthetistOrthotist 2704
Optician 2460
All Other DMEPOS Providers 9895
1Providers utilized by Original Medicare beneficiaries for all Part B non-institutional DMEPOS services Providers may be counted in more than one specialty classification but are reported as a single provider in the Total DMEPOS Providers count
NOTE Data for calendar year 2014 as reported on the Original Medicare claims
SOURCE CMS Office of Enterprise Data and Analytics
24
Expenditures
Information about spending for health care services by Medicare Medicaid CHIP and for the Nation as a whole
Health care spending at the aggregate levels is distributed by source of funds types of service geographic area and broad beneficiary or eligibility categories Direct out-of-pocket other private and non-CMS-related expenditures are also covered in this section Expenditures on a per-unit-of-service level are covered in the Utilization section
25
Table III1 CMS and Total Federal Outlays
Fiscal year Fiscal year 2013 2014
$ in billions Gross domestic product (current dollars) $166186 $172440 Total Federal outlays1 34546 35061 Percent of gross domestic product 208 203 Dept of Health and Human Services1 8863 9360 Percent of Federal Budget 257 267 CMS Budget (Federal Outlays)
Medicare benefit payments 5774 5913 SMI transfer to Medicaid2 05 07
Medicaid benefit payments 2488 3015 Medicaid State and local admin 145 152 Medicaid offsets3 -05 -07
Childrens Health Ins Prog 95 90 CMS program management 37 36 Other Medicare admin expenses4 20 20 State Eligibility Determinations for Part D 00 00 Quality Improvement Organizations5 05 05 Health Care Fraud and Abuse Control 16 14 State Grants and Demonstrations6 05 05 User Fees and Reimbursables 07 05 Total CMS outlays (unadjusted) 8447 9103 Offsetting receipts7 -970 -945 Total net CMS outlays 7477 8158 Percent of Federal budget 216 233 1Net of offsetting receipts 2SMI transfers to Medicaid for Medicare Part B premium assistance ( $477 million in FY 2013 and $688 million in FY 2014) 3SMI transfers for low-income premium assistance 4Medicare administrative expenses of the Social Security Administration and other Federal agen-cies 5Formerly peer review organizations (PROs) 6Includes grants and demonstrations for various free-standing programs such as the Ticket to Work and Work Incentives Improvement Act (PL 106-170) emergency health services for undocument-ed aliens (PL108-173) and Medicaids Money Follows the Person Rebalancing Demonstration (PL 109-171)7Almost entirely Medicare premiums Also includes offsetting collections for user fee and reim-bursable activities as well as refunds to the trust funds
SOURCE CMS Office of Financial Management
26
Table III2 Program ExpendituresTrends
Total Medicare1 Medicaid2 CHIP3
$ in billions Fiscal year
1980 $608 $350 $258 --
1990 1822 1097 725 --
2000 4287 2190 2080 $17
2010 9409 5256 4039 114
2014 10820 5987 4703 130
1Medicare amounts reflect gross outlays (ie not net of offsetting receipts) These amounts include outlays for benefits administration Health Care Fraud and Abuse Control (HCFAC) activities Quality Improvement Organizations (QIOs) the SMI transfer to Medicaid for Medicare Part B premium assistance for low-income Medicare beneficiaries and since FY 2004 the admin-istrative and benefit costs of the Transitional Assistance and Part D Drug benefits under the Medicare Modernization Act of 2003
2The Medicaid amounts include total computable outlays (Federal and State shares) for benefits and administration the Federal and State shares of the cost of Medicaid surveycertification and State Medicaid fraud control units and outlays for the Vaccines for Children program These amounts do not include the SMI transfer to Medicaid for Medicare Part B premium assistance for low-income beneficiaries nor do they include the Medicare Part D compensation to States for low-income eligibility determinations in the Part D Drug program
3The CHIP amounts reflect both Federal and State shares of Title XXI outlays Please note that CHIP-related Medicaid began to be financed under Title XXI in 2001
NOTE Numbers may not add to totals because of rounding
SOURCE CMS Office of Financial Management
27
Table III3 Annual Benefit Outlays by Program
1967 1980 2010 2014
Amounts in billions CMS program outlays $51 $578 $915 $1081
Federal outlays NA 472 793 891
Medicare1 32 339 518 598
HI 25 238 250 271
SMI 07 101 209 262
Prescription (Part D) NA NA 59 65
Medicaid2 19 239 386 470
Federal share NA 132 266 284
CHIP3 NA NA 11 13
Federal share NA NA 8 9
1The Medicare benefit amounts reflect gross outlays (ie not net of offsetting premiums) These amounts exclude outlays for the SMI transfer to Medicaid for premium assistance and the Quality Improvement Organizations (QIOs)
2The Medicaid amounts include total computable outlays (Federal and State shares) for Medicaid benefits and outlays for the Vaccines for Children program
3The CHIP amounts reflect both Federal and State shares of Title XXI outlays as reported by the States on line 4 of the CMS-21 Please note that CHIP-related Medicaid expansions began to be financed under CHIP (Title XXI) in FY 2001
NOTES Fiscal year data Numbers may not add to totals because of rounding
SOURCE CMS Office of Financial Management
28
Table III4 Program Benefit PaymentsCMS Region
Fiscal Year 2013 Net Expenditures Reported1
Medicaid Total Payments Computable for Federal funding Federal Share
In millions All regions $433131 $248800
Boston 26805 13956 New York 64834 32757 Philadelphia 42670 23556 Atlanta 67823 44435 Chicago 68180 40640 Dallas 46561 29266 Kansas City 16822 10134 Denver 10214 5812 San Francisco 73363 39201 Seattle 15859 9043 1Data from Form CMS-64--Net Expenditures Reported by the States Medical assistance payments only excludes administrative expenses and Childrens Health Insurance Program (CHIP) Unad-justed by CMS NOTE Numbers may not add to totals because of rounding
SOURCE CMS Office of Enterprise Data and Analytics
Table III5 Medicare Benefit Outlays
Fiscal Year 2013 2014 2015
In billions Part A benefit payments $2618 $2618 $2681
Aged 2179 2176 2232
Disabled 439 442 449
Part B benefit payments 2431 2566 2729 Aged 1971 2079 2215 Disabled 459 487 513
Part D 680 722 838 NOTES Based on 2015 Trustees Report Part A benefits include additional payments for HIT CBC IPAB and Sequester Part B benefits include additional payments for HIT IPAB and Sequester Part D benefits include additional payments for IPAB Ageddisabled split of Part D benefit outlays not available Totals do not necessarily equal the sum of rounded components
SOURCE CMS Office of the Actuary 29
Table III6 MedicareType of Benefit
Fiscal Year 2015 Benefit Percent Payments1 in millions Distribution
Total Part A23 $268084 1000 Inpatient hospital 136415 509 Skilled nursing facility Home health agency4
29928 6865
11226
Hospice 16056 60 Managed care Total Part B35
78821 272877
294 1000
Physicianother suppliers6 69199 254 DME 6502 24 Other carrier 21184 78 Outpatient hospital Home health agency4
43574 11491
16042
Other intermediary 19459 71 Laboratory 8534 31 Managed care Total Part D7
92934 83845
341 1000
1Includes the effects of regulatory items and recent legislation but not proposed law 2Includes HIT CBC IPAB and Sequester expenditures 3Excludes QIO expenditures 4Distribution of home health benefits between the trust funds estimated based on outlays reported to date by the Treasury 5Includes HIT IPAB and Sequester expenditures 6Includes payments made for HIT 7Includes payments made for IPAB
NOTES Based on 2015 Trustees Report Benefits by type of service are estimated and are subject to change Totals do not necessarily equal the sum of rounded components
SOURCE CMS Office of the Actuary
Table III7 National Health CareTrends
Calendar Year 1990 2000 2013
National total in billions $7243 $13780 $29191 Percent of GDP 121 134 174 Per capita amount $2855 $4881 $9255 Sponsor Percent of total Private Business 246 251 209 Household 349 315 282 Other Private Revenues 79 78 75 Governments 326 355 434 Federal government 173 190 259 State and local government 153 165 174 NOTE Numbers may not add to totals because of rounding
SOURCES CMS Office of the Actuary US Department of Commerce Bureau of Economic Analysis and US Bureau of the Census
30
Table III8 MedicaidType of Service
Fiscal Year 2011 2012 2013
In billions Total medical assistance payments1 $4075 $4088 $4331
Percent of Total Inpatient services 157 145 145 General hospitals 148 137 137
Mental hospitals 09 08 08 Nursing facility services 125 123 117 ICFIID services 33 33 28 Community-based long term care svs2 135 135 130 Prescribed drugs3 36 21 15 Physician and other practitioner services 40 35 33 Dental services 13 11 09 Outpatient hospital services 42 38 39 Clinic services4 27 26 24 Laboratory and radiological services 04 04 04 Early and periodic screening 03 03 03 Case management services 07 07 07 Capitation payments (non-Medicare) 252 291 319 Medicare premiums 35 33 32 Disproportionate share hosp payments 42 42 38 Other services 66 72 74 Collections5 -18 -20 -16 1Excludes payments under CHIP
2Comprised of home health home and community-based waivers personal care and home and community-based services for functionally disabled elderly
3Net of prescription drug rebates 4Federally qualified health clinics rural health clinics and other clinics 5Includes third party liability probate fraud and abuse overpayments and other collections
NOTE Numbers may not add to totals because of rounding
SOURCES CMS CMCS and OACT
31
Table III9 Medicare Savings Attributable to Secondary Payer
Provisions by Type of Provision Fiscal Year
2012 2013 2014 In millions Total $78622 $89258 $81999 Workers Compensation1 18419 18885 17117 Working Aged 31265 38384 35458 ESRD 2960 3031 2709 Auto 2122 1901 1729 Disability 18406 21196 19968 Liability 5232 5663 4885 VAOther 217 198 133 1Includes Workersrsquo Compensation set-asides
NOTES Includes Liability savings of the global settlements recovered by CMS Numbers may not add to totals because of rounding
SOURCE CMS Office of Financial Management
Table III10 MedicaidPayments by Eligibility Status
Fiscal Year 2013 Medical Assistance Percent
Payments Distribution In billions Total1 $4331 1000
Age 65 years and over 815 188 Blinddisabled 1752 404 Dependent children under 21 years of age 782 180 Adults in families with dependent children 645 149 Disproportionate share hospital and other unallocated payments2 338 78 1Excludes payments under Childrens Health Insurance Program (CHIP)
2Includes collections prior period adjustments and payments to territories
SOURCE CMS Office of the Actuary
32
Table III11 MedicareDMEPOS1
BETOS Category Allowed Charges2
2013 2014 In thousands
Total $10147264 $8686710
Medicalsurgical supplies 193817 204469 Hospital beds 183537 119600 Oxygen and supplies 1679612 1429545 Wheelchairs 806018 617261 Prostheticorthotic devices Drugs admin through DME3
2444878 770702
2363720 827574
Parenteral and enteral nutrition 604248 512214 Other DME 3464453 2612327 1Data are for calendar year DME=durable medical equipment POS=Prosthetic orthotic and supplies
2The allowed charge is the Medicare approved payment reported on a line item on the physician supplier claim
3Includes inhalation drugs administered through nebulizers only and does not include drugs administered through other DME such as infusion pumps
NOTE Over time the composition of BETOS categories has changed with the reassignment of selected procedures services and supplies Data for 2013 and 2014 as reported in the CMS Chronic Conditions Data Warehouse
SOURCE CMS Office of Enterprise Data and Analytics
33
Table III12 National Health CareType of Expenditure
National Per Percent Paid Total capita
in billions amount Total Medicare Medicaid Total $29191 $9255 355 201 154 Health Consumption Expenditures 27545 8733 376 213 163 Personal health care 24686 7826 389 223 166 Hospital care 9369 2970 434 259 175 Prof services 7779 2466 272 191 81 Physclinical 5867 1860 307 222 85 Other Professional 802 254 287 225 62 Dental 1110 352 72 04 68 Other Health Residential amp Personal Care 1482 470 591 34 557 Nursing Care Facilities amp
Continuing Care Retirement Communities 1558 494 523 222 301
Home Health 798 253 796 431 365 Retail outlet sales 3700 1173 300 230 70 Admn Net Cost and public health 2860 907 258 123 135 Investment 1646 522 -- -- --NOTE Data are as of calendar year 2013
SOURCE CMS Office of the Actuary Table III13
Personal Health CarePayment Source Calendar Year
1980 1990 2000 2013 In billions Total $2172 $6168 $11657 $24686
PercentTotal 1000 1000 1000 1000 Out of pocket 269 225 173 137 Health Insurance 607 654 725 773 Private Health Insurance 283 332 349 343 Medicare 167 174 186 223 Medicaid (Title XIX) 114 113 160 166 Total CHIP (Title XIX and Title XXI) -- -- 02 05 Department of Defense 18 17 11 15 Department of Veterans Affairs 26 18 16 22 Other Third Party Payers and Programs 124 121 102 90 NOTES Excludes administrative expenses the net cost of insurance non-commercial medical research investment in structures and equipment and public health expenditures Numbers may not add to totals because of rounding SOURCE CMS Office of the Actuary
34
Utilization
Information about the use of health care services
Utilization information is organized by persons receiving services and alternately by services rendered Measures of health care usage include persons served units of service (eg discharges days of care etc) and dimensions of the services rendered (eg average length of stay charge per person or per unit of service) These utilization measures are aggregated by program coverage categories provider characteristics type of service and demographic and geographic variables
35
Table IV1 MedicareShort-Stay Hospital Utilization
1990 2000 2013 2014 Discharges Total in millions 105 117 107 104 Rate per 1000 enrollees1 320 362 289 280
Days of care Total in millions 94 70 58 56 Rate per 1000 enrollees1 2866 2175 1548 1500
Average length of stay All short-stay 90 60 54 54 Excluded units 195 123 119 119
Total charges per day $1060 $2720 $8873 $9338
1The population base for the denominator is the July 1 HI Original Medicare enrollment for years 1990 and 2000 For 2013 and 2014 the HI Original Medicare enrollee counts are based on a person-year methodology
NOTES Data may reflect underreporting due to a variety of reasons including operational difficulties experienced by intermediaries no-pay at-risk managed care utilization no-pay Medi-care secondary payer bills and for certain years discharges where the beneficiary received services out of State Data may differ from other sources or from the same source with a different update cycle
SOURCE CMS Office of Enterprise Data and Analytics
Table IV2 Medicare Long-Term CareTrends
Skilled Nursing Facilities Home Health Agencies
Persons Served Persons Served Served in per 1000 Served in per 1000 thousands enrollees thousands enrollees
Calendar year 1985 315 10 1576 51 1990 638 19 1978 58 1995 1233 37 3468 103 2000 1468 451 2461 751
2005 1847 511 2976 811
2010 1839 521 3605 1001
2014 1827 491 3601 961
1Managed care enrollees excluded in determining rate
SOURCE CMS Office of Enterprise Data and Analytics
36
Table IV3 Medicare Average Length of StayTrends
Fiscal Year
1990 1995 2000 2010 2014 All short-stay and excluded units Short-stay PPS units 90 71 60 51 50 Short-stay hospital non-PPS units 89 71 60 51 56 Excluded units 195 148 123 118 119
NOTES Fiscal year data Average length of stay is shown in days Data for 1990 through 2014 are based on 100-percent MEDPAR stay record file Data may differ from other sources or from the same source with a different update cycle
SOURCE CMS Office of Enterprise Data and Analytics
Table IV4 Medicare Persons ServedTrends
Calendar Year 1975 1985 1995 2005 2010 2014
Aged persons served per 1000 enrollees
HI andor SMI 528 722 826 923 919 890 HI 221 219 218 234 237 197
SMI 536 739 858 979 988 979
Disabled persons served per 1000 enrollees
HI andor SMI 450 669 759 865 897 943 HI 219 228 212 205 213 198
SMI 471 715 837 977 1007 1028
NOTES Prior to 2000 data were obtained from the Annual Person Summary Record and were not yet modified to exclude persons enrolled in managed care Beginning in 2000 the rates were adjusted to exclude managed care enrollees Persons served represents estimates of beneficiaries receiving services under Original Medicare during the calendar year
SOURCE CMS Office of Enterprise Data and Analytics
37
Table IV5 Original Medicare Persons Served
Year
2010 2011 2012 2013 2014 HI Aged
Original Medicare Enrollees 290 293 300 305 307 Persons served 69 63 63 62 61 Rate per 1000 237 217 208 202 197
Disabled Original Medicare Enrollees 66 68 69 67 66
Persons served 14 14 14 13 13 Rate per 1000 213 201 196 197 198
SMI Aged
Original Medicare Enrollees 264 266 270 276 278 Persons served 261 262 267 270 272 Rate per 1000 988 987 989 977 979
Disabled Original Medicare Enrollees 58 60 60 61 60
Persons served 58 61 62 62 62 Rate per 1000 1007 1023 1027 1019 1028
NOTES For years 2010-2012 enrollment represents persons enrolled in Original Medicare as of July For 2013 and 2014 Medicare enrollment is based on a person-year methodology Persons served represents counts of beneficiaries receiving reimbursed services under Original Medicare during the calendar year Rate is the ratio of persons served during the calendar year to the number of Original Medicare enrollees
Original Medicare enrollees and persons served counts are in millions
SOURCE CMS Office of Enterprise Data and Analytics
38
Table IV6 Medicare Persons ServedCMS Region
Disabled Aged Persons Served Persons Served
Served per 1000 Served in per 1000 in thousands Enrollees thousands Enrollees
All Regions1 27634 890 6251 943 Boston 1533 878 376 948
New York 2513 847 518 870 Philadelphia 2928 893 639 949 Atlanta 6018 927 1482 975 Chicago 4832 967 1174 976 Dallas 3107 887 745 935 Kansas City 1503 919 325 961 Denver 926 923 168 966
San Francisco 3196 845 598 897 Seattle 1063 862 225 906
1Includes utilization for residents of outlying territories possessions foreign countries and unknown NOTES Data are based on counts of beneficiaries receiving HI andor SMI reimbursed services under Original Medicare during calendar year 2014 Numbers may not add to totals because of rounding
SOURCE CMS Office of Enterprise Data and Analytics
Table IV6a Original Medicare Persons Served by Type of Service
Disabled Total Persons Aged Persons Persons
Served in Served in Served in thousands thousands thousands
Parts A andor B 33885 27634 6251
Part A 7372 6061 1312 Inpatient hospital 6383 5134 1248 Skilled nursing facility 1827 1650 177 Home health agency 1657 1440 217 Hospice 1331 1257 73
Part B 33401 27211 6190 Physiciansupplier 32745 26745 6000 Outpatient 25083 20280 4803
Home health agency 1945 1677 268
NOTES Data are as of calendar year 2014 Persons served represents counts of beneficiaries receiving services under Original Medicare during the calendar year
SOURCE CMS Office of Enterprise Data and Analytics
39
Table IV7 Medicare End Stage Renal Disease (ESRD) by Treatment Modalities
Medicare Entitled Dialysis Transplant
Year Total Patients Patients 1991 180625 141069 39556 1999 316167 244869 71298 2000 332885 257686 75199 2001 349207 270016 79191 2002 364956 281327 83629 2003 377592 291782 85810 2004 393301 301866 91435 2005 408378 312008 96370 2006 425039 323545 101494 2007 441030 334995 106035 2008 457660 347212 110448 2009 475292 360537 114755 2010 492713 373483 119230 2011 507324 383420 123904
SOURCE United States Renal Data System
Table IV8 Medicare End Stage Renal Disease (ESRD)
by Treatment Modalities and Demographics 2010 Medicare Entitled
Total Dialysis Patients
Transplant Patients
Total--all patients 492713 373483 119230 Age 0-19 years 3196 1452 1744 20-64 years 278262 195727 82535 65-74 years 118721 90823 27898 75 years and over 92534 85481 7048 Sex Male 280229 208505 71724
Female 212484 164978 47506 Race
White 295864 211046 84818 Black 164299 137796 26503 Native American 6646 5428 1218 AsianPacific 23830 17901 5929 OtherUnknown 2074 1312 762 SOURCE United States Renal Data System
40
Table IV9 MedicaidType of Service
Fiscal year 2012 Medicaid Beneficiaries
In thousands Total eligibles 70895
Number using service
Total beneficiaries any service1 63312
Inpatient services General hospitals 7601
Mental hospitals Nursing facility services2
42 1415
ICFIID services 95 Physician services 42770 Dental services 18223 Other practitioner services 9399 Outpatient hospital services 26292 Clinic services 15744 Laboratory and radiological services 28131 Home health services 1696 Prescribed drugs 38695 Personal care support services 1189 Sterilization services 285 PCCM capitation 9266 HMO capitation 39360 PHP capitation 19301 Targeted case management 2579 Other services unspecified 15873 Additional service categories 12848 Unknown 524
1Excludes gross adjustment claims for services received by individual patients that come in the form of a lump sum payment covering services to more than one patient 2All nursing facility services Unlike Medicare there is no distinction for SNFs
NOTES The methodology used is different from previous updates for this table and data were derived from the MSIS Granular Database Beneficiary counts include Medicaid eligibles enrolled in fee-for-service and Medicaid managed care Excludes data for Colorado Idaho and Maine and includes partial data for Arizona and Washington DC Excludes CHIP
SOURCE CMS Center for Medicaid and CHIP Services
41
Table IV10 MedicaidUnits of Service
Fiscal Year 2012 Units of Service
In thousands Inpatient hospital Total discharges 7536
Beneficiaries discharged 6778 Total days of care 43765
Nursing facility Total days of care 290962
ICFIID Total days of care 26733
NOTES Data are derived from the MSIS Granular Database Service counts produced using inpatient and long term care original fee-for-service and Medicaid managed care claims Excludes enrollees ever enrolled in separate Title XXI CHIP program and beneficiaries that had claims but no matching Medicaid enrollment in 2012 Excludes data for Colorado Idaho and Maine and includes partial data for Arizona and Washington DC
SOURCE CMS Center for Medicaid and CHIP Services
42
AdministrativeOperating
Information on activities and services related to oversight of the day-to-day operations of CMS programs
Included are data on Medicare contractors contractor activities and performance CMS and State agency administrative costs quality control and summaries of the operation of the Medicare trust funds
43
Table V1 Medicare Administrative ExpensesTrends
Administrative Expenses As a Percent of
Fiscal Year Amount in millions Benefit Payments HI Trust Fund 1967 $89 35 1970 149 31 1980 497 21 1990 774 12 1995 1300 11 2000 1 2350 18 2005 1 2850 16 2010 3328 14 2012 3696 15 2013 4135 16 2014 4332 17
SMI Trust Fund2
1967 1353 203 1970 217 110 1980 593 58 1990 1524 37 1995 1722 27 2000 1780 20 2005 2348 16 2010 3513 13 2012 4130 14 2013 3756 12 2014 4297 13
1Includes non-expenditure transfers for Health Care Fraud and Abuse Control
2Starting in FY 2004 includes the transactions of the Part D account
3Includes expenses paid in fiscal years 1966 and 1967
SOURCE CMS Office of Actuary
44
Table V2 Medicare Administrative Contractors
Number
AB MACs 13
DME MACs 4
NOTE Data as of August 2015
SOURCE CMS Center for Medicare
Table V3 Medicare Redeterminations
Intermediary Intermediary Carrier Redeterminations Redeterminations Redeterminations
(Part A Cases Involved)
(Part B Cases Involved)
(Part B Cases Involved)
Number Processed 385016 229134 2624982
Percent Reversed 123 463 392 (Includes Fully amp Partially Reversed Cases)
NOTES Data for fiscal year 2014 Data presented in cases
SOURCE CMS Center for Medicare
Table V4 Medicare PhysicianSupplier Claims Assignment Rates
2000 2005 2010 2012 2013 2014 In millions
Claims total 7205 9516 9727 10032 9946 9952 Claims assigned 7057 9407 9657 9974 9892 9899 Claims unassigned 153 109 70 58 54 53
Percent assigned 979 989 993 994 995 995
NOTE Calendar year data (includes Carriers Part B AB MACs DME MACs) Due to the ongoing transition from Carriers to Part B MACs this table has been altered to solely reflect assignment rates at the National level
SOURCE CMS Center for Medicare
45
Table V5 Medicare Claims Processing
Fiscal Year 2014
Part A claims processed in millions 2100
Part B claims processed in millions1 10030
1Includes replicate claims (as reported in prior years)
SOURCE CMS Center for Medicare
Table V6 Medicare Claims Received
Claims received
Intermediary claims
received in millions 2113
Percent of total
Inpatient hospital 70
Outpatient hospital 546
Home health agency 73
Skilled nursing facility 27
Other 284
Carrier claims received in millions 9904
Percent of total
Assigned 995
Unassigned 05
NOTE Data for calendar year 2014
SOURCE CMS Center for Medicare
46
Table V7 Medicare Charge Reductions
Assigned Unassigned
Claims approved
Number in millions 8806 42
Percent reduced 951 790
Total covered charges
Amount in millions $347953 $519
Percent reduced 634 216
Amount reduced per claim $25034 $2678 NOTES Data for calendar year 2014 Charge reductions include reasonable charge medical necessity and global feerebundling reductions
SOURCE CMS Center for Medicare
Table V8 Medicaid Administration
Fiscal Year 2013 2014
In millions Total payments computable for Federal funding1 $22938 $24418
Federal share1
Family Planning 32 30 Design development or
installation of MMIS2 533 663 Skilled professional
medical personnel 440 487 Operation of an
approved MMIS2 1550 1569 All other 11588 12359 Mechanized systems not approved under MMIS2 73 85
Total Federal Share $14216 $15193
Net adjusted Federal share3 $13682 $14675 1Source Form CMS-64 (Net Expenditures ReportedmdashAdministration) 2Medicaid Management Information System 3Includes CMS adjustments
SOURCE CMS Office of Enterprise Data and Analytics
47
48
Reference
Selected reference material including program financing cost-sharing features of the Medicare program and Medicaid Federal medical assistance percentages
49
Pro
gram
Fin
anci
ng
Cos
t S
har
ing
and
Lim
itat
ion
s
Med
icar
eS
ourc
e of
In
com
e
Med
icar
e P
art
A H
ospi
tal I
nsur
ance
trus
t fun
d 1
P
ayro
ll ta
xes
2
Inc
ome
from
taxa
tion
of
soci
al s
ecur
ity
bene
fits
3
Tra
nsfe
rs f
rom
rai
lroa
d re
tire
men
t acc
ount
4
Gen
eral
rev
enue
for
uni
nsur
ed p
erso
ns a
nd m
ilit
ary
wag
e c
redi
ts
5 P
rem
ium
s fr
om v
olun
tary
enr
olle
es
6 I
nter
est o
n in
vest
men
ts
Con
trib
utio
n ra
te
2014
20
15
2016
Per
cent
Em
ploy
ees
and
empl
oyer
s e
ach
145
1
45
145
S
elf-
empl
oyed
2
90
2
90
29
0
Max
imum
taxa
ble
amou
nt (
CY
201
6)
Non
e1
Vol
unta
ry H
I m
onth
ly p
rem
ium
2 $
411
00
Par
t A
(ef
fect
ive
dat
e)
Inpa
tien
t hos
pita
l
ded
ucti
ble
(11
16)
Reg
ular
coi
nsur
ance
d
ays
(11
16)
L
ifet
ime
rese
rve
days
(1
116
) S
NF
coi
nsur
ance
day
s
(11
16)
B
lood
ded
ucti
ble
Vol
unta
ry h
ospi
tal i
nsur
ance
prem
ium
(1
116
)2
Lim
itat
ion
s
Inpa
tien
t psy
chia
tric
hos
pita
ls
Am
oun
t
$12
88b
enef
it p
erio
d
$3
22d
ay f
or 6
1st
th
roug
h 90
th d
ay
$644
day
(60
non
-
rene
wab
le d
ays)
$161
day
for
21s
t
thro
ugh
100t
h da
y
firs
t 3 p
ints
cal
enda
r ye
ar
$411
mon
th $
226
mo
wit
h 30
-39
quar
ters
of c
over
age
19
0 no
nren
ewab
le d
ays
1 The
Om
nibu
s R
econ
cili
atio
n A
ct o
f 19
93 e
lim
inat
ed th
e A
nnua
l Max
imum
Tax
able
Ear
ning
s am
ount
s fo
r 19
94 a
nd la
ter
For
thes
e ye
ars
the
co
ntri
buti
on r
ate
is a
ppli
ed to
all
ear
ning
s in
cov
ered
em
ploy
men
t
2 Prem
ium
pai
d fo
r vo
lunt
ary
part
icip
atio
n of
indi
vidu
als
aged
65
and
over
not
oth
erw
ise
entit
led
to h
ospi
tal i
nsur
ance
and
cer
tain
dis
able
d in
divi
dual
sw
ho h
ave
exha
uste
d ot
her
enti
tlem
ent
A r
educ
ed p
rem
ium
of
$226
is a
vail
able
to in
divi
dual
s ag
ed 6
5 an
d ov
er w
ho a
re n
ot o
ther
wis
e en
titl
ed to
ho
spit
al in
sura
nce
but w
ho h
ave
or
who
se s
pous
e ha
s or
had
30-
39 q
uart
ers
of c
over
age
unde
r T
itle
II
of th
e So
cial
Sec
urit
y A
ct
SO
UR
CE
C
MS
Off
ice
of th
e A
ctua
ry
Pro
gram
Fin
anci
ng
Cos
t S
har
ing
and
Lim
itat
ion
s
Med
icar
e P
art
B
Sup
plem
enta
ry M
edic
al I
nsur
ance
trus
t fun
d 1
P
rem
ium
s pa
id b
y or
on
beha
lf o
f en
roll
ees
2 G
ener
al r
even
ue
3 I
nter
est o
n in
vest
men
ts
Par
t B
(ef
fect
ive
dat
e)
Am
oun
t D
educ
tibl
e (1
11
6) $
166
in a
llow
ed c
harg
esy
ear
Blo
od d
educ
tibl
e f
irst
3 p
ints
cal
enda
r ye
ar
Coi
nsur
ance
1 20
per
cent
of
allo
wed
cha
rges
M
onth
ly s
tand
ard
prem
ium
(1
116
) $
104
90m
onth
Lim
itat
ion
s O
utpa
tien
t tre
atm
ent f
or m
enta
l ill
ness
N
o li
mit
atio
ns
1 The
Par
t B d
educ
tibl
e an
d co
insu
ranc
e ap
plie
s to
mos
t ser
vice
s I
tem
s an
dor
ser
vice
s no
t sub
ject
to e
ithe
r th
e de
duct
ible
or
coin
sura
nce
are
cl
inic
al d
iagn
osti
c la
b te
sts
subj
ect t
o a
fee
sche
dule
hom
e he
alth
ser
vice
s it
ems
and
serv
ices
fur
nish
ed in
con
nect
ion
to o
btai
ning
a s
econ
d or
th
ird
opin
ion
and
som
e pr
even
tive
serv
ices
SO
UR
CE
C
MS
Off
ice
of th
e A
ctua
ry
Pro
gram
Fin
anci
ng
Cos
t S
har
ing
and
Lim
itat
ion
s
Med
icar
e P
art
B (
con
tin
ued
)
Lis
ted
belo
w a
re th
e 20
16 P
art B
mon
thly
pre
miu
m r
ates
to b
e pa
id b
y be
nefi
ciar
ies
who
fil
e an
indi
vidu
al ta
x re
turn
(inc
ludi
ng th
ose
who
are
sin
gle
hea
d of
hou
seho
ld q
ualif
ying
wid
ow(e
r) w
ith
depe
nden
t chi
ld o
r m
arri
ed f
ilin
g se
para
tely
w
ho li
ved
apar
t fro
m th
eir
spou
se f
or th
e en
tire
taxa
ble
year
) o
r a
join
t tax
ret
urn
Ben
efic
iari
es w
ho f
ile
an in
divi
dual
B
enef
icia
ries
who
fil
e a
join
t tax
In
com
e-re
late
d m
onth
lyT
otal
mon
thly
tax
retu
rn w
ith
inco
me
re
turn
wit
h in
com
e
adju
stm
ent a
mou
nt
prem
ium
am
ount
Les
s th
an o
r eq
ual t
o $8
500
0 L
ess
than
or
equa
l to
$170
000
$0
00
$121
80
Gre
ater
than
$85
000
and
less
than
Gre
ater
than
$17
000
0 an
d le
ss th
an
or e
qual
to $
107
000
or e
qual
to $
214
000
$4
870
$1
705
0
Gre
ater
than
$10
700
0 an
d le
ss th
an
G
reat
er th
an $
214
000
and
less
than
or
equ
al to
$16
000
0 or
equ
al to
$32
000
0
$121
80
$243
60
Gre
ater
than
$16
000
0 an
d le
ss th
an
G
reat
er th
an $
320
000
and
less
than
or
equ
al to
$21
400
0 or
equ
al to
$42
800
0
$194
90
$316
70
Gre
ater
than
$21
400
0 G
reat
er th
an $
428
000
$268
00
$389
80
In a
ddit
ion
the
mon
thly
pre
miu
m r
ates
to b
e pa
id b
y be
nefi
ciar
ies
who
are
mar
ried
and
live
d w
ith
thei
r sp
ouse
at a
ny ti
me
duri
ng th
e ta
xabl
e ye
ar b
ut f
ile
a se
para
te ta
x re
turn
fro
m th
eir
spou
se a
re li
sted
bel
ow
Tot
al m
onth
ly
spou
se a
nd f
iled
a s
epar
ate
tax
retu
rn
adju
stm
ent a
mou
nt
prem
ium
am
ount
M
arri
ed b
enef
icia
ries
who
live
d w
ith
thei
r In
com
e-re
late
d m
onth
ly
$121
80
Les
s th
an o
r eq
ual t
o $8
500
0 $0
00
$316
70
Gre
ater
than
$85
000
and
less
than
or
equa
l to
$129
000
$194
90
$389
80
Gre
ater
than
$12
900
0 $2
680
0
SO
UR
CE
C
MS
Off
ice
of th
e A
ctua
ry
Pro
gram
Fin
anci
ng
Cos
t S
har
ing
and
Lim
itat
ion
s
Med
icar
e P
art
D S
tan
dar
d B
enef
its
Ded
ucti
ble
(11
201
6)
$360
in c
harg
esy
ear
Init
ial c
over
age
lim
it (
11
2016
) $3
310
in c
harg
esy
ear
Out
-of-
pock
et th
resh
old
(11
201
6)
$48
50 in
cha
rges
yea
r B
ase
bene
fici
ary
prem
ium
(1
120
16)1
$34
10m
onth
Med
icai
d F
inan
cin
g 1
F
eder
al c
ontr
ibut
ions
(ra
ngin
g fr
om 5
0 to
74
perc
ent f
or f
isca
l yea
r 20
16)
2
Sta
te c
ontr
ibut
ions
(ra
ngin
g fr
om 2
6 to
50
perc
ent f
or f
isca
l yea
r 20
16)
1 The
bas
e be
nefi
ciar
y pr
emiu
m w
as c
alcu
late
d ba
sed
on a
nat
iona
l ave
rage
pla
n bi
d T
he a
ctua
l pre
miu
m th
at a
ben
efic
iary
pay
s va
ries
ac
cord
ing
to th
e pl
an in
whi
ch th
e be
nefi
ciar
y is
enr
olle
d
NO
TE
S
The
ben
efic
iari
es w
ho q
uali
fy f
or th
e lo
w-i
ncom
e su
bsid
y un
der
Par
t D p
ay a
red
uced
or
zero
pre
miu
m
In a
ddit
ion
low
-inc
ome
bene
fici
arie
s ar
e su
bjec
t to
only
min
imal
cop
aym
ent a
mou
nts
in m
ost i
nsta
nces
SO
UR
CE
C
MS
Off
ice
of th
e A
ctua
ry
Geographical Jurisdictions of CMS Regional Offices and Medicaid Federal Medical Assistance Percentages (FMAP) fiscal year 2016
I Boston FMAP II New York FMAP ConnecticutMaine
5000 6267
New Jersey New York
5000 5000
Massachusetts 5000 Puerto Rico 5500 New Hampshire 5000 Virgin Islands 5500 Rhode Island 5042 Vermont 5390 IV Atlanta
Alabama 6987 III Philadelphia
Delaware 5483 Dist of Columbia 7000
Maryland 5000 Pennsylvania 5201 Virginia 5000
West Virginia 7142
Florida Georgia
Kentucky Mississippi North Carolina South Carolina Tennessee
6067 6755 7032 7417 6624 7108 6505
V Chicago Illinois 5089
VI Dallas Arkansas 7000
Indiana 6660 Louisiana 6221 Michigan Minnesota
6560 5000
New Mexico Oklahoma
7037 6099
Ohio 6247 Texas 5713 Wisconsin 5823
VIII DenverVII Kansas City
Iowa 5491 Colorado
Montana 5072 6524
Kansas 5596 North Dakota 5000 Missouri 6328 South Dakota 5161 Nebraska 5116 Utah 7024
Wyoming 5000IX San Francisco
Arizona 6892 X Seattle California 5000 Alaska 5000
Hawaii 5398 Idaho 7124 Nevada 6493 Oregon 6438 American Samoa 5500 Washington 5000 Guam 5500 N Mariana Islds 5500
NOTE FMAPs are used in determining the amount of Federal matchingfunds for State expenditures for assistance payments
SOURCE DHHS Assistant Secretary for Planning and Evaluation
US Department of Health amp Human Services Centers for Medicare amp Medicaid Services Office of Enterprise Data and Analytics CMS Pub No 03512 December 2015
- Structure Bookmarks
-
- 2015 CMS Statistics
- Centers for Medicare amp Medicaid Services
- Office of Enterprise Data and Analytics
- Information Products Group
- Publication Coordinators
- Publication Staff
- Preface
- I Populations 5
- GDP
- NF
- Table I1
- Table I2 Medicare EnrollmentCoverage
- Table I3
- Table I5 Medicare ESRD EnrollmentTrends
- Table I6 Medicare ESRD EnrollmentDemographics
- All regions
- In thousands
- Table I10 Medicare Part D Enrollment by CMS Region
- Table I12 Medicare Part D and RDS EnrollmentCMS Region
- Table I13 Projected Population
- Table I14
- Table I15 Life Expectancy at Birth and at Age 65 by RaceTrends
- Table I18
- Table I19 Medicaid BeneficiariesState Buy-Ins for Medicare
- Total hospitals
- All regions
- Total participating hospitals
- Home health agencies
- Table II6
- Hospitals Number of PIP Percent of total participating
- Count
- Count
- Total
- 1967
- In millions
- 2013
- Total Part A23
- National total in billions
- Table III8
- In millions
- Total
- Discharges
- 1975
- 2010
- Table IV6
- Disabled
- Parts A andor B
- Dialysis
- Table
- In thousands
- (Part A Cases Involved)
- Table V4 Medicare PhysicianSupplier Claims Assignment Rates
- Table V6 Medicare Claims Received
- Table V7
- for Federal funding1
- I Boston
-
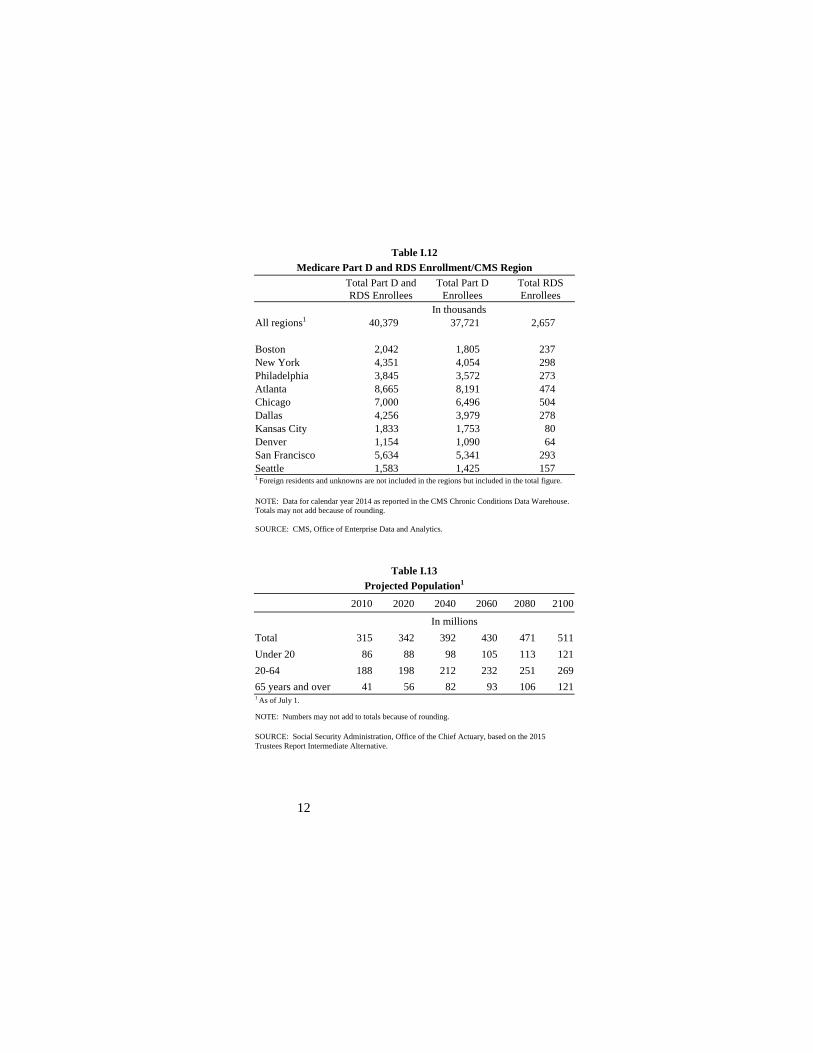
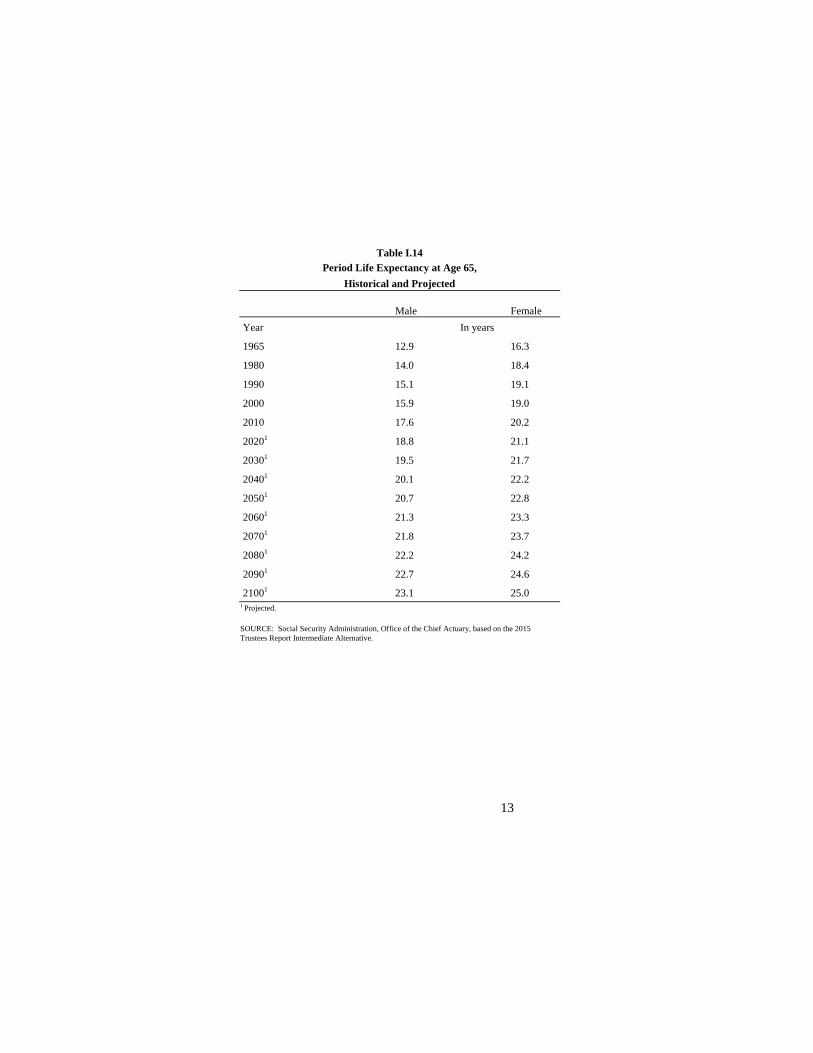
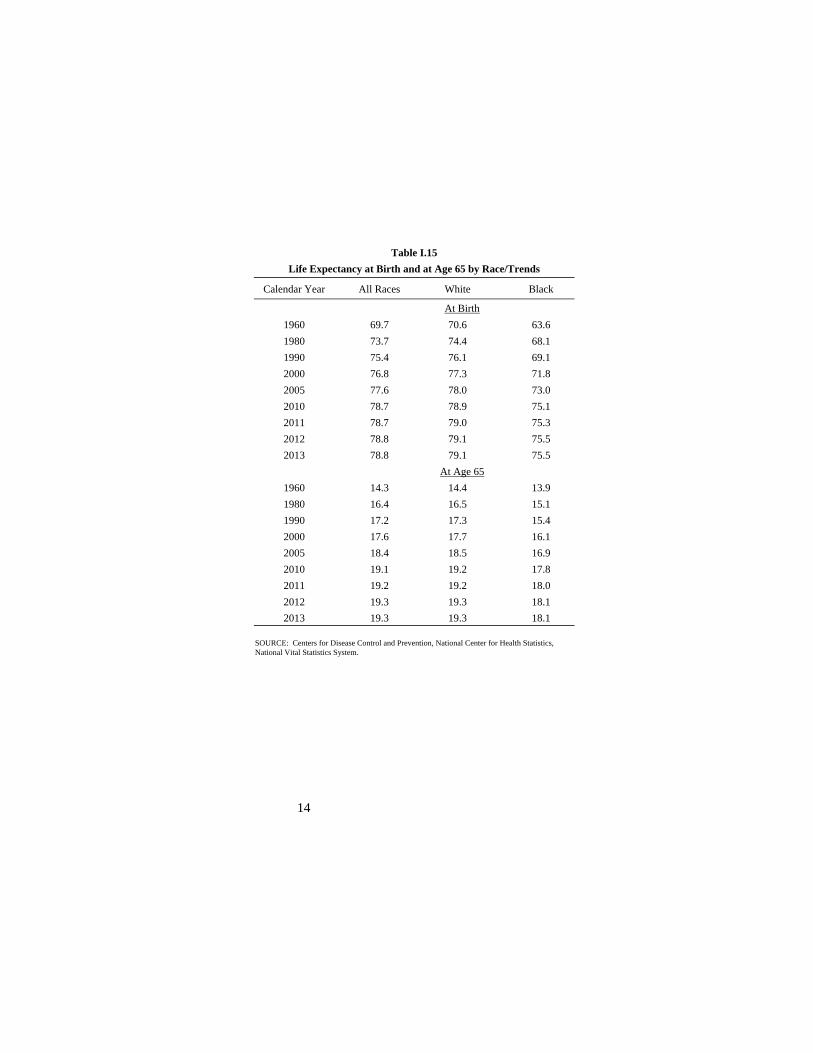
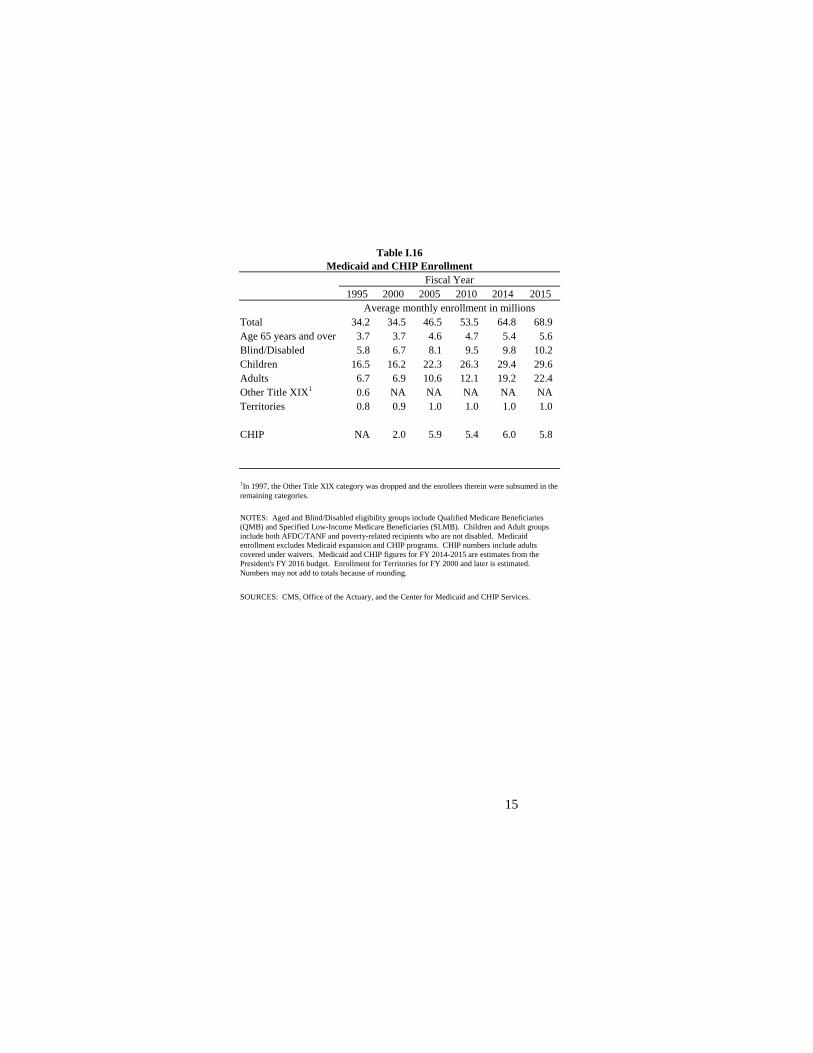
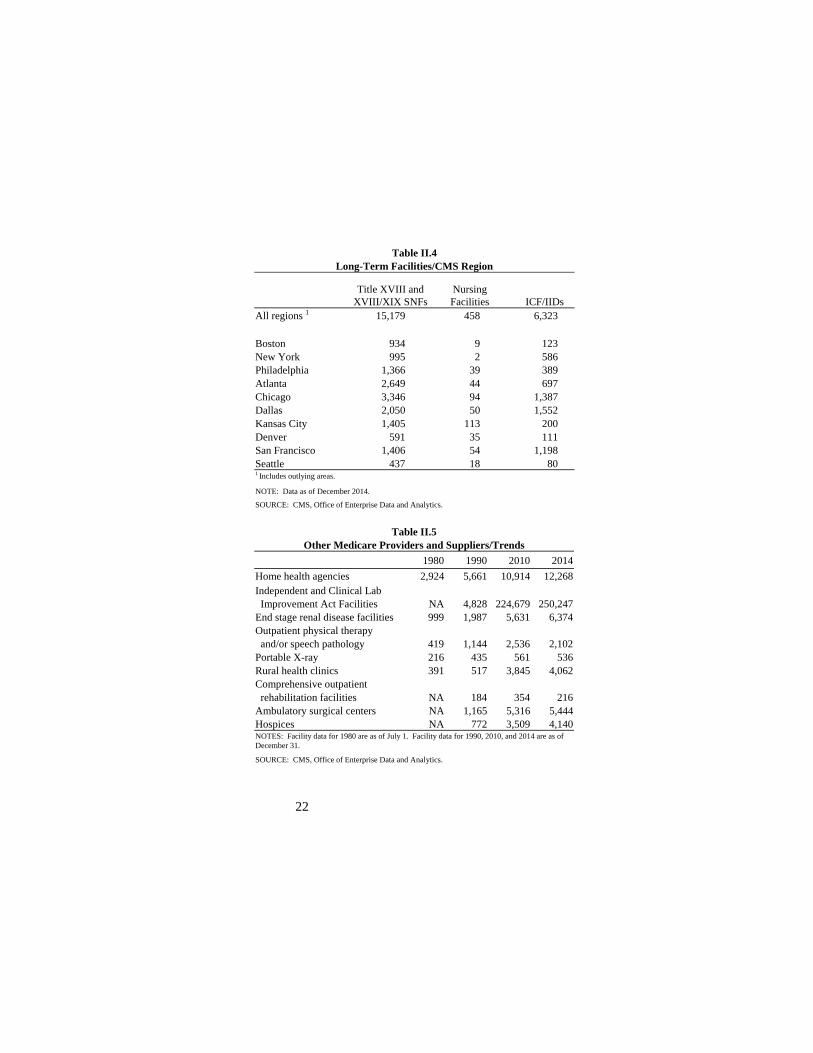
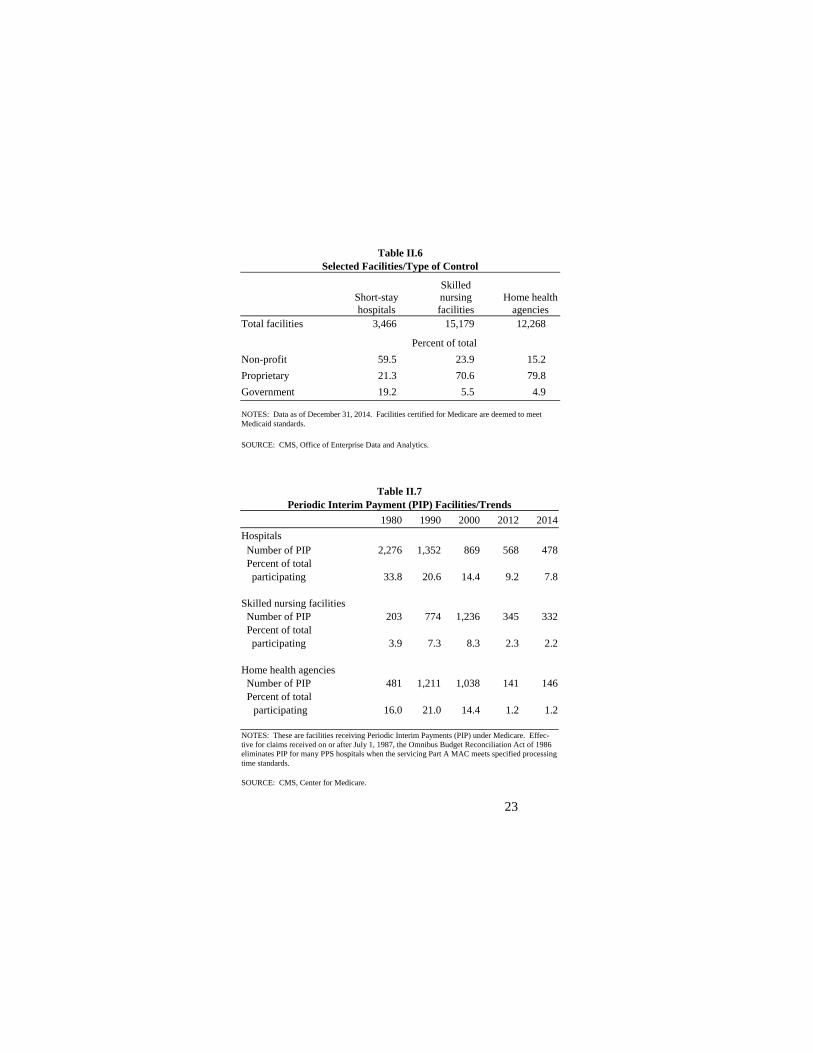
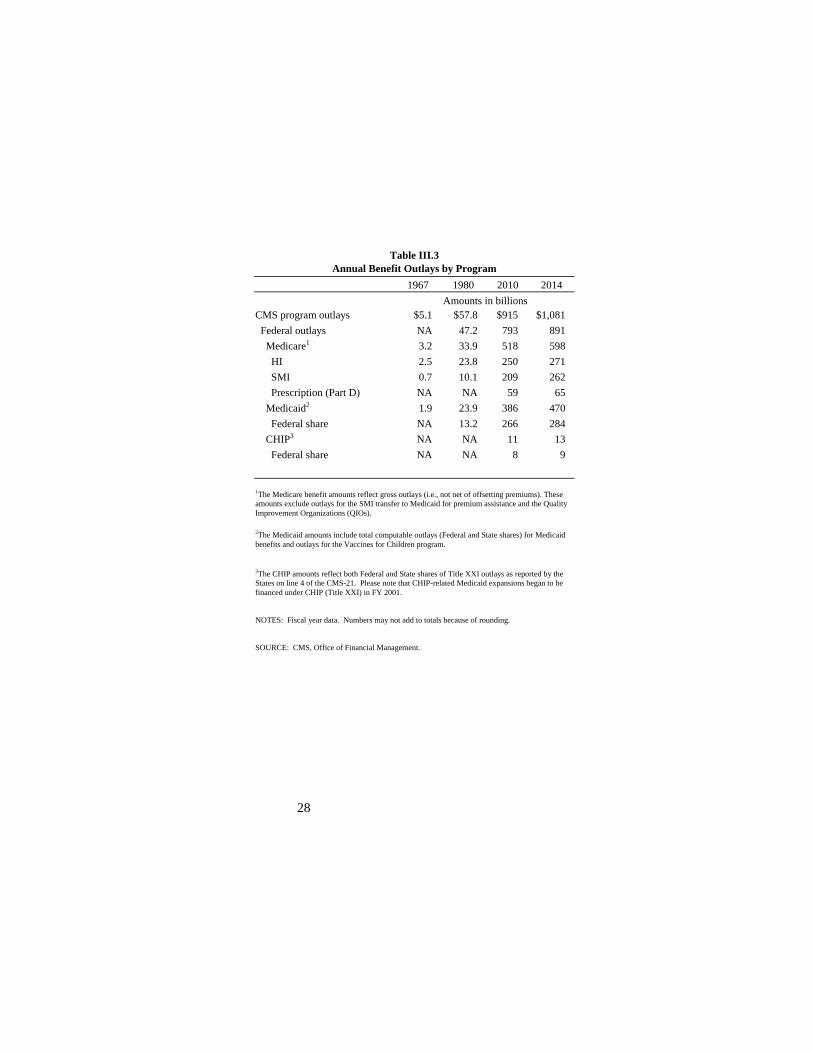
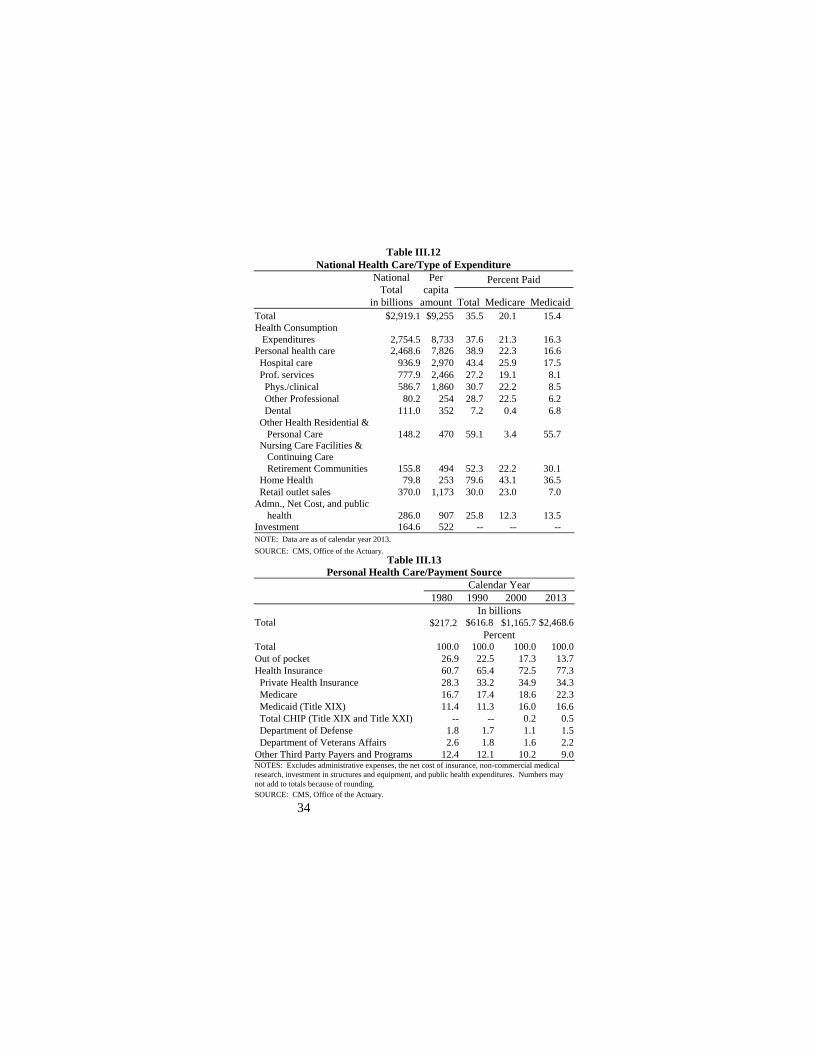
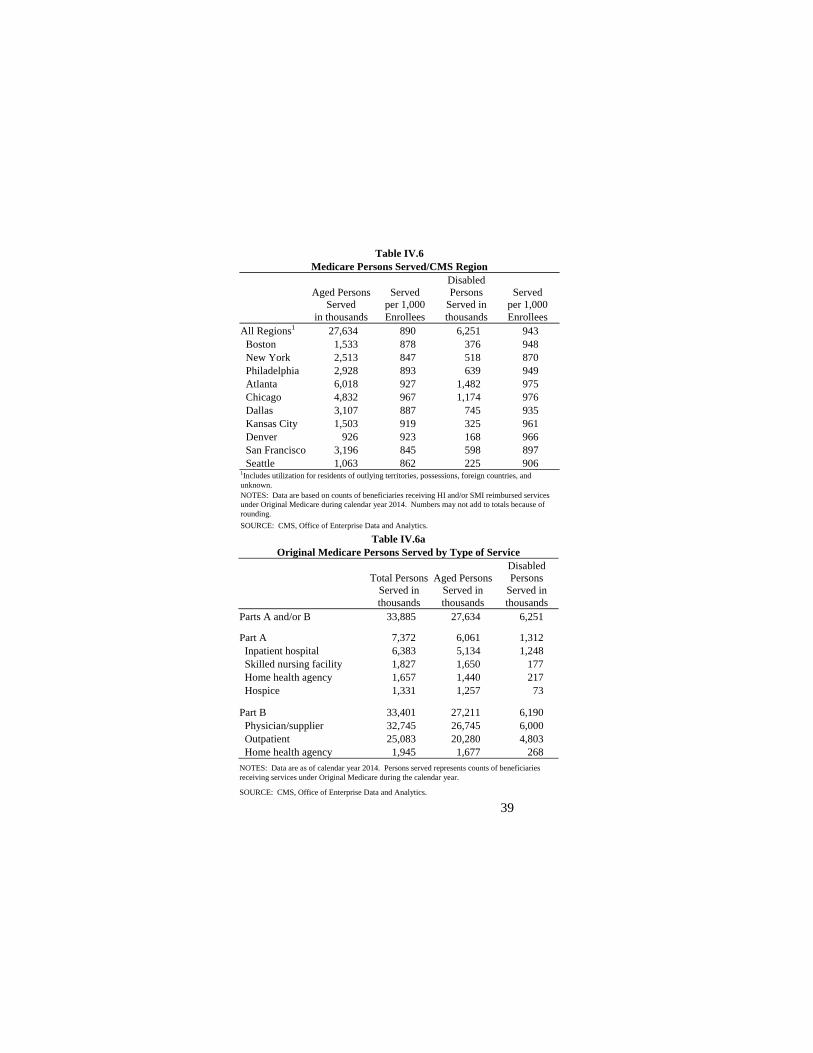
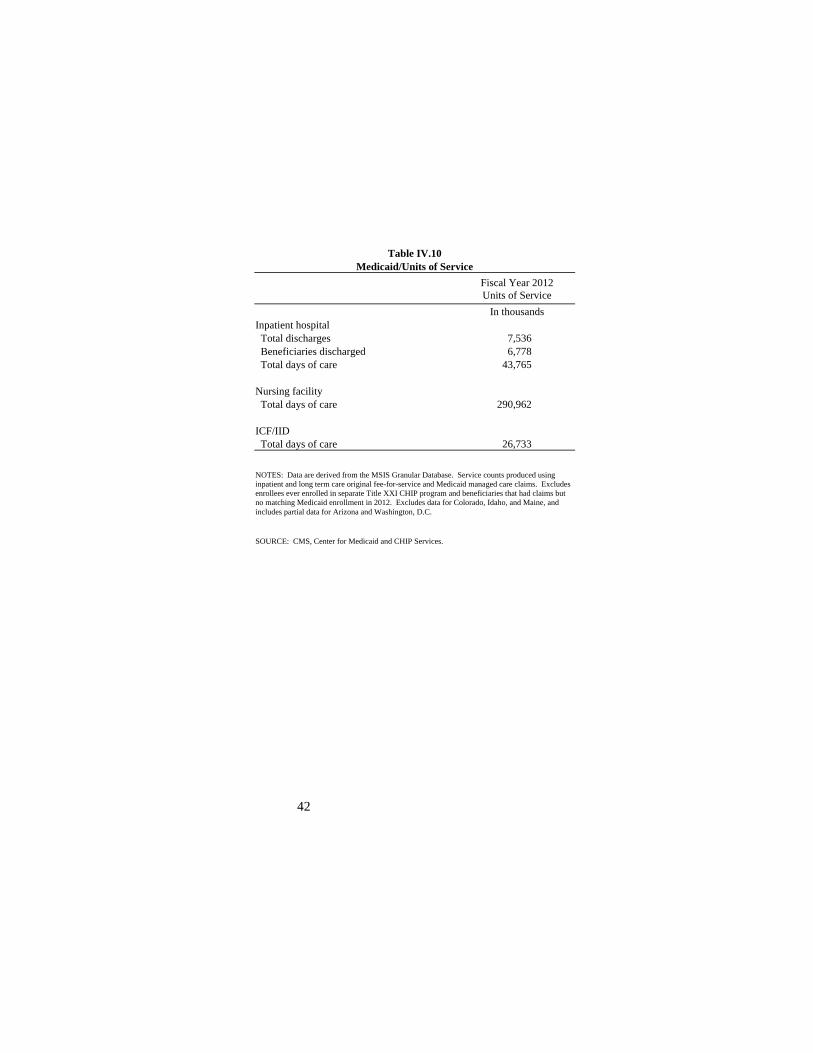
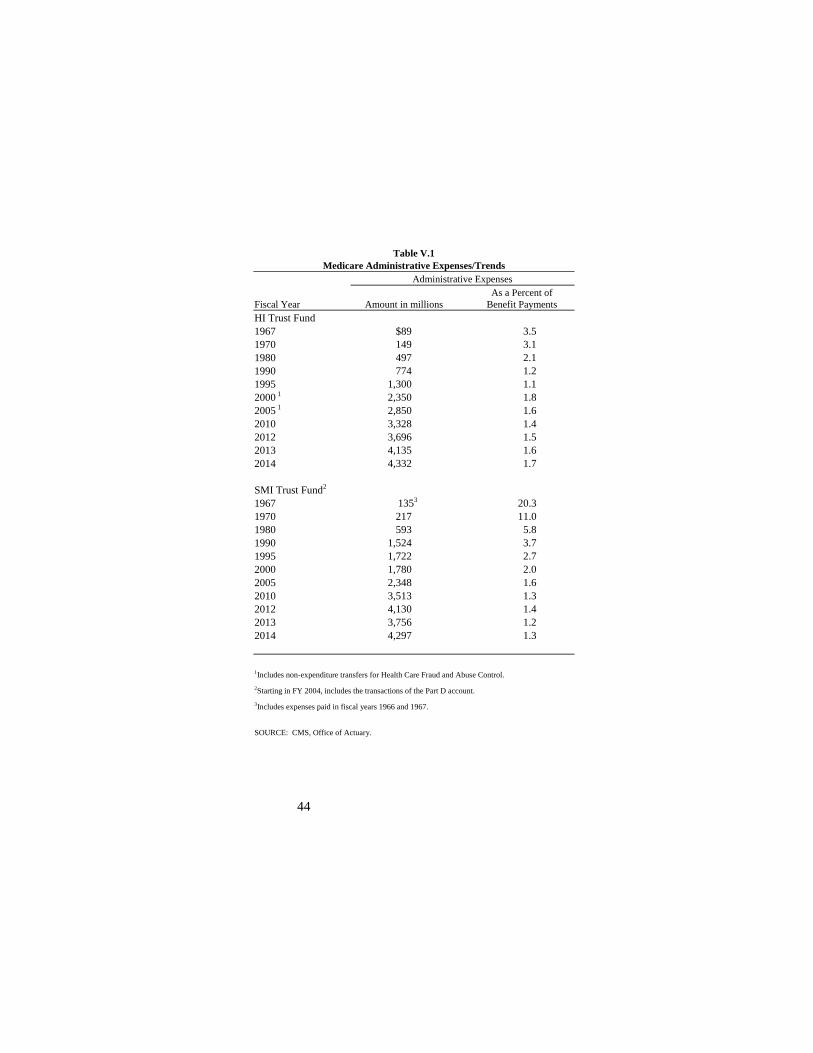
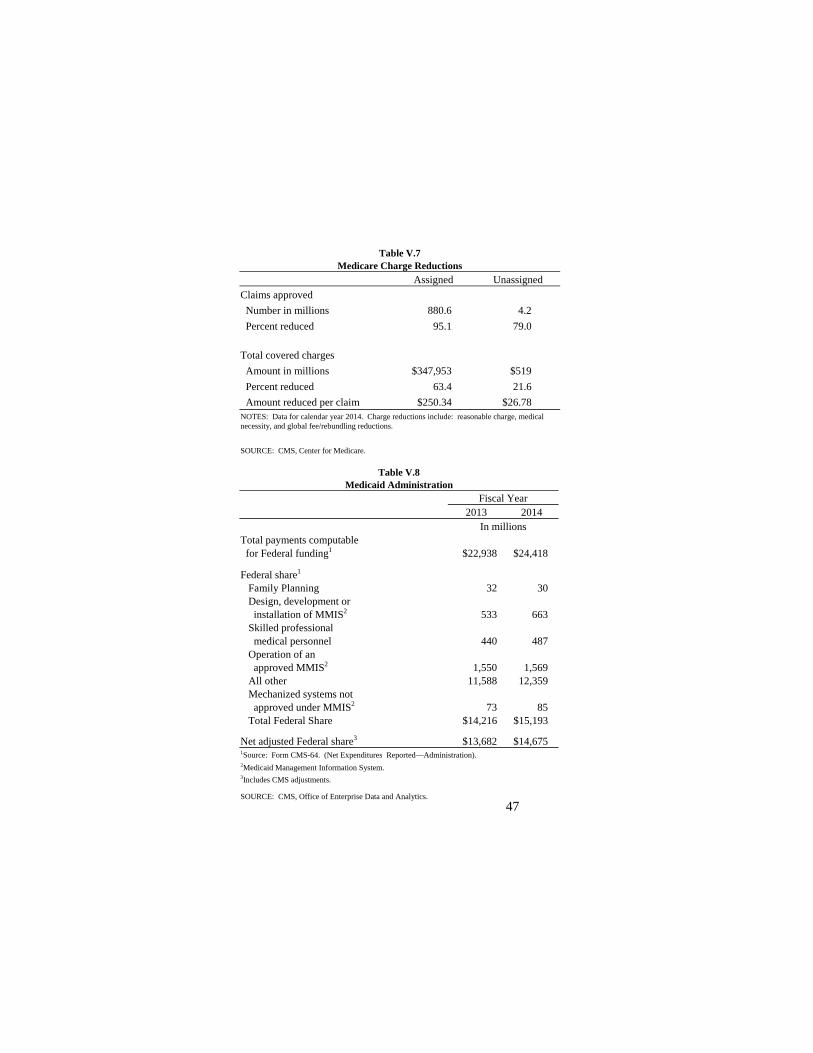
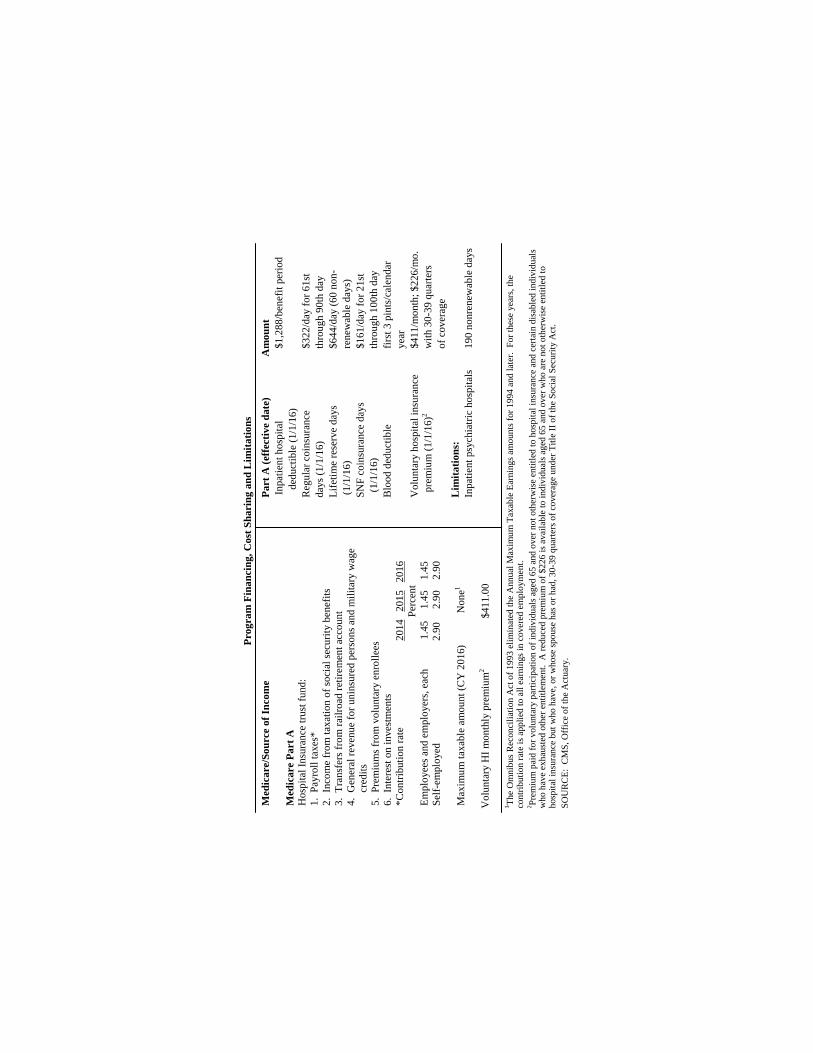
Pro
gram
Fin
anci
ng
Cos
t S
har
ing
and
Lim
itat
ion
s
Med
icar
e P
art
B
Sup
plem
enta
ry M
edic
al I
nsur
ance
trus
t fun
d 1
P
rem
ium
s pa
id b
y or
on
beha
lf o
f en
roll
ees
2 G
ener
al r
even
ue
3 I
nter
est o
n in
vest
men
ts
Par
t B
(ef
fect
ive
dat
e)
Am
oun
t D
educ
tibl
e (1
11
6) $
166
in a
llow
ed c
harg
esy
ear
Blo
od d
educ
tibl
e f
irst
3 p
ints
cal
enda
r ye
ar
Coi
nsur
ance
1 20
per
cent
of
allo
wed
cha
rges
M
onth
ly s
tand
ard
prem
ium
(1
116
) $
104
90m
onth
Lim
itat
ion
s O
utpa
tien
t tre
atm
ent f
or m
enta
l ill
ness
N
o li
mit
atio
ns
1 The
Par
t B d
educ
tibl
e an
d co
insu
ranc
e ap
plie
s to
mos
t ser
vice
s I
tem
s an
dor
ser
vice
s no
t sub
ject
to e
ithe
r th
e de
duct
ible
or
coin
sura
nce
are
cl
inic
al d
iagn
osti
c la
b te
sts
subj
ect t
o a
fee
sche
dule
hom
e he
alth
ser
vice
s it
ems
and
serv
ices
fur
nish
ed in
con
nect
ion
to o
btai
ning
a s
econ
d or
th
ird
opin
ion
and
som
e pr
even
tive
serv
ices
SO
UR
CE
C
MS
Off
ice
of th
e A
ctua
ry
Pro
gram
Fin
anci
ng
Cos
t S
har
ing
and
Lim
itat
ion
s
Med
icar
e P
art
B (
con
tin
ued
)
Lis
ted
belo
w a
re th
e 20
16 P
art B
mon
thly
pre
miu
m r
ates
to b
e pa
id b
y be
nefi
ciar
ies
who
fil
e an
indi
vidu
al ta
x re
turn
(inc
ludi
ng th
ose
who
are
sin
gle
hea
d of
hou
seho
ld q
ualif
ying
wid
ow(e
r) w
ith
depe
nden
t chi
ld o
r m
arri
ed f
ilin
g se
para
tely
w
ho li
ved
apar
t fro
m th
eir
spou
se f
or th
e en
tire
taxa
ble
year
) o
r a
join
t tax
ret
urn
Ben
efic
iari
es w
ho f
ile
an in
divi
dual
B
enef
icia
ries
who
fil
e a
join
t tax
In
com
e-re
late
d m
onth
lyT
otal
mon
thly
tax
retu
rn w
ith
inco
me
re
turn
wit
h in
com
e
adju
stm
ent a
mou
nt
prem
ium
am
ount
Les
s th
an o
r eq
ual t
o $8
500
0 L
ess
than
or
equa
l to
$170
000
$0
00
$121
80
Gre
ater
than
$85
000
and
less
than
Gre
ater
than
$17
000
0 an
d le
ss th
an
or e
qual
to $
107
000
or e
qual
to $
214
000
$4
870
$1
705
0
Gre
ater
than
$10
700
0 an
d le
ss th
an
G
reat
er th
an $
214
000
and
less
than
or
equ
al to
$16
000
0 or
equ
al to
$32
000
0
$121
80
$243
60
Gre
ater
than
$16
000
0 an
d le
ss th
an
G
reat
er th
an $
320
000
and
less
than
or
equ
al to
$21
400
0 or
equ
al to
$42
800
0
$194
90
$316
70
Gre
ater
than
$21
400
0 G
reat
er th
an $
428
000
$268
00
$389
80
In a
ddit
ion
the
mon
thly
pre
miu
m r
ates
to b
e pa
id b
y be
nefi
ciar
ies
who
are
mar
ried
and
live
d w
ith
thei
r sp
ouse
at a
ny ti
me
duri
ng th
e ta
xabl
e ye
ar b
ut f
ile
a se
para
te ta
x re
turn
fro
m th
eir
spou
se a
re li
sted
bel
ow
Tot
al m
onth
ly
spou
se a
nd f
iled
a s
epar
ate
tax
retu
rn
adju
stm
ent a
mou
nt
prem
ium
am
ount
M
arri
ed b
enef
icia
ries
who
live
d w
ith
thei
r In
com
e-re
late
d m
onth
ly
$121
80
Les
s th
an o
r eq
ual t
o $8
500
0 $0
00
$316
70
Gre
ater
than
$85
000
and
less
than
or
equa
l to
$129
000
$194
90
$389
80
Gre
ater
than
$12
900
0 $2
680
0
SO
UR
CE
C
MS
Off
ice
of th
e A
ctua
ry
Pro
gram
Fin
anci
ng
Cos
t S
har
ing
and
Lim
itat
ion
s
Med
icar
e P
art
D S
tan
dar
d B
enef
its
Ded
ucti
ble
(11
201
6)
$360
in c
harg
esy
ear
Init
ial c
over
age
lim
it (
11
2016
) $3
310
in c
harg
esy
ear
Out
-of-
pock
et th
resh
old
(11
201
6)
$48
50 in
cha
rges
yea
r B
ase
bene
fici
ary
prem
ium
(1
120
16)1
$34
10m
onth
Med
icai
d F
inan
cin
g 1
F
eder
al c
ontr
ibut
ions
(ra
ngin
g fr
om 5
0 to
74
perc
ent f
or f
isca
l yea
r 20
16)
2
Sta
te c
ontr
ibut
ions
(ra
ngin
g fr
om 2
6 to
50
perc
ent f
or f
isca
l yea
r 20
16)
1 The
bas
e be
nefi
ciar
y pr
emiu
m w
as c
alcu
late
d ba
sed
on a
nat
iona
l ave
rage
pla
n bi
d T
he a
ctua
l pre
miu
m th
at a
ben
efic
iary
pay
s va
ries
ac
cord
ing
to th
e pl
an in
whi
ch th
e be
nefi
ciar
y is
enr
olle
d
NO
TE
S
The
ben
efic
iari
es w
ho q
uali
fy f
or th
e lo
w-i
ncom
e su
bsid
y un
der
Par
t D p
ay a
red
uced
or
zero
pre
miu
m
In a
ddit
ion
low
-inc
ome
bene
fici
arie
s ar
e su
bjec
t to
only
min
imal
cop
aym
ent a
mou
nts
in m
ost i
nsta
nces
SO
UR
CE
C
MS
Off
ice
of th
e A
ctua
ry
Geographical Jurisdictions of CMS Regional Offices and Medicaid Federal Medical Assistance Percentages (FMAP) fiscal year 2016
I Boston FMAP II New York FMAP ConnecticutMaine
5000 6267
New Jersey New York
5000 5000
Massachusetts 5000 Puerto Rico 5500 New Hampshire 5000 Virgin Islands 5500 Rhode Island 5042 Vermont 5390 IV Atlanta
Alabama 6987 III Philadelphia
Delaware 5483 Dist of Columbia 7000
Maryland 5000 Pennsylvania 5201 Virginia 5000
West Virginia 7142
Florida Georgia
Kentucky Mississippi North Carolina South Carolina Tennessee
6067 6755 7032 7417 6624 7108 6505
V Chicago Illinois 5089
VI Dallas Arkansas 7000
Indiana 6660 Louisiana 6221 Michigan Minnesota
6560 5000
New Mexico Oklahoma
7037 6099
Ohio 6247 Texas 5713 Wisconsin 5823
VIII DenverVII Kansas City
Iowa 5491 Colorado
Montana 5072 6524
Kansas 5596 North Dakota 5000 Missouri 6328 South Dakota 5161 Nebraska 5116 Utah 7024
Wyoming 5000IX San Francisco
Arizona 6892 X Seattle California 5000 Alaska 5000
Hawaii 5398 Idaho 7124 Nevada 6493 Oregon 6438 American Samoa 5500 Washington 5000 Guam 5500 N Mariana Islds 5500
NOTE FMAPs are used in determining the amount of Federal matchingfunds for State expenditures for assistance payments
SOURCE DHHS Assistant Secretary for Planning and Evaluation
US Department of Health amp Human Services Centers for Medicare amp Medicaid Services Office of Enterprise Data and Analytics CMS Pub No 03512 December 2015
- Structure Bookmarks
-
- 2015 CMS Statistics
- Centers for Medicare amp Medicaid Services
- Office of Enterprise Data and Analytics
- Information Products Group
- Publication Coordinators
- Publication Staff
- Preface
- I Populations 5
- GDP
- NF
- Table I1
- Table I2 Medicare EnrollmentCoverage
- Table I3
- Table I5 Medicare ESRD EnrollmentTrends
- Table I6 Medicare ESRD EnrollmentDemographics
- All regions
- In thousands
- Table I10 Medicare Part D Enrollment by CMS Region
- Table I12 Medicare Part D and RDS EnrollmentCMS Region
- Table I13 Projected Population
- Table I14
- Table I15 Life Expectancy at Birth and at Age 65 by RaceTrends
- Table I18
- Table I19 Medicaid BeneficiariesState Buy-Ins for Medicare
- Total hospitals
- All regions
- Total participating hospitals
- Home health agencies
- Table II6
- Hospitals Number of PIP Percent of total participating
- Count
- Count
- Total
- 1967
- In millions
- 2013
- Total Part A23
- National total in billions
- Table III8
- In millions
- Total
- Discharges
- 1975
- 2010
- Table IV6
- Disabled
- Parts A andor B
- Dialysis
- Table
- In thousands
- (Part A Cases Involved)
- Table V4 Medicare PhysicianSupplier Claims Assignment Rates
- Table V6 Medicare Claims Received
- Table V7
- for Federal funding1
- I Boston
-
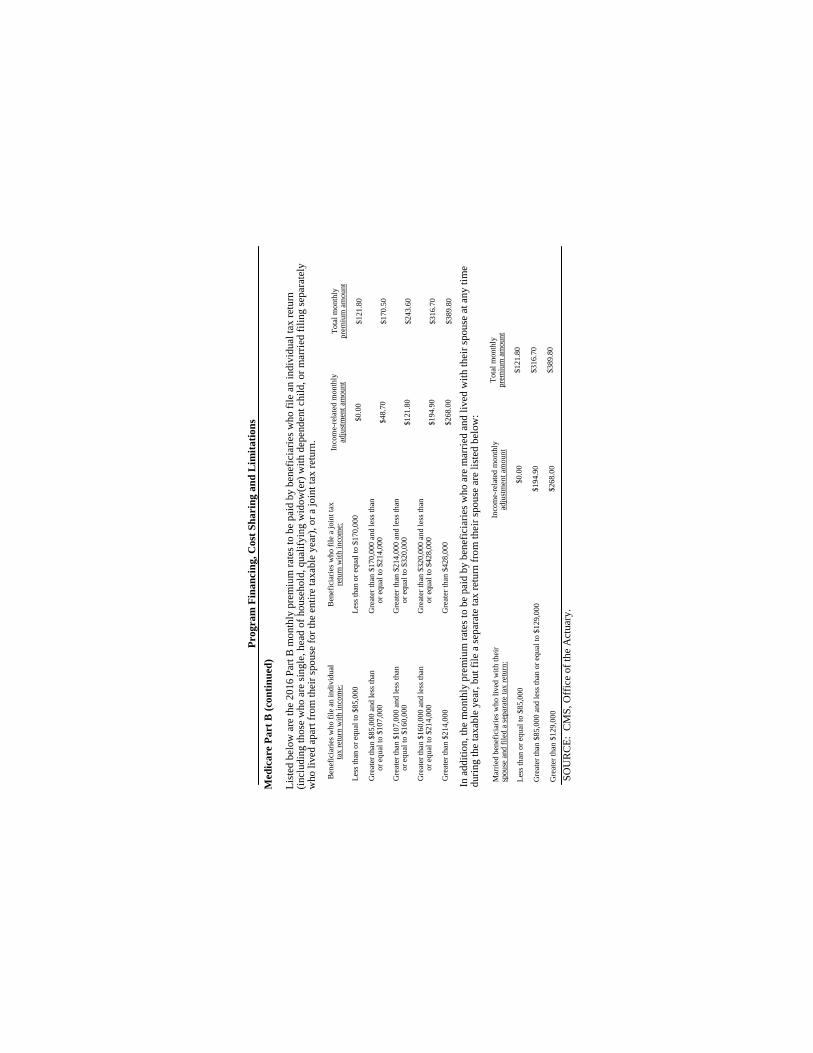
Pro
gram
Fin
anci
ng
Cos
t S
har
ing
and
Lim
itat
ion
s
Med
icar
e P
art
D S
tan
dar
d B
enef
its
Ded
ucti
ble
(11
201
6)
$360
in c
harg
esy
ear
Init
ial c
over
age
lim
it (
11
2016
) $3
310
in c
harg
esy
ear
Out
-of-
pock
et th
resh
old
(11
201
6)
$48
50 in
cha
rges
yea
r B
ase
bene
fici
ary
prem
ium
(1
120
16)1
$34
10m
onth
Med
icai
d F
inan
cin
g 1
F
eder
al c
ontr
ibut
ions
(ra
ngin
g fr
om 5
0 to
74
perc
ent f
or f
isca
l yea
r 20
16)
2
Sta
te c
ontr
ibut
ions
(ra
ngin
g fr
om 2
6 to
50
perc
ent f
or f
isca
l yea
r 20
16)
1 The
bas
e be
nefi
ciar
y pr
emiu
m w
as c
alcu
late
d ba
sed
on a
nat
iona
l ave
rage
pla
n bi
d T
he a
ctua
l pre
miu
m th
at a
ben
efic
iary
pay
s va
ries
ac
cord
ing
to th
e pl
an in
whi
ch th
e be
nefi
ciar
y is
enr
olle
d
NO
TE
S
The
ben
efic
iari
es w
ho q
uali
fy f
or th
e lo
w-i
ncom
e su
bsid
y un
der
Par
t D p
ay a
red
uced
or
zero
pre
miu
m
In a
ddit
ion
low
-inc
ome
bene
fici
arie
s ar
e su
bjec
t to
only
min
imal
cop
aym
ent a
mou
nts
in m
ost i
nsta
nces
SO
UR
CE
C
MS
Off
ice
of th
e A
ctua
ry
Geographical Jurisdictions of CMS Regional Offices and Medicaid Federal Medical Assistance Percentages (FMAP) fiscal year 2016
I Boston FMAP II New York FMAP ConnecticutMaine
5000 6267
New Jersey New York
5000 5000
Massachusetts 5000 Puerto Rico 5500 New Hampshire 5000 Virgin Islands 5500 Rhode Island 5042 Vermont 5390 IV Atlanta
Alabama 6987 III Philadelphia
Delaware 5483 Dist of Columbia 7000
Maryland 5000 Pennsylvania 5201 Virginia 5000
West Virginia 7142
Florida Georgia
Kentucky Mississippi North Carolina South Carolina Tennessee
6067 6755 7032 7417 6624 7108 6505
V Chicago Illinois 5089
VI Dallas Arkansas 7000
Indiana 6660 Louisiana 6221 Michigan Minnesota
6560 5000
New Mexico Oklahoma
7037 6099
Ohio 6247 Texas 5713 Wisconsin 5823
VIII DenverVII Kansas City
Iowa 5491 Colorado
Montana 5072 6524
Kansas 5596 North Dakota 5000 Missouri 6328 South Dakota 5161 Nebraska 5116 Utah 7024
Wyoming 5000IX San Francisco
Arizona 6892 X Seattle California 5000 Alaska 5000
Hawaii 5398 Idaho 7124 Nevada 6493 Oregon 6438 American Samoa 5500 Washington 5000 Guam 5500 N Mariana Islds 5500
NOTE FMAPs are used in determining the amount of Federal matchingfunds for State expenditures for assistance payments
SOURCE DHHS Assistant Secretary for Planning and Evaluation
US Department of Health amp Human Services Centers for Medicare amp Medicaid Services Office of Enterprise Data and Analytics CMS Pub No 03512 December 2015
- Structure Bookmarks
-
- 2015 CMS Statistics
- Centers for Medicare amp Medicaid Services
- Office of Enterprise Data and Analytics
- Information Products Group
- Publication Coordinators
- Publication Staff
- Preface
- I Populations 5
- GDP
- NF
- Table I1
- Table I2 Medicare EnrollmentCoverage
- Table I3
- Table I5 Medicare ESRD EnrollmentTrends
- Table I6 Medicare ESRD EnrollmentDemographics
- All regions
- In thousands
- Table I10 Medicare Part D Enrollment by CMS Region
- Table I12 Medicare Part D and RDS EnrollmentCMS Region
- Table I13 Projected Population
- Table I14
- Table I15 Life Expectancy at Birth and at Age 65 by RaceTrends
- Table I18
- Table I19 Medicaid BeneficiariesState Buy-Ins for Medicare
- Total hospitals
- All regions
- Total participating hospitals
- Home health agencies
- Table II6
- Hospitals Number of PIP Percent of total participating
- Count
- Count
- Total
- 1967
- In millions
- 2013
- Total Part A23
- National total in billions
- Table III8
- In millions
- Total
- Discharges
- 1975
- 2010
- Table IV6
- Disabled
- Parts A andor B
- Dialysis
- Table
- In thousands
- (Part A Cases Involved)
- Table V4 Medicare PhysicianSupplier Claims Assignment Rates
- Table V6 Medicare Claims Received
- Table V7
- for Federal funding1
- I Boston
-