cmt level i sample exam - cmt association – … cmt level i exam preface: the following document...
TRANSCRIPT

SAMPLE
CMT LEVEL I EXAM
PREFACE:
The following document is a sample exam paper. The questions have been constructed/ phrased
in a manner that is similar to past exams. The objective of this sample exam is to give a clear
indication of the question structure and language one can expect in the exam.
Important points to note
Please note that there may be up to 25% variation in the question mix in the Level II
exams as changes in administration occur. Also note that these sample questions are
patterned after a limited number of questions drawn from a much larger pool of actual
exam questions. This further increases the chances that the questions appearing in the
exam may be significantly different from those contained in this sample. Candidates are
cautioned not to expect the questions from the previous years’ exams to appear in the
current year.
In addition, these sample questions cover a variety of topics; however, in the actual exam
the weighting may vary, i.e. the proportion of questions drawn from different topics may
be different from the pattern followed in this sample paper. The actual exam consists of
135 questions of which 120 are scored items.
In some aspects, these sample questions are designed differently from the actual exam so
as to better serve as a reviewing tool for candidates. For example, many questions and/or
answers may be longer than in the actual exam so that the questions and answers serve as
a review of the material.
Please note that this sample question booklet has been prepared completely independently from
the exam to ensure that the questions that will appear in the actual exam paper remain secure and
confidential. The MTA maintains a discussion group forum for CMT candidates on its web site.
Candidates are encouraged to utilize this resource and to discuss and clarify questions regarding
the areas of the Body of Knowledge where they lack familiarity or seek better understanding.
This book of practice exams is produced by
Market Technicians Association, Inc.,
61 Broadway, Suite 514
New York, NY 10006

CMT Level 1 Sample Questions – Candidate Answer Sheet
1.________ 31.________ 61.________ 91.________ 121.________
2.________ 32.________ 62.________ 92.________ 122.________
3.________ 33.________ 63.________ 93.________ 123.________
4.________ 34.________ 64.________ 94.________ 124.________
5.________ 35.________ 65.________ 95.________ 125.________
6.________ 36.________ 66.________ 96.________ 126.________
7.________ 37.________ 67.________ 97.________ 127.________
8.________ 38.________ 68.________ 98.________ 128.________
9.________ 39.________ 69.________ 99.________ 129.________
10.________ 40.________ 70.________ 100.________ 130.________
11.________ 41.________ 71.________ 101.________ 131.________
12.________ 42.________ 72.________ 102.________ 132.________
13.________ 43.________ 73.________ 103.________ 133.________
14.________ 44.________ 74.________ 104.________ 134.________
15.________ 45.________ 75.________ 105.________ 135.________
16.________ 46.________ 76.________ 106.________ 136.________
17.________ 47.________ 77.________ 107.________ 137.________
18.________ 48.________ 78.________ 108.________ 138.________
19.________ 49.________ 79.________ 109.________ 139.________
20.________ 50.________ 80.________ 110.________ 140.________
21.________ 51.________ 81.________ 111.________ 141.________
22.________ 52.________ 82.________ 112.________ 142.________
23.________ 53.________ 83.________ 113.________ 143.________
24.________ 54.________ 84.________ 114.________ 144.________
25.________ 55.________ 85.________ 115.________ 145.________
26.________ 56.________ 86.________ 116.________ 146.________
27.________ 57.________ 87.________ 117.________ 147.________
28.________ 58.________ 88.________ 118.________ 148.________
29.________ 59.________ 89.________ 119.________ 149.________
30.________ 60.________ 90.________ 120.________ 150.________

1. David Johnson, a senior analyst with a brokerage firm, decides to change his
recommendation for the common stock of Pigeon Industries, Inc. from a “buy” to a
“sell”. This change in investment advice is mailed to all the firm’s clients on Wednesday.
Next day, a client calls in with a buy order for 500 shares of Pigeon Industries, Inc. In
this circumstance, Johnson should:
a) Accept the order.
b) Advise the customer of the change in recommendation after accepting the order.
c) Advise the customer of the change in recommendation before accepting the order.
d) Not accept the order because it is contrary to the firm’s recommendation.
2. The mosaic theory holds that an analyst:
a) Violates the Code and Standards if the analyst fails to have knowledge of and comply with
the applicable laws.
b) Can use material public information and nonmaterial nonpublic information in the
analyst’s analysis.
c) Should use all available and relevant information in support of an investment
recommendation.
d) Can use material and nonmaterial nonpublic information in the analyst’s analysis.
3. Bell is a portfolio manager. One of his firm’s clients has told Bell that he will compensate
him beyond the compensation provided by his firm on the basis of the capital
appreciation of his portfolio each year. Bell should:
a) Accept the arrangement before obtaining permission from his employer.
b) Obtain permission from his employer prior to accepting the compensation arrangement.
c) Turn down the additional compensation because it will create undue pressure on him to
achieve strong short-term performance.
d) Turn down the additional compensation because it will result in conflicts with the interests
of other client’s accounts.

4. Which of the following is a correct statement of a member’s or candidate’s duty under
the Code and Standards?
a) In the absence of specific applicable law or other regulatory requirements, the Code and
Standards govern the member’s or candidate’s actions.
b) A member or candidate is required to comply only with applicable local laws, rules,
regulations, or customs, even though the Code and Standards may impose a higher degree
of responsibility or a higher duty on the member or candidate.
c) A member or candidate who trades securities in a market where no applicable laws or
stock exchange rules regulate the use of material nonpublic information may take
investment action based on material nonpublic information.
d) A member or candidate who trades securities in a market where stock exchange rules
permit the use of material nonpublic information may take investment action based on
material nonpublic information after obtaining prior approval from his/her supervisor.
5. Elizabeth is a financial analyst with XYZ Brokerage Firm. She is preparing a purchase
recommendation on JNI Corporation. Which of the following situations is most likely to
represent a conflict of interest for Elizabeth that would have to be disclosed?
a) Elizabeth’s brother-in-law is a supplier to JNI.
b) Elizabeth frequently purchases items produced by JNI.
c) XYZ holds for its own account a substantial common stock position in JNI.
d) Elizabeth’s experience with purchasing items produced by JNI has been extremely
positive.
6. To increase the sensitivity of a 5x3 Point and Figure chart, one would:
a) Increase the box size
b) Decrease the box size
c) Increase the number of boxes needed for a reversal
d) Decrease the number of boxes needed for a reversal
7. A basic Point and Figure buy signal is triggered when:
a) A new “X” is marked in the current column of Xs
b) The current column of Xs rises above the previous column of Os by one box
c) The current column of Xs rises above the previous column of Xs by one box
d) The current column of Xs rises above the previous column of Xs by three boxes
8. In constructing a point and Figure chart, a new entry is added only when:
a) Price has moved to a new high or low
b) Volume confirms the price movement
c) Price has moved less than the specified box size
d) Price has moved equal to or more than the specified box size

9. Identify the Point and Figure pattern highlighted below:
a) Triple Top Buy
b) Bullish Double Top
c) Ascending Triple Top
d) Bullish Ascending Triangle Breakout
10. The Point and Figure pattern highlighted below is a:
a) Triple Top Buy
b) Bullish Diagonal Buy
c) Spread Triple Top Buy
d) Ascending Triple Top Buy

11. When the Stochastic indicator crosses below 20, it is signaling
a) The need to sell and liquidate a position for cash
b) An opportunity for a trader to buy
c) The lowest price in the last 20 sessions has just occurred
d) The price is vulnerable to a reversal, but no action needs to be taken just yet.
12. Which of the following principles describes a characteristic of related cycles
a) harmonics
b) phase shift
c) summation
d) fourier analysis
13. Which of the following formations is often called a coil?
a) Flag
b) Diamond Top
c) Wedge
d) Symmetrical Triangle
14. Bullish support lines on a 3-box reversal Point and Figure chart are drawn at a _____
degree angle:
a) 45
b) 60
c) 75
d) 90
15. The stock multiplication factor to adjust for a 30% stock dividend on a Point and Figure
chart is:
a) 1.1
b) 1.3
c) 1.33
d) 0.70
16. Which chart type uses more than one data point to plot a particular time interval?
a) Line
b) Tick
c) Candlestick
d) Point and Figure

17. __________ mean is the best choice when averaging ratios that can be either fractions or
percentages:
a) Arithmetic
b) Geometric
c) Quadratic
d) Harmonic
18. Kurtosis refers to the:
a) Peakedness or flatness of a distribution
b) Amount of distortion from a symmetrical distribution
c) Measures of dispersion that describe the shape of the data points
d) Persistence in data that suggests future data can be predicted using past data
19. Standard deviation is calculated by taking the square root of:
a) Variance
b) Mean deviation
c) Quadratic mean
d) Geometric mean
20. If the daily returns are constant, they can be converted to annualized risk by multiplying
the daily return with the square root of:
a) 365
b) 360
c) 252
d) 260
21. The Sharpe ratio is a measure of:
a) Risk
b) Volatility
c) Performance
d) System robustness
22. Seasonality is a cycle that occurs:
a) Monthly
b) Quarterly
c) Half-yearly
d) Yearly

23. Fungibility is:
a) Interchangeability of financial assets on distinct terms
b) Interchangeability of financial assets on identical terms
c) The ability of trends to act differently over similar periods
d) The ability of trends to act similarly over different periods
24. The cycle, along with trend and _____________ comprise the three orderly components
of price movement:
a) Direction
b) Volatility
c) Seasonality
d) Momentum
25. The global business cycle as identified by the Princeton Economic Institute measures:
a) 4 years
b) 8 years
c) 8.6 years
d) 10.5 years
26. Which of the following cycles is the longest by duration:
a) Decennial Pattern
b) Kondratieff Wave
c) Presidential Cycle
d) 34-year Historical Cycle
27. Typically, the _________ year of a president’s term posts the strongest returns for the
market as per the Presidential Cycle:
a) First
b) Second
c) Third
d) Fourth
28. An effective way of detrending price data to identify cycles is to:
a) Use an oscillator and identify extreme levels
b) Use a moving average of the highs/lows over n periods
c) Divide the closing prices by a moving average of those prices
d) Plot a linear regression (best-fit) line through the data midpoint

29. The New High-New Low index is calculated by:
a) Dividing New Highs by New Lows
b) Dividing New Lows by New Highs
c) Subtracting New Highs from New Lows
d) Subtracting New Lows from New Highs
30. If the New High-New Low index declines while the broader market stays flat or rallies:
a) The market may consolidate near-term
b) It is time to take profits on long positions
c) It is time to take profits on short positions
d) The market may still continue to move higher
31. As per the theory of contrarian opinion, a high degree of consensus normally precedes:
a) A consolidation
b) A trend reversal
c) Trend continuation
d) An expansion in Trading Volume
32. The Commitment of Traders report summarizes:
a) The positions of reporting traders on a weekly basis
b) The positions of non-reporting traders on a weekly basis
c) Buying and selling by commercials and large speculators
d) The positions of non-reporting and reporting traders on a weekly basis
33. Which of the following statements accurately describe a support level?
a) Price peaks often define a support point
b) Tests of a support level are normally preceded by a price advance
c) A price level where buying is strong enough to interrupt or reverse a decline
d) A price level where selling is strong enough to interrupt or reverse an advance
34. A bear trap occurs when:
a) Prices recapture a violated support level after sell signals are generated
b) Prices close above a resistance level after sell signals are generated
c) Prices breakout above a clear resistance level and fall back below it
d) Prices fail to surpass a clear resistance level and sell off from it
35. Serial correlation or autocorrelation means
a) That there is persistence in the data.
b) That a false correlation in the data that automatically appears.
c) There is no discernable relationship between the two variables.
d) That the relationship between the two variables is greater than .5.
36. The most important feature of the martingale process that makes it an appropriate model
for EMH is:
a) The absence of future price predictability
b) The absence of price return anomalies that are unexplained
c) The presence of price return anomalies that are unexplained
d) The presence of information that aids in future price predictability
37. Risk aversion refers to the assumption that investors prefer a portfolio with:
a) Stable returns that represent the lowest variance in returns
b) Higher returns but are averse to higher variance in returns
c) Higher returns but are averse to lower variance in returns
d) Lower returns that represent a lower variance in returns
38. Beta measures:
a) The relation between a portfolio’s return and market return
b) The relation between a portfolio’s volatility and market volatility
c) How much an individual stock’s return is related to the market return
d) How much an individual stock’s volatility is related to the market volatility
39. In EMH, technical traders can be thought of as a specific type of noise trader because:
a) Technical traders are rational traders
b) Technical traders are not rational traders
c) A positive feedback loop can lead to pronounced bubbles
d) The cancel-out phenomenon will apply to a large number of trend following strategies
40. When sentiment indicators point to extreme optimism:
a) Liquidity is low
b) Liquidity is high
c) Volatility is extremely high
d) Markets are likely to follow through with more upside
41. From a sentiment perspective:
a) Extreme optimism reflects high cash balances
b) Liquidity and psychology are inversely related
c) Liquidity and psychology are positively correlated
d) Valuation measures short-term extremes in psychology
42. For short-sellers of a security, market risk refers to the possibility of:
a) A drop in value
b) An increase in value
c) An increase in volatility
d) A default by the counterparty
43. Slippage is normally attributed to:
a) Credit risk
b) Market risk
c) Default risk
d) Liquidity risk
44. Political risk refers to:
a) The potential of depreciating currency to negatively impact investments
b) The potential of a credit rating upgrade to positively impact investments
c) The potential of a credit rating downgrade to negatively impact investments
d) The potential of legislative actions to deter companies from reaching their goals
45. Yield refers to the projected annual return on a bond based on its:
a) Current market price
b) Coupon payment
c) Nominal price
d) Face value
46. Treasury Inflation-Protected Securities (TIPS) are bonds whose ___________ is adjusted
based on the level of inflation (change in consumer prices):
a) Principle
b) Coupon rate
c) Market price
d) Maturity value
47. An inverted yield curve has historically pointed toward:
a) Economic expansions
b) Inflationary pressures
c) Deflationary pressures
d) Economic slowdowns and recessions
48. Treasury-bill returns come from:
a) Price changes
b) Interest payments
c) Dividend payments
d) Price changes and interest payments
49. Which of the following bonds exceed rating thresholds set by S&P, Moody’s and Fitch?
a) Junk bonds
b) High-yield bonds
c) Investment-grade bonds
d) Corporate Class A bonds
50. Debentures are a type of:
a) Secured loans
b) Perpetual loans
c) Unsecured loans
d) Zero coupon bonds
51. Companies can borrow for two years by selling:
a) Corporate Bonds
b) Commercial Paper
c) Treasury securities
d) Medium-term notes
52. In spot markets, commodities such as gold are sold for:
a) Future delivery
b) Immediate delivery
c) A discount to future prices
d) A premium to future prices

53. Which of the following commodities also acts as a barometer of an economy’s prospects?
a) Gold
b) Zinc
c) Copper
d) Aluminum
54. The benchmark grade of U.S. oil is commonly called:
a) Brent
b) NFC
c) WTI
d) WCS
55. Which of the following is a trade-weighted geometric index?
a) S&P 500 index
b) U.S. dollar index
c) NYSE Composite index
d) Dow Jones Industrial Average
56. The CBOE Volatility Index (VIX) is a measure of:
a) 30-day implied volatility as priced by the S&P 500 index option market.
b) 30-day historical volatility as priced by the S&P 500 index option market.
c) 30-day implied volatility as priced by the NYSE Composite index option market.
d) 30-day implied volatility as priced by the NASDAQ Composite index option market.
57. Increased buying of options by market participants leads to:
a) A decrease in open interest
b) A decrease in implied volatility
c) An increase in implied volatility
d) Neither an increase nor a decrease in implied volatility
58. A VIX reading of 20 implies market expectations of a ____ move over the next 30 days:
a) 4.77%
b) 5.77%
c) 6.77%
d) 2.77%

59. Charles Dow’s first major contribution to the field of technical analysis is:
a) The Dow Theory
b) Point and Figure charting technique
c) The development and use of indices
d) The concept of relative strength analysis
60. The basic five-wave sequence in the Elliott Wave Theory is termed as:
a) Zigzag
b) Diagonal
c) Motive wave
d) Corrective wave
61. As per the Elliott Wave Theory, in an impulse wave:
a) Wave 4 always overlaps the price territory of wave 1.
b) Wave 2 can sometimes move beyond the start of wave 1.
c) Wave 3 can be the shortest motive subwave if wave 5 experiences extension.
d) Wave 3 can never be the shortest motive subwave, but may not be the longest.
62. Which of the following can be classified as a motive wave when analyzing charts as per
Elliott’s Wave Theory?
a) Diagonal
b) Triangle
c) Zigzag
d) Flat
63. The Elliott Wave pattern highlighted below is a/an:
a) Flat
b) Zigzag
c) Triangle
d) Ending Diagonal

64. Which of the following is an appropriate scale to analyze long-term price movements
with considerable volatility on a price chart?
a) Ratio
b) Geometric
c) Arithmetic
d) Logarithmic
65. Gaps that appear midway in a price trend are:
a) Opening gaps
b) Runaway gaps
c) Exhaustion gaps
d) Continuation gaps
66. Which of the following types of gaps are quickest to close?
a) Area gaps
b) Breakaway gaps
c) Exhaustion gaps
d) Continuation gaps
67. Breakouts from a rectangle pattern occur when:
a) Price fails at either of the bounds of the pattern
b) Price closes outside the boundary of the pattern
c) Price crosses the halfway point of the pattern from above
d) Price crosses the halfway point of the pattern from below

68. Identify the pattern highlighted in the price chart:
a) Flag
b) Ascending triangle
c) Descending triangle
d) Symmetrical triangle
69. A descending triangle has:
a) Sloping support and resistance lines
b) A horizontal resistance line
c) A horizontal support line
d) A sloping support line
70. Symmetrical triangles shorter than three weeks in duration are more likely to be
categorized as:
a) Flags
b) Wedges
c) Pennants
d) Consolidations
71. Flags and pennants always require ______________ leading to them:
a) A breakaway gap
b) A strong advance/decline
c) A major top/bottom formation
d) An Intermediate top/bottom formation
72. In a Head & Shoulders pattern, volume is generally:
a) Consistent throughout the pattern
b) Light as prices approach the peak
c) Highest on a breakout from the neckline
d) Heaviest during the formation of the left shoulder
73. Which of the following would be a valid confirmation of the Head & Shoulders chart
formation?
a) Sell when the head penetrates the neckline
b) Sell when the right shoulder penetrates the neckline
c) Sell when the right shoulder completes a 50% retracement of the ‘head’ formation
d) Sell only if the right shoulder manages a greater than 50% retracement of the ‘head’
formation
74. Which of the following chart types does not show price gaps?
a) Bar
b) Line
c) Candlestick
d) Equivolume
75. The _______ chart includes the same information as that on a candlestick chart:
a) Line
b) OHLC
c) Point and Figure
d) Ichimoku Cloud
76. A candlestick formation highlighted by a horizontal line (identical opening and closing
price) that replaces the real body is referred to as a:
a) Doji
b) Marubozu
c) Outside up
d) Outside down
77. A breadth indicator measures:
a) Cointegration between two issues in a market
b) Participation of issues in a market trend
c) Performance of issues in a market trend
d) Momentum of a market trend
78. Bollinger Bands show variations above and below:
a) An average true range of prices
b) A simple moving average of prices
c) An average true range of oscillator readings
d) A simple moving average of the typical price
79. Which of the following can be categorized as an unbound oscillator?
a) RSI
b) MACD
c) Stochastic
d) Williams %R
80. The signal line in the traditional MACD indicator is:
a) A simple moving average
b) An exponential moving average
c) The difference between 12 and 26-day EMA
d) The difference between 26 and 12-day EMA
81. A combination of rising on-balance volume along with declining price action is
suggestive of:
a) Volatility expansion
b) A bullish divergence
c) Volatility compression
d) A possible distribution period
82. RSI is considered to be more stable than most measures that calculate momentum
because:
a) It is ranged between 0 (zero) and 100
b) It uses all the values of the period in its calculation
c) It uses just the first and last values of the period in its calculation
d) It can effectively denote overbought / oversold levels based on pre-determined thresholds
83. The stochastic indicator measures:
a) The relative strength of the current price movement as it increases from 0 to 100
b) The relative position of the closing price within a past high-low range
c) The distance in % between the first and last values over n-days
d) Where today’s typical price fits into the recent trading range

84. The triangle pattern with the highest throwback rate is a(n)
a) symmetrical triangle
b) broadening formation
c) descending triangle
85. If someone says that Eastern Technical Analysis and Western Technical Analysis
together augment the overall recognition of trends, what are they likely to be explaining?
a) How Shanghai markets affect New York markets and how the reverse is also true.
b) That Candlesticks and Bar charts have the same patterns but with different names.
c) How different cultures work together to better understand market prices.
d) That candlestick charts used with oscillators and other technical studies can be productive.
86. One commonly used type of chart that represents a blend of Eastern and Western
technical analysis tools is:
a) Ichimoku cloud chart
b) Market profile charts
c) Renko charts
d) Blending candles (bull and bear)
87. Japanese Candlestick Charting refers to a gap as a:
a) Line
a) Star
b) Tasuki
c) Window
88. An engulfing pattern is considered to signal a
a) Short-term reversal
b) Long-term reversal
c) Bullish continuation
d) Bearish continuation
89. A gap up followed by a long upper shadow on a candle chart potentially foreshadows
a) A bullish reversal signal
b) A bearish reversal signal
c) Equilibrium
d) A pullback

90. According to, Gail Dudack, a major change of trading structure in recent years requires
technicians to be alert to the fact that
a) Electronic exchanges have created additional competition
b) Dark pool trading must be accounted for
c) High-frequency trading may destroy the reliability of chart patterns
d) Volume can no longer be accurately defined
91. Of the following, which indicator is most likely to be valuable in determining when to
execute a trend-following trading system?
a) Average true range (ATR)
b) Directional Movement Indicator (ADX)
c) Volume weighted average price (VWAP)
d) New Highs, New Lows index (NHNL)
92. Most futures contracts are
a) Completely fungible
b) Unreasonably high-risk instruments
c) Highly illiquid
d) Quoted in pips
93. Which of the following statements is most accurate with respect to a price-weighted
average?
a) The S&P 500 is a price-weighted average
b) Float is taken into account when constructing price-weighted averages
c) Stock splits are ignored when constructing a price-weighted average
d) A high-priced stock has more influence on the average compared to a low-priced stock
94. Which of the following is a market-cap weighted index?
a) S&P 500 index
b) U.S. Dollar index
c) NASDAQ Composite
d) Dow Jones Industrial Average
95. Which of the following is a criticism of noise traders?
a) Noise traders are not skilled, long-term investors.
b) Noise traders lose money.
c) Noise traders are not willing to pay differing prices for fungible assets.
d) Noise traders are not trading on information that is true and relevant for predicting
upcoming earnings of a publically traded company.

96. Which of the following statements is an important assumption of the Efficient Market
Hypothesis?
a) Investors as a group will act rationally
b) Investors as a group will act irrationally
c) Prices typically do not reflect all available information
d) Liquidity constraints may sometimes drive prices away from their intrinsic value
97. Which of the following trends can be classified as the longest based on duration:
a) Secondary trend
b) Primary trend
c) Intermediate trend
d) Minor trend

98. The Elliott Wave Theory subdivides a corrective wave into ________ subwaves:
a) Two
b) Three
c) Four
d) Five
99. “Truncation” is defined as a:
a) Failure of the 3rd
wave to surpass the highs of the 1st wave
b) Failure of the 5th
wave to surpass the highs of the 3rd
wave
c) Phenomena where the 2nd
wave slightly exceeds the lows of the 1st wave
d) Phenomena where the 4th
wave slightly blends into the highs of the 1st wave
100. Which of the following is a commonly used tool by the Federal Reserve to set a target
rate that is aimed at containing inflation and maximize employment?
a) Discount rate
b) Federal Funds rate
c) Open market operations
d) Bank reserve requirements
101. Throwbacks:
a) Occur after a bullish breakout
b) Occur after a bearish breakout
c) Occur only within well-defined price channels
d) Occur only within well-defined consolidation patterns
102. Which of the following would most likely be a continuation pattern?
a) Flag
b) Double bottom
c) Engulfing pattern
d) Head & Shoulders
103. Which of the following oscillators combines price and volume in its calculation?
a) CCI
b) RSI
c) William’s %R
d) Money Flow Index
104. A Narrow-Range day:
a) Is normally preceded by a parabolic price advance
b) Is normally preceded by a strong sell-off
c) Indicates a phase of volatility expansion
d) Indicates a phase of volatility compression
105. As a continuation variation, the rising wedge pattern would appear in:
a) An uptrend
b) A downtrend
c) A consolidation
d) The right shoulder of a Head & Shoulder bottom
106. A __________ gap occurs at a point of clear resistance or support:
a) Area
b) Runaway
c) Breakaway
d) Exhaustion
107. The basic purpose of a channel line is to:
a) Identify a trend reversal
b) Establish basic direction
c) Identify likely reversal points
d) Assess the probable direction of the trend
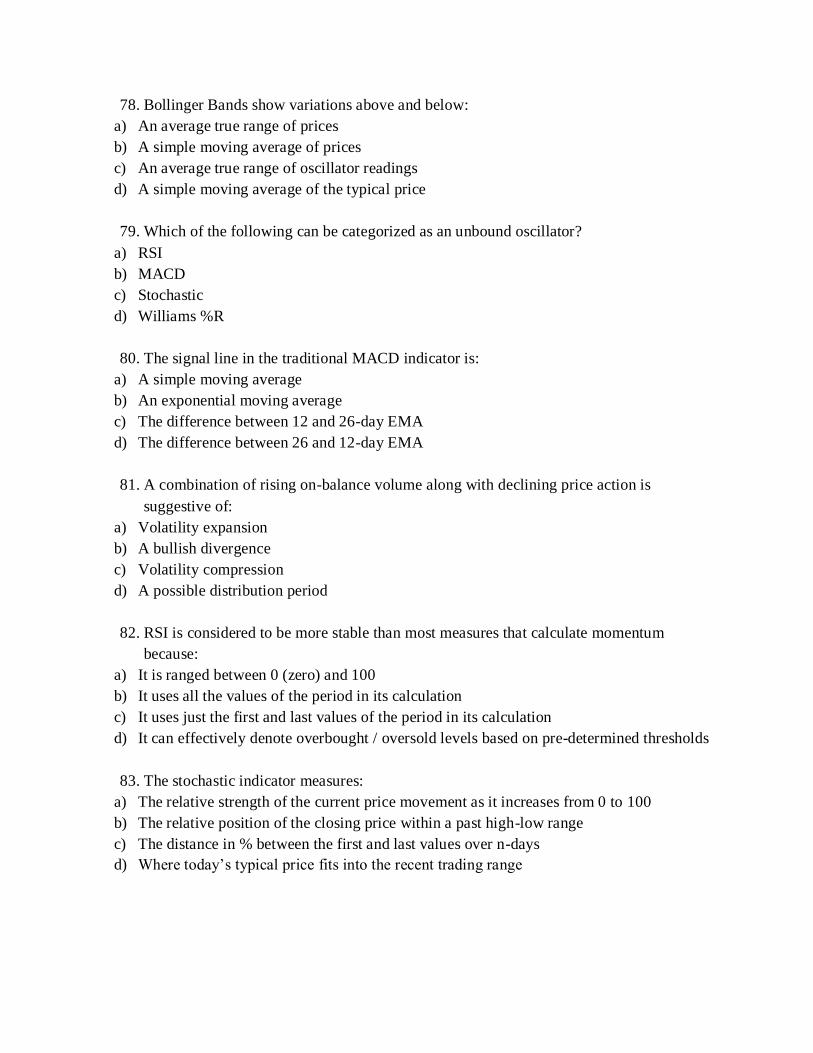
108. The Elliott wave pattern highlighted below is a:
a) Regular flat
b) Running flat
c) Expanded flat
d) Contracted flat
109. A zigzag, as per the Elliott Wave Theory has a _______ combination of subwaves:
a) 3-3-3
b) 3-5-3
c) 5-3-3
d) 5-3-5
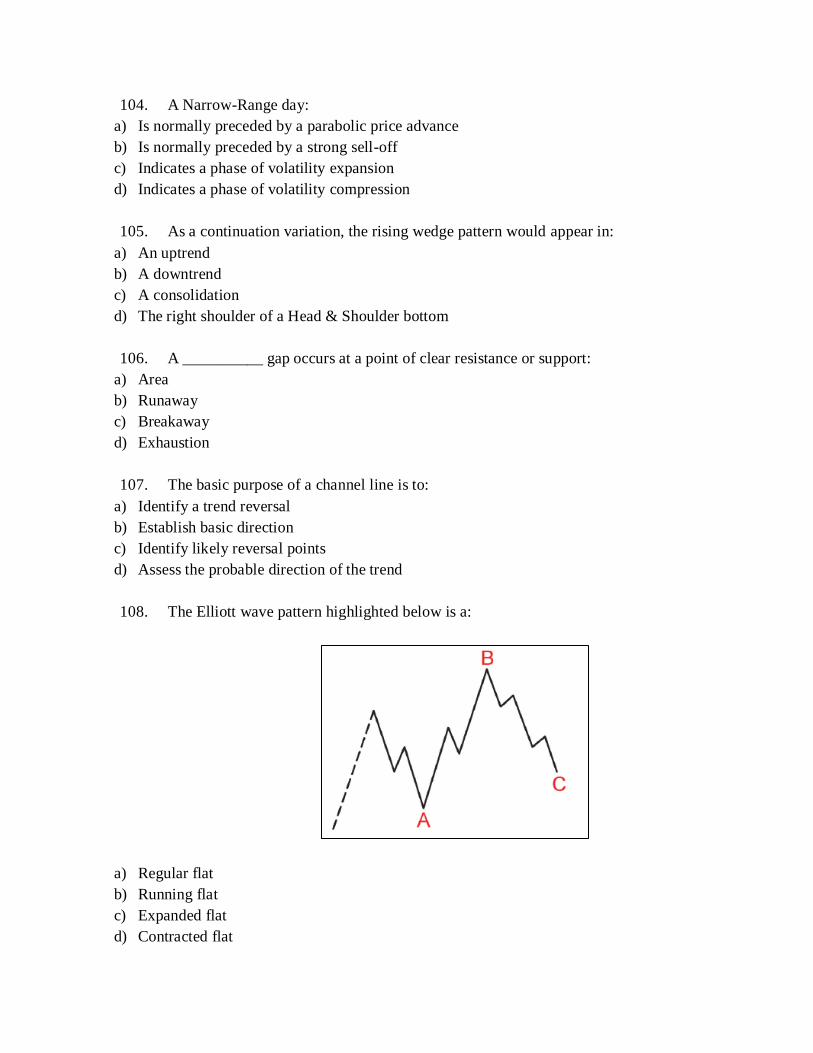
110. The chart pattern highlighted below (inside the circle) is:
a) A descending triangle
b) An ascending triangle
c) A broadening top formation
d) A broadening bottom formation
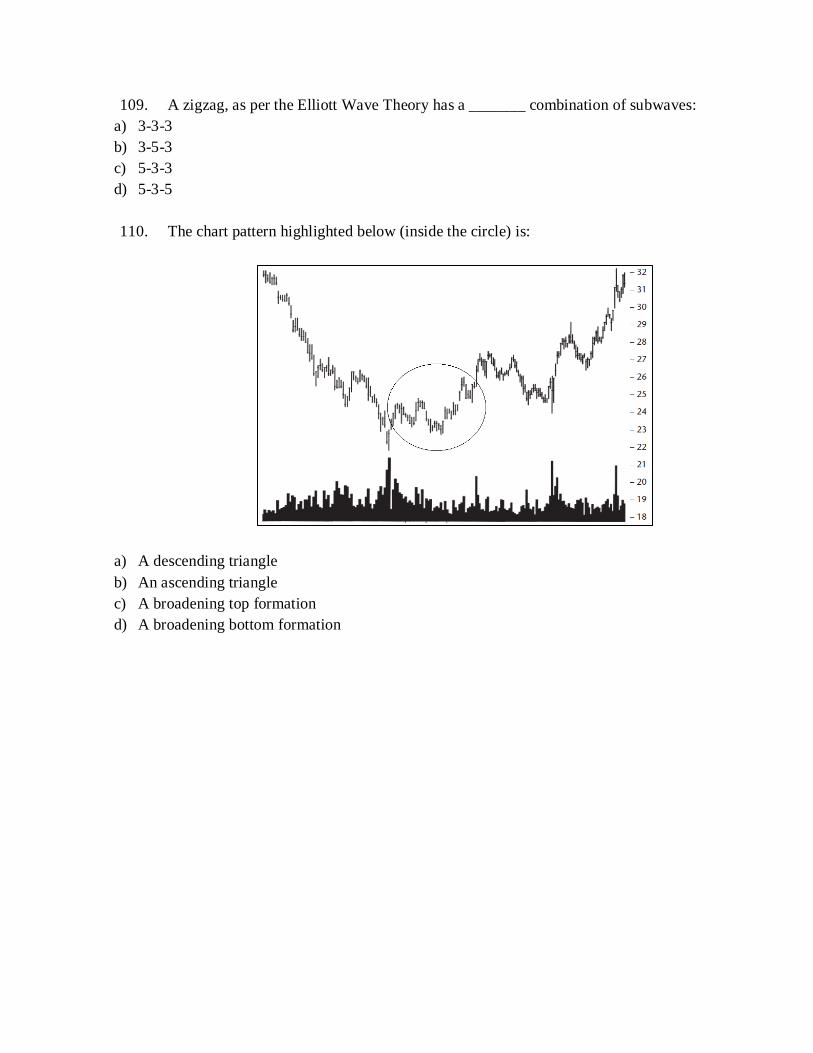
111. The chart pattern highlighted below is:
a) An ascending triangle
b) A Head & Shoulders top
c) A broadening top formation
d) A Head & Shoulders bottom
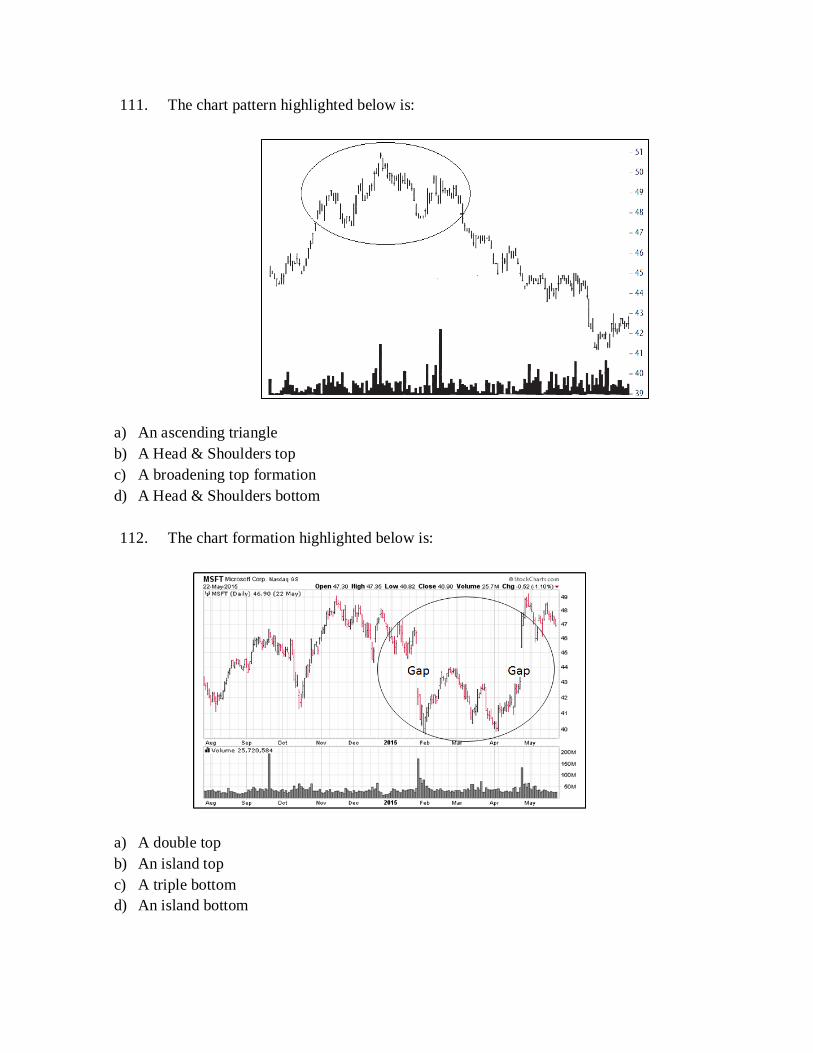
112. The chart formation highlighted below is:
a) A double top
b) An island top
c) A triple bottom
d) An island bottom
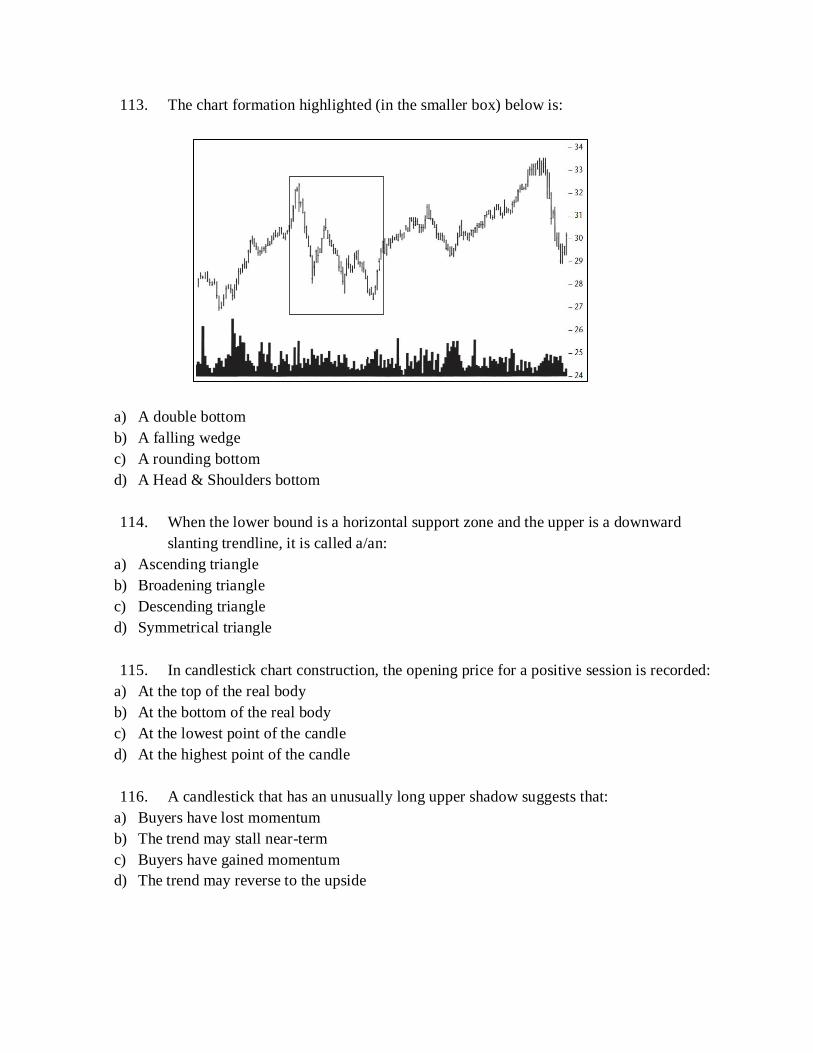
113. The chart formation highlighted (in the smaller box) below is:
a) A double bottom
b) A falling wedge
c) A rounding bottom
d) A Head & Shoulders bottom
114. When the lower bound is a horizontal support zone and the upper is a downward
slanting trendline, it is called a/an:
a) Ascending triangle
b) Broadening triangle
c) Descending triangle
d) Symmetrical triangle
115. In candlestick chart construction, the opening price for a positive session is recorded:
a) At the top of the real body
b) At the bottom of the real body
c) At the lowest point of the candle
d) At the highest point of the candle
116. A candlestick that has an unusually long upper shadow suggests that:
a) Buyers have lost momentum
b) The trend may stall near-term
c) Buyers have gained momentum
d) The trend may reverse to the upside

117. A bullish divergence is the combination of a ______ low in the price at the same time
as a _________ low in an oscillator:
a) Lower, lower
b) Lower, higher
c) Higher, lower
d) Higher, higher
118. Which of the following can be classified as a one-day candlestick pattern?
a) Harami
b) Engulfing
c) Marubozu
d) Belt-hold Line
119. The Dow Theory uses:
a) Low prices
b) High prices
c) Closing prices
d) Typical prices
120. A minor high is a peak separated by ________ days from a higher high:
a) One
b) Two
c) Four
d) Five
=====================================================================

CMT Level I
Sample Exam
Answers
1. David, a senior analyst with a brokerage firm, decides to change his recommendation for the
common stock of Pigeon Industries, Inc. from a “buy” to a “sell”. This change in investment
advice is mailed to all the firm’s clients on Wednesday. Next day, a client calls in with a buy
order for 500 shares of Pigeon Industries, Inc. In this circumstance, Johnson should:
c. Advise the customer of the change in recommendation before accepting the order.
This question involves Standard III (B) – Fair Dealing.
Reference: Code of Ethics and Standards of Professional Conduct
2. The mosaic theory holds that an analyst:
b. Can use material public information and nonmaterial nonpublic information in the analyst’s
analysis.
This question involves Standard II (A) – Material Nonpublic Information.
Reference: Code of Ethics and Standards of Professional Conduct
3. Bell is a portfolio manager. One of his firm’s clients has told Bell that he will compensate him
beyond the compensation provided by his firm on the basis of the capital appreciation of his
portfolio each year. Bell should:
b. Obtain permission from his employer prior to accepting the compensation arrangement.
This question involves Standard IV (B) – Additional Compensation Arrangements.
Reference: Code of Ethics and Standards of Professional Conduct
4. Which of the following is a correct statement of a member’s or candidate’s duty under the Code
and Standards?
a. In the absence of specific applicable law or other regulatory requirements, the Code and
Standards govern the member’s or candidate’s actions.
This question involves Standard I (A) – Material Nonpublic Information.
Reference: Code of Ethics and Standards of Professional Conduct
5. Elizabeth is a financial analyst with XYZ Brokerage Firm. She is preparing a purchase
recommendation on JNI Corporation. Which of the following situations is most likely to represent
a conflict of interest for Neely that would have to be disclosed?
c. XYZ holds for its own account a substantial common stock position in JNI.
This question involves Standard VI (A) – Disclosure of Conflicts.
Reference: Code of Ethics and Standards of Professional Conduct
6. To increase the sensitivity of a 5x3 Point and Figure chart, one would:
b. Decrease the box size
Reference: MTA, CMT Level I: An Introduction to Technical Analysis, Chapter 23
7. A basic Point and Figure buy signal is triggered when:
c. The current column of Xs rises above the previous column of Xs by one box
Reference: MTA, CMT Level I: An Introduction to Technical Analysis, Chapter 23

8. In constructing a point and Figure chart, a new entry is added only when:
d. Price has moved equal to or more than the specified box size
Reference: MTA, CMT Level I: An Introduction to Technical Analysis, Chapter 23
9. Identify the Point and Figure pattern highlighted below:
c. Ascending Triple Top
Reference: MTA, CMT Level I: An Introduction to Technical Analysis, Chapter 23
10. Identify the Point and Figure pattern highlighted below:
c. Spread Triple Top
Reference: MTA, CMT Level I: An Introduction to Technical Analysis, Chapter 23
11. When the Stochastic indicator crosses below 20, it is signaling
d. The price is vulnerable to a reversal, but no action needs to be taken just yet.
Reference: MTA, CMT Level I: An Introduction to Technical Analysis, Chapter 15
12. Which of the following principles describes a characteristic of related cycles
a. harmonics
Reference: MTA, CMT Level I: An Introduction to Technical Analysis, Chapter 23
13. Which of the following formations is often called a coil?
d. Symmetrical Triangle
Reference: MTA, CMT Level I: An Introduction to Technical Analysis, Chapter 3
14. Bullish support lines on a 3-box reversal P & F chart are drawn at a _____ degree angle:
a. 45
Reference: MTA, CMT Level I: An Introduction to Technical Analysis, Chapter 23
15. The stock multiplication factor to adjust for a 30% stock dividend on a Point and Figure chart is:
b. 1.3
Reference: MTA, CMT Level I: An Introduction to Technical Analysis, Chapter 23
16. Which one of the following chart types uses more than one data point to plot a particular time
interval?
c. Candlesticks
Reference: MTA, CMT Level I: An Introduction to Technical Analysis, Chapter 10
17. __________ mean is the best choice when averaging ratios that can be either fractions or
percentages:
b. Geometric
Reference: MTA, CMT Level I: An Introduction to Technical Analysis, Chapter 49
18. Kurtosis refers to the:
d. Peakedness or flatness of a distribution

Reference: MTA, CMT Level I: An Introduction to Technical Analysis, Chapter 49
19. Standard deviation is calculated by taking the square root of:
a. Variance
Reference: MTA, CMT Level I: An Introduction to Technical Analysis, Chapter 49
20. If the daily returns are constant, they can be converted to annualized risk by multiplying the daily
return with the square root of:
c. 252
Reference: MTA, CMT Level I: An Introduction to Technical Analysis, Chapter 49
21. The Sharpe ratio is a measure of:
c. Performance
Reference: MTA, CMT Level I: An Introduction to Technical Analysis, Chapter 49
22. Seasonality is a cycle that occurs:
d. Yearly
Reference: MTA, CMT Level I: An Introduction to Technical Analysis, Chapter 50
23. Fungibility is:
b. Interchangeability of financial assets on identical terms
Reference: MTA, CMT Level I: An Introduction to Technical Analysis, Chapter 50
24. The cycle, along with trend and _____________ comprise the three orderly components of price
movement:
c. Seasonality
Reference: MTA, CMT Level I: An Introduction to Technical Analysis, Chapter 50
25. The global business cycle as identified by the Princeton Economic Institute measures:
c. 8.6 years
Reference: MTA, CMT Level I: An Introduction to Technical Analysis, Chapter 50
26. Which of the following cycles is the longest by duration:
b. Kondratieff Wave
Reference: MTA, CMT Level I: An Introduction to Technical Analysis, Chapter 50
27. Typically, the _________ year of a president’s term posts the strongest returns for the market as
per the Presidential Cycle:
c. Third
Reference: MTA, CMT Level I: An Introduction to Technical Analysis, Chapter 50
28. An effective way of detrending price data to identify cycles is to:
c. Divide the closing prices by a moving average of those prices
Reference: MTA, CMT Level I: An Introduction to Technical Analysis, Chapter 22
29. The New High-New Low index is calculated by:
d. Subtracting New Lows from New Highs
Reference: MTA, CMT Level I: An Introduction to Technical Analysis, Chapter 6
30. If the New High-New Low index declines while the broader market stays flat or rallies:
b. It is time to take profits on long positions
Reference: MTA, CMT Level I: An Introduction to Technical Analysis, Chapter 6
31. As per the theory of contrarian opinion, a high degree of consensus normally precedes:
b. A trend reversal
Reference: MTA, CMT Level I: An Introduction to Technical Analysis, Chapter 9
32. The Commitment of Traders report summarizes:
c. Buying and selling by commercials and large speculators
Reference: MTA, CMT Level I: An Introduction to Technical Analysis, Chapter 9
33. Which of the following statements accurately describe a support level?
c. A price level where buying is strong enough to interrupt or reverse a decline
Reference: MTA, CMT Level I: An Introduction to Technical Analysis, Chapter 31
34. A bear trap occurs when:
a. Prices recapture a violated support level after sell signals are generated
Reference: MTA, CMT Level I: An Introduction to Technical Analysis, Chapter 31
35. Serial correlation or autocorrelation means
a. There is persistence in the data.
Reference: MTA, CMT Level I: An Introduction to Technical Analysis, Chapter 49
36. The most important feature of the martingale process that makes it an appropriate model for EMH
is:
a. The absence of future price predictability
Reference: MTA, CMT Level I: An Introduction to Technical Analysis, Chapter 35
37. Risk aversion refers to the assumption that investors prefer a portfolio with:
b. Higher returns but are averse to higher variance in returns
Reference: MTA, CMT Level I: An Introduction to Technical Analysis, Chapter 36
38. Beta measures:
c. How much an individual stock’s return is related to the market return
Reference: MTA, CMT Level I: An Introduction to Technical Analysis, Chapter 36
39. In EMH, technical traders can be thought of as a specific type of noise trader because:
b. Technical traders are not rational traders
Reference: MTA, CMT Level I: An Introduction to Technical Analysis, Chapter 39

40. When sentiment indicators point to extreme optimism:
a. Liquidity is low
Reference: MTA, CMT Level I: An Introduction to Technical Analysis, Chapter 40
41. From a sentiment perspective:
b. Liquidity and psychology are inversely related
Reference: MTA, CMT Level I: An Introduction to Technical Analysis, Chapter 40
42. For short-sellers of a security, market risk refers to the possibility of:
b. An increase in value
Reference: MTA, CMT Level I: An Introduction to Technical Analysis, Chapter 16
43. Slippage is normally attributed to:
d. Liquidity risk
Reference: MTA, CMT Level I: An Introduction to Technical Analysis, Chapter 16
44. Political risk refers to:
d. The potential for legislative actions to deter companies from reaching their goals
Reference: MTA, CMT Level I: An Introduction to Technical Analysis, Chapter 16
45. Yield refers to the projected annual return on a bond based on its:
a. Current market price
Reference: MTA, CMT Level I: An Introduction to Technical Analysis, Chapter 17
46. Treasury Inflation-Protected Securities (TIPS) are bonds whose _________ is adjusted based on
the level on inflation (change in consumer prices):
a. Principle
Reference: MTA, CMT Level I: An Introduction to Technical Analysis, Chapter 17
47. An inverted yield curve has historically pointed toward:
d. Economic slowdowns and recessions
Reference: MTA, CMT Level I: An Introduction to Technical Analysis, Chapter 17
48. Treasury-bill returns come from:
a. Price changes
Reference: MTA, CMT Level I: An Introduction to Technical Analysis, Chapter 17
49. Which of the following bonds exceed rating thresholds set by S&P, Moody’s and Fitch?
c. Investment-grade bonds
Reference: MTA, CMT Level I: An Introduction to Technical Analysis, Chapter 18
50. Debentures are a type of:
c. Unsecured loans
Reference: MTA, CMT Level I: An Introduction to Technical Analysis, Chapter 18
51. Companies can borrow for two years by selling:
d. Medium-term notes
Reference: MTA, CMT Level I: An Introduction to Technical Analysis, Chapter 18
52. In spot markets, commodities such as gold are sold for:
b. Immediate delivery
Reference: MTA, CMT Level I: An Introduction to Technical Analysis, Chapter 19
53. Which of the following commodities also acts as a barometer of an economy’s prospects?
c. Copper
Reference: MTA, CMT Level I: An Introduction to Technical Analysis, Chapter 19
54. The benchmark grade of U.S. crude oil is commonly called:
c. WTI
Reference: MTA, CMT Level I: An Introduction to Technical Analysis, Chapter 19
55. Which of the following is a trade-weighted geometric index?
b. U.S. dollar index
Reference: MTA, CMT Level I: An Introduction to Technical Analysis, Chapter 19
56. The CBOE Volatility Index (VIX) is a measure of:
a. 30-day implied volatility as priced by the S&P 500 index option market
Reference: MTA, CMT Level I: An Introduction to Technical Analysis, Chapter 48
57. Increased buying of options by market participants leads to:
c. An increase in implied volatility
Reference: MTA, CMT Level I: An Introduction to Technical Analysis, Chapter 47
58. A VIX reading of 20 implies market expectations of a _____ move over the next 30 days:
b. 5.77%
Reference: MTA, CMT Level I: An Introduction to Technical Analysis, Chapter 48
59. Charles Dow’s first major contribution to the field of technical analysis is:
c. The development and use of indices
Reference: MTA, CMT Level I: An Introduction to Technical Analysis, Chapter 2
60. The basic five-wave sequence in the Elliott Wave Theory is termed as:
c. Motive wave
Reference: MTA, CMT Level I: An Introduction to Technical Analysis, Chapter 33
61. As per the Elliott Wave Theory, in an impulse wave:
d. Wave 3 can never be the shortest motive subwave, but may not be the longest.
Reference: MTA, CMT Level I: An Introduction to Technical Analysis, Chapter 33

62. Which of the following can be classified as a motive wave when analyzing charts as per Elliott’s
Wave Theory?
a. Diagonal
Reference: MTA, CMT Level I: An Introduction to Technical Analysis, Chapter 33
63. The Elliott Wave pattern highlighted below is a/an:
d. Ending Diagonal
Reference: MTA, CMT Level I: An Introduction to Technical Analysis, Chapter 34
64. Which of the following is an appropriate scale to analyze long-term price movements with
considerable volatility on a price chart?
d. Logarithmic
Reference: MTA, CMT Level I: An Introduction to Technical Analysis, Chapter 42
65. Gaps that appear midway in a price trend are:
d. Continuation gaps
Reference: MTA, CMT Level I: An Introduction to Technical Analysis, Chapter 43
66. Which of the following types of gaps are quickest to close?
a. Area gaps
Reference: MTA, CMT Level I: An Introduction to Technical Analysis, Chapter 43
67. Breakouts from a rectangle pattern occur when:
b. Price closes outside the boundary of the pattern
Reference: MTA, CMT Level I: An Introduction to Technical Analysis, Chapter 44
68. Identify the pattern highlighted in the price chart:
b. Ascending triangle
Reference: MTA, CMT Level I: An Introduction to Technical Analysis, Chapter 44
69. A descending triangle has:
c. A horizontal support line
Reference: MTA, CMT Level I: An Introduction to Technical Analysis, Chapter 44
70. Symmetrical triangles shorter than three weeks in duration are more likely to be categorized as:
c. Pennants
Reference: MTA, CMT Level I: An Introduction to Technical Analysis, Chapter 44
71. Flags and pennants always require ___________ leading to them:
a. A strong advance/decline
Reference: MTA, CMT Level I: An Introduction to Technical Analysis, Chapter 44

72. In a Head & Shoulders bottom formation, volume is generally:
d. Heaviest during the formation of the left shoulder.
Reference: MTA, CMT Level I: An Introduction to Technical Analysis, Chapter 46
73. Which of the following would be a valid confirmation of the Head & Shoulders chart formation?
b. Sell when the right shoulder penetrates the neckline
Reference: MTA, CMT Level I: An Introduction to Technical Analysis, Chapter 46
74. Which of the following chart types does not show price gaps?
b. Line
Reference: MTA, CMT Level I: An Introduction to Technical Analysis, Chapter 10
75. The _______ chart includes the same information as that on a candlestick chart::
b. OHLC
Reference: MTA, CMT Level I: An Introduction to Technical Analysis, Chapter 10
76. A candlestick formation highlighted by a horizontal line (identical opening and closing price) that
replaces the real body is referred to as a:
a. Doji
Reference: MTA, CMT Level I: An Introduction to Technical Analysis, Chapter 10
77. A breadth indicator measures:
b. Participation of issues in a market trend
Reference: MTA, CMT Level I: An Introduction to Technical Analysis, Chapter 11
78. Bollinger Bands show variations above and below:
b. A simple moving average of prices
Reference: MTA, CMT Level I: An Introduction to Technical Analysis, Chapter 11
79. Which of the following can be categorized as an unbound oscillator?
b. MACD
Reference: MTA, CMT Level I: An Introduction to Technical Analysis, Chapter 13
80. The signal line in the traditional MACD indicator is:
a. A simple moving average
Reference: MTA, CMT Level I: An Introduction to Technical Analysis, Chapter 13
81. A combination of rising on-balance volume along with declining price action is suggestive of:
b. A bullish divergence
Reference: MTA, CMT Level I: An Introduction to Technical Analysis, Chapter 13
82. RSI is considered to be a more stable than most measures that calculate momentum because:
b. It uses all the values of the period in its calculation
Reference: MTA, CMT Level I: An Introduction to Technical Analysis, Chapter 14

83. The stochastic indicator measures:
b. The relative position of the closing price within a past high-low range
Reference: MTA, CMT Level I: An Introduction to Technical Analysis, Chapter 14
84. The triangle pattern with the highest throwback rate is a(n)
c. ascending triangle
Ref: MTA, CMT Level I: An Introduction to Technical Analysis, Chapter 43
85. If someone says that Eastern Technical Analysis and Western Technical Analysis
together augment the overall recognition of trends, what are they likely to be explaining?
d. That candlestick charts used with oscillators and other technical studies can be
productive
Ref: MTA, CMT Level I: An Introduction to Technical Analysis, Chapter 12
86. One commonly used type of chart that represents a blend of Eastern and Western technical
analysis tools is:
a. Ichimoku cloud chart
Ref: MTA, CMT Level I: An Introduction to Technical Analysis, Chapter 13
87. Japanese candlestick charting refers to a gap as a:
d. Window
Ref: MTA, CMT Level I: An Introduction to Technical Analysis, Chapter 43
88. An engulfing pattern is considered to signal a
a. Short-term Reversal
Ref: MTA, CMT Level I: An Introduction to Technical Analysis, Chapter 14
89. A gap up followed by a long upper shadow on a candle chart potentially foreshadows:
b. a bearish reversal signal
Ref: MTA, CMT Level I: An Introduction to Technical Analysis, Chapter 10
90. According to past MTA president, Gail Dudack, a major change of trading structure in recent
years requires technicians to be alert to the fact that
d. Volume can no longer be accurately defined
Ref: MTA, CMT Level I: An Introduction to Technical Analysis, Chapter 3
91. Of the following, which indicator is most likely to be valuable in determining when to execute a
trend-following trading system
b. Directional Movement Indicator (ADX)
Ref: MTA, CMT Level I: An Introduction to Technical Analysis, Chapter 34
92. Most futures contracts are
a. Completely fungible
Ref: MTA, CMT Level I: An Introduction to Technical Analysis, Chapter 38
93. Which of the following statements is most accurate with respect to a price-weighted average?
d. A high-priced stock has more influence on the average compared to a low-priced stock
Reference: MTA, CMT Level I: An Introduction to Technical Analysis, Chapter 20
94. Which of the following is a market-cap weighted index?
c. NASDAQ Composite
Reference: MTA, CMT Level I: An Introduction to Technical Analysis, Chapter 20
95. Which of the following is a common criticism of technical analysis?
d) Noise traders are not trading on information that is true and relevant for predicting
upcoming earnings of a publically traded company.
Ref: MTA, CMT Level I: An Introduction to Technical Analysis, Chapter 34
96. Which of the following statements is an important assumption of the Efficient Market
Hypothesis?
a. Investors as a group will act rationally
Ref: MTA, CMT Level I: An Introduction to Technical Analysis, Chapter 34
97. Which of the following trends can be classified as the longest based on duration?
a. Primary trend
Ref: MTA, CMT Level I: An Introduction to Technical Analysis, Chapter 44
98. The Elliott Wave Theory subdivides a corrective wave into ________ subwaves:
b. Three
Reference: MTA, CMT Level I: An Introduction to Technical Analysis, Chapter 33
99. “Truncation” is defined as a:
b. Failure of the 5th wave to surpass the highs of the 3rd wave
Reference: MTA, CMT Level I: An Introduction to Technical Analysis, Chapter 33
100. Which of the following is a commonly used tool by the Federal Reserve to set a target
rate that is aimed at containing inflation and maximize employment?
c. Open market operations
Reference: MTA, CMT Level I: An Introduction to Technical Analysis, Chapter 18
101. Throwbacks:

a. Occur after a bullish breakout
Reference: MTA, CMT Level I: An Introduction to Technical Analysis, Chapter 43
102. Which of the following would most likely be a continuation pattern?
a. Flag
Reference: MTA, CMT Level I: An Introduction to Technical Analysis, Chapter 44
103. Which of the following oscillators combines price and volume in its calculation?
d. Money Flow Index
Reference: MTA, CMT Level I: An Introduction to Technical Analysis, Chapter 13
104. A Narrow-Range day:
d. Indicates a phase of volatility compression
Reference: MTA, CMT Level I: An Introduction to Technical Analysis, Chapter 13
105. As a continuation variation, the rising wedge pattern would appear in:
b. A downtrend
Reference: MTA, CMT Level I: An Introduction to Technical Analysis, Chapter 14
106. A _______ gap occurs at a point of clear resistance or support:
c. Breakaway
Reference: MTA, CMT Level I: An Introduction to Technical Analysis, Chapter 11
107. The basic purpose of a channel line is to:
c. Identify likely reversal points
Reference: MTA, CMT Level I: An Introduction to Technical Analysis, Chapter 11
108. The Elliott wave pattern highlighted below is a:
b. Running flat
Reference: MTA, CMT Level I: An Introduction to Technical Analysis, Chapter 33
109. A zigzag, as per the Elliott Wave Theory has a _________ combination of subwaves.
d. 5-3-5
Reference: MTA, CMT Level I: An Introduction to Technical Analysis, Chapter 33
110. The chart pattern highlighted below (inside the circle) is:
d. A broadening bottom formation
Reference: MTA, CMT Level I: An Introduction to Technical Analysis, Chapter 42
111. The chart pattern highlighted below (inside the circle) is:
b. A Head & Shoulders top
Reference: MTA, CMT Level I: An Introduction to Technical Analysis, Chapter 12
112. The chart pattern highlighted below is:
d. An island bottom
Reference: (Implied in) MTA, CMT Level I: An Introduction to Technical Analysis, Chapter 39
113. The chart pattern highlighted (in the smaller box) below is:
b. A falling wedge
Reference: MTA, CMT Level I: An Introduction to Technical Analysis, Chapter 12
114. When the lower bound is a horizontal support zone and the upper is a downward slanting
trendline, it is called a/an:
c. Descending triangle

Reference: MTA, CMT Level I: An Introduction to Technical Analysis, Chapter 44
115. In candlestick chart construction, the opening price for a positive session is recorded:
b. At the bottom of the real body
Reference: MTA, CMT Level I: An Introduction to Technical Analysis, Chapter 10
116. A candlestick that has an unusually long upper shadow suggests that:
a. Buyers have lost momentum
Reference: MTA, CMT Level I: An Introduction to Technical Analysis, Chapter 10
117. A bullish divergence is the combination of a ______ low in the price at the same time as
a _________ low in an oscillator:
b. Lower, higher
Reference: MTA, CMT Level I: An Introduction to Technical Analysis, Chapter 14
118. Which of the following can be classified as a one-day candlestick pattern?
c. Marubozu
Reference: MTA, CMT Level I: An Introduction to Technical Analysis, Chapter 10
119. The Dow Theory uses:
c. Closing prices
Reference: MTA, CMT Level I: An Introduction to Technical Analysis, Chapter 2
120. A minor high is a peak separated by ________ days from a higher high:
d. Five
Reference: MTA, CMT Level I: An Introduction to Technical Analysis, Chapter 42