cnb community bancorp, inc. - county national bank€¦ · · 2013-06-18cnb community bancorp,...
TRANSCRIPT
2012 Annual Report
CNB Community Bancorp, Inc.
Banking that Starts in Your Communityand Stays in Your Community

Front (L to R)
Stephen J. Maddalena, General Manager, Kentwood Office Furniture Judy R. Gabriele, Director of Development, Hillsdale Community Health Center Craig S. Connor, President & Chief Executive Officer, County National Bank John E. Barrett, President, Eagle Funeral Homes, Inc.
Back (L to R)
David W. Pope, Chairman, Powers Clothing, Inc.
John P. Lovinger, Attorney, Parker, Hayes & Lovinger, P.C.
Claude J. Rowley, President, Rowley, Inc.
Steven A. Wells, President, Wells Equipment Sales, Inc.
County National Bank | 2012 Board of Directors
Banking that Starts in Your Communityand Stays in Your Community

[ 2 ]
County National Bank | Banking that Starts in Your Community and Stays in Your Community
CountyNationalBank.com
TABLE OF CONTENTS
Board of Directors . . . . . . . . . . . . . . . . . . . . . . . . . . . . . . . . . Inside Cover
Company Profile . . . . . . . . . . . . . . . . . . . . . . . . . . . . . . . . . . . . . . Page 1
Financial Highlights . . . . . . . . . . . . . . . . . . . . . . . . . . . . . . . . . . . Page 2
Executive Letter . . . . . . . . . . . . . . . . . . . . . . . . . . . . . . . . . . Page 3 - 11
Officer Photos . . . . . . . . . . . . . . . . . . . . . . . . . . . . . . . . . . . . Back Cover
CountyNationalBank .com
[ 1 ]
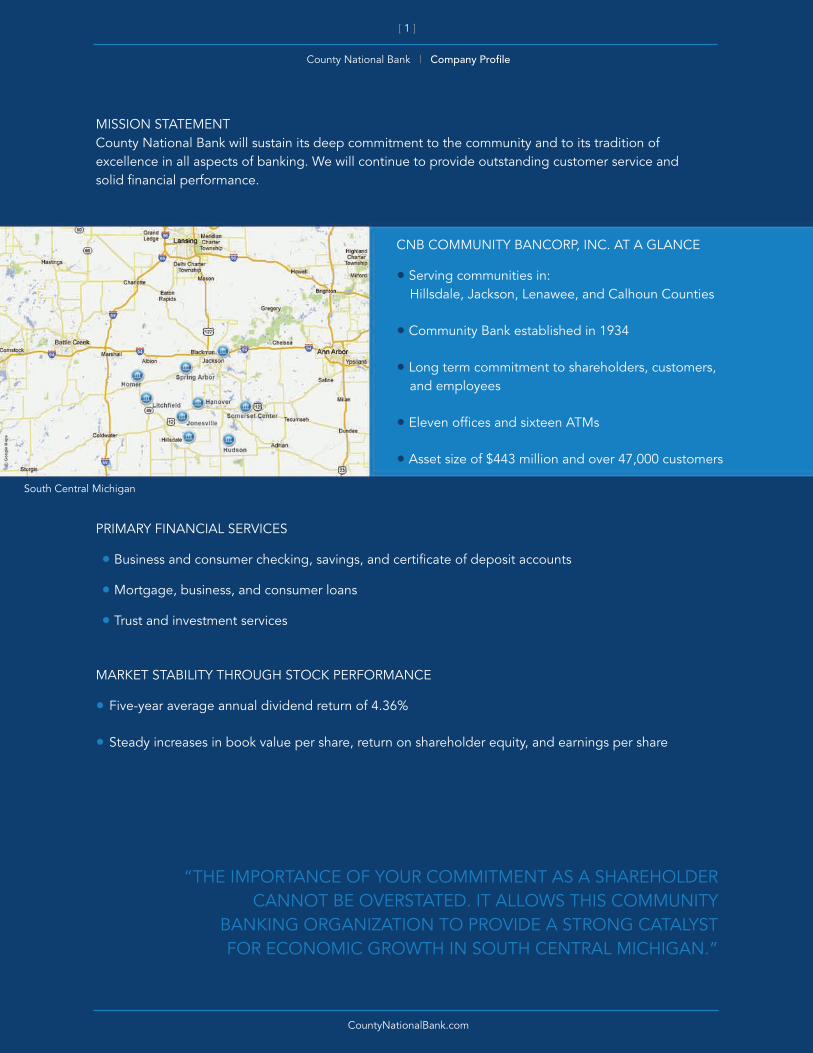
County National Bank | Company Profile
CNB COMMUNITY BANCORP, INC . AT A GLANCE
• Serving communities in: Hillsdale, Jackson, Lenawee, and Calhoun Counties
• Community Bank established in 1934
• Long term commitment to shareholders, customers, and employees
• Eleven offices and sixteen ATMs
• Asset size of $443 million and over 47,000 customers
PRIMARY FINANCIAL SERVICES
• Business and consumer checking, savings, and certificate of deposit accounts
• Mortgage, business, and consumer loans
• Trust and investment services
MARKET STABILITY THROUGH STOCK PERFORMANCE
• Five-year average annual dividend return of 4 .36%
• Steady increases in book value per share, return on shareholder equity, and earnings per share
MISSION STATEMENT County National Bank will sustain its deep commitment to the community and to its tradition of excellence in all aspects of banking . We will continue to provide outstanding customer service and solid financial performance .
South Central Michigan
“THE IMPORTANCE OF YOUR COMMITMENT AS A SHAREHOLDER CANNOT BE OVERSTATED . IT ALLOWS THIS COMMUNITY
BANKING ORGANIZATION TO PROVIDE A STRONG CATALYST FOR ECONOMIC GROWTH IN SOUTH CENTRAL MICHIGAN .”

CountyNationalBank.com
[ 2 ]
County National Bank | Financial Highlights
2012 COMPARISON HIGHLIGHTSFOR THE YEAR: 2012 2011 Income before federal income taxes $ 5,220,688 $ 4,958,271 Net income 3,711,938 3,434,678 Basic and diluted earnings per share 1 .84 1 .71 Cash dividends declared 1,733,438 1,682,106 Per share 0 .86 0 .84
AT YEAR END: Investment securities $ 25,917,557 $ 18,845,340 Loans held for sale 1,445,018 1,519,328 Net portfolio loans 316,578,540 307,912,951 Total assets 443,213,566 382,271,281 Deposits 391,246,000 324,600,177 Shareholders’ equity 34,953,806 32,771,743 Book value per share 17 .31 16 .35 Number of shares outstanding 2,018,703 2,004,003 Number of shareholders 360 368
2012 FIVE YEAR COMPARATIVE FINANCIAL SUMMARY In thousands, except per share data
2012 2011 2010 2009 2008ASSETS Cash and due from banks $ 70,298 $ 33,446 $ 21,270 $ 31,103 $ 17,308 Federal funds sold 440 263 470 322 879 Certificates of deposit 9,515 487 1,718 1,707 - U .S . Treasury and agency securities 3,909 6,462 3,966 8,076 8,394** State, municipal and other securities 22,009 12,383 18,194 15,760 10,354** Loans held for sale 1,445 1,519 1,316 194 553 Net loans 316,579 307,913 285,602 258,464 252,967 Other assets 19,019 19,798 14,411 14,730 12,685 TOTAL $ 443,214 $ 382,271 $ 346,947 $ 330,356 $ 303,140
LIABILITIES AND SHAREHOLDERS’ EQUITY Noninterest-bearing demand $ 72,323 $ 60,037 $ 49,199 $ 46,814 $ 36,904 Interest-bearing 318,923 264,563 253,878 237,852 219,351 Total deposits 391,246 324,600 303,077 284,666 256,255 FHLB advances and line of credit 15,495 22,531 10,328 13,490 16,050 Line of credit note payable 650 750 836 961 961 Other liabilities 869 1,618 1,764 1,639 997 Total shareholders’ equity 34,954 32,772 30,942 29,600 28,877 TOTAL $ 443,214 $ 382,271 $ 346,947 $ 330,356 $ 303,140
Book value per share $ 17 .31 $ 16 .35 $ 15 .50 $ 14 .88 $ 14 .55
Total interest and dividend income $ 17,953 $ 17,904 $ 17,057 $ 16,513 $17,225 Total interest expense 1,607 1,974 2,480 3,600 4,867 Net interest income 16,346 15,930 14,577 12,913 12,358 Provision for loan losses 1,245 1,915 1,945 1,579 661 Net interest income after provision for loan losses 15,101 14,015 12,632 11,334 11,697 Noninterest income 5,242 4,345 4,257 5,077 3,826 Noninterest expenses 15,122 13,402 12,775 12,770 13,038 Income before federal income taxes 5,221 4,958 4,114 3,641 2,485 Federal income taxes 1,509 1,523 1,184 1,252 954 Net income $ 3,712 $ 3,435 $ 2,930 $ 2,389 $ 1,531
Basic and diluted earnings per share $ 1 .84 $ 1 .71 $ 1 .47 $ 1 .20 $ 0 .77 Return on shareholders’ equity * 11 .3% 11 .1% 9 .9% 8 .1% 5 .1% Cash dividends per share $ 0 .86 $ 0 .84 $ 0 .82 $ 1 .00 $ 0 .91
* Based on shareholders’ equity at beginning of year . ** There was a reclassification in 2008 to conform to the 2009 presentation .
CASH DIVIDENDS PER SHARE BOOK VALUE PER SHARE

CountyNationalBank .com
[ 3 ]
County National Bank | Executive Letter
2012 WAS A VERY GOOD YEAR FOR CNB Community Bancorp, Inc . Our financial perfor-mance, shareholder return, growth in deposits and loans, and our commitment to providing financial services to the communities in which we do business all represent characteristics of a high performing community bank . I think as you look over the pages that follow you will be pleased with the results of our Bank’s efforts and your return on investment .
The importance of your commitment as a share-holder cannot be overstated . It allows this community banking organization to provide a strong catalyst for economic growth in south central Michigan and in turn, helps to elevate the quality of life for people in our market . Our Board, employees and customers thank you deeply for the financial investment you have made as a shareholder . Our Board and employ-ees pledge to use prudent and profitable management of our Bank’s capital resources so you will be rewarded for that investment .
Our efforts during 2012 produced the best earnings year in the Bank’s 78-year history . Earning $3,712,000 after tax was an outstanding accomplishment . The main drivers of improved net income were: increased mortgage loan activity made possible by the record low mortgage loan rates, a reduction in provision for loan loss expense, and continued good management of the spread between interest income and interest expense .
2012 net profit represents per share earnings of $1 .84, an 8% increase from 2011 . Return on average equity was 11 .3%, up from 11 .1% for 2011 . Book value per share increased 96¢ to $17 .31, and the real dollar amount of capital growth after dividends was $2,182,000 . Our dividend payout was 86¢ per share or 47% of earnings . Our provision for loan loss account now stands at $5,503,000 or 1 .70% of loans outstanding . Net charge-offs for the year were $1,355,000, or .43% of average loans outstand-ing . The retention of earnings is very important as it helps build capital, which is needed to support the growth in our balance sheet .
“OUR EFFORTS DURING 2012
PRODUCED THE BEST EARNINGS YEAR
IN THE BANK’S 78-YEAR HISTORY .”
DIVIDEND YIELD:Based on Annual Cash Dividend DeclaredYield based on four quarter weighted average trading price at the end of each year
EARNINGS PER SHARE
11.1%
RETURN ON EQUITY Based on shareholders’ equity at beginning of year
11.1%

CountyNationalBank.com
[ 4 ]
County National Bank | Executive Letter
Organizational growth was outstanding during 2012 . Total assets under management grew to $829,376,000 from $745,752,000, up 11 .2% . Bank assets grew 16% to $443,214,000 . Loans serviced were $270,964,000, up $19,262,000 for the year . Trust assets ended the year at $107,261,000 with several million dollars in new trust accounts opened . Other assets being managed through sweep accounts and CDARS were $7,937,000 at year end .
LOAN PORTFOLIO Our loan portfolio is performing well . The increase of $8,723,000 in loan balances for 2012 helped to produce interest income of $17,246,000 . Increased competitive forces required us to lower interest rates charged to our borrowers in order to remain competitive . With this prolonged low rate environ-ment, we faced another year of decreasing yields on our loan and investment portfolio; however, our growth in loans allowed us to hold interest income to about where it was for 2011 .
Many of our customers were able to refinance their mortgages with us lowering our interest income . We compensated for this loss in revenue by grow-ing commercial real estate loans by $28,558,000 . Many banks in Michigan are seeing weak loan demand, as was the case last year, so they are actively seeking to purchase loan participations . We now have over $14,000,000 in commercial loans sold to other community banks, and this helps us to meet the needs of more commercial customers while utilizing less bank capital and deposits .
MORTGAGE LENDINGThe mortgage department had an outstand-ing year of mortgage production and growth . The residential mortgage serviced portfolio, those loans we have sold to Freddie Mac and to Federal Home Loan Bank of Indianapolis, grew to 2,581 mortgages totaling $256,313,000; this is a 5% increase over year end 2011 consist-ing of 2,486 mortgages totaling $244,314,000 .Our mortgage loan originations increased from 523 mortgages totaling $65,829,000 in 2011, to 773 mortgages totaling $102,065,000 in 2012; this is a 55% increase in originations from 2011 .Total income related to mortgage origination was $2,733,000, a record year for the mortgage area .
Jackson Advisory BoardExecutive Committee
Front Row, L to R: Sharon L. Burns, 2nd Vice President – C.F.O., Dorene M. Shaw, Vice President – Chief Auditor,
Lois E. Howard, Vice President – Commercial Loans, Mary P. Marshall, Vice President – Senior Trust OfficerBack Row, L to R:
Scott E. Evans, Vice President – Senior Mortgage Officer, Cindy Dwyer, Vice President – Technology, John R. Waldron, Senior Vice President – Senior Loan Officer, Diane K. Clow, Vice President – Director of Human Resources,
Spencer D. Swank, Executive Vice President & C.F.O., Craig S. Connor, President & C.E.O., Not pictured: Kelly D. Jensen, 2nd Vice President – Branch Administrator
Front Row, L to R: Donald J. Calbert, Richard M. CraftBack Row, L to R: Kurt J. Parker, Robert L. Simmons, Stephen J. Maddalena

CountyNationalBank .com
[ 5 ]
County National Bank | Executive Letter
LOSS MITIGATION As of year end 2012, we had seven properties in Other Real Estate Owned (OREO) with a balance of $779,000 . During the year, we sold eleven acquired properties with three pending sales in 2013 . Through this latest economic downturn, our staff has done a very good job keeping our OREO numbers very manageable .
Our loss mitigation department currently has processed 39 HAMPs (Home Affordable Modi-fication Program) . This is a federally sponsored program to help homeowners avoid foreclosure and stay in their homes by providing payment relief through lower interest rates and extended terms . In addition, the borrower can earn certain principal reductions by honoring the modification terms . In 2012, we completed 47 modifications that have kept families in their homes . Of these modifications, 76% of them are current or less than 30 days past due .
To benefit the Bank and our borrowers, the loss mitigation department has utilized the Michigan’s “Hardest Hit” program, Step Forward Michigan . These are federal dollars administered by the State of Michigan designed to help people avoid foreclosure because of delinquency . The borrower must apply and qualify for this program and our role has been one of a consultant, ushering the borrower through the process . Once qualified, these funds are paid on the loans and do not have to be repaid to the State of Michigan . The program assisted our distressed borrowers in receiving an aggregate of $71,000 in relief funds, which were used to bring their delinquent loans current .
“THE SMARTEST MOVE I MADE .” — JOHN HOOVER, CNB CUSTOMER
(L to R) John Hoover and Pistol – Owner, Wolverine Steel & WeldingBerry Malek, CRC, CTFA – Assistant Vice President – Trust Officer – CNB
CountyNationalBank.com
[ 6 ]
County National Bank | Executive Letter
CONSUMER LENDING In 2012, we originated 599 new loans totaling $14,000,000, down from the prior year . An extremely competitive rate environment in 2012 presented the challenge of balancing the Bank’s desire to offer competitive rates while maintaining our net interest margin .
We are excited to report that in 2013 the consumer lending department will begin to utilize a more dynamic loan software program to keep up with the ever-changing compliance and technology demands in today’s lending environment .
TRUST AND INVESTMENTS Our trust and investment group led by Mary Marshall saw good growth in both new accounts and assets under management . During the year, 64 new accounts were opened and the assets under management grew from $98,788,000 to $107,261,000 .
We continue to promote the benefits of doing business with a trust department of a local community bank . We have expertise in invest-ment management and this makes us a popular choice with those customers needing help with investing IRA, pension or 401(k) rollover dollars . Additionally, we are trying to bring awareness to the many benefits of fee for investment manage-ment services that we offer, compared to commission based investment management services many of our competitors offer .
We continue outreach to local Attorneys and CPAs in both Jackson and Hillsdale markets with special seminars, lunch and learn events, and telephone briefings . Our trust officers are regular guests on the bank-sponsored radio programs, and Tim Sullivan, AVP and trust officer, hosts a weekly radio show on WCSR Hillsdale .
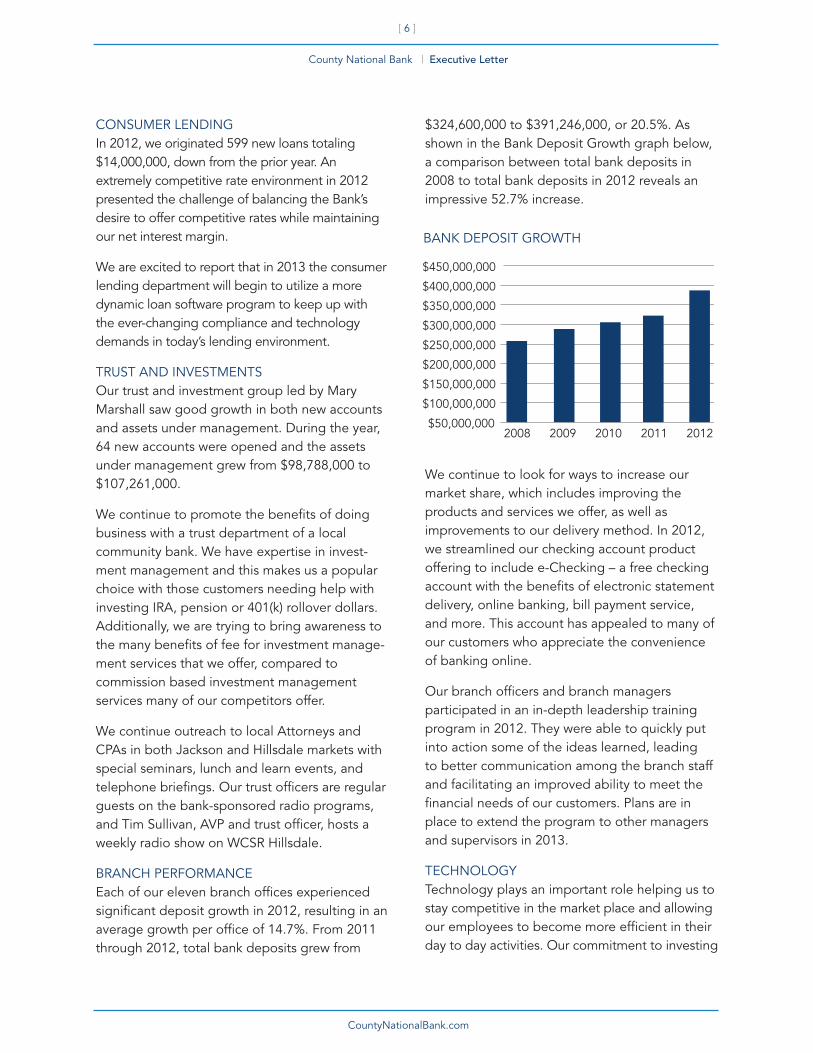
BRANCH PERFORMANCE Each of our eleven branch offices experienced significant deposit growth in 2012, resulting in an average growth per office of 14 .7% . From 2011 through 2012, total bank deposits grew from
$324,600,000 to $391,246,000, or 20 .5% . As shown in the Bank Deposit Growth graph below, a comparison between total bank deposits in 2008 to total bank deposits in 2012 reveals an impressive 52 .7% increase .
We continue to look for ways to increase our market share, which includes improving the products and services we offer, as well as improvements to our delivery method . In 2012, we streamlined our checking account product offering to include e-Checking – a free checking account with the benefits of electronic statement delivery, online banking, bill payment service, and more . This account has appealed to many of our customers who appreciate the convenience of banking online .
Our branch officers and branch managers participated in an in-depth leadership training program in 2012 . They were able to quickly put into action some of the ideas learned, leading to better communication among the branch staff and facilitating an improved ability to meet the financial needs of our customers . Plans are in place to extend the program to other managers and supervisors in 2013 .
TECHNOLOGY Technology plays an important role helping us to stay competitive in the market place and allowing our employees to become more efficient in their day to day activities . Our commitment to investing
BANK DEPOSIT GROWTH

CountyNationalBank .com
[ 7 ]
County National Bank | Executive Letter
in technology continued during 2012 with several projects completed .
Throughout the year, we purchased and installed 16 ATMs and cash machines that included more user-friendly features, including the American Disability Act features . The cost of this invest-ment in technology was $436,000 with the expense spread out over three to five years . In addition, all of our ATMs are now online, which allows for account information to be updated in real time, whereby withdrawals and deposits show immediately . This gives our customers better information and also helps to better control and prevent fraud .
Over the course of two years, we completed the replacement of 162 personal computers with a
comprehensive virtual desktop system, using technology that improves portability, manage-ability, and compatibility allowing us to become more efficient .
MARKETING Our community banking message of reinvesting in our markets is core to our culture, so we continued with the marketing focus of recycling deposits into loans to businesses and individuals . We expanded on that message through advertis-ing by talking about recycling some of our earnings into donations and contributions to a great many non-profit organizations, schools, events, and projects . All of which helps to make our communities better places in which to live .
“IT’S BANKING THAT STARTS IN YOUR COMMUNITY AND STAYS IN YOUR COMMUNITY”
Vermeulen’s Furniture:(L to R) Nate Vermeulen – Vice President, Bill Jors – 2nd VP Commercial Loan Officer, CNB, Lynn Vermeulen – President

CountyNationalBank.com
[ 8 ]
County National Bank | Executive Letter
“WE HAVE WORKED HARD OVER MANY YEARS TO DEVELOP A POSITIVE REPUTATION AND IMAGE…”
Our message was also supported by some of our great customers through testimonial ads, some of which are featured in this report . We hosted several luncheons for realtors, accountants, and attorneys to provide product and service information we thought would be of benefit to those groups . Additionally, we participated in many school and community events, promoting and supporting their efforts and taking advan-tage of the opportunity to meet with many community members .
We partnered with a number of area schools to present information to students about the American Bankers Association programs called “Get Smart about Credit” and “Teach Children to Save” . We also participated in the “Lights, Camera, Save!” program and worked with one area school that entered several videos in this contest . As part of our participation in the “Payback for Education” event, we hosted several Hillsdale County students at the bank and exposed them to various banking careers, in a hands-on setting .
For our efforts in the area of financial literacy, we were asked by the Michigan Bankers Association to make a presentation to the House Banking Committee in Lansing . We are proud of our efforts and equally proud to have been given the opportunity to report to this group .
We introduced a new product called Insured Cash Sweep (ICS), which allows for large deposits to be eligible for multi-million-dollar FDIC insurance . We have had success with introducing this product to businesses, municipalities, and school districts . We continue to promote our products and services, events, and financial information through our website, electronic newsletter, radio programs, and newspaper columns . As a community bank, we believe it is vitally important to truly be a part of our community – our staff members continue to serve through memberships on school boards and committees, service organizations, retail and economic development groups, churches, and non-profits .
CNB staff members participate in the Hillsdale County Fair Parade.
Craig Connor, CNB President & C.E.O, with Eric Macy & Richard Moore from the Hillsdale Rotary Club, and Sharon Bisher, Executive Director of the Hillsdale County Community Foundation, at Baw Beese Lake’s Sandy Beach. CNB is one of the donors of the Sandy Beach Renovation Project.

CountyNationalBank .com
[ 9 ]
County National Bank | Executive Letter
EMPLOYEE DEVELOPMENT AND RECRUITMENT Following our introduction in 2011 of providing training in “Service Excellence”, in 2012 we contin-ued this training to our branch officers and manag-ers focusing on “Leadership Training” . Plans are in place to extend this training to our lenders in 2013 .
On Veterans Day, arrangements were made to close the offices for this traditional banking holi-day in order to provide the Bank’s first ever staff-wide Training Day . Training took place at the local Michindoh Conference Center where employees received the required annual regulatory training, were updated on the Bank’s 2013 Marketing Plan, and reviewed the upcoming year’s employee benefit plans . While all training was an important part of this day, providing the staff with a day to reacquaint, reunite and refresh was an equally important benefit .
We are pleased to report the addition of two new officers to the Bank:
Stacey L . Clemens joined the Bank on January 9th as the Bank’s assistant vice president – compliance officer . Stacey brought over eight years of profes-sional experience, working in all areas of regulatory compliance and risk management . Stacey has an associate degree from Northwest State Community College and attended Defiance College . She is a Certified Regulatory Compliance Manager (CRCM), which she received from the Institute of Certified Bankers .
Chad E . Rumsey joined the Bank on January 9th as a commercial loan officer for the Jackson market area . Chad brings over 13 years of banking experience, including branch manager, treasury management and commercial lending . Chad has a B .A . in business administration from Grand Valley
Legacy Assisted Living Center:(L to R) Chad Rumsey – Commercial Loan Officer, CNB, Lloyd Ganton – C.E.O, Ganton Retirement Centers, Paul Buchholz – President & CFO, Ganton Retirement Centers

CountyNationalBank.com
[ 10 ]
County National Bank | Executive Letter
State University . Chad is a native of the Jackson area, and his knowledge of this market and the market’s commercial customers has been very productive for the Bank .
We also had several internal promotions within the officer group in 2012:
John R . Waldron was promoted from vice president – senior loan officer to senior vice president – senior loan officer on October 10th . John has been with the Bank since 2002, bringing previous commercial loan experience . He also worked with the U .S . Department of Treasury as a national bank examiner . John has a BBA in finance and a minor in accounting from Western Michigan University . John’s leadership and knowledge are instrumental to the success of our Bank . Considering the many regulatory challenges and high level of production and growth of the Bank’s loan areas, his contributions have been vitally important to our accomplishments .
Sharon L . Burns was promoted from second vice president – controller to second vice president and CFO on December 3rd . Sharon has been with the Bank since 2010, as well as having previously worked with a well-known area CPA firm . Sharon will have the overall responsibility for the financial accounting for the Bank . Sharon has a bachelor’s degree in accounting and a master’s degree in organizational management from Spring Arbor University . Sharon’s guidance to the Bank as CFO will be critical to the continued solid reputation of the Bank .
Kelly D . Jensen was promoted from assistant vice president – branch officer to second vice president – branch administrator on December 3rd . Kelly has over 35 years of banking experience in branch management as well as lending . Kelly will have responsibility of branch operations, with all branch managers and officers reporting directly to him . Kelly attended JCC focusing on business and also attended the American Institute of Banking . He has completed the Michigan Banker’s Association
Commercial Lending School and various other courses through the MBA . Kelly’s new leadership role for the branch offices will provide focused direction for the growth and development of the branch market .
Kelly L . Lantis was promoted to commercial credit officer on September 3rd . Kelly has over 24 years of service with County National Bank in the credit department and as a consumer loan officer . In 1993, Kelly made the decision to continue her service with the Bank in a part-time capacity while raising her family . She has returned as a full-time commercial credit officer . Kelly has a B .A . in finance from Hillsdale College, and has continued her education attending various work-related courses and seminars . Kelly’s knowledge has been key to the increased demands of credit administration .
Becky J . Wiley was promoted from human resource specialist and staff development to human resource specialist and staff development officer on October 10th . Becky joined the Bank in 2011 . Her background and 22 years of experience in the H .R . arena in a manufacturing setting has transitioned smoothly to the Bank . Becky has an associate degree from Northwest State Community College . She is a certified Professional in Human Resources (PHR) .
Branch Officer Linda Cavasin making a Teach Children to Save presentation.

CountyNationalBank .com
[ 11 ]
County National Bank | Executive Letter
In addition to her knowledge of the law governing H .R ., Becky is an innovative trainer and has developed programs to continue educating and building the skill sets of our staff .
RETIREMENT Spencer D . Swank announced his plans to retire as of January 31, 2013 . Spencer joined the Bank in March of 1998, as vice president and CFO, and is retiring from the banking business after a very successful career spanning 43 years . Spencer’s title of CFO and executive vice president did not do justice to the role he played at County National Bank these past 14 years . Spencer was the chief financial officer, branch administrator, chairman of the investment committee and the ALCO committee, risk man-agement officer, cashier of the Bank and had the overall responsibility for marketing, facilities and information technology . County National Bank has consistently performed very well through the years, but especially noteworthy is the Bank’s performance through the latest economic downturn . Spencer’s countless management contributions are in large part the reason behind
the Bank’s success and solid reputation . Spencer will be missed by our customers, Directors and staff; however, he has developed a very capable team of internal successors . We thank Spencer for many years of dedicated service to our organization, and wish him the best in his retirement years .
THE FUTURE Our future continues to be bright with growth opportunities in the markets in which we do business . We have worked hard over many years to develop a positive reputation and image; seeing this effort develop into so many quality referrals is very rewarding . We will continue to focus on providing you, the shareholders, with a very good return on your investment through the payment of dividends and the increase in equity . We plan to stay with the conservative banking business model that has served us so well, keeping us a safe and sound bank . Once again, we all, Directors and employees, would like to thank you for continued support of your locally owned community bank .
Craig S. Connor President & CEO

[ 2 ]
County National Bank | Banking that Starts in Your Community and Stays in Your Community
CountyNationalBank.com
L to R: Craig S. Connor, President & Chief Executive Officer,
Spencer D. Swank, Executive Vice President & Chief Financial Officer
Front, L to R: Suzanne L. Decker, Mortgage Officer, Brenda L. Carpenter, Mortgage Officer, Luann J. Crowley, 2nd Vice President – Mortgage Loans
Back, L to R: Debra K. Storer, Underwriter Operations Officer, Craig D. Talbert, Mortgage Officer, Jeffrey S. Jackson, Consumer Loan Officer, Phyllis J. Brooks, 2nd Vice President – Consumer Loans,
Scott E. Evans, Vice President – Senior Mortgage Officer, Randall L. Tate, Loss Mitigation Officer
Front, L to R: Stacey L. Clemens, Assistant Vice President – Compliance Officer, Dorene M. Shaw, Vice President – Chief Auditor, Debra S. Smith, 2nd Vice President – Accounting
Back, L to R: Sharon L. Burns, 2nd Vice President – CFO, Rae A. Organ, Assistant Vice President – Bank Secrecy & Security Officer
Front, L to R: Wendora K. Broesamle, Hillsdale Branch Officer, Linda C. Cavasin, Spring Arbor Branch Officer, Gwenda J. Ripley, Cortland/Jackson Branch Officer Back, L to R: Donald W. Germann, Jonesville Branch Officer, Michelle L. Caldwell, Litchfield Branch Officer,
Kelly D. Jensen, 2nd Vice President – Branch Administrator, Robin G. Pelham, Somerset Center Branch Officer, Craig R. Burlingame, Homer Branch Officer
Front, L to R: Timothy P. Sullivan, Assistant Vice President – Trust Officer, Mary P. Marshall, Vice President – Senior Trust Officer Back, L to R: Christine L. Walworth, Assistant Vice President – Trust Operations Officer, Barry A. Malek, Assistant Vice President – Trust Officer
Seated, L to R: David J. Kreger, Assistant Vice President – Commercial Loan Officer, Eric A. Potes, Commercial Loan Officer, William C. Jors, 2nd Vice President – Commercial Loan Officer Standing, L to R: John R. Waldron, Senior Vice President – Senior Loan Officer, Kelly L. Lantis, Commercial Credit Officer, Lois E. Howard, Vice President – Commercial Loans,
Ronald J. Haber, 2nd Vice President – Commercial Loans, Chad E. Rumsey, Commercial Loan Officer
Seated, L to R: Jill A. Taylor, Marketing & Public Relations Officer, Sandra K. Grimm, Assistant Vice President – Data Processing, Rebecca J. Wiley, Human Resources & Staff Development Officer Standing, L to R: Diane K. Clow, Vice President – Director of Human Resources, L. Michelle Heminger, 2nd Vice President – Administration, Cindy Dwyer, Vice President – Technology
County National Bank | 2012 Officers
Banking that Starts in Your Communityand Stays in Your Community

CountyNationalBank.com
Member FDICPrinted on 10% post consumer recycled paper

CNB Community Bancorp,
Inc.
Hillsdale, Michigan
Years Ended December 31, 2012 and 2011
Consolidated Financial
Statements
CNB COMMUNITY BANCORP, INC. TABLE OF CONTENTS PAGE
Independent Auditors’ Report 1 Consolidated Financial Statements for the Years Ended December 31, 2012 and 2011 Consolidated Balance Sheets 2 Consolidated Statements of Income 3 Consolidated Statements of Comprehensive Income 4 Consolidated Statements of Shareholders’ Equity 5 Consolidated Statements of Cash Flows 6 Notes to Consolidated Financial Statements 7-29

Rehmann Robson
675 Robinson Rd. Jackson, MI 49203 Ph: 517.787.6503 Fx: 517.788.8111
www.rehmann.com
1
INDEPENDENT AUDITORS’ REPORT March 1, 2013 Board of Directors and Shareholders CNB Community Bancorp, Inc. Hillsdale, Michigan We have audited the accompanying consolidated financial statements of CNB Community Bancorp, Inc. (the Corporation), which comprise the consolidated balance sheets as of December 31, 2012 and 2011, and the related consolidated statements of income, comprehensive income, shareholders’ equity and cash flows for the years then ended, and the related notes to the consolidated financial statements. Management’s Responsibility for the Financial Statements Management is responsible for the preparation and fair presentation of these consolidated financial statements in accordance with accounting principles generally accepted in the United States of America; this includes the design, implementation, and maintenance of internal control relevant to the preparation and fair presentation of consolidated financial statements that are free from material misstatement, whether due to fraud or error. Independent Auditors’ Responsibility Our responsibility is to express an opinion on these consolidated financial statements based on our audits. We conducted our audits in accordance with auditing standards generally accepted in the United States of America. Those standards require that we plan and perform the audit to obtain reasonable assurance about whether the consolidated financial statements are free of material misstatement. An audit involves performing procedures to obtain audit evidence about the amounts and disclosures in the consolidated financial statements. The procedures selected depend on auditor judgment, including the assessment of the risks of material misstatement of the consolidated financial statements, whether due to fraud or error. In making those risk assessments, the auditor considers internal control relevant to the Corporation’s preparation and fair presentation of the consolidated financial statements in order to design audit procedures that are appropriate in the circumstances, but not for the purpose of expressing an opinion on the effectiveness of the Corporation’s internal control. Accordingly, we express no such opinion. An audit also includes evaluating the appropriateness of accounting policies used and the reasonableness of significant accounting estimates made by management, as well as evaluating the overall presentation of the consolidated financial statements. We believe that the audit evidence we have obtained is sufficient and appropriate to provide a basis for our audit opinion. Opinion In our opinion, the consolidated financial statements referred to above present fairly, in all material respects, the consolidated financial position of CNB Community Bancorp, Inc. as of December 31, 2012 and 2011, and the consolidated results of their operations and their cash flows for the years then ended in accordance with accounting principles generally accepted in the United States of America.

CNB COMMUNITY BANCORP, INC.
CONSOLIDATED BALANCE SHEETS
December 31
2012 2011
Cash and due from banks 70,298,373$ 33,446,034$
Federal funds sold 440,187 262,961
Cash and cash equivalents 70,738,560 33,708,995
Certificates of deposit 9,515,000 487,000
Investment securities 25,917,557 18,845,340
Net portfolio loans 316,578,540 307,912,951
Loans held for sale 1,445,018 1,519,328
Accrued interest receivable 1,128,349 1,177,310
Premises and equipment, net 4,630,776 4,097,920
Bank-owned life insurance 4,167,285 4,051,082
Goodwill 2,590,750 2,590,750
Other assets 6,501,731 7,880,605
Total assets 443,213,566$ 382,271,281$
Deposits
Noninterest-bearing demand 72,323,190$ 60,037,273$
NOW, MMDA, and other interest-bearing deposits 172,055,368 121,528,286
Savings 72,987,097 64,572,430
Time 73,880,345 78,462,188
Total deposits 391,246,000 324,600,177
FHLB advances and line-of-credit 15,495,465 22,531,296
Other line-of-credit borrowings 650,000 750,000
Accrued interest payable 84,866 120,620
Other liabilities 783,429 1,497,445
Total liabilities 408,259,760 349,499,538
Commitments and contingencies (Notes 11, 12, 13 and 14)
Shareholders' equity
Common stock, no par value; 4,000,000 shares authorized,
2,018,703 shares issued and outstanding (2,004,003 at
December 31, 2011) 10,989,445 10,709,851
Unearned restricted stock awards (368,262) (251,713)
Retained earnings 24,171,693 22,193,193
Accumulated other comprehensive income 160,930 120,412
Total shareholders' equity 34,953,806 32,771,743
Total liabilities and shareholders' equity 443,213,566$ 382,271,281$
ASSETS
LIABILITIES AND SHAREHOLDERS' EQUITY
The accompanying notes are an integral part of these consolidated financial statements.
2

CNB COMMUNITY BANCORP, INC.
CONSOLIDATED STATEMENTS OF INCOME
Year Ended December 31
2012 2011
Interest and dividend income
Loans (including fees) 17,246,240$ 17,216,187$
Debt securities
Taxable 228,943 195,181
Tax-exempt 384,204 417,534
Dividends and other 93,780 74,654
Total interest and dividend income 17,953,167 17,903,556
Interest expense
Deposits 1,220,914 1,584,989
Borrowed funds 385,870 388,869
Total interest expense 1,606,784 1,973,858
Net interest income 16,346,383 15,929,698
Provision for loan losses 1,245,000 1,914,430
Net interest income, after provision for loan losses 15,101,383 14,015,268
Noninterest income
Service charges on deposit accounts 980,604 922,011
Trust fees 578,817 532,860
Net gain on loans sold 1,907,871 1,047,828
ATM service charges 901,533 803,989
Net loan servicing fees 99,163 191,774
Other 773,503 846,996
Total noninterest income 5,241,491 4,345,458
Noninterest expenses
Compensation and benefits 9,406,715 8,266,783
Occupancy and equipment 2,006,343 1,814,990
Professional fees 386,455 347,402
Printing, stationery and supplies 171,793 167,216
Other 3,150,880 2,806,064
Total noninterest expenses 15,122,186 13,402,455
Income before federal income taxes 5,220,688 4,958,271
Federal income taxes 1,508,750 1,523,593
Net income 3,711,938$ 3,434,678$
Net income per basic share of common stock 1.84$ 1.71$
The accompanying notes are an integral part of these consolidated financial statements.
3

CNB COMMUNITY BANCORP, INC.
CONSOLIDATED STATEMENTS OF COMPREHENSIVE INCOME
Year Ended December 31
2012 2011
Unrealized holding gain (loss) on available-for-sale securities
arising during the year 61,518$ (64,063)$
Income tax (expense) benefit related to unrealized gain (loss) on
available-for-sale securities arising during the year (21,000) 22,000
Other comprehensive income (loss) 40,518 (42,063)
Net income 3,711,938 3,434,678
Comprehensive income 3,752,456$ 3,392,615$
The accompanying notes are an integral part of these consolidated financial statements.
4

CNB COMMUNITY BANCORP, INC.
CONSOLIDATED STATEMENTS OF SHAREHOLDERS' EQUITY
Unearned Accumulated
Restricted Other Total
Stock Retained Comprehensive Shareholders'
Shares Amount Awards Earnings Income Equity
Balances, January 1, 2011 1,996,673 10,566,140$ (226,628)$ $20,440,621 162,475$ 30,942,608$
Comprehensive income - - - 3,434,678 (42,063) 3,392,615
Restricted stock awards, net of
forfeitures (Note 15) 7,330 143,711 (25,085) - - 118,626
Dividends declared - $0.84
per share of common stock - - - (1,682,106) - (1,682,106)
Balances, December 31, 2011 2,004,003 10,709,851 (251,713) 22,193,193 120,412 32,771,743
Comprehensive income - - - 3,711,938 40,518 3,752,456
Restricted stock awards, net of
forfeitures (Note 15) 14,700 279,594 (116,549) - - 163,045
Dividends declared - $0.86
per share of common stock - - - (1,733,438) - (1,733,438)
Balances, December 31, 2012 2,018,703 10,989,445$ (368,262)$ 24,171,693$ 160,930$ 34,953,806$
Common Stock
The accompanying notes are an integral part of these consolidated financial statements.
5
CNB COMMUNITY BANCORP, INC.
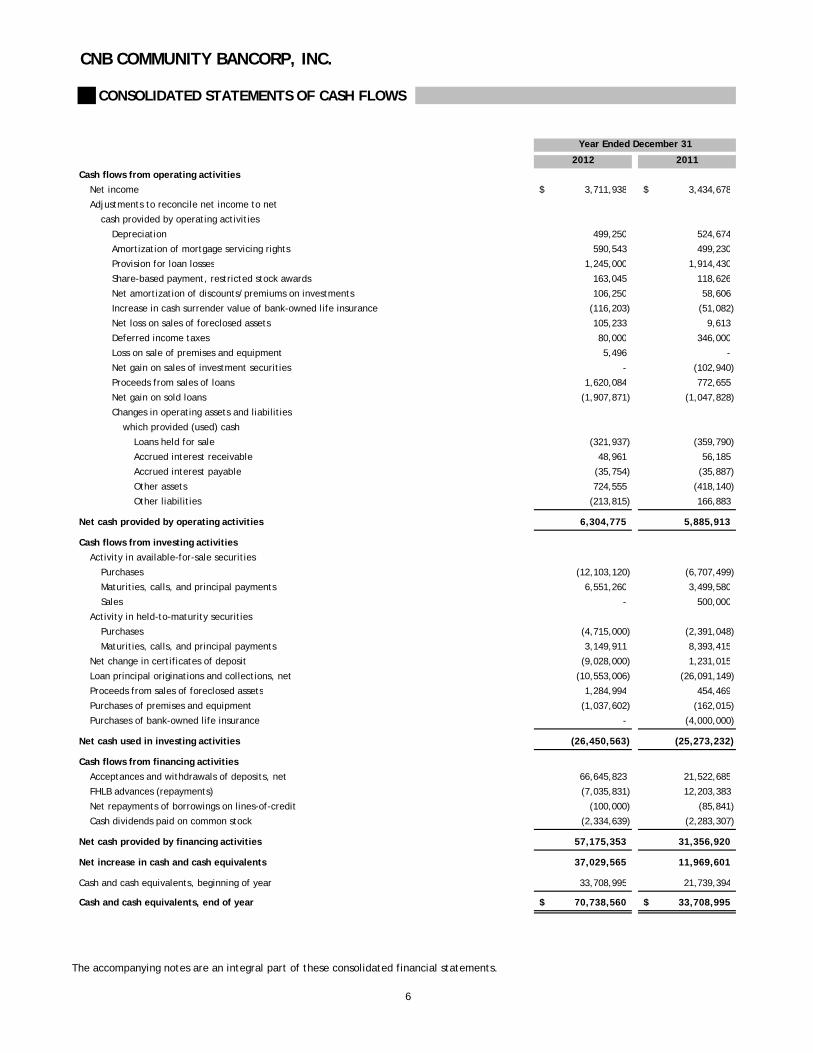
CONSOLIDATED STATEMENTS OF CASH FLOWS
Year Ended December 31
2012 2011
Cash flows from operating activities
Net income 3,711,938$ 3,434,678$
Adjustments to reconcile net income to net
cash provided by operating activities
Depreciation 499,250 524,674
Amortization of mortgage servicing rights 590,543 499,230
Provision for loan losses 1,245,000 1,914,430
Share-based payment, restricted stock awards 163,045 118,626
Net amortization of discounts/premiums on investments 106,250 58,606
Increase in cash surrender value of bank-owned life insurance (116,203) (51,082)
Net loss on sales of foreclosed assets 105,233 9,613
Deferred income taxes 80,000 346,000
Loss on sale of premises and equipment 5,496 -
Net gain on sales of investment securities - (102,940)
Proceeds from sales of loans 1,620,084 772,655
Net gain on sold loans (1,907,871) (1,047,828)
Changes in operating assets and liabilities
which provided (used) cash
Loans held for sale (321,937) (359,790)
Accrued interest receivable 48,961 56,185
Accrued interest payable (35,754) (35,887)
Other assets 724,555 (418,140)
Other liabilities (213,815) 166,883
Net cash provided by operating activities 6,304,775 5,885,913
Cash flows from investing activities
Activity in available-for-sale securities
Purchases (12,103,120) (6,707,499)
Maturities, calls, and principal payments 6,551,260 3,499,580
Sales - 500,000
Activity in held-to-maturity securities
Purchases (4,715,000) (2,391,048)
Maturities, calls, and principal payments 3,149,911 8,393,415
Net change in certificates of deposit (9,028,000) 1,231,015
Loan principal originations and collections, net (10,553,006) (26,091,149)
Proceeds from sales of foreclosed assets 1,284,994 454,469
Purchases of premises and equipment (1,037,602) (162,015)
Purchases of bank-owned life insurance - (4,000,000)
Net cash used in investing activities (26,450,563) (25,273,232)
Cash flows from financing activities
Acceptances and withdrawals of deposits, net 66,645,823 21,522,685
FHLB advances (repayments) (7,035,831) 12,203,383
Net repayments of borrowings on lines-of-credit (100,000) (85,841)
Cash dividends paid on common stock (2,334,639) (2,283,307)
Net cash provided by financing activities 57,175,353 31,356,920
Net increase in cash and cash equivalents 37,029,565 11,969,601
Cash and cash equivalents, beginning of year 33,708,995 21,739,394
Cash and cash equivalents, end of year 70,738,560$ 33,708,995$
The accompanying notes are an integral part of these consolidated financial statements.
6

CNB COMMUNITY BANCORP, INC. NOTES TO CONSOLIDATED FINANCIAL STATEMENTS
7
1. BUSINESS AND SUMMARY OF SIGNIFICANT ACCOUNTING POLICIES
Consolidation and Nature of Business The consolidated financial statements include the accounts of CNB Community Bancorp, Inc., a registered bank holding company (the “Corporation”), and its wholly-owned subsidiary Hillsdale County National Bank (the “Bank”). All significant intercompany transactions and balances have been eliminated in consolidation. The Bank is an independently owned community bank engaged in the business of retail and commercial banking services through its 11 full-service branches located in Hillsdale, Jackson, Lenawee and Calhoun Counties in Michigan. Active competition, principally from other commercial banks, savings banks, and credit unions, exists in the Bank’s primary markets. The Bank’s results of operations can be significantly affected by changes in interest rates or changes in the automotive and agricultural industries which comprise a significant portion of the local economic environment. Concentration Risks The Bank’s primary deposit products are interest and noninterest-bearing checking accounts, savings accounts, and time deposits, and its primary lending products are residential and commercial real estate mortgages, commercial and consumer loans. The Bank does not have any significant concentrations with respect to any one industry, customer, or depositor. The Bank also provides trust services. The Bank is a federally chartered bank and is a member of the Federal Deposit Insurance Corporation (“FDIC”) Bank Insurance Fund. The Bank is subject to the regulations of the FDIC and the supervision of the Office of the Comptroller of the Currency (“OCC”) and undergoes periodic examinations by these regulatory authorities. The Corporation is further subject to regulations of the Federal Reserve Board governing bank holding companies. Use of Estimates The preparation of consolidated financial statements in conformity with generally accepted accounting principles requires management to make estimates and assumptions that affect the reported amounts of assets and liabilities as of the date of the consolidated balance sheet and reported amounts of income and expenses during the year. Actual results could differ from those estimates. Significant estimates include but are not limited to the determination of the allowance for loan losses, the fair value of certain investment securities, the carrying values of intangible assets, and the fair values of financial instruments. Summary of Significant Accounting Policies Accounting policies used in the preparation of the accompanying consolidated financial statements are in conformity with accounting principles generally accepted in the United States. The principles which materially affect the determination of the financial position or results of operations of the Corporation and the Bank are summarized below. Cash and Cash Equivalents For the purposes of the consolidated statements of cash flows, cash and cash equivalents include cash and balances due from banks and federal funds sold. Generally, federal funds are sold for a one-day period. The Corporation maintains deposit accounts in various financial institutions which generally exceed federally insured limits or are not insured. Management does not believe the Corporation is exposed to any significant interest, credit, or other financial risk as a result of these deposits. Certificates of Deposit Certificates of deposit are held with other financial institutions and are carried at cost. Maturities range from within one year to five years. Fair Value Measurements Fair value refers to the price that would be received to sell an asset or paid to transfer a liability (an exit price) in an orderly transaction between market participants in the market in which the reporting entity transacts such sales or transfers based on the assumptions market participants would use when pricing an asset or liability. Assumptions are developed based on prioritizing information within a fair value hierarchy that gives the highest priority to quoted prices in active markets (Level 1) and the lowest priority to unobservable data, such as the reporting entity’s own data (Level 3). A description of each category in the fair value hierarchy is as follows:
Level 1: Valuation is based upon quoted prices for identical instruments traded in active markets. Level 2: Valuation is based upon quoted prices for similar instruments in active markets, quoted prices for identical or similar instruments in markets that are not active, and model-based valuation techniques for which all significant assumptions are observable in the market. Level 3: Valuation is generated from model-based techniques that use at least one significant assumption not observable in the market. These unobservable assumptions reflect the estimates of assumptions that market participants would use in pricing the asset or liability.
CNB COMMUNITY BANCORP, INC. NOTES TO CONSOLIDATED FINANCIAL STATEMENTS
8
For a further discussion of Fair Value Measurements, refer to Note 2 to the consolidated financial statements. Investment Securities Debt securities that management has the ability and positive intent to hold to maturity are classified as held-to-maturity and are recorded at amortized cost. All other investment securities are classified as available-for-sale and recorded at fair value, with unrealized gains and losses, net of the effect of deferred income taxes, recorded in other comprehensive income. Purchase premiums and discounts are recognized in interest income using the interest method over the terms of the investment securities. Realized gains or losses on the sale of the available-for-sale securities are recorded in investment income on the trade date and are determined using the specific identification method. Investment securities are reviewed at each reporting period for possible other-than-temporary impairment (“OTTI”). In determining whether an other-than-temporary impairment exists for debt securities, management must assert that: (a) it does not have the intent to sell the security; and (b) it is more likely than not it will not have to sell the security before recovery of its cost basis. If these conditions are not met, the Corporation separates the total impairment into the credit loss component and the amount of the loss related to other factors. In order to determine the amount of the credit loss for a debt security, the Corporation calculates the recovery value by performing a discounted cash flow analysis based on the current cash flows and future cash flows management expects to recover. The amount of the total other-than-temporary impairment related to the credit risk is recognized in earnings and is included in noninterest income. The amount of the total other-than-temporary impairment related to other risk factors is recognized as a component of other comprehensive income. For debt securities that have recognized an other-than-temporary impairment through earnings, if through subsequent evaluation there is a significant increase in the cash flow expected, the difference between the amortized cost basis and the cash flows expected to be collected is accreted as interest income. Available-for-sale equity securities are reviewed for other-than-temporary impairment at each reporting date. This evaluation considers a number of factors including, but not limited to, the length of time and extent to which the fair value has been less than cost, the financial condition and near term prospects of the issuer, and management’s ability and intent to hold the securities until fair value recovers. If it is determined that management does not have the ability and intent to hold the securities until recovery or that there are conditions that indicate that a security may not recover in value then the difference between the fair value and the cost of the security is recognized in earnings and is included in noninterest income. No such losses were recognized in 2012 or 2011. Restricted Investments The Bank is a member of the Federal Home Loan System and is required to invest in capital stock of the Federal Home Loan Bank of Indianapolis (“FHLBI”). The amount of the required investment is based upon the available balance of the Bank’s advances from the FHLBI and is carried at cost plus the value assigned to stock dividends. The Bank is also a member of the Federal Reserve Bank System (“FRB”). The FRB determines the amount of the required investment at the time the Bank becomes a member. The amount is carried at cost. Loans Loans that management has the positive intent and ability to hold for the foreseeable future or until maturity or pay-off are generally reported at their outstanding unpaid principal balances adjusted for charge-offs, the allowance for loan losses, and any deferred fees or costs on originated loans. Interest income is accrued on the unpaid principal balance. Loan origination fees, net of certain direct loan origination costs, are deferred and recognized as an adjustment of the related loan yield using the interest method. The accrual of interest on mortgage and commercial loans is discontinued at the time the loan is 90 days past due unless the credit is well-secured and in process of collection. Personal loans are typically charged-off no later than 180 days past due. Past due status is based on contractual terms of the loan. In all cases, loans are placed on nonaccrual or charged-off at an earlier date if collection of principal or interest is considered doubtful. All interest accrued in the current year but not collected for loans that are placed on nonaccrual or are charged-off, is reversed against interest income while interest accrued but not collected in prior years is reversed against the allowance for loan losses. The interest income on these loans is accounted for on the cash-basis or cost-recovery method, until qualifying for return to accrual. Loans are returned to accrual status when all principal and interest amounts contractually due are brought current and future payments are reasonably assured. For impaired loans not classified as nonaccrual, interest income is recognized daily as it is earned according to the terms of the loan agreement. Nonperforming loans of the loan portfolio are comprised of those loans accounted for on a nonaccrual basis, accruing loans contractually past due 90 days or more as to interest or principal payments (120 days or more past due on real estate residential loans) and loans modified under troubled debt restructurings (nonperforming originated loans). Allowance for Loan Losses The allowance for loan losses (“allowance”) is an estimate of loan losses inherent in the Bank's loan portfolio. The allowance is established through a provision for loan losses which is charged to expense. Additions to the allowance are expected to maintain the appropriateness of the total allowance after loan losses. Loan losses are charged-off against the allowance when the Bank determines the loan balance to be uncollectible. Cash received on previously charged-off amounts is recorded as a recovery to the allowance.
CNB COMMUNITY BANCORP, INC. NOTES TO CONSOLIDATED FINANCIAL STATEMENTS
9
The allowance consists of two primary components, general reserves and specific reserves related to impaired loans. The general component covers non-impaired loans and is based on historical losses adjusted for current factors. The historical loss experience is determined by portfolio segment and is based on the actual loss history experienced by the Bank over the most recent three years. The Bank places more emphasis, or weight, on the more current quarters in the loss history period. This actual loss experience is adjusted for economic factors based on the risks present for each portfolio segment. These economic factors include consideration of the following: levels of and trends in delinquencies and impaired loans; levels of and trends in charge-offs and recoveries; trends in volume and terms of loans; effects of any changes in risk selection and underwriting standards; other changes in lending policies, procedures, and practices; experience, ability, and depth of lending management and other relevant staff; national and local economic trends and conditions; industry conditions; and effects of changes in credit concentrations. These factors are inherently subjective and are driven by the repayment risk associated with each portfolio segment. A loan is considered impaired when, based on current information and events, it is probable that the Bank will be unable to collect the scheduled payments of principal or interest when due according to the contractual terms of the loan agreement. Factors considered by management in determining impairment include payment status, collateral value, and the probability of collecting scheduled principal and interest payments when due. Loans that experience insignificant payment delays and payment shortfalls generally are not classified as impaired. Management determines the significance of payment delays and payment shortfalls on a case-by-case basis, taking into consideration all of the circumstances surrounding the loan and the borrower, including the length of the delay, the reasons for the delay, the borrower’s prior payment record, and the amount of the shortfall in relation to the principal and interest owed. Impairment is measured on a loan-by-loan basis for commercial loans by either the present value of expected future cash flows discounted at the loan’s effective interest rate, the loans obtained market price, or the fair value of the collateral, less costs to sell, if the loan is collateral dependent. A loan is collateral dependent if its repayment is expected to be provided solely by the underlying collateral. Large groups of smaller balance homogeneous loans are collectively evaluated for impairment. Accordingly, the Bank does not separately identify individual consumer and residential loans for impairment disclosures, unless such loans are the subject of a restructuring agreement. The Bank evaluates the credit quality of loans in the consumer loan portfolio, based primarily on the aging status of the loan and payment activity. Accordingly, nonaccrual loans, loans past due as to principal or interest 90 days or more and loans modified under troubled debt restructurings of the originated portfolio are considered in a nonperforming status for purposes of credit quality evaluation. Under certain circumstances, the Bank will provide borrowers relief through loan restructurings. A loan restructuring constitutes a troubled debt restructuring (“TDR”) if for economic or legal reasons related to the borrower's financial difficulties the Bank grants a concession to the borrower that it would not otherwise consider. Restructured loans typically present an elevated level of credit risk as the borrowers are not able to perform according to the original contractual terms. Loans that are reported as TDRs are considered impaired and measured for impairment as described above. The Bank assigns a risk rating to all loans that exceed $25,000 and all nonaccrual loans, and periodically performs detailed internal reviews of all loans over $300,000 and of all lines of credit. These risk ratings are also subject to examination by the Bank's regulators. During the internal reviews, management monitors and analyzes the financial condition of borrowers and guarantors, trends in the industries in which the borrowers operate and the fair values of collateral securing the loans. These credit quality indicators are used to assign a risk rating to each individual loan. The risk ratings can be grouped into five major categories, defined as follows:
Pass: A pass loan is a credit with no existing or known potential weaknesses deserving of management's close attention. Special Mention: Loans classified as special mention have a potential weakness that deserves management's close attention. If left uncorrected, this potential weakness may result in deterioration of the repayment prospects for the loan or of the Bank's credit position at some future date. Special mention loans are not adversely classified and do not expose the Bank to sufficient risk to warrant adverse classification. Substandard: Loans classified as substandard are not adequately protected by the current net worth and paying capacity of the borrower or of the collateral pledged, if any. Loans classified as substandard have a well-defined weakness or weaknesses that jeopardize the repayment of the debt. Well defined weaknesses include a borrower's lack of marketability, inadequate cash flow or collateral support, failure to complete construction on time, or the failure to fulfill economic expectations. They are characterized by the distinct possibility that the Bank will sustain some loss if the deficiencies are not corrected. Doubtful: Loans classified as doubtful have all the weaknesses inherent in those classified as substandard, with the added characteristic that the weaknesses make collection or repayment in full, on the basis of currently existing facts, conditions, and values, highly questionable and improbable. Loss: Loans classified as loss are considered uncollectible and are charged-off immediately.

CNB COMMUNITY BANCORP, INC. NOTES TO CONSOLIDATED FINANCIAL STATEMENTS
10
The majority of the Bank’s consumer and residential loan portfolio is comprised of secured loans that are evaluated at origination on a centralized basis against standardized underwriting criteria. The ongoing measurement of credit quality of the consumer and residential loan portfolios is largely done on an exception basis. If payments are made on schedule, as agreed, then no further monitoring is performed. However, if delinquency occurs, the delinquent loans are turned over to the Bank’s loss mitigation department for resolution. Credit quality for the entire consumer and residential loan portfolio is measured by the periodic delinquency rate, nonaccrual amounts and actual losses incurred.
The Bank maintains a separate general valuation allowance for each portfolio segment. These portfolio segments include commercial, commercial real estate, residential real estate, and consumer with risk characteristics described as follows:
Commercial: Commercial loans are generally underwritten to existing cash flows of operating businesses. Debt coverage is provided by business cash flows and economic trends influenced by unemployment rates and other key economic indicators are closely correlated to the credit quality of these loans. Commercial Real Estate: Commercial real estate loans consist of owner occupied and non-owner occupied businesses, with the majority being owner occupied. Most commercial real estate loans are personally guaranteed by the owners of the real estate. Trends in vacancy rates of commercial properties impact the credit quality of these loans. Residential Real Estate: The degree of risk in residential mortgage lending depends primarily on the loan amount in relation to collateral value, the interest rate and the borrower's ability to repay in an orderly fashion. Economic trends determined by unemployment rates and other key economic indicators are closely correlated to the credit quality of these loans. For the last few years, weak economic trends indicate that the borrowers' capacity to repay their obligations had been deteriorating. Consumer: The consumer loan portfolio is usually comprised of a large number of small loans, including automobile, personal, recreational purpose, etc. Most loans are made directly for consumer purchases. Economic trends determined by unemployment rates and other key economic indicators are closely correlated to the credit quality of these loans. Strong underwriting guidelines within this portfolio remain in place.
Although management believes the allowance to be appropriate, ultimate losses may vary from its estimates. At least quarterly, the Board of Directors reviews the appropriateness of the allowance, including consideration of the relevant risks in the portfolio, current economic conditions and other factors. If the Board of Directors and management determine that changes are warranted based on those reviews, the allowance is adjusted. In addition, the Bank's primary regulator reviews the appropriateness of the allowance. The regulatory agency may require changes to the allowance based on its judgment about information available at the time of its examination. Off-Balance Sheet Credit Related Financial Instruments In the ordinary course of business, the Bank has entered into commitments to extend credit, including commitments under credit arrangements, commercial letters of credit, and standby letters of credit. Such financial instruments are recorded when they are funded. Loans Held for Sale Mortgage loans originated and intended for sale in the secondary market are carried at the lower of aggregate cost or fair value in the aggregate. Net unrealized losses, if any, are recognized through a valuation allowance of which adjustments are recognized in the consolidated statements of income. Transfers of Financial Assets Transfers of financial assets, including mortgage loans held-for-sale, as described above, are accounted for as sales when control over the assets has been surrendered. Control over transferred assets is deemed to be surrendered when 1) the assets have been legally isolated from the Bank, 2) the transferee obtains the right (free of conditions that constrain it from taking advantage of that right) to pledge or exchange the transferred assets, and 3) the Bank does not maintain effective control over the transferred assets through an agreement to repurchase them before their maturity. Other than servicing, as disclosed in Note 5, the Bank has no substantive continuing involvement related to these loans. Servicing Servicing assets are recognized as separate assets when rights are acquired through purchase or through sale of financial assets. Generally, purchased servicing rights are capitalized at the cost to acquire the rights. For sales of mortgage loans, a portion of the cost of originating the loan is allocated to the servicing right based on relative fair value. Fair value is based on market prices for comparable mortgage servicing contracts, when available, or alternatively, is based on a valuation model that calculates the present value of estimated future net servicing income. The valuation model incorporates assumptions that market participants would use in estimating future net servicing income, such as the cost to service, the discount rate, the custodial earnings rate, an inflation rate, ancillary income, prepayment speeds and default rates and losses.

CNB COMMUNITY BANCORP, INC. NOTES TO CONSOLIDATED FINANCIAL STATEMENTS
11
Servicing assets or liabilities are amortized in proportion to and over the period of net servicing income or net servicing loss and are assessed for impairment or increased obligation based on fair value of rights compared to amortized cost at each reporting date. Impairment is determined by stratifying rights into tranches based on predominant risk characteristics, such as interest rate, loan type, and investor type. Impairment is recognized through a valuation allowance for an individual tranche, to the extent that fair value is less than the capitalized amount for the tranche. If the Bank later determines that all or a portion of the impairment no longer exists for a particular tranche, a reduction of the allowance may be recorded as an increase to income. Capitalized servicing rights are reported in other assets on the consolidated balance sheets. Servicing fee income is recorded for fees earned for servicing loans for others. The fees are based on a contractual percentage of the outstanding principal, or a fixed amount per loan and are recorded as income when earned. The amortization of mortgage servicing rights is netted against loan servicing fee income, a component of noninterest income. Foreclosed Assets Assets acquired through, or in lieu of, loan foreclosure are held for sale and are initially recorded at fair value, less costs to sell, on the date of transfer, establishing a new cost basis. Subsequent to foreclosure, valuations are periodically performed by management and the assets are carried at the lower of the carrying amount or fair value less costs to sell. Revenue and expenses from operations and changes in the valuation allowance are included in other noninterest expenses on the consolidated statements of income. Premises and Equipment Land is carried at cost. Premises and equipment are carried at cost, less accumulated depreciation which is computed principally by the straight-line method based upon the estimated useful lives of the related assets, which range from 3 to 40 years. Major improvements are capitalized and appropriately amortized based upon the useful lives of the related assets or the expected terms of the leases, if shorter, using the straight-line method. Maintenance, repairs, and minor alterations are charged to current operations as expenditures occur. Management annually reviews these assets to determine whether carrying values have been impaired. FDIC Insurance Premium (Included in Other Assets) The Corporation was required to prepay quarterly FDIC risk-based assessments for the fourth quarter of 2009 and each of the quarters in the years ending December 31, 2010, 2011, 2012, and 2013. The assessments for subsequent years have been deferred on the accompanying December 31, 2012 and 2011 consolidated balance sheets as a prepaid asset of approximately $426,000 and $704,000, respectively, and are expected to be expensed on a ratable basis quarterly through December 31, 2013. Bank-Owned Life Insurance (BOLI) The Corporation holds life insurance policies purchased on the lives of key members of management. In the event of death of one of these individuals, the Corporation, as beneficiary of the policies, would receive a specified cash payment equal to the face value of the policy. Such policies are recorded at their cash surrender value, or the amount that can be currently realized as of the consolidated balance sheet date. The change in cash surrender value is an adjustment of premiums paid in determining the net expense or income recognized under the contracts for the year and is included in noninterest expenses or income. Goodwill Goodwill consists of amounts paid in excess over the fair value of identifiable net assets acquired. Goodwill is not amortized but is assessed at least annually for impairment or on an interim basis if an event occurs or circumstances change that would more likely than not reduce the fair value of the reporting unit below the carrying value. Income Taxes Deferred income tax assets and liabilities are determined using the liability (or balance sheet) method. Under this method, the net deferred tax asset or liability is determined based on the federal income tax effects of the temporary differences between the book and tax bases of the various balance sheet assets and liabilities and gives current recognition to changes in tax rates and laws. Valuation allowances are established, where necessary, to reduce deferred tax assets to the amount expected more likely than not to be realized. Income tax expense is the tax payable or refundable for the year plus or minus the change during the year in deferred tax assets and liabilities. The Corporation analyzes its filing positions in the jurisdictions where it is required to file income tax returns, as well as all open tax years in these jurisdictions. The Corporation also treats interest and penalties attributable to income taxes, and reflects any charges for such, to the extent they arise, as a component of its noninterest expenses. Net Income Per Share Basic earnings per share represents income available to common stockholders divided by the weighted-average number of common shares outstanding during the year, which was 2,013,522 and 2,001,495 during 2012 and 2011, respectively. Diluted earnings per share reflects additional common shares that would have been outstanding if dilutive potential common shares had been issued, as well as any adjustments to income that would result from the assumed issuance.

CNB COMMUNITY BANCORP, INC. NOTES TO CONSOLIDATED FINANCIAL STATEMENTS
12
Reclassifications Certain amounts as reported in the 2011 consolidated financial statements have been reclassified to conform with the 2012 presentation. Subsequent Events In preparing these consolidated financial statements, the Corporation has evaluated, for potential recognition or disclosure, significant events or transactions that occurred during the period subsequent to December 31, 2012, the most recent consolidated balance sheet presented herein, through March 1, 2013, the date these consolidated financial statements were available to be issued. No such significant events or transactions were identified.
2. FAIR VALUE MEASUREMENTS
The Corporation utilizes fair value measurements to record fair value adjustments to certain assets and liabilities and to determine fair value disclosures. Marketable securities available-for-sale are recorded at fair value on a recurring basis. Additionally, from time to time, the Corporation may be required to record at fair value other assets on a nonrecurring basis, such as impaired loans, loans held for sale, foreclosed assets, mortgage servicing rights, held-to-maturity securities, and certain other assets and liabilities. These nonrecurring fair value adjustments typically involve the application of lower of cost or market accounting or write downs of individual assets. Following is a description of the valuation methodologies and key inputs used to measure financial assets and liabilities recorded at fair value, as well as a description of the methods and significant assumptions used to estimate fair value disclosures for financial instruments not recorded at fair value in their entirety on a recurring basis. For financial assets and liabilities recorded at fair value, the description includes an indication of the level of the fair value hierarchy in which the assets or liabilities are classified.
Cash and Cash Equivalents The carrying value of cash and short-term instruments, including Federal funds sold, approximates fair values. Certificate of Deposits Fair value of certificates of deposit are estimated using discounted cash flow analysis based on current rates for similar types of deposit. Investment Securities Held-to-maturity securities are recorded at fair value on a nonrecurring basis, unless an other-than-temporary impairment is recorded. Investment securities classified as available-for-sale are recorded at fair value on a recurring basis. Fair value measurement is based upon quoted prices, if available. If quoted prices are not available, fair values are measured using independent pricing models or other model based valuation techniques such as the present value of future cash flows, adjusted for the security’s credit rating, prepayment assumptions and other factors such as credit loss and liquidity assumptions. Level 1 securities include those traded on an active exchange, such as the New York Stock Exchange, that are traded by dealers or brokers in active over-the-counter markets and money market funds. Level 2 fair value measurement is based upon quoted prices, if available. If quoted prices are not available, fair values are measured using independent pricing models or other model based valuation techniques such as the present value of future cash flows, adjusted for the security’s credit rating, prepayment assumptions and other factors such as credit loss and liquidity assumptions. Level 2 securities include mortgage-backed securities issued by government-sponsored entities, municipal bonds and corporate debt securities in active markets. The Corporation did not have Level 3 investment securities valued on a recurring basis at December 31, 2012 or 2011. Federal Reserve Bank and Federal Home Loan Bank Stock The carrying value of Federal Reserve Bank and Federal Home Loan Bank of Indianapolis Stock approximates fair value based on the redemption provisions of the Federal Reserve Bank and Federal Home Loan Bank of Indianapolis. Loans Held for Sale Loans held for sale are carried at the lower of cost or fair value. The fair value of loans held for sale is based on what secondary markets are currently offering for portfolios with similar characteristics. As such, the Corporation classifies loans held for sale subjected to nonrecurring fair value adjustments as Level 2. At December 31, 2012 and 2011, there was no impairment recorded for loans held for sale and, therefore, no loans held for sale were recorded at fair value on a nonrecurring basis. Loans For variable-rate loans that reprice frequently and with no significant change in credit risk, fair values are based on carrying values. Fair values for fixed interest rate loans are estimated using discounted cash flow analyses, using interest rates currently being offered for loans with similar terms to borrowers of similar credit quality. The resulting amounts are adjusted to estimate the effect of declines, if any, in the credit quality of borrowers since the loans were originated. Fair values for nonperforming loans are estimated using discounted cash flow analyses or underlying collateral values, where applicable.

CNB COMMUNITY BANCORP, INC. NOTES TO CONSOLIDATED FINANCIAL STATEMENTS
13
The Corporation does not record loans at fair value on a recurring basis. However, from time to time, a loan is considered impaired and an allowance for loan losses is established. Loans for which it is probable that payment of interest and principal will not be made in accordance with the contractual terms of the loan agreement are considered impaired. Once a loan is identified as individually impaired, management measures impairment in accordance with accounting standards for subsequent measurement of receivables. The fair value of impaired loans is estimated using one of several methods, including collateral value, market value of similar debt, enterprise value, liquidation value and discounted cash flows. Those impaired loans not requiring an allowance represent loans for which the fair value of the expected repayments or collateral exceed the recorded investments in such loans. At December 31, 2012 and 2011, substantially all of the total impaired loans were evaluated based on the fair value of the collateral. Impaired loans where an allowance is established based on the fair value of collateral require classification in the fair value hierarchy. When the fair value of the collateral is based on an observable market price or a current appraised value, the Corporation records the impaired loan as nonrecurring Level 2. When a current appraised value is not available or management determines the fair value of the collateral is further impaired below the appraised value and there is no observable market price, the Corporation records the impaired loan as nonrecurring Level 3. Accrued Interest Receivable The carrying amounts reported in the consolidated balance sheets for interest receivable approximate their fair value. Foreclosed Assets The carrying amounts for foreclosed assets are reported in the consolidated balance sheets under “Other assets.” Upon transfer from the loan portfolio, foreclosed assets are adjusted to and subsequently carried at the lower of carrying value or fair value less costs to sell. Fair value is based upon independent market prices, appraised values of the collateral or management’s estimation of the value of the collateral. When the fair value of the collateral is based on an observable market price or a current appraised value, the Corporation classifies the foreclosed asset as nonrecurring Level 2. When a current appraised value is not available or management determines the fair value of the collateral is further impaired below the appraised value and there is no observable market price, the Corporation classifies the foreclosed asset as nonrecurring Level 3. Mortgage Servicing Rights Mortgage servicing rights are subject to impairment testing. A valuation model, which utilizes a discounted cash flow analysis using interest rates and prepayment speed assumptions currently quoted for comparable instruments and a discount rate determined by management, is used for impairment testing. If the valuation model reflects a value less than the carrying value, loan servicing rights are adjusted to fair value through a valuation allowance as determined by the model. As such, the Corporation classifies loan servicing rights subjected to nonrecurring fair value adjustments as Level 3. At December 31, 2012 and 2011, there was no impairment recorded for mortgage servicing rights and, therefore, no mortgage servicing rights assets were recorded at fair value on a nonrecurring basis. Goodwill Goodwill is subject to impairment testing. A projected cash flow valuation method is used in the completion of impairment testing. This valuation method requires a significant degree of management judgment. In the event the projected undiscounted net operating cash flows are less than the carrying value, the asset is recorded at fair value as determined by the valuation model. If the testing resulted in impairment, the Corporation would classify goodwill subjected to nonrecurring fair value adjustments as Level 3. At December 31, 2012 and 2011, no goodwill impairment was recorded and, therefore, no goodwill was recorded at fair value on a nonrecurring basis. Interest- and Noninterest-Bearing Deposits The fair values of demand deposit accounts, such as interest- and noninterest-bearing checking, savings and money market accounts, are equal to the amounts payable on demand. Fair values for interest-bearing deposits (time deposits) with defined maturities are based on the discounted value of contractual cash flows, using interest rates currently being offered for deposits of similar maturities. The fair values for variable-interest rate certificates of deposit approximate their carrying value. Borrowings and Advances The fair values of the Corporation’s borrowings and advances are estimated using discounted cash flow analyses based on the Corporation’s current incremental borrowing rates for similar types of borrowing arrangements. Accrued Interest Payable The carrying amounts reported in the consolidated balance sheets for accrued interest payable approximate fair values. Commitments to Extend Credit, Standby Letters of Credit, and Undisbursed Loans The Corporation’s unused loan commitments, standby letters of credit and undisbursed loans have no carrying amount and have been estimated to have no realizable fair value. Historically, a majority of the unused loan commitments have not been drawn upon and, generally, the Corporation does not receive fees in connection with these commitments.

CNB COMMUNITY BANCORP, INC. NOTES TO CONSOLIDATED FINANCIAL STATEMENTS
14
The preceding methods described may produce a fair value calculation that may not be indicative of net realizable value or reflective of future fair values. Furthermore, although the Corporation believes its valuation methods are appropriate and consistent with other market participants, the use of different methodologies or assumptions to determine the fair value of certain financial instruments could result in a different fair value measurement at the reporting date. Assets Recorded at Fair Value on a Recurring Basis The following table sets forth by level, within the fair value hierarchy, the recorded amount of assets measured at fair value on a recurring basis as of December 31:
2012
Assets at Fair Value
Level 1 Level 2 Level 3 Total
Investment securities available-for-sale: Government-sponsored enterprises $ - $ 2,896,289 $ - $ 2,896,289 Mortgage-backed securities - 1,008,202 - 1,008,202 State and municipal - 8,722,341 - 8,722,341 Money market preferred securities - 466,340 - 466,340 Preferred stock 390,800 - - 390,800 Total assets at fair value $ 390,800 $ 13,093,172 $ - $ 13,483,972
2011
Assets at Fair Value
Level 1 Level 2 Level 3 Total
Investment securities available-for-sale: Government-sponsored enterprises $ - $ 5,014,560 $ - $ 5,014,560 Mortgage-backed securities - 1,441,003 - 1,441,003 State and municipal - 723,104 - 723,104 Money market preferred securities - 466,340 - 466,340 Preferred stock 294,200 - - 294,200 Total assets at fair value $ 294,200 $ 7,645,007 $ - $ 7,939,207
Assets Recorded at Fair Value on a Nonrecurring Basis The following table sets forth by level, within the fair value hierarchy, the recorded amount of assets measured at fair value on a nonrecurring basis as of December 31:
2012
Assets at Carrying Value
Level 1 Level 2 Level 3 Total
Impaired loans (1) $ - $ - $ 7,713,289 $ 7,713,289 Foreclosed assets (2) - - 320,808 320,808
2011
Assets at Carrying Value
Level 1 Level 2 Level 3 Total
Impaired loans (1) $ - $ - $ 777,291 $ 777,291 Foreclosed assets (2) - - 368,810 368,810

CNB COMMUNITY BANCORP, INC. NOTES TO CONSOLIDATED FINANCIAL STATEMENTS
15
(1) Impaired loans, which are measured for impairment using the fair value of the collateral for collateral dependent loans, had a carrying amount of $7,713,289 and $777,291 as of December 31, 2012 and 2011, respectively, resulting in a specific allocation for loan losses of $1,419,347 and $287,170 for the years then ended.
(2) Foreclosed assets, which are carried at the lower of carrying value or fair value less cost to sell, were written down
from cost to $320,808 and $368,810 as of December 31, 2012 and 2011, resulting in charges of $176,800 and $73,992 included in other noninterest expenses on the consolidated statement for 2012 and 2011, respectively.
Quantitative information about Level 3 fair value measurements is as follows as of December 31, 2012:
Instrument
Level 3 Instruments
Fair Value
Valuation Technique
Unobservable Input
Weighted Average and/or Range
Impaired Loans $ 7,713,289 Discounted Appraisal
Value
Discount Applied to Collateral Appraisal 20%
Foreclosed Assets
$ 320,808
Discounted Appraisal Value
Discount Applied to Collateral Appraisal
7% - 43%
Estimated Fair Values of Financial Instruments Not Recorded at Fair Value in their Entirety on a Recurring Basis Disclosure of the estimated fair values of financial instruments, which differ from carrying values, often requires the use of estimates. In cases where quoted market values in an active market are not available, the Corporation uses present value techniques and other valuation methods to estimate the fair values of its financial instruments. These valuation methods require considerable judgment and the resulting estimates of fair value can be significantly affected by the assumptions made and methods used. The methodologies for estimating fair value of financial assets and financial liabilities on a recurring and nonrecurring basis are discussed above. The carrying amount and estimated fair value of financial instruments not recorded at fair value in their entirety on a recurring basis on the Corporation’s consolidated balance sheets are as follows (in thousands):
2012 2011
Carrying Amount
Estimated Fair Value
Carrying Amount
Estimated Fair Value
Assets: Cash and cash equivalents $ 70,739 $ 70,739 $ 33,709 $ 33,709 Certificates of deposit 9,515 9,517 487 488 Investment securities held-to-maturity 12,434 12,643 10,906 11,139 Federal Reserve Bank stock 324 324 324 324 Federal Home Loan Bank of Indianapolis stock 1,742 1,742 1,742 1,742 Loans held for sale 1,445 1,445 1,519 1,519 Net loans 316,579 314,129 307,913 306,428 Mortgage servicing rights 1,392 1,911 1,302 1,990 Accrued interest receivable 1,128 1,128 1,177 1,177 Liabilities: Deposits $ 391,246 $ 388,904 $ 324,600 $ 322,514 FHLB advances and line-of-credit 15,495 15,447 22,531 22,786 Other line-of-credit 650 650 750 750 Accrued interest payable 85 85 121 121

CNB COMMUNITY BANCORP, INC. NOTES TO CONSOLIDATED FINANCIAL STATEMENTS
16
3. INVESTMENT SECURITIES
The amortized cost and fair value of non-trading investment securities, including gross unrealized gains and losses, are summarized as follows as of December 31:
2012
Amortized Cost
Gross Unrealized
Gains
Gross Unrealized
Losses
Fair
Value
Available-for-Sale Debt securities: Government-sponsored enterprises $ 2,886,718 $ 9,571 $ - $ 2,896,289 Mortgage-backed securities 947,331 60,871 - 1,008,202 State and municipal 8,715,651 48,191 41,501 8,722,341 Total debt securities 12,549,700 118,633 41,501 12,626,832 Money market preferred securities 466,340 - - 466,340 Preferred stock 224,000 166,800 - 390,800 Total available-for-sale 13,240,040 285,433 41,501 13,483,972 Held-to-Maturity State and municipal 12,429,068 209,625 - 12,638,693 Mortgage-backed securities 4,517 49 - 4,566 Total held-to-maturity 12,433,585 209,674 - 12,643,259
Total $ 25,673,625 $ 495,107 $ 41,501 $ 26,127,231
2011
Amortized Cost
Gross Unrealized
Gains
Gross Unrealized
Losses
Fair
Value
Available-for-Sale Debt securities: Government-sponsored enterprises $ 5,000,932 $ 14,295 $ 667 $ 5,014,560 Mortgage-backed securities 1,365,617 75,386 - 1,441,003 State and municipal 699,906 23,198 - 723,104 Total debt securities 7,066,455 112,879 667 7,178,667 Money market preferred securities 466,340 - - 466,340 Preferred stock 224,000 70,200 - 294,200 Total available-for-sale 7,756,795 183,079 667 7,939,207 Held-to-Maturity State and municipal 10,899,698 233,327 43 11,132,982 Mortgage-backed securities 6,435 18 - 6,453 Total held-to-maturity 10,906,133 233,345 43 11,139,435 Total $ 18,662,928 $ 416,424 $ 710 $ 19,078,642
Investment securities with carrying values of approximately $1,890,000 and $3,000,000 as of December 31, 2012 and 2011, respectively, were pledged to secure public deposits or for other purposes as required by law.

CNB COMMUNITY BANCORP, INC. NOTES TO CONSOLIDATED FINANCIAL STATEMENTS
17
The amortized cost and fair value of held-to-maturity and available-for-sale debt securities grouped by contractual maturity at December 31, 2012 are summarized as follows:
2012
Maturing
Due In One Year or Less
Due After One Year Through
Five Years
Due After Five Years
Through Ten Years
Due After Ten Years
Securities With
Variable Monthly
Payments
Total
Available-for-Sale Debt Securities Government-sponsored enterprises $ 1,000,297 $ 1,886,421 $ - $ - $ - $ 2,886,718 Mortgaged-backed Securities - - - - 947,331 947,331 State and municipal - 2,384,934 4,640,535 1,690,182 - 8,715,651 Total available-for-sale debt securities 1,000,297 4,271,355 4,640,535 1,690,182 947,331 12,549,700 Held-to-Maturity State and municipal 4,709,000 2,809,705 4,325,279 585,084 - 12,429,068 Mortgage-backed securities - - - - 4,517 4,517 Total held-to-maturity 4,709,000 2,809,705 4,325,279 585,084 4,517 12,433,585 Total amortized cost $ 5,709,297 $ 7,081,060 $ 8,965,814 $ 2,275,266 $ 951,848 $ 24,983,285
Fair value $ 5,719,046 $ 7,158,806 $ 9,076,988 $ 2,302,483 $ 1,012,768 $ 25,270,091
Expected maturities may differ from contractual maturities because issuers may have the right to call or prepay obligations. Because of their variable payments, mortgage-backed securities are not reported by a specific maturity grouping. During 2011, proceeds from sales of available-for-sale securities amounted to $500,000. Gross realized gains amounted to $102,940 during 2011 and there were no gross realized losses during 2011. There were no sales of available-for-sale securities during 2012. There were no investment securities in a continuous unrealized loss position as of December 31, 2012 or 2011.
4. LOANS AND ALLOWANCES FOR LOAN AND FORECLOSED ASSET LOSSES
The Bank grants commercial, consumer, and residential mortgage loans to customers situated primarily in Hillsdale, Jackson, Lenawee and Calhoun Counties. The ability of the Bank’s debtors to honor their repayment obligations is dependent upon the real estate and general economic conditions of this region. Substantially all of the consumer and residential mortgage loans are secured by various items of property, while commercial loans are secured primarily by business assets, real estate, and personal guarantees; a portion of loans is unsecured. Loans are summarized as follows at December 31:
2012 2011
Commercial $ 54,965,462 $ 54,500,516 Commercial real estate 146,541,178 117,983,317 Residential real estate 102,392,535 121,285,256 Consumer 18,351,371 19,758,460
Total loans 322,250,546 313,527,549 Net deferred loan origination fees (168,961) (2,004) Allowance for loan losses (5,503,045) (5,612,594)
Loans, net $ 316,578,540 $ 307,912,951
As of December 31, 2012, loans were classified in the above table based on loan type. As of December 31, 2011, loans were classified based on collateral for commercial and residential real estate loans.

CNB COMMUNITY BANCORP, INC. NOTES TO CONSOLIDATED FINANCIAL STATEMENTS
18
The allowance for loan losses and balance in loans is as follows for the years ended December 31:
2012
Commercial
Commercial Real Estate
Residential Real Estate
Consumer
Unallocated
Total
Allowance for loan losses: Balance at beginning of year $ 493,362 $ 2,334,085 $ 1,206,403 $ 83,246 $ 1,495,498 $ 5,612,594 Provision for (reduction to) loan losses 155,881 1,484,270 838,860 8,645 (1,242,656) 1,245,000 Loans charged-off (44,741) (1,153,793) (353,860) (52,394) - (1,604,788) Recoveries 39,968 142,058 29,798 38,415 - 250,239 Balance at end of year $ 644,470 $ 2,806,620 $ 1,721,201 $ 77,912 $ 252,842 $ 5,503,045 Allowance for loan losses attributable to: Individually evaluated for impairment $ 264,879 $ 1,163,361 $ 267,763 $ 10,514 $ - $ 1,706,517 Collectively evaluated for impairment 379,591 1,643,259 1,453,438 67,398 252,842 3,796,528 Total allowance for loan losses $ 644,470 $ 2,806,620 $ 1,721,201 $ 77,912 $ 252,842 $ 5,503,045 Loans: Individually evaluated for impairment $ 885,194 $ 10,784,126 $ 5,013,038 $ 12,290 $ 16,694,648 Collectively evaluated for impairment 54,080,268 135,757,052 97,379,497 18,339,081 305,555,898 Total loans ending balance $ 54,965,462 $ 146,541,178 $ 102,392,535 $ 18,351,371 $ 322,250,546
2011 Commercial Commercial Real Estate
Residential Real Estate Consumer Unallocated Total
Allowance for loan losses: Balance at beginning of year $ 385,456 $ 2,286,894 $ 1,079,993 $ 128,519 $ 915,240 $ 4,796,102 Provision for (reduction to) loan losses 212,088 498,789 644,195 (20,900) 580,258 1,914,430 Loans charged-off (107,657) (551,598) (529,158) (68,383) - (1,256,796) Recoveries 3,475 100,000 11,373 44,010 - 158,858 Balance at end of year $ 493,362 $ 2,334,085 $ 1,206,403 $ 83,246 $ 1,495,498 $ 5,612,594 Allowance for loan losses attributed to: Individually evaluated for Impairment $ - $ 184,562 $ 102,608 $ - $ - $ 287,170 Collectively evaluated for impairment 493,362 2,149,523 1,103,795 83,246 1,495,498 5,325,424 Total allowance for loan losses $ 493,362 $ 2,334,085 $ 1,206,403 $ 83,246 $ 1,495,498 $ 5,612,594 Loans: Individually evaluated for impairment $ 415,638 $ 4,442,334 $ 2,651,586 $ - $ 7,509,558 Collectively evaluated for Impairment 54,084,878 113,540,983 118,633,670 19,758,460 306,017,991 Total loans ending balance $ 54,500,516 $ 117,983,317 $ 121,285,256 $ 19,758,460 $ 313,527,549

CNB COMMUNITY BANCORP, INC. NOTES TO CONSOLIDATED FINANCIAL STATEMENTS
19
The following table shows the loans allocated by management’s internal risk ratings as of December 31, 2012:
Risk Rating
Total Pass Special Mention Substandard Doubtful
Credit Risk Profile by Risk Rating Commercial $ 53,361,774 $ 60,012 $ 1,160,651 $ - $ 54,582,437 Commercial real estate 137,234,707 986,134 6,746,948 1,520,936 146,488,725 Residential real estate 75,637,210 1,480,839 1,084,995 790,566 78,993,610 Consumer 6,455,732 40,208 130,613 - 6,626,553 Total $ 272,689,423 $ 2,567,193 $ 9,123,207 $ 2,311,502 $ 286,691,325 The following table shows the homogeneous loans allocated by payment activity as of December 31, 2012:
Credit Risk Profile by Payment Activity
Total Commercial Commercial Real Estate
Residential Real Estate Consumer
Payment activity Performing $ 383,025 $ 52,453 $ 23,398,925 $ 11,724,818 $ 35,559,221 Nonperforming - - - - - Total $ 383,025 $ 52,453 $ 23,398,925 $ 11,724,818 $ 35,559,221
The following table shows the loans allocated by management’s internal risk ratings as of December 31, 2011:
Risk Rating
Total Pass Special Mention Substandard Doubtful
Credit Risk Profile by Risk Rating Commercial $ 52,434,620 $ 8,924 $ 793,047 $ - $ 53,236,591 Commercial real estate 111,303,955 163,103 3,734,184 934,743 116,135,985 Residential real estate 88,487,040 1,780,483 4,057,774 593,112 94,918,409 Consumer 7,807,320 90,463 93,110 - 7,990,893 Total $ 260,032,935 $ 2,042,973 $ 8,678,115 $ 1,527,855 $ 272,281,878
The following table shows the homogeneous loans allocated by payment activity as of December 31, 2011:
Credit Risk Profile by Payment Activity
Total Commercial Commercial Real Estate
Residential Real Estate Consumer
Payment activity Performing $ 1,263,925 $ 1,847,332 $ 26,366,847 $ 11,767,567 $ 41,245,671 Nonperforming - - - - - Total $ 1,263,935 $ 1,847,332 $ 26,366,847 $ 11,767,567 $ 41,245,671

CNB COMMUNITY BANCORP, INC. NOTES TO CONSOLIDATED FINANCIAL STATEMENTS
20
The following tables show an aging analysis of the loan portfolio by time past due as of December 31:
2012
Accruing Interest
Total Nonaccrual
Total Loans Current
30-89 Days
Past Due More Than 90 Days Past Due
Commercial $ 54,354,601 $ 374,653 $ - $ 236,208 $ 54,965,462 Commercial real estate 141,745,692 1,079,284 - 3,716,202 146,541,178 Residential real estate 97,836,164 3,455,122 388,255 712,994 102,392,535 Consumer 18,042,003 257,915 37,850 13,603 18,351,371 Total $ 311,978,460 $ 5,166,974 $ 426,105 $ 4,679,007 $ 322,250,546
2011
Accruing Interest
Total Nonaccrual
Total Loans Current
30-89 Days
Past Due More Than 90 Days Past Due
Commercial $ 54,115,338 $ 127,418 $ 31,317 $ 226,443 $ 54,500,516 Commercial real estate 115,771,418 512,255 - 1,699,644 117,983,317 Residential real estate 115,169,249 4,662,071 - 1,453,936 121,285,256 Consumer 19,663,483 94,977 - - 19,758,460 Total $ 304,719,488 $ 5,396,721 $ 31,317 $ 3,380,023 $ 313,527,549
The following tables present information related to impaired loans as of December 31, 2012 and 2011 and related interest income recognized during the years then ended:
2012
Recorded
Investment
Unpaid Principal Balance
Related
Allowance
Average Recorded
Investment
Interest Income
Recognized
Loans with no related allowance recorded Commercial $ 275,556 $ 273,208 $ - $ 1,055,000 $ 9,719 Commercial real estate 2,871,615 2,863,862 - 5,120,000 112,289 Residential real estate 3,923,436 3,905,032 - 3,968,000 165,188 Total loans with no related allowance recorded $ 7,070,607 $ 7,042,102 $ - $ 10,143,000 $ 287,196 Loans with an allowance recorded Commercial $ 618,537 $ 611,986 $ 264,879 $ 153,000 $ 16,514 Commercial real estate 7,952,469 7,920,264 1,163,361 2,538,000 329,073 Residential real estate 1,114,962 1,108,006 267,763 373,000 39,851 Installment 12,729 12,290 10,514 3,000 648 Total loans with an allowance recorded $ 9,698,697 $ 9,652,546 $ 1,706,517 $ 3,067,000 $ 386,086 Total impaired loans Commercial $ 894,093 $ 885,194 $ 264,879 $ 1,208,000 $ 26,233 Commercial real estate 10,824,084 10,784,126 1,163,361 7,658,000 441,362 Residential real estate 5,038,398 5,013,038 267,763 4,341,000 205,039 Installment 12,729 12,290 10,514 3,000 648 Total impaired loans $ 16,769,304 $ 16,694,648 $ 1,706,517 $ 13,210,000 $ 673,282

CNB COMMUNITY BANCORP, INC. NOTES TO CONSOLIDATED FINANCIAL STATEMENTS
21
2011
Recorded
Investment
Unpaid Principal Balance
Related
Allowance
Average Recorded
Investment
Interest Income
Recognized
Loans with no related allowance recorded Commercial $ 417,882 $ 415,638 $ - $ 386,000 $ 26,991 Commercial real estate 3,703,852 3,671,083 - 1,648,000 105,801 Residential real estate 2,369,429 2,358,377 - 2,006,000 117,978 Total loans with no related allowance recorded $ 6,491,163 $ 6,445,098 $ - $ 4,040,000 $ 250,770 Loans with an allowance recorded Commercial $ - $ - $ - $ - $ - Commercial real estate 771,252 771,252 184,562 2,000,000 2,365 Residential real estate 294,274 293,209 102,608 268,000 8,856 Total loans with an allowance recorded $ 1,065,526 $ 1,064,461 $ 287,170 $ 2,268,000 $ 11,221 Total impaired loans Commercial $ 417,882 $ 415,638 $ - $ 386,000 $ 26,991 Commercial real estate 4,475,103 4,442,334 184,562 3,648,000 108,166 Residential real estate 2,663,703 2,651,586 102,608 2,274,000 126,834 Total impaired loans $ 7,556,688 $ 7,509,558 $ 287,170 $ 6,308,000 $ 261,991
The Bank does not have material commitments to lend additional funds to borrowers with loans whose terms have been modified in troubled debt restructurings or whose loans are on nonaccrual. The following tables detail the number of loans and the recorded investment in loans considered to be troubled debt restructurings (TDRs) by type of modification during the years ended December 31:
2012
Total Modification
Total Modifications
Principal Deferrals
Principal Deferrals and Interest Rate Reductions
Number Of
Loans Recorded
Investment
Number Of
Loans Recorded
Investment
Commercial 3 $ 411,542 - $ - $ 411,542 Commercial real estate 5 587,018 16 3,080,552 3,667,570 Residential real estate 1 18,131 21 2,397,749 2,415,880 Total 9 $ 1,016,691 37 $ 5,478,301 $ 6,494,992

CNB COMMUNITY BANCORP, INC. NOTES TO CONSOLIDATED FINANCIAL STATEMENTS
22
2011
Total Modification
Total Modifications
Principal Deferrals
Principal Deferrals and Interest Rate Reductions
Number Of
Loans Recorded
Investment
Number Of
Loans Recorded
Investment
Commercial 4 $ 385,311 1 $ 9,962 $ 395,273 Commercial real estate 5 969,797 6 1,357,185 2,326,982 Residential real estate 4 153,016 1 209,477 362,493 Total 13 $ 1,508,124 8 $ 1,576,624 $ 3,084,748
There were no TDRs that defaulted during 2012 and 2011 that had been modified during the previous 12 months.
Foreclosed assets (included within other assets) of $1,015,732 and $2,049,654 as of December 31, 2012 and 2011, respectively, are presented net of a valuation allowance for losses. The following is a summary of the changes in the allowance for foreclosed asset losses during the years ended December 31:
2012 2011
Balance, beginning of year $ 61,650 $ -
Charge-offs (167,958) (12,342) Provision for losses 176,800 73,992
Balance, end of year $ 70,492 $ 61,650
5. SERVICING
The Bank services loans for others which generally consists of collecting mortgage payments, maintaining escrow accounts, disbursing payments to investors and taxing authorities, and processing foreclosures. Loans serviced as of December 31, 2012 and 2011, approximated $256 million and $244 million, respectively; such loans are not included on the accompanying consolidated balance sheets. The fair values of mortgage servicing rights were approximately $1,911,000 and $1,990,000 at December 31, 2012 and 2011, respectively. The fair value of servicing rights was determined using discount rates ranging from 7.72% to 8.21%, and prepayment speeds ranging from 18.25% to 18.61%, depending upon the stratification of the specific right. The following summarizes the carrying value and the changes therein of mortgage servicing rights for the years ended December 31:
2012 2011
Balance at beginning of year $ 1,301,804 $ 1,370,520 Mortgage servicing rights capitalized 680,839 430,514 Mortgage servicing rights amortized (590,543) (499,230) Balance at end of year $ 1,392,100 $ 1,301,804

CNB COMMUNITY BANCORP, INC. NOTES TO CONSOLIDATED FINANCIAL STATEMENTS
23
6. PREMISES AND EQUIPMENT
Net premises and equipment consists of the following assets at December 31:
2012 2011
Land and improvements $ 1,053,508 $ 1,053,508 Buildings and improvements 4,981,400 4,954,643 Leasehold improvements 594,442 492,937 Furniture and equipment 6,595,453 5,760,000 Construction in process 9,500 - Total 13,234,303 12,261,088 Less accumulated depreciation 8,603,527 8,163,168 Premises and equipment, net $ 4,630,776 $ 4,097,920
Depreciation expense was $499,250 and $524,674 for 2012 and 2011, respectively.
7. DEPOSITS
Time deposits of $100,000 or more were $33,765,335 and $35,348,196 as of December 31, 2012 and 2011, respectively. Interest expense on these deposits was $421,594 and $536,555 in 2012 and 2011, respectively. Scheduled annual maturities of time deposits for each of the five years succeeding December 31, 2012, and thereafter, are summarized as follows:
Year Amount
2013 $ 35,403,892 2014 19,733,385 2015 8,183,350 2016 4,709,771 2017 5,449,947 Thereafter 400,000 Total $ 73,880,345
8. BORROWED FUNDS
Federal Home Loan Bank Advances and Line of Credit The Corporation’s Federal Home Loan Bank (“FHLB”) line of credit payable consists of outstanding draws on a $10,000,000 revolving line-of-credit under the FHLB’s Overdraft Line of Credit program, with interest on borrowings charged at the FHLB short-term variable interest rate (effective rate of .50% at December 31, 2012). The expiration date of this agreement is June 18, 2013. There were no outstanding draws as of December 31, 2012 or 2011. Outstanding FHLB borrowings are collateralized by a blanket lien on all qualified 1-to-4 family whole mortgage loans and multifamily whole mortgage loans with carrying values totaling approximately $48,250,000 and $38,924,000 at December 31, 2012 and 2011, respectively.

CNB COMMUNITY BANCORP, INC. NOTES TO CONSOLIDATED FINANCIAL STATEMENTS
24
FHLB advances and their contractual maturities are summarized as follows at December 31:
2012 2011
Putable fixed rate advances: May 21, 2012 0.31% $ - $ 2,000,000 January 24, 2013 0.49% - 5,000,000
June 15, 2015 4.55% 795,465 831,296 April 29, 2016 2.15% 5,000,000 5,000,000 July 25, 2016 1.86% 3,000,000 3,000,000
December 1, 2016 4.77% 1,700,000 1,700,000 December 16, 2016 1.26% 5,000,000 5,000,000 Total FHLB advances $ 15,495,465 $ 22,531,296
Line of Credit Borrowings The Corporation has a line of credit note payable available with a bank under a $2,000,000 revolving credit facility with interest on borrowings charged at the prime rate less 1% with a floor of 3.25% (effective rate of 3.25% at December 31, 2012). The agreement expires on September 30, 2013. Borrowings are collateralized by 100% of the Bank’s outstanding common stock. The borrowing agreement contains restrictive covenants which require the Bank to maintain well-capitalized ratios as defined by Federal Reserve Bank guidelines, allowance for loan losses to total loans of at least 1.0%, to limit non-performing assets to 25% of equity, and minimum return on average assets of 0.75%.
9. FEDERAL INCOME TAXES
The provision for federal income taxes consists of the following components for the years ended December 31:
2012 2011
Currently payable $ 1,428,750 $ 1,177,593 Deferred expense 80,000 346,000
Income taxes $ 1,508,750 $ 1,523,593
Federal income tax expense differs from the statutory federal income tax rate applied to pre-tax income primarily due to tax-exempt income earned for both 2012 and 2011. The components of the net deferred income tax liability which was $207,591 and $106,591 at December 31, 2012 and 2011, respectively, and included within other liabilities in the accompanying consolidated balance sheets, are primarily related to temporary basis differences in the allowance for loan losses, intangible assets, and mortgage servicing rights. The Corporation has evaluated the provisions of ASC Topic 740, Accounting for Uncertainty in Income Taxes for the years 2009 through 2012, the years which remain subject to examination by major tax jurisdictions as of December 31, 2012. The Corporation concluded that there are no significant uncertain tax positions requiring recognition in the Corporation’s consolidated financial statements. The Corporation does not expect the total amount of unrecognized tax benefits (“UTB”) (e.g. tax deductions, exclusions, or credits claimed or expected to be claimed) to significantly change in the next 12 months. The Corporation does not have any amounts accrued for interest and penalties related to UTBs at December 31, 2012 or 2011, and it is not aware of any claims for such amounts by federal or state income tax authorities.
10. RELATED PARTY TRANSACTIONS
Loans In the ordinary course of business, the Bank grants loans to certain directors, executive officers and their affiliates. Such loans aggregated approximately $2,565,000 and $2,541,000 as of December 31, 2012 and 2011, respectively. Deposits Deposits of Corporation directors, executive officers and their affiliates were approximately $1,425,000 and $779,000 at December 31, 2012 and 2011, respectively.

CNB COMMUNITY BANCORP, INC. NOTES TO CONSOLIDATED FINANCIAL STATEMENTS
25
11. OFF-BALANCE SHEET ACTIVITIES The Bank is a party to credit related financial instruments with off-balance sheet risk in the normal course of business to meet the financing needs of its customers. These financial instruments may include commitments to extend credit, standby letters of credit and commercial letters of credit. Such commitments involve, to varying degrees, elements of credit and interest rate risk in excess of the amount recognized in the consolidated balance sheets. The Bank’s exposure to credit loss is represented by the contractual amount of these commitments. The Bank follows the same credit policy in making such commitments, including requirements for collateral, as it does for on-balance sheet instruments; no significant losses are anticipated as a result of these commitments. The following financial instruments were outstanding whose contract amounts represent credit risk at December 31:
Contract Amount
2012 2011
Unfunded commitments under lines of credit $ 70,541,000 $ 71,889,000 Commitments to grant loans 11,083,000 8,719,000 Standby letters of credit 6,173,000 4,932,000
Unfunded commitments under commercial lines of credit and revolving home equity lines of credit and overdraft protection agreements are commitments for possible future extensions of credit to existing customers. The commitments for equity lines of credit may expire without being drawn upon. These lines of credit are uncollateralized and usually do not contain a specified maturity date and may not be drawn upon to the total extent to which the Bank is committed. A majority of such commitments are at fixed rates of interest; a portion is unsecured. Commitments to extend credit are agreements to lend to a customer as long as there is no violation of any condition established in the contract. Commitments generally have fixed interest rates, fixed expiration dates or other termination clauses and may require payment of a fee. The commitments may expire without being drawn upon. Therefore, the total commitment amounts do not necessarily represent future cash requirements. The amount of collateral obtained, if it is deemed necessary by the Bank, is based on management’s credit evaluation of the customer. A portion of these commitments are uncollateralized. Approximately 17% of the above commitments are at fixed rates of interest. Standby letters of credit are conditional commitments issued by the Bank to guarantee a customer’s performance to a third party. Those letters of credit are primarily issued to support public and private borrowing arrangements. Essentially, all letters of credit issued have expiration dates within one year. The credit risk involved in issuing letters of credit is essentially the same as that involved in extending loan facilities to customers. The Bank generally holds collateral supporting those commitments if deemed necessary and at December 31, 2012 and 2011 such collateral amounted to $11,951,212 and $14,472,862, respectively. Guarantees that are not derivative contracts have been recorded on the Corporation’s consolidated balance sheets at their fair value at inception. The Corporation considers standby letters of credit to be guarantees; however, as the amount of the liability related to such guarantees on the commitment date is not significant, a liability related to such guarantees is not recorded at December 31, 2012. Approximately $722,000 of the total commitments were to related parties as of December 31, 2012.
12. DERIVATIVE FINANCIAL INSTRUMENTS
Forward Loan Sale Commitments To protect against the price risk inherent in derivative loan commitments and mortgage loans held for sale, the Corporation utilizes both “mandatory delivery” and “best efforts” forward loan sale commitments to mitigate the risk of potential decreases in the values of loans that would result from the exercise of the derivative loan commitments. With a “mandatory delivery” contract, the Corporation commits to deliver a certain principal amount of mortgage loans to an investor at a specified price on or before a specified date. If the Corporation fails to deliver the amount of mortgages necessary to fulfill the commitment by the specified date, it is obligated to pay a “pair-off” fee, based on then-current market prices, to the investor to compensate the investor for the shortfall. With a “best efforts” contract, the Corporation commits to deliver an individual mortgage loan of a specified principal amount and quality to an investor if the loan to the underlying borrower closes. Generally, the price the investor will pay the seller for an individual loan is specified prior to the loan being funded (e.g., on the same day the lender commits to lend funds to a potential borrower).

CNB COMMUNITY BANCORP, INC. NOTES TO CONSOLIDATED FINANCIAL STATEMENTS
26
The Corporation expects that these forward loan sale commitments will experience changes in fair value opposite to the change in fair value of mortgage loans held for sale. The notional amount of fixed rate forward loan sale commitments was $1,127,070 and $1,519,328 at December 31, 2012 and 2011, respectively. The fair value of the rate lock loan commitments related to the origination of mortgage loans that will be held for sale and the forward loan sale commitments are deemed insignificant by management and, accordingly, are not recorded in these consolidated financial statements. Collateral Requirements To reduce credit risk related to the use of derivative instruments, the Corporation might deem it necessary to obtain collateral. The amount and nature of the collateral obtained is based on the Corporation’s credit evaluation of the customer. Collateral held varies but may include cash, securities, accounts receivable, inventory, property, plant and equipment and real estate. If the counterparty does not have the right and ability to redeem the collateral or the Corporation is permitted to sell or re-pledge the collateral on short notice, the Corporation records the collateral in its consolidated balance sheet at fair value with a corresponding obligation to return it.
13. REGULATORY MATTERS
Capital Requirements The Corporation (on a consolidated basis) and the Bank are subject to various regulatory capital requirements administered by federal banking agencies. Failure to meet minimum regulatory capital requirements can initiate certain mandatory, and possible additional discretionary actions by the federal banking agencies that if undertaken, could have a direct material effect on the Corporation’s and Bank’s financial statements. Under capital adequacy guidelines and the regulatory framework for prompt corrective action, the Corporation and the Bank must meet specific capital guidelines involving quantitative measures of their assets, liabilities, and certain off-balance sheet items as defined in the regulations and calculated under regulatory accounting practices. The capital amounts and classification are also subject to qualitative judgments by the regulators about components, risk weighting, and other factors. Prompt corrective action provisions are not applicable to bank holding companies. Quantitative measurements established by regulation to ensure capital adequacy require the Corporation and the Bank to maintain minimum amounts and ratios (set forth in the following table) of total and Tier 1 capital (as defined in the regulations) to risk-weighted assets (as defined) and Tier 1 capital to average assets (as defined). Management believes as of December 31, 2012 and 2011, that the Corporation and the Bank met all capital adequacy requirements to which they are subject. As of December 31, 2012, the most recent notification from the OCC categorized the Bank as well capitalized under the regulatory framework for prompt corrective action. To be categorized as well capitalized, the Bank must maintain minimum total risk-based, Tier 1 risk-based, and Tier 1 leverage ratios as set forth in the following tables. There are no conditions or events since the most recent notification that management believes have changed the Bank’s category.
The Corporation’s and the Bank’s actual and required capital amounts and ratios are as follows (dollars in thousands):
Actual
Minimum Capital
Requirements
Minimum To Be Well Capitalized Under Prompt
Corrective Action Provisions
December 31, 2012 Amount Ratio Amount Ratio Amount Ratio
Total Capital to Risk
Weighted Assets Corporation $ 35,742 12.5% $ 22,916 8.0% $ N/A N/A% Bank 36,221 12.6 22,916 8.0 28,645 10.0
Tier 1 Capital to Risk Weighted Assets
Corporation 32,063 11.2 11,458 4.0 N/A N/A Bank 32,542 11.4 11,458 4.0 17,187 6.0
Tier 1 Capital to Average Assets
Corporation 32,063 7.8 16,520 4.0 N/A N/A Bank 32,542 7.9 16,520 4.0 20,650 5.0

CNB COMMUNITY BANCORP, INC. NOTES TO CONSOLIDATED FINANCIAL STATEMENTS
27
Actual
Minimum Capital
Requirements
Minimum To Be Well Capitalized Under Prompt
Corrective Action Provisions
December 31, 2011 Amount Ratio Amount Ratio Amount Ratio
Total Capital to Risk
Weighted Assets Corporation $ 33,513 11.9% $ 22,561 8.0% $ N/A N/A% Bank 34,144 12.1 22,561 8.0 28,202 10.0
Tier 1 Capital to Risk Weighted Assets
Corporation 29,930 10.6 11,280 4.0 N/A N/A Bank 30,561 10.8 11,280 4.0 16,921 6.0
Tier 1 Capital to Average Assets
Corporation 29,930 8.0 15,012 4.0 N/A N/A Bank 30,561 8.1 15,012 4.0 18,764 5.0
Restrictions on Cash and Amounts Due from Banks The Bank is required by regulatory agencies to maintain legal cash reserves based on the level of certain customer deposits. Required reserve balances were $9,492,000 and $7,537,000 at December 31, 2012 and 2011, respectively. Restrictions on Dividends, Loans, and Advances Federal and state banking regulations place certain restrictions on dividends paid and the amount of loans or advances that can be extended by the Bank to the Corporation. Prior approval of the Federal Reserve and OCC is required if the total dividends declared by the Bank in a calendar year exceed the sum of the retained net income of the Bank for the current year plus its retained net income for the two preceding years, less any required transfers from retained earnings to common stock (as defined). In addition, dividends paid by the Bank would be prohibited if the effect thereof would cause the Bank’s capital to be reduced below applicable minimum capital standards. At January 1, 2013, the Bank’s retained earnings available for the legal payment of dividends, without prior approval from the regulators, was approximately $3,713,000. Loans or advances made by the Bank to the Corporation are generally limited to 10 percent of the Bank’s contributed capital (par value common stock and additional paid-in capital). Accordingly, at December 31, 2012, Bank funds available for loans or advances to the Corporation amounted to approximately $1,079,000.
14. CONTINGENCIES
Litigation The Corporation may be party to litigation arising during the normal course of business. In the opinion of management, based on consultation with legal counsel, the resolution of such litigation is not expected to have a material effect on the consolidated financial statements. Environmental Issues As a result of acquiring real estate in foreclosure proceedings, the Bank is subject to potential claims and possible legal proceedings involving environmental matters. No such claims have been asserted at December 31, 2012.

CNB COMMUNITY BANCORP, INC. NOTES TO CONSOLIDATED FINANCIAL STATEMENTS
28
15. SHARE-BASED PAYMENTS
Stock Compensation Plan A ten-year Stock Compensation Plan was adopted by the Corporation in April 2007. Under the plan, the Corporation and its subsidiary may grant common stock purchase options, shares of restricted stock, and stock appreciation rights to its directors, officers, and key employees. The aggregate number of shares under option stock and restricted stock that may be issued and outstanding pursuant to the exercise of options, the granting of restricted stock awards or stock appreciation rights under this plan may not exceed 74,000 shares. During 2012 and 2011, no stock options were granted nor stock appreciation rights awarded under the plan. The Corporation issued 14,700 and 7,680 shares of restricted common stock in 2012 and 2011, respectively. The fair value of restricted stock at the grant date was determined by the Corporation’s Board of Directors based on the weighted-average selling price of the Corporation’s common stock for the previous four quarters ($19.02 and $19.61 per share in 2012 and 2011, respectively). Under the provisions of the plan, the Corporation cannot be obligated to “cash-settle” any of the restricted stock awards through redemption. The shares become vested ratably over a four-year period on December 31 of each year if the designated performance criteria are met for that year. During the period the shares are not vested, the grantee may not sell, assign, transfer or pledge the shares but has all other rights of a shareholder, including the right to receive dividends and the right to vote such shares. Restricted stock is immediately forfeited when the employment of a grantee is terminated. Noninterest expense is recognized for the fair value of the vested shares as of the vesting date. During 2012, of the 14,700, 7,680, 7,480 and 5,360 shares of restricted stock issued in 2012, 2011, 2010 and 2009, respectively, grantees became fully vested in a total of 8,705 shares ($18.73 per share). During 2011, of the 7,680, 7,480, 5,360 and 4,920 shares of restricted stock issued in 2011, 2010, 2009 and 2008, respectively, grantees became fully vested in a total of 6,260 shares ($18.95 per share). Included within the Corporation’s consolidated statements of income is compensation expense of $138,508 and $109,531 in 2012 and 2011, respectively, and directors’ and advisory members’ fees expense of $24,536 and $9,096 in 2012 and 2011, respectively, related to the vested shares under the plan. Basic and diluted earnings per share were impacted by approximately $0.04 and $0.02 for 2012 and 2011, respectively related to the cumulative effect. As of December 31, 2012 and 2011, respectively, cumulative unrecognized compensation costs related to nonvested restricted stock awards had balances of $368,262 and $251,713 and are presented as a reduction of shareholders’ equity. A corresponding increase to shareholders’ equity for both 2012 and 2011 is presented within common stock, resulting in no impact on total shareholders’ equity as of December 31, 2012 and 2011. Incentive Stock Option Plan A ten-year Incentive Stock Option Plan was adopted in 1995 in which options may be granted to officers and other key employees to purchase up to 40,000 shares of common stock at fair value on the date of grant. Options are exercisable, in whole or in part, beginning two years and expiring ten years after the date of grant. Effective February 8, 2005, the Incentive Stock Option Plan was terminated in accordance with the Plan document. As such, there were no options available for grant as of December 31, 2012 or 2011.
A summary of activity in the Incentive Stock Option Plan during 2012 and 2011 is as follows:
Options Available for Grant
Options Outstanding
Weighted Average Exercise
Price Outstanding, January 1, 2011 - 8,000 $ 37.60 Exercised - - - Terminated (retirees did not exercise and expiration) - (1,600) $ 40.00 Outstanding, December 31, 2011 - 6,400 $ 37.00 Exercised - - - Terminated (retirees did not exercise and expiration) - (1,600) $ 38.50 Outstanding, December 31, 2012 - 4,800 $ 36.50
For stock options outstanding at December 31, 2012 and 2011, the range of exercise prices per share was between $36.00 and $37.50 for 2012 and $36.00 and $38.50 for 2011, and the weighted average remaining contractual terms were 1.83 years for 2012 and 2.25 years for 2011. At December 31, 2012 and 2011, 4,800 and 6,400 options were exercisable at weighted average exercise prices of $36.50 and $37.00 per share, respectively.

CNB COMMUNITY BANCORP, INC. NOTES TO CONSOLIDATED FINANCIAL STATEMENTS
29
16. EMPLOYEE BENEFIT PLANS
Deferred Compensation Plans A noncontributory pension/profit sharing plan covers all salaried employees following the completion of 1 year of employment (1,000 hours in a 12 consecutive month period) who are 21 years of age or older. Contributions to the plan are made quarterly to the employees’ plan account. The amount of each contribution is determined by the Board of Directors. The Bank also has a complimentary Safe Harbor 401(k) plan for eligible employees, following three consecutive months of service. The Bank makes a “Safe Harbor” matching contribution in the amount of 100% of the employees’ contribution. The percentage rate applies to only the first 5% of the employees’ Plan Salary. Contribution expense related to the noncontributory pension/profit sharing plan was approximately $538,000 and $489,000 in 2012 and 2011, respectively. Contributions to the Safe Harbor 401(k) plan were $293,000 and $244,000 in 2012 and 2011, respectively. Bank-Owned Life Insurance The Corporation has invested $4,000,000 in two separate single premium, bank-owned, endorsement split-dollar life insurance programs. Bank-owned life insurance is an alternative investment vehicle, generally non-liquid, which may generate additional earnings to offset various benefit plan expenses. The earnings on the insurance are not taxed unless withdrawn or surrendered prior to the death of the insured. Any changes in cash surrender value of the policies are recorded as either noninterest income or noninterest expenses in the accompanying consolidated statements of income. To date, no compensation expense has been recognized in the Corporation’s consolidated financial statements to accrue the mortality and related costs of maintaining the life insurance policies in effect during the covered employees’ retirement periods.
17. SUPPLEMENTAL CASH FLOWS INFORMATION
Non-Cash Investing Activities During 2012 and 2011, collateral was repossessed related to mortgage loans receivable of $612,750 and $1,694,492, respectively, which amounts were then transferred to foreclosed assets. Other Cash Flows Information Cash paid for interest and income taxes amounted to the following during the years ended December 31:
2012 2011
Interest $ 1,642,538 $ 2,009,745
Income taxes $ 1,098,000 $ 1,943,000