co-agglomeration and backward-forward linkage: a spatial ... · extrativa mineral metalÚrgica...
TRANSCRIPT
Co-agglomeration and backward-forward linkage: a spatial analysis to Brazil of prospective investment in
the period 2014-2018
Bruno de Oliveira Cruz Iuri Vladimir Queiroz Paula Monteiro de Almeida
Abstract
In a recent report, BNDES, a major bank financing investment in Brazil, announced that investment in some selected sector for the period 2014-2018 could reach the impressive US$ 275,00. Oil and Gas, vehicle and automobile, pulp and paper, electronics, chemistry, Steel mill are among the sector which would expand activities in the next four years. In a very important paper, Ellison, Glaeser and Kerr (2010) therefore EGK, showed that input-output linkages are the most important variable to explain industries co-agglomeration. Those investments perspectives open a new possibility for regional policies, following the results of EGK, one could estimate the backward and forward linkages and possibility to co-agglomerate industries, given the potential investment in the sectors described above. The objective of this paper is to identify the backward and forward linkages of the investment matrix for the period 2014 and estimate the spatial distribution of those sectors in backward and forward linkages with the original initial investment. In other words, we apply the co-agglomerations indexes to asses which sector has the highest probability, given an investment in a sector, for instance Oil and Gas and backward/forward linkage, the co-agglomerate. The identification of those sectors can shed some lights on sectors policy makers could successfully support and can improve the performance of the regional policies. More specifically, we apply the BNDES investment matrix perspectives in the 2005 input-output matrix of the Brazilian Economy; therefore we identify the sectors in the supply chain (backward and forward). Having identified those sectors, we analyze the spatial distributions of the initial investment and their supply chain accordingly to RAIS Data, a labor minister administrative record with a very rich regional coverage in spatial terms in Brazil. We calculate bivariate Moran’s I, EGK co-agglomeration indexes and some other simpler indexes of co-agglomeration.

Guideline
• Motivation
• Objectives
• Datasets and Basic Assumptions
• BNDES Report for Investment Perspectives and National Effects
• Identifying Productive Chain
• Geographic Distribution and Co-location
• Conclusions
Motivation
• Rising investments rate is a major challenge to achieve sustainable long term growth rates. In order to achieve that goal and as a response to international crisis the Brazil government has expanded credit supply in economy, specially through public banks.
• The National Bank for Economic and Social Development (BNDES) had highlighted within this policy having grown from roughly 53 billion dollars in 2000 to about 137 billion in 2012.
• Therefore, crowding production chain as a strategy for regional policy, from large investments of either the BNDES or regional funds. For instance, Sesso Filho et. al (2006) had estimated that up to 1/4 of chain effects would reach North and Northeast regions.
Motivation
• Given the BNDES report on prospective investments, from 2014 to 2018, an evaluation of the chain effects from those investments should arise with expected impacts like Oliveira et. al (2011) analysis on Oil and Gas investments and resulting effects.
• However, it must take into account the regional context of those investments and their resulting effects, in order to enhance regional production chain and its development. We analyze for co-location patterns looking for regional distribution of the expected impacts, given the present regional distribution of sectors, both under investments and production chain participants. Similar to Maciente (2013) and Resende (2012) co-location analysis works.
Objectives
• Analyze patterns of co-location of industries with investment perspective and its effects on supply chain
Datasets and Basic Assumptions
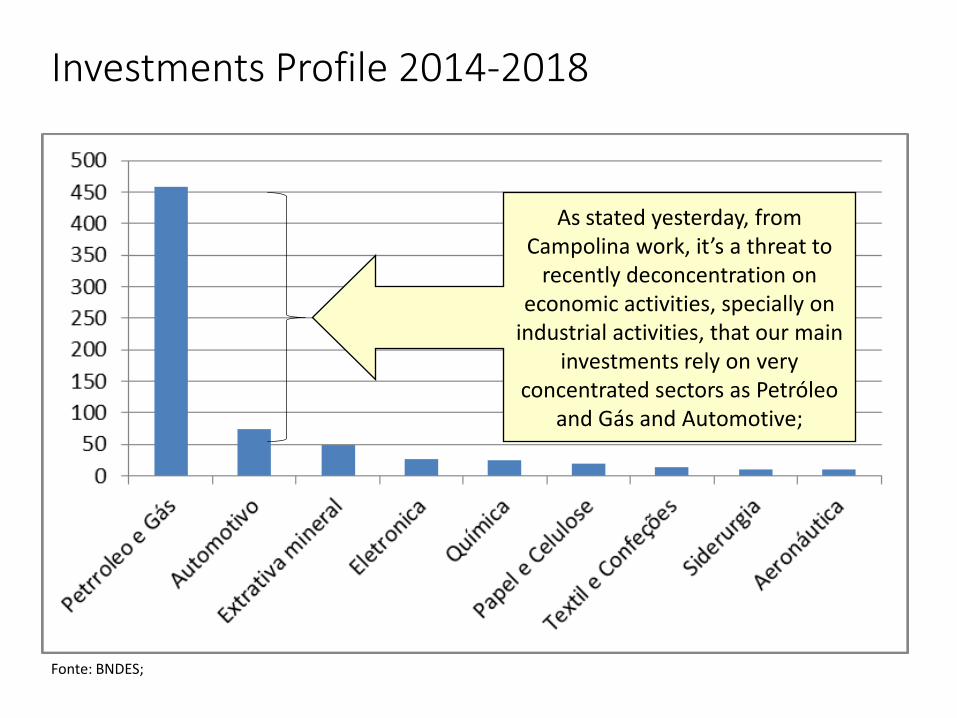
Investments Profile 2014-2018
Fonte: BNDES;
As stated yesterday, from Campolina work, it’s a threat to
recently deconcentration on economic activities, specially on
industrial activities, that our main investments rely on very
concentrated sectors as Petróleo and Gás and Automotive;
SETOR CÓDPART.
INVESTIMENTO (%)
201 60%
309 40%
330 80%
331 20%
202 80%
203 20%
321 40%
322 30%
323 30%
PAPEL E CELULOSE 307 100%
303 80%
304 20%
ATIVIDADES ECONÔMICAS (SCN)
DESCRIÇÃO
PETRÓLEO E GÁS NATURAL
REFINO DE PETRÓLEO E COQUE
AUTOMÓVEIS, CAMIONETAS E UTILITÁRIOS
TÊXTEIS
ARTIGOS DE VESTUÁRIO E ACESSÓRIOS
PETRÓLEO E GÁS
AUTOMOTIVA
EXTRATIVA MINERAL
METALÚRGICA
TÊXTIL, VESTUÁRIO E ACESSÓRIOS
MINÉRIO DE FERRO
OUTROS DA INDÚSTRIA EXTRATIVA
FABRICAÇÃO DE AÇO E DERIVADOS
METALURGIA DE METAIS NÃO-FERROSOS
PRODUTOS DE METAL - EXCLUSIVE MÁQUINAS
CELULOSE E PRODUTOS DE PAPEL
CAMINHÕES E ÔNIBUS
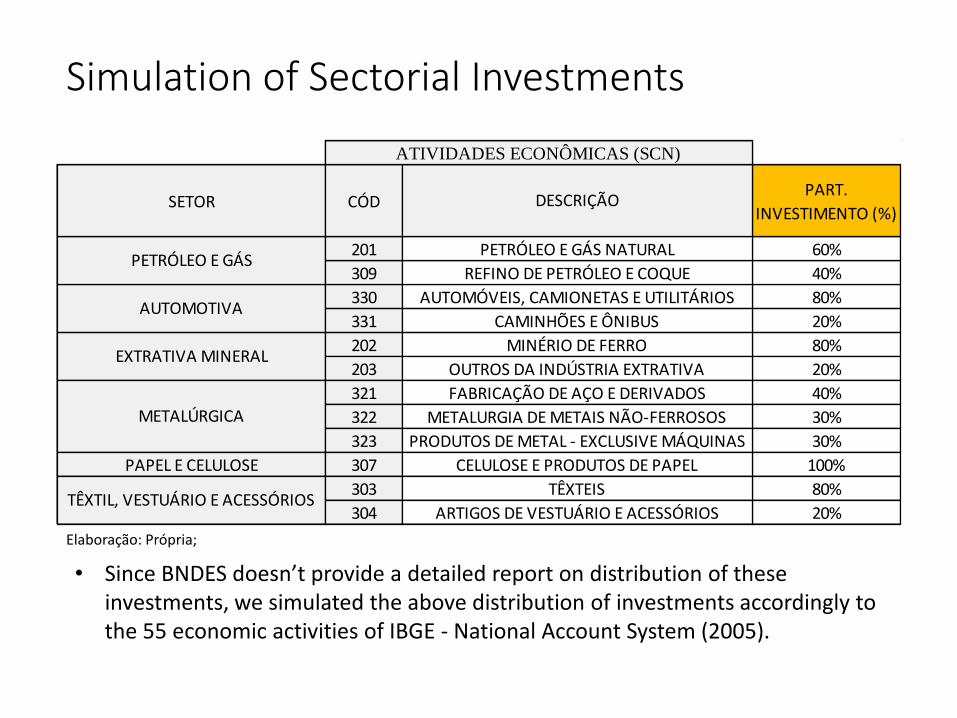
Simulation of Sectorial Investments
Elaboração: Própria;
• Since BNDES doesn’t provide a detailed report on distribution of these investments, we simulated the above distribution of investments accordingly to the 55 economic activities of IBGE - National Account System (2005).
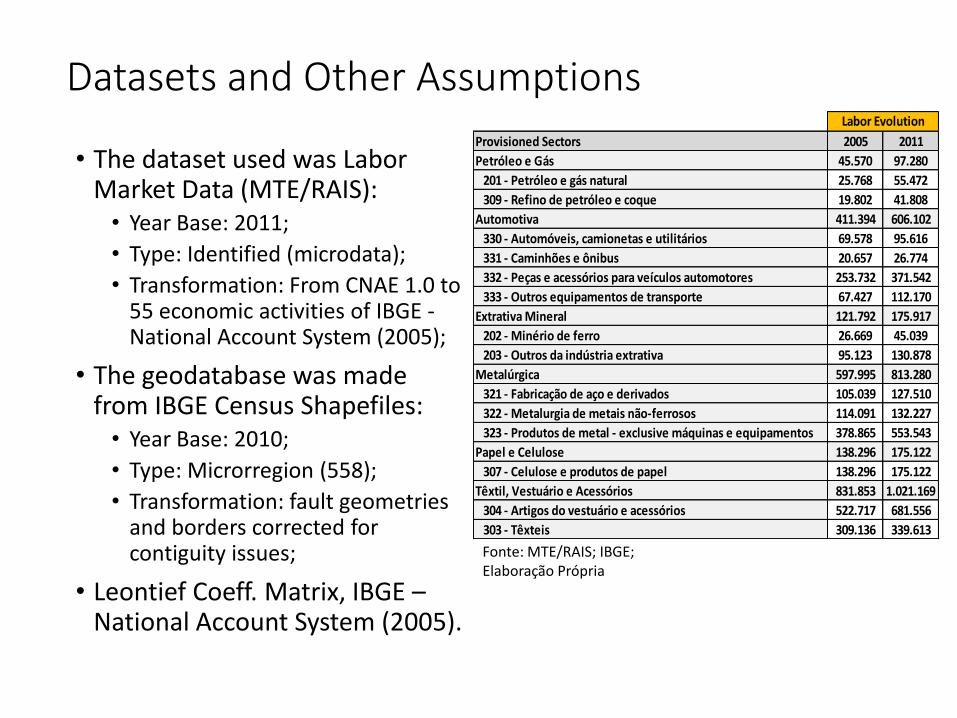
• The dataset used was Labor Market Data (MTE/RAIS): • Year Base: 2011;
• Type: Identified (microdata);
• Transformation: From CNAE 1.0 to 55 economic activities of IBGE - National Account System (2005);
• The geodatabase was made from IBGE Census Shapefiles: • Year Base: 2010;
• Type: Microrregion (558);
• Transformation: fault geometries and borders corrected for contiguity issues;
• Leontief Coeff. Matrix, IBGE – National Account System (2005).
Datasets and Other Assumptions
Provisioned Sectors 2005 2011
Petróleo e Gás 45.570 97.280
201 - Petróleo e gás natural 25.768 55.472
309 - Refino de petróleo e coque 19.802 41.808
Automotiva 411.394 606.102
330 - Automóveis, camionetas e utilitários 69.578 95.616
331 - Caminhões e ônibus 20.657 26.774
332 - Peças e acessórios para veículos automotores 253.732 371.542
333 - Outros equipamentos de transporte 67.427 112.170
Extrativa Mineral 121.792 175.917
202 - Minério de ferro 26.669 45.039
203 - Outros da indústria extrativa 95.123 130.878
Metalúrgica 597.995 813.280
321 - Fabricação de aço e derivados 105.039 127.510
322 - Metalurgia de metais não-ferrosos 114.091 132.227
323 - Produtos de metal - exclusive máquinas e equipamentos 378.865 553.543
Papel e Celulose 138.296 175.122
307 - Celulose e produtos de papel 138.296 175.122
Têxtil, Vestuário e Acessórios 831.853 1.021.169
304 - Artigos do vestuário e acessórios 522.717 681.556
303 - Têxteis 309.136 339.613
Labor Evolution
Fonte: MTE/RAIS; IBGE; Elaboração Própria

National Analysis of Chain Effects
National Expected Effects – Metodology The Leontief Input-Output
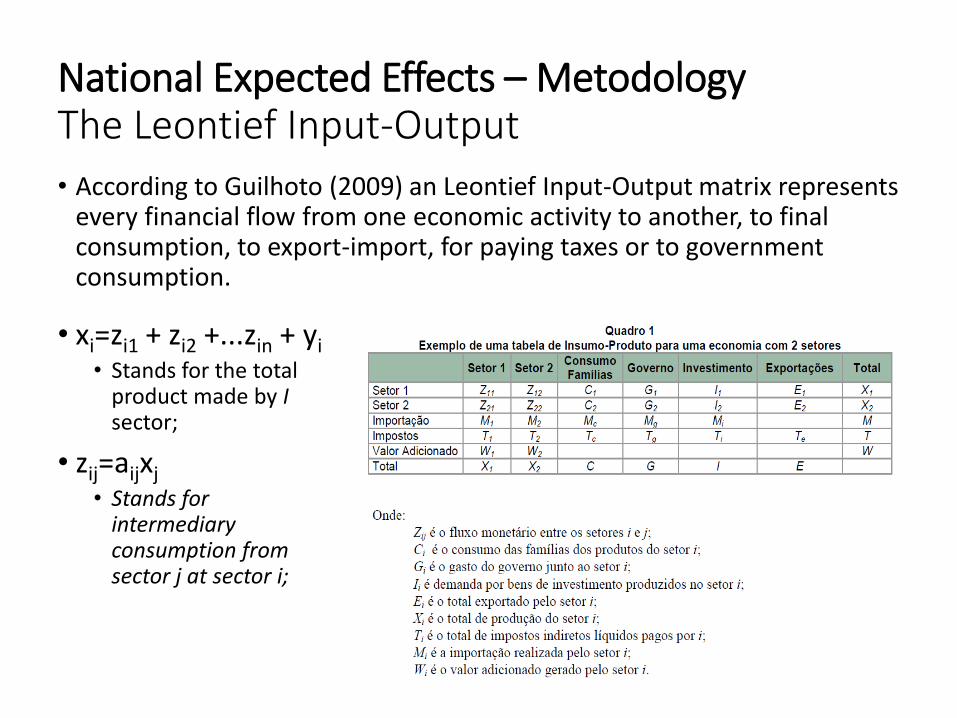
• According to Guilhoto (2009) an Leontief Input-Output matrix represents every financial flow from one economic activity to another, to final consumption, to export-import, for paying taxes or to government consumption.
• xi=zi1 + zi2 +...zin + yi • Stands for the total
product made by I sector;
• zij=aijxj • Stands for
intermediary consumption from sector j at sector i;
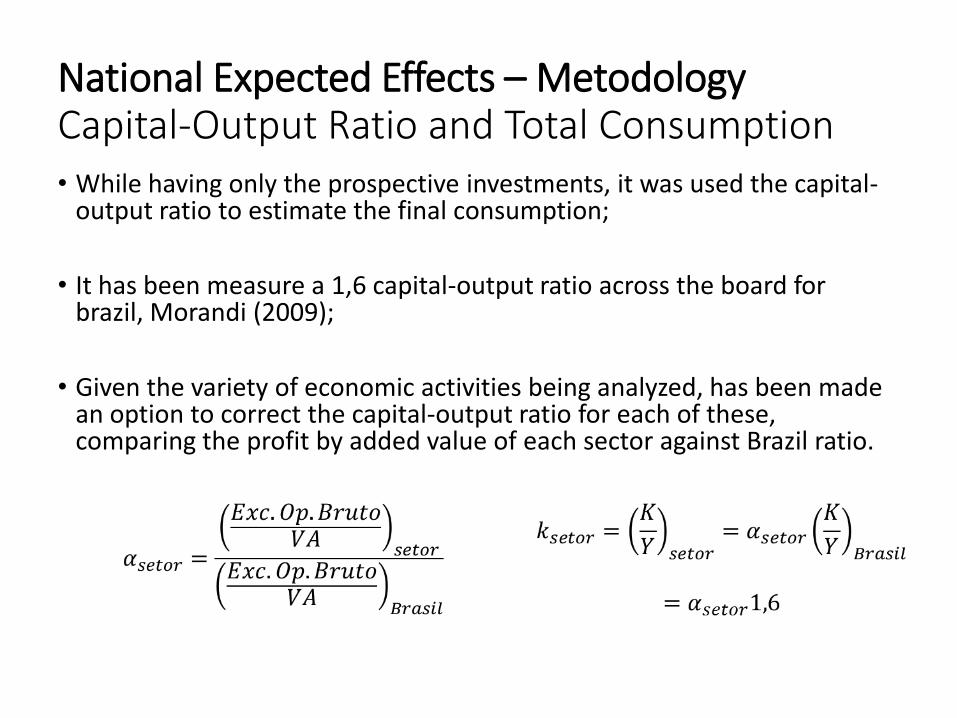
National Expected Effects – Metodology Capital-Output Ratio and Total Consumption • While having only the prospective investments, it was used the capital-
output ratio to estimate the final consumption;
• It has been measure a 1,6 capital-output ratio across the board for brazil, Morandi (2009);
• Given the variety of economic activities being analyzed, has been made an option to correct the capital-output ratio for each of these, comparing the profit by added value of each sector against Brazil ratio.
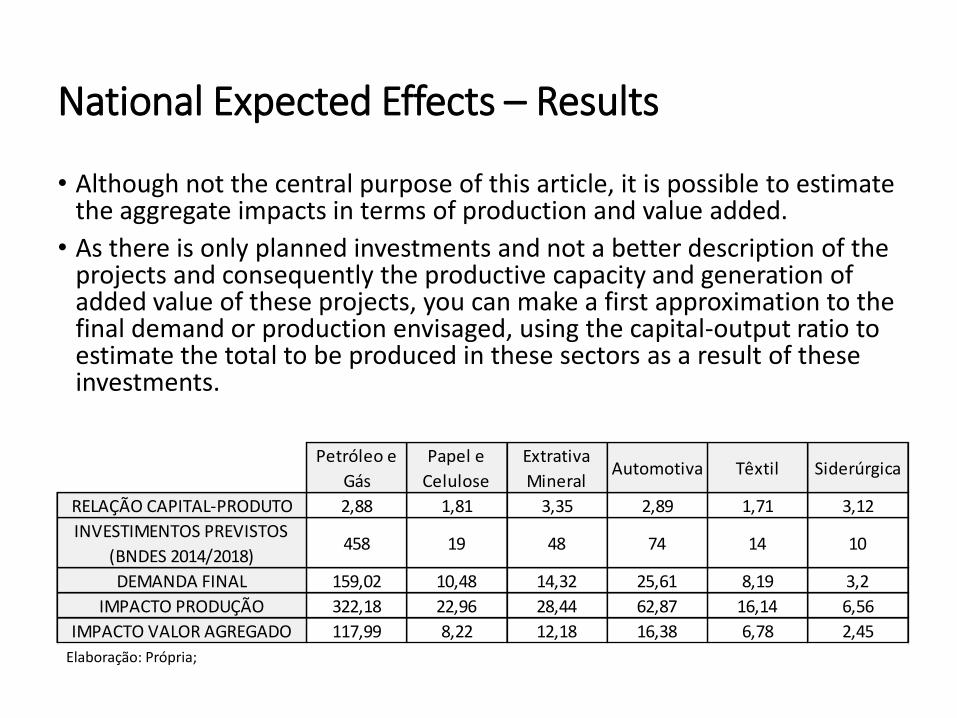
• Although not the central purpose of this article, it is possible to estimate the aggregate impacts in terms of production and value added.
• As there is only planned investments and not a better description of the projects and consequently the productive capacity and generation of added value of these projects, you can make a first approximation to the final demand or production envisaged, using the capital-output ratio to estimate the total to be produced in these sectors as a result of these investments.
Petróleo e
Gás
Papel e
Celulose
Extrativa
MineralAutomotiva Têxtil Siderúrgica
RELAÇÃO CAPITAL-PRODUTO 2,88 1,81 3,35 2,89 1,71 3,12
INVESTIMENTOS PREVISTOS
(BNDES 2014/2018)458 19 48 74 14 10
DEMANDA FINAL 159,02 10,48 14,32 25,61 8,19 3,2
IMPACTO PRODUÇÃO 322,18 22,96 28,44 62,87 16,14 6,56
IMPACTO VALOR AGREGADO 117,99 8,22 12,18 16,38 6,78 2,45
Elaboração: Própria;
National Expected Effects – Results
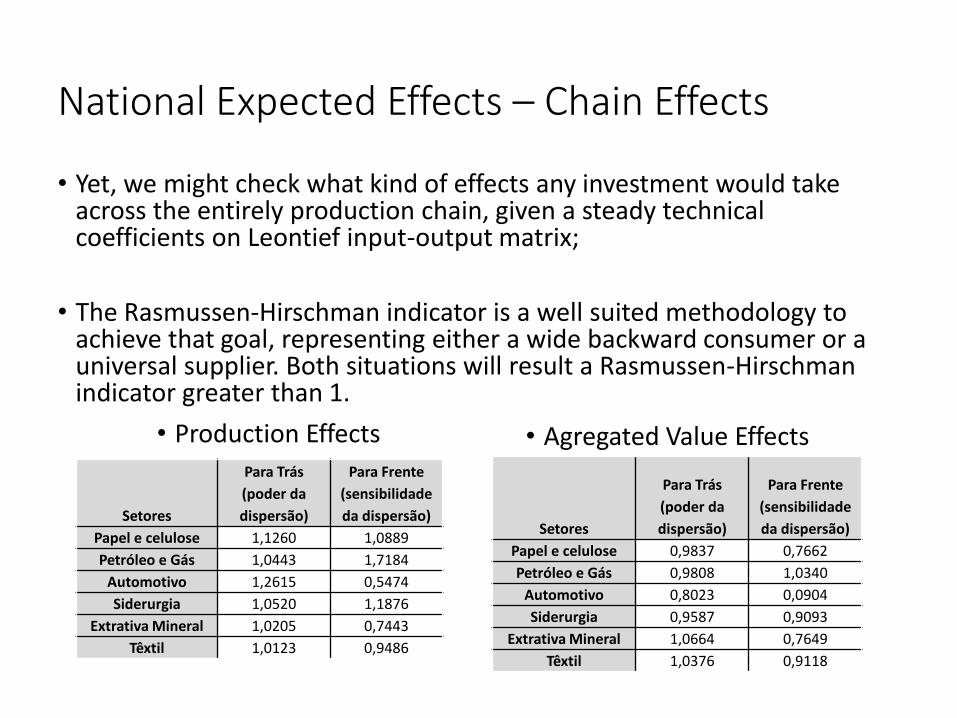
• Yet, we might check what kind of effects any investment would take across the entirely production chain, given a steady technical coefficients on Leontief input-output matrix;
• The Rasmussen-Hirschman indicator is a well suited methodology to achieve that goal, representing either a wide backward consumer or a universal supplier. Both situations will result a Rasmussen-Hirschman indicator greater than 1.
National Expected Effects – Chain Effects
• Production Effects
Setores
Para Trás
(poder da
dispersão)
Para Frente
(sensibilidade
da dispersão)
Papel e celulose 1,1260 1,0889
Petróleo e Gás 1,0443 1,7184
Automotivo 1,2615 0,5474
Siderurgia 1,0520 1,1876
Extrativa Mineral 1,0205 0,7443
Têxtil 1,0123 0,9486
• Agregated Value Effects
Setores
Para Trás
(poder da
dispersão)
Para Frente
(sensibilidade
da dispersão)
Papel e celulose 0,9837 0,7662
Petróleo e Gás 0,9808 1,0340
Automotivo 0,8023 0,0904
Siderurgia 0,9587 0,9093
Extrativa Mineral 1,0664 0,7649
Têxtil 1,0376 0,9118
Sectorial and Geographical Distribution
Employment structure, economic activity and backward and forward chain effects
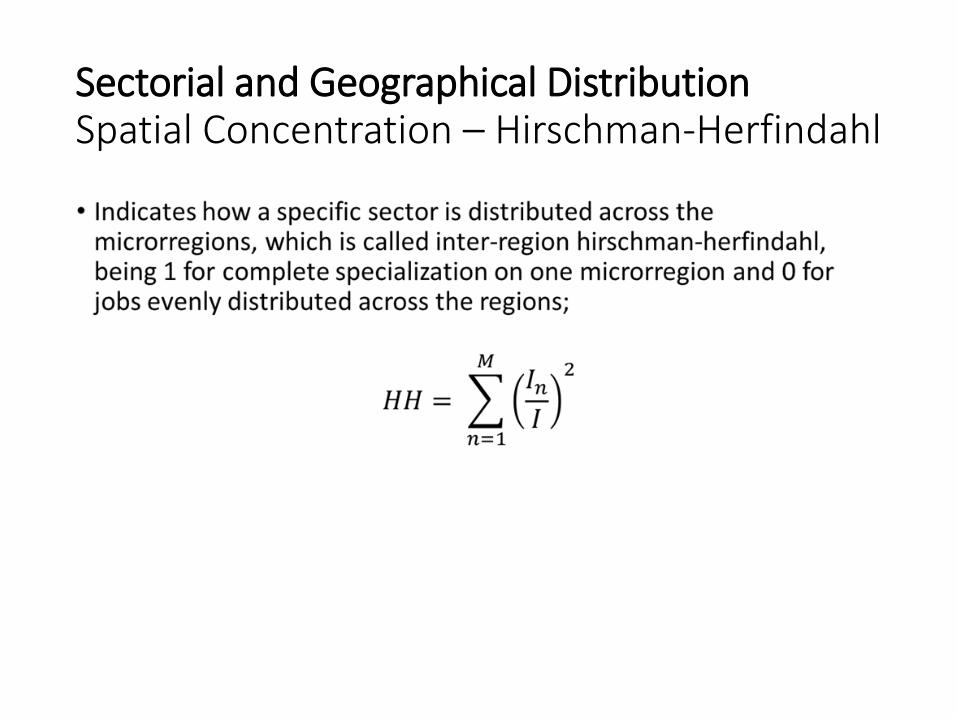
Sectorial and Geographical Distribution Spatial Concentration – Hirschman-Herfindahl
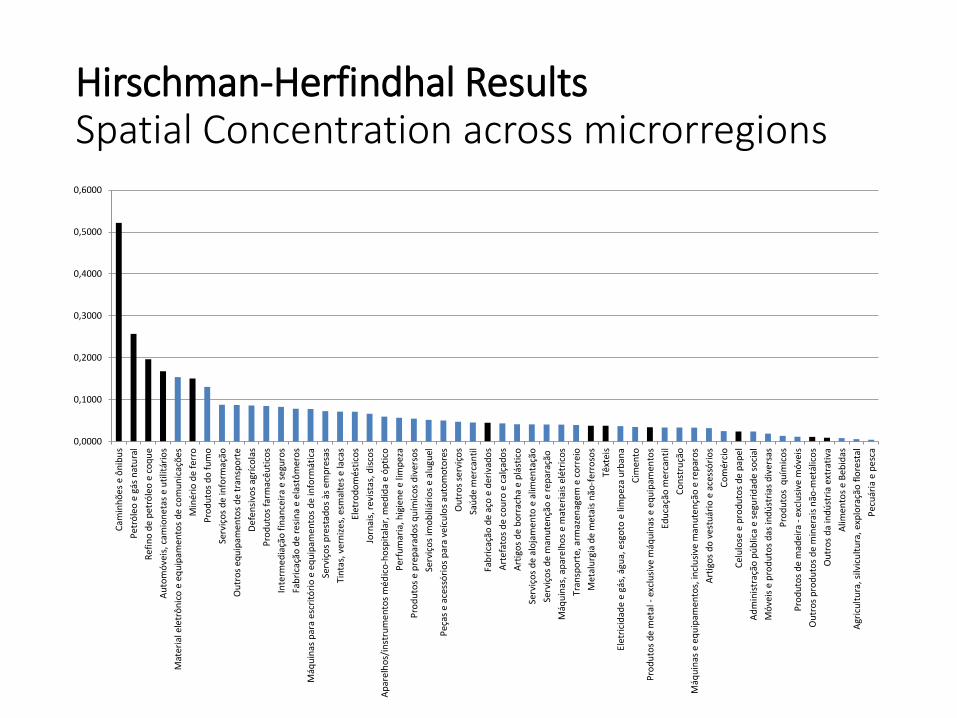
Hirschman-Herfindhal Results Spatial Concentration across microrregions
0,0000
0,1000
0,2000
0,3000
0,4000
0,5000
0,6000
Cam
inh
õe
s e
ôn
ibu
s
Pet
róle
o e
gás
nat
ura
l
Re
fin
o d
e p
etró
leo
e c
oq
ue
Au
tom
óve
is, c
amio
ne
tas
e u
tilit
ário
s
Mat
eria
l ele
trô
nic
o e
eq
uip
amen
tos
de
com
un
icaç
ões
Min
ério
de
ferr
o
Pro
du
tos
do
fu
mo
Serv
iço
s d
e in
form
ação
Ou
tro
s eq
uip
amen
tos
de
tran
spo
rte
Def
en
sivo
s ag
ríco
las
Pro
du
tos
farm
acêu
tico
s
Inte
rme
dia
ção
fin
ance
ira
e s
egu
ros
Fab
rica
ção
de
resi
na
e e
last
ôm
ero
s
Máq
uin
as p
ara
escr
itó
rio
e e
qu
ipam
ento
s d
e in
form
átic
a
Serv
iço
s p
rest
ado
s às
em
pre
sas
Tin
tas,
ver
niz
es,
esm
alte
s e
laca
s
Elet
rod
om
ésti
cos
Jorn
ais,
rev
ista
s, d
isco
s
Ap
arel
ho
s/in
stru
me
nto
s m
édic
o-h
osp
ital
ar, m
ed
ida
e ó
pti
co
Per
fum
aria
, hig
ien
e e
limp
eza
Pro
du
tos
e p
rep
arad
os
qu
ímic
os
div
erso
s
Serv
iço
s im
ob
iliár
ios
e al
ugu
el
Peç
as e
ace
ssó
rio
s p
ara
veíc
ulo
s au
tom
oto
res
Ou
tro
s se
rviç
os
Saú
de
mer
can
til
Fab
rica
ção
de
aço
e d
eriv
ado
s
Art
efa
tos
de
cou
ro e
cal
çad
os
Art
igo
s d
e b
orr
ach
a e
plá
stic
o
Serv
iço
s d
e al
oja
men
to e
alim
enta
ção
Serv
iço
s d
e m
anu
ten
ção
e r
ep
araç
ão
Máq
uin
as, a
par
elh
os
e m
ater
iais
elé
tric
os
Tran
spo
rte,
arm
azen
agem
e c
orr
eio
Met
alu
rgia
de
met
ais
não
-fer
roso
s
Têxt
eis
Elet
rici
dad
e e
gás
, águ
a, e
sgo
to e
lim
pez
a u
rban
a
Cim
ento
Pro
du
tos
de
met
al -
exc
lusi
ve m
áqu
inas
e e
qu
ipam
ento
s
Edu
caçã
o m
erca
nti
l
Co
nst
ruçã
o
Máq
uin
as e
eq
uip
amen
tos,
incl
usi
ve m
anu
ten
ção
e r
epar
os
Art
igo
s d
o v
estu
ário
e a
cess
óri
os
Co
mér
cio
Cel
ulo
se e
pro
du
tos
de
pap
el
Ad
min
istr
ação
pú
blic
a e
segu
rid
ade
soci
al
Mó
veis
e p
rod
uto
s d
as in
dú
stri
as d
iver
sas
Pro
du
tos
qu
ímic
os
Pro
du
tos
de
mad
eira
- e
xclu
sive
mó
veis
Ou
tro
s p
rod
uto
s d
e m
iner
ais
não
-met
álic
os
Ou
tro
s d
a in
dú
stri
a ex
trat
iva
Alim
ento
s e
Beb
idas
Agr
icu
ltu
ra, s
ilvic
ult
ura
, exp
lora
ção
flo
rest
al
Pec
uár
ia e
pe
sca
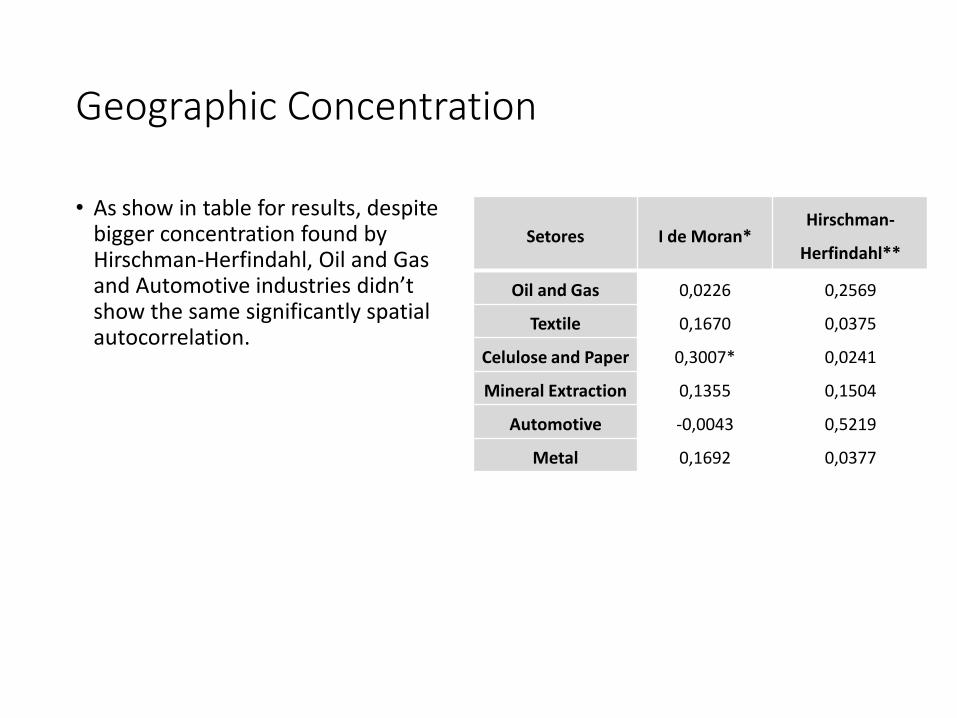
Geographic Concentration
• As show in table for results, despite bigger concentration found by Hirschman-Herfindahl, Oil and Gas and Automotive industries didn’t show the same significantly spatial autocorrelation.
Setores I de Moran* Hirschman-
Herfindahl**
Oil and Gas 0,0226 0,2569
Textile 0,1670 0,0375
Celulose and Paper 0,3007* 0,0241
Mineral Extraction 0,1355 0,1504
Automotive -0,0043 0,5219
Metal 0,1692 0,0377
Chain Effects Identification
• To identify the expected chain effects of a given investment, final consumption of under investment activities was normalized to 100 monetary units;
• The given value would be the Leontief Inverse multiplying those investments;
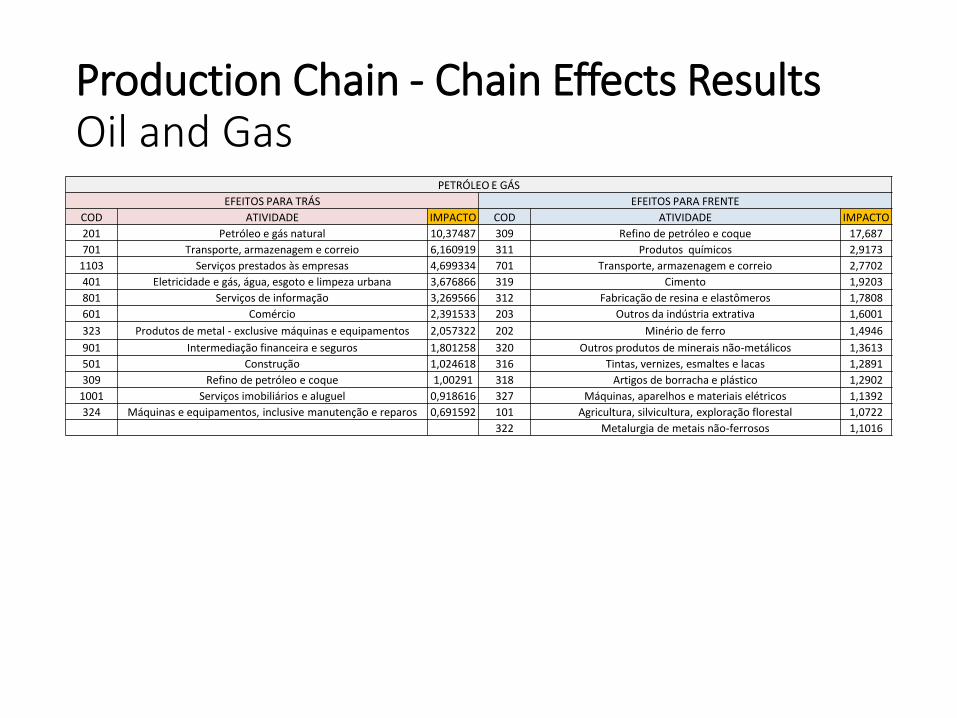
Production Chain - Chain Effects Results Oil and Gas
PETRÓLEO E GÁS
EFEITOS PARA TRÁS EFEITOS PARA FRENTE
COD ATIVIDADE IMPACTO COD ATIVIDADE IMPACTO
201 Petróleo e gás natural 10,37487 309 Refino de petróleo e coque 17,687
701 Transporte, armazenagem e correio 6,160919 311 Produtos químicos 2,9173
1103 Serviços prestados às empresas 4,699334 701 Transporte, armazenagem e correio 2,7702
401 Eletricidade e gás, água, esgoto e limpeza urbana 3,676866 319 Cimento 1,9203
801 Serviços de informação 3,269566 312 Fabricação de resina e elastômeros 1,7808
601 Comércio 2,391533 203 Outros da indústria extrativa 1,6001
323 Produtos de metal - exclusive máquinas e equipamentos 2,057322 202 Minério de ferro 1,4946
901 Intermediação financeira e seguros 1,801258 320 Outros produtos de minerais não-metálicos 1,3613
501 Construção 1,024618 316 Tintas, vernizes, esmaltes e lacas 1,2891
309 Refino de petróleo e coque 1,00291 318 Artigos de borracha e plástico 1,2902
1001 Serviços imobiliários e aluguel 0,918616 327 Máquinas, aparelhos e materiais elétricos 1,1392
324 Máquinas e equipamentos, inclusive manutenção e reparos 0,691592 101 Agricultura, silvicultura, exploração florestal 1,0722
322 Metalurgia de metais não-ferrosos 1,1016
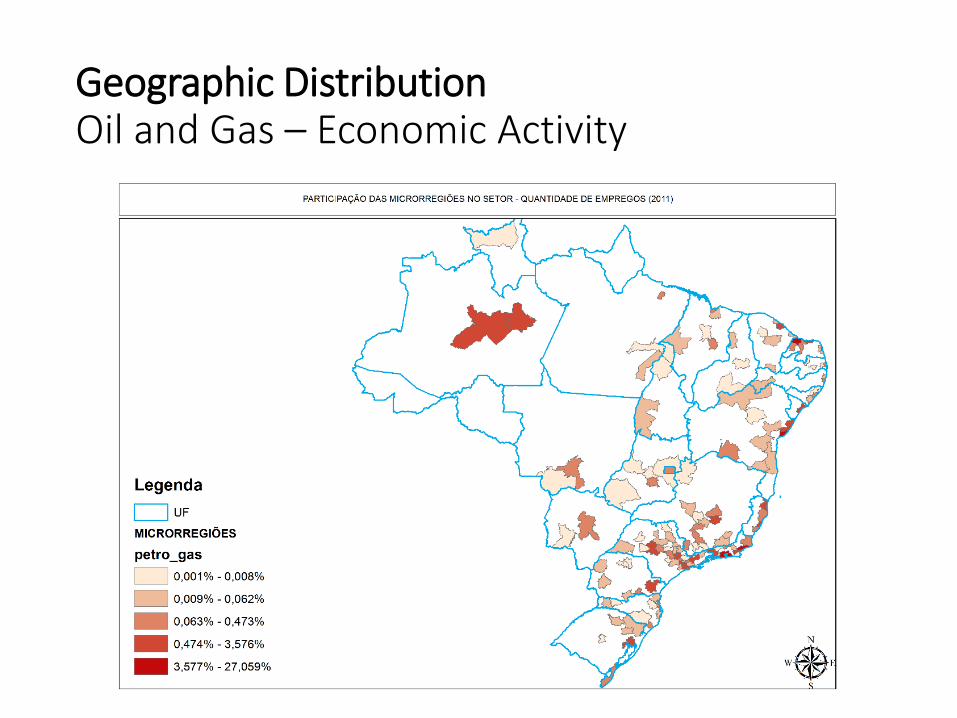
Geographic Distribution Oil and Gas – Economic Activity
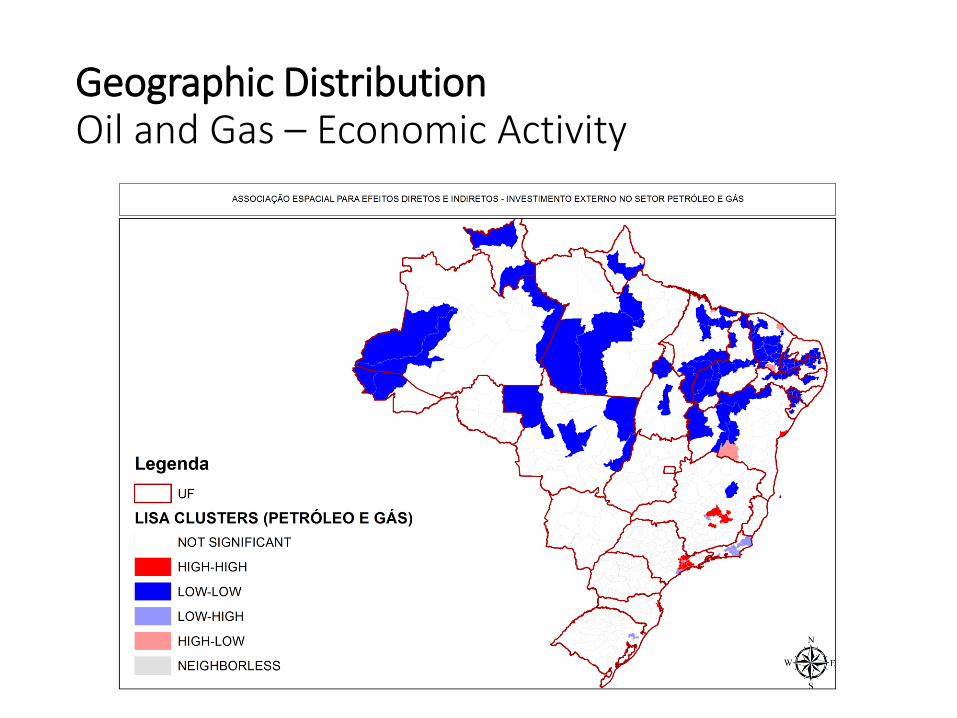
Geographic Distribution Oil and Gas – Economic Activity
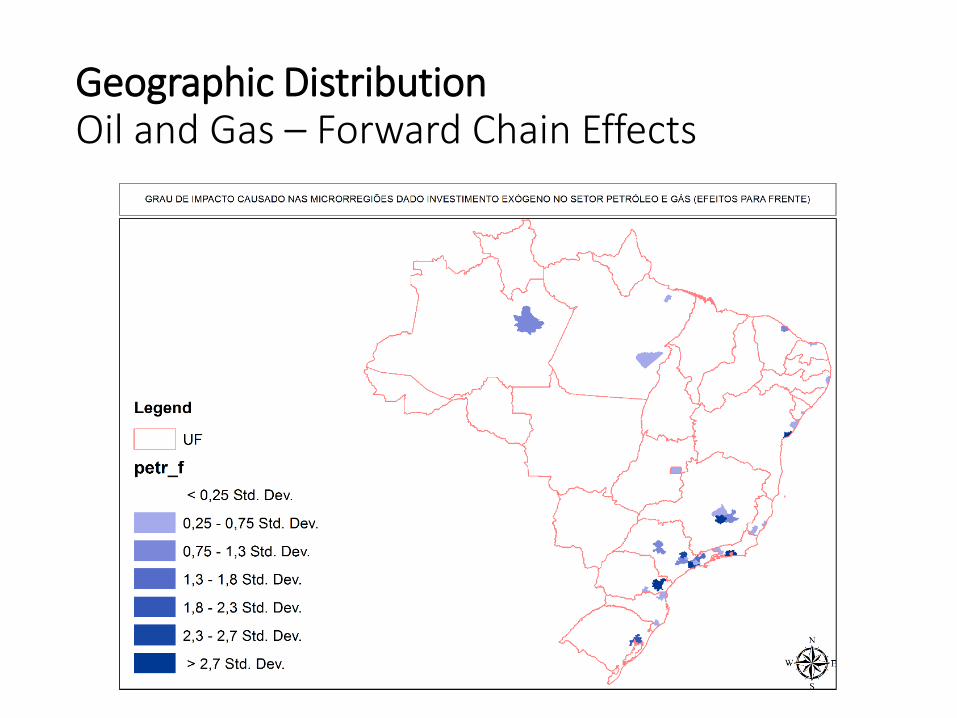
Geographic Distribution Oil and Gas – Forward Chain Effects
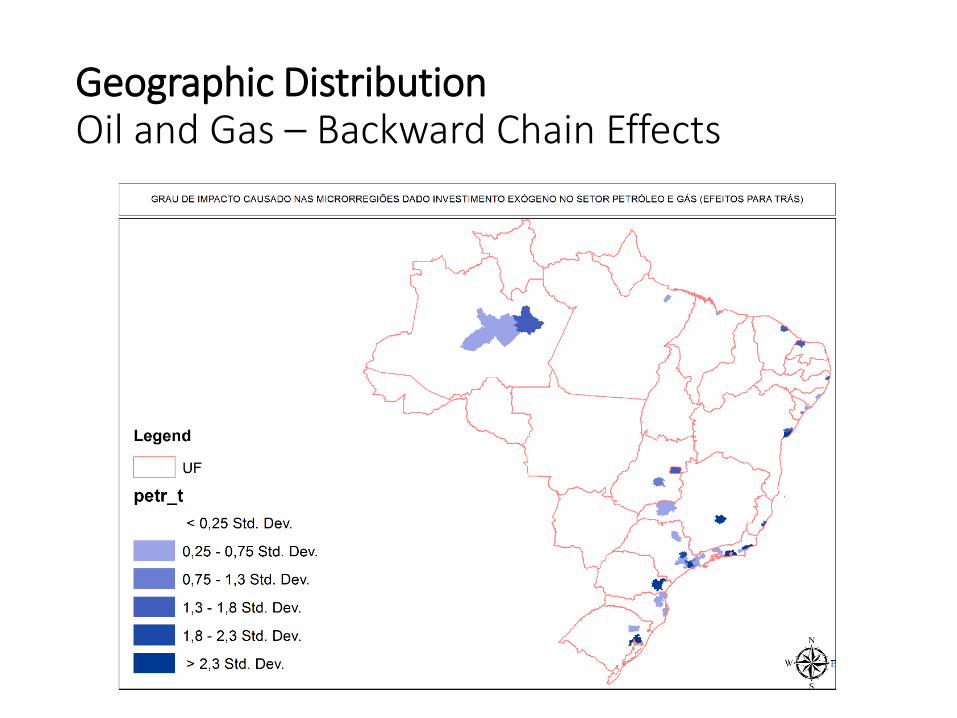
Geographic Distribution Oil and Gas – Backward Chain Effects
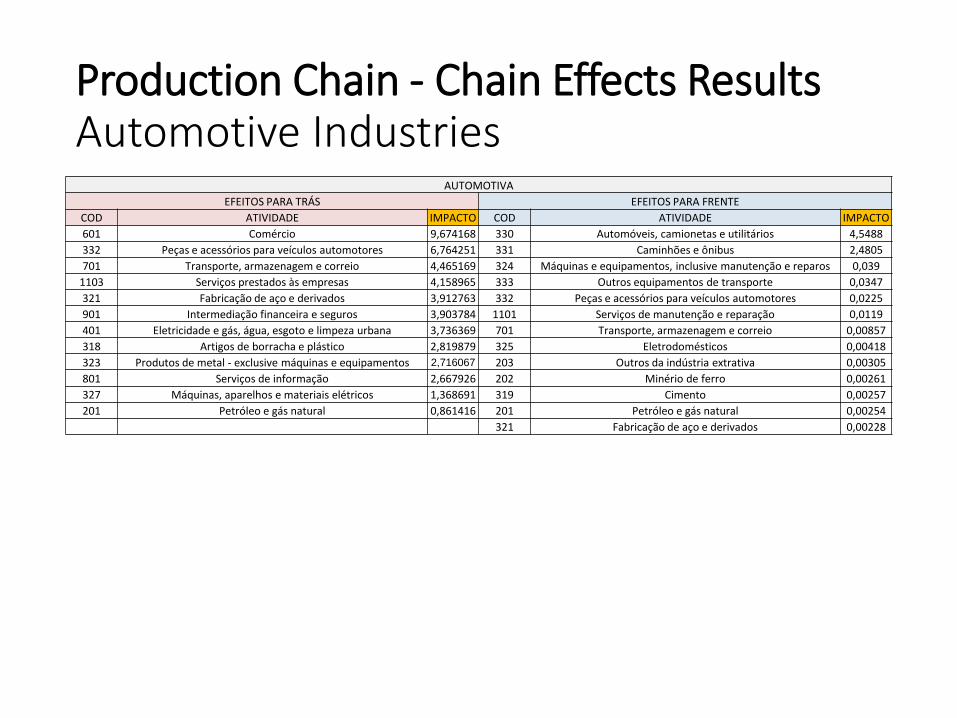
AUTOMOTIVA
EFEITOS PARA TRÁS EFEITOS PARA FRENTE
COD ATIVIDADE IMPACTO COD ATIVIDADE IMPACTO
601 Comércio 9,674168 330 Automóveis, camionetas e utilitários 4,5488
332 Peças e acessórios para veículos automotores 6,764251 331 Caminhões e ônibus 2,4805
701 Transporte, armazenagem e correio 4,465169 324 Máquinas e equipamentos, inclusive manutenção e reparos 0,039
1103 Serviços prestados às empresas 4,158965 333 Outros equipamentos de transporte 0,0347
321 Fabricação de aço e derivados 3,912763 332 Peças e acessórios para veículos automotores 0,0225
901 Intermediação financeira e seguros 3,903784 1101 Serviços de manutenção e reparação 0,0119
401 Eletricidade e gás, água, esgoto e limpeza urbana 3,736369 701 Transporte, armazenagem e correio 0,00857
318 Artigos de borracha e plástico 2,819879 325 Eletrodomésticos 0,00418
323 Produtos de metal - exclusive máquinas e equipamentos 2,716067 203 Outros da indústria extrativa 0,00305
801 Serviços de informação 2,667926 202 Minério de ferro 0,00261
327 Máquinas, aparelhos e materiais elétricos 1,368691 319 Cimento 0,00257
201 Petróleo e gás natural 0,861416 201 Petróleo e gás natural 0,00254
321 Fabricação de aço e derivados 0,00228
Production Chain - Chain Effects Results Automotive Industries
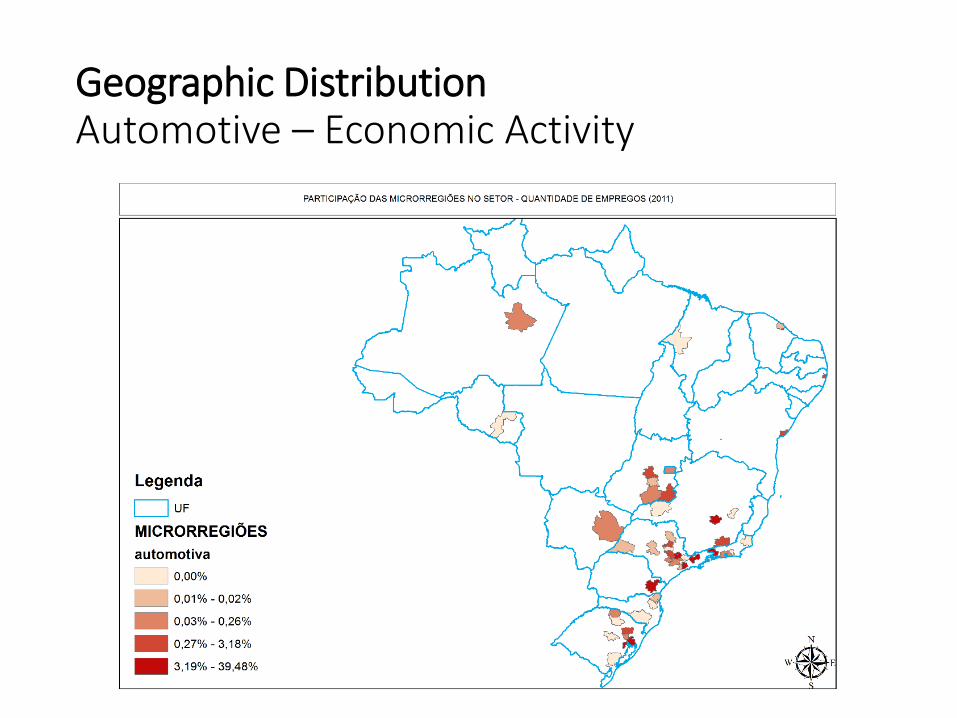
Geographic Distribution Automotive – Economic Activity
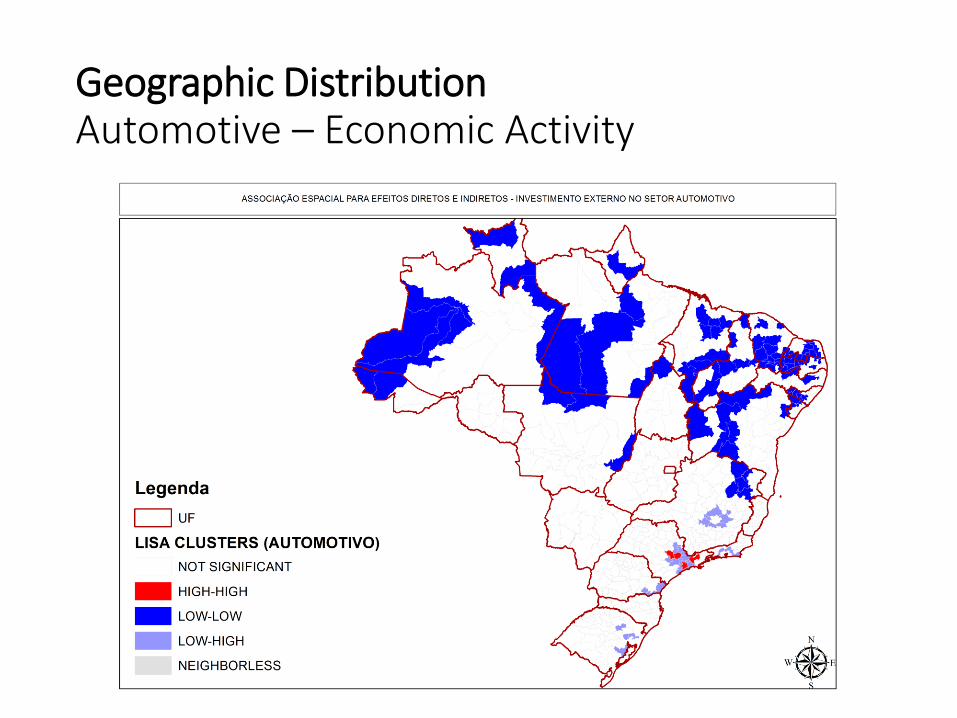
Geographic Distribution Automotive – Economic Activity
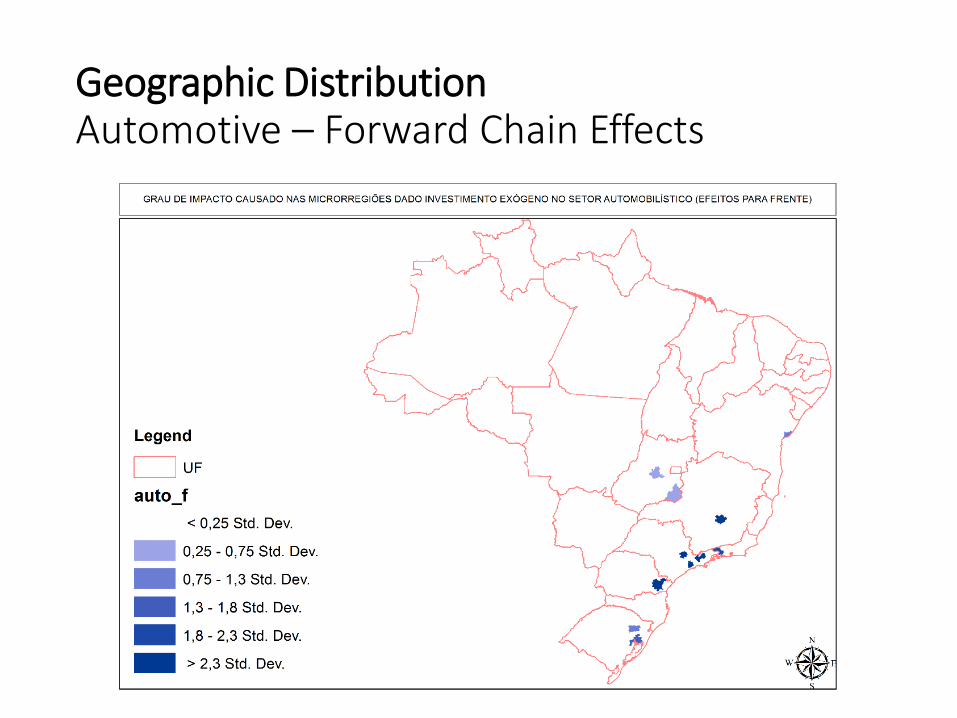
Geographic Distribution Automotive – Forward Chain Effects
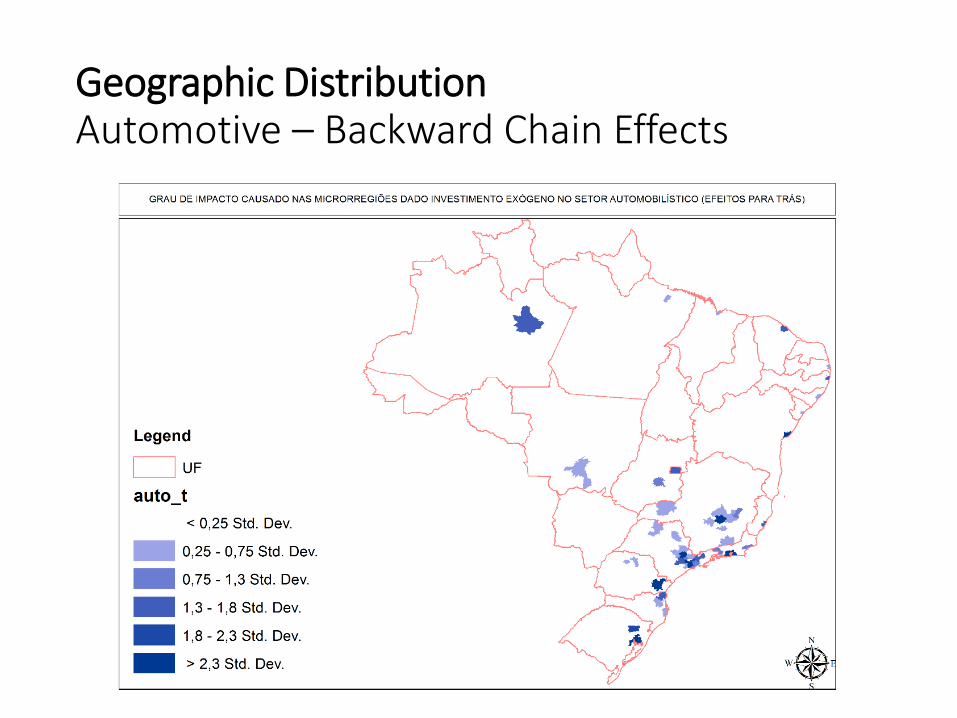
Geographic Distribution Automotive – Backward Chain Effects
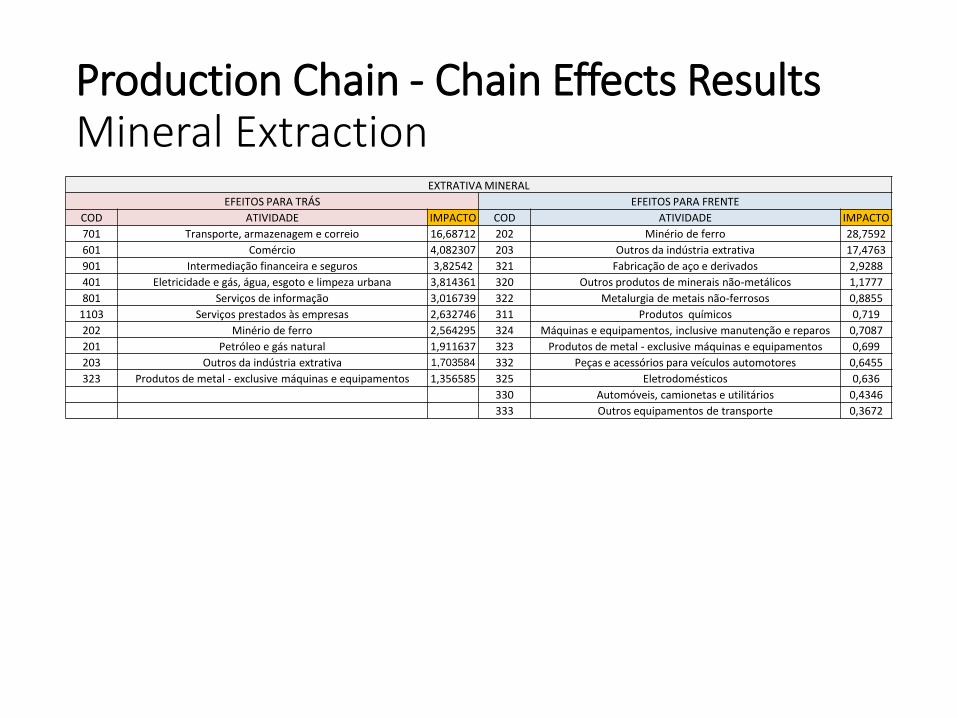
Production Chain - Chain Effects Results Mineral Extraction
EXTRATIVA MINERAL
EFEITOS PARA TRÁS EFEITOS PARA FRENTE
COD ATIVIDADE IMPACTO COD ATIVIDADE IMPACTO
701 Transporte, armazenagem e correio 16,68712 202 Minério de ferro 28,7592
601 Comércio 4,082307 203 Outros da indústria extrativa 17,4763
901 Intermediação financeira e seguros 3,82542 321 Fabricação de aço e derivados 2,9288
401 Eletricidade e gás, água, esgoto e limpeza urbana 3,814361 320 Outros produtos de minerais não-metálicos 1,1777
801 Serviços de informação 3,016739 322 Metalurgia de metais não-ferrosos 0,8855
1103 Serviços prestados às empresas 2,632746 311 Produtos químicos 0,719
202 Minério de ferro 2,564295 324 Máquinas e equipamentos, inclusive manutenção e reparos 0,7087
201 Petróleo e gás natural 1,911637 323 Produtos de metal - exclusive máquinas e equipamentos 0,699
203 Outros da indústria extrativa 1,703584 332 Peças e acessórios para veículos automotores 0,6455
323 Produtos de metal - exclusive máquinas e equipamentos 1,356585 325 Eletrodomésticos 0,636
330 Automóveis, camionetas e utilitários 0,4346
333 Outros equipamentos de transporte 0,3672
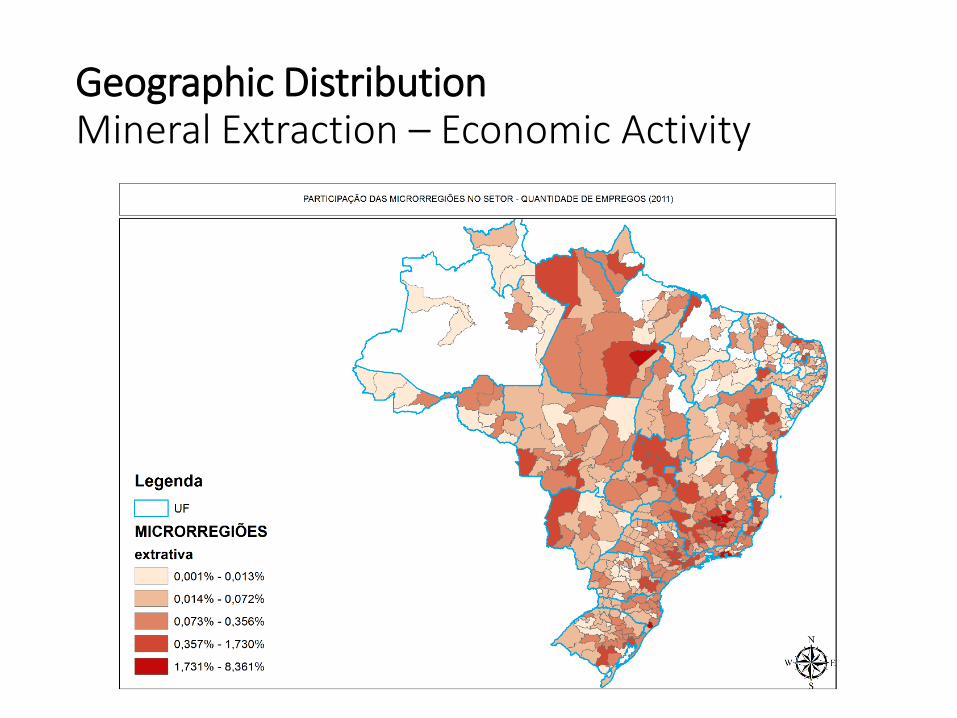
Geographic Distribution Mineral Extraction – Economic Activity
Geographic Distribution Mineral Extraction – Economic Activity
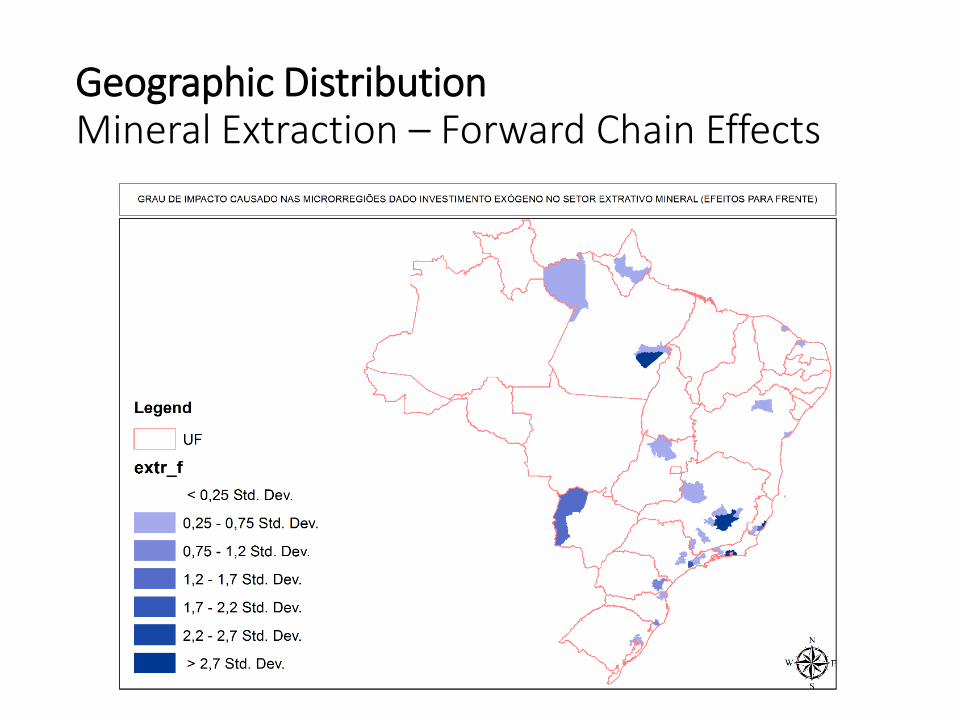
Geographic Distribution Mineral Extraction – Forward Chain Effects
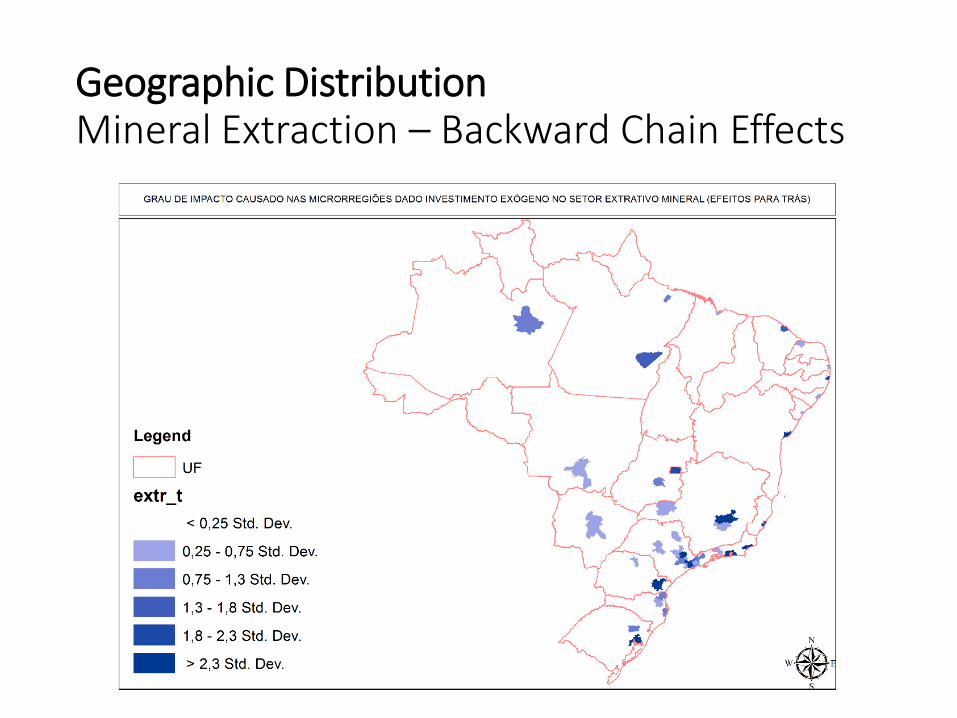
Geographic Distribution Mineral Extraction – Backward Chain Effects
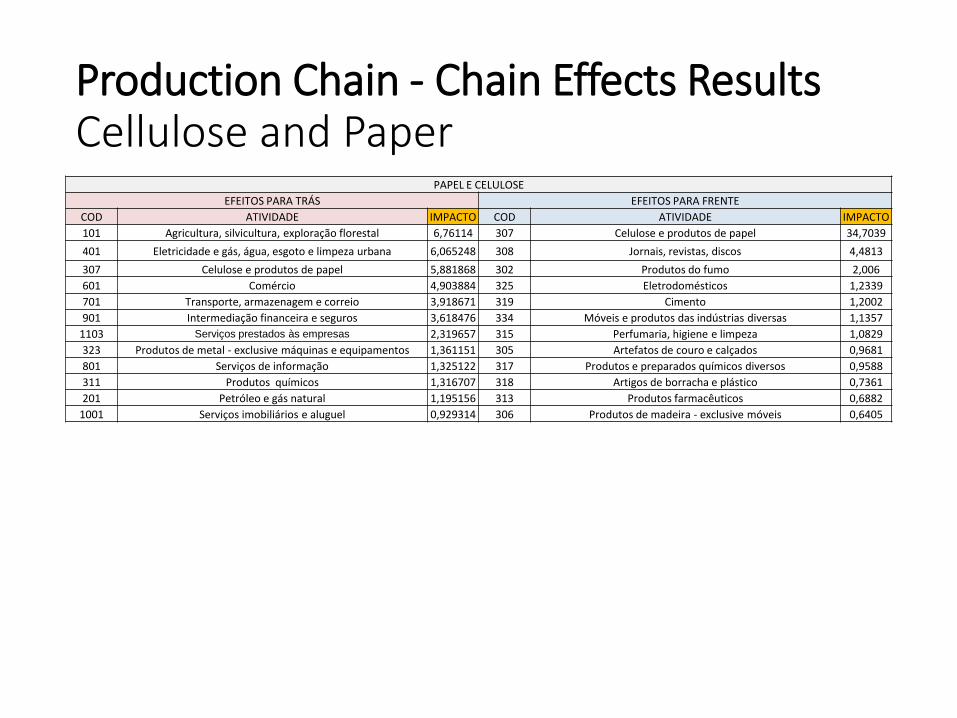
PAPEL E CELULOSE
EFEITOS PARA TRÁS EFEITOS PARA FRENTE
COD ATIVIDADE IMPACTO COD ATIVIDADE IMPACTO
101 Agricultura, silvicultura, exploração florestal 6,76114 307 Celulose e produtos de papel 34,7039
401 Eletricidade e gás, água, esgoto e limpeza urbana 6,065248 308 Jornais, revistas, discos 4,4813
307 Celulose e produtos de papel 5,881868 302 Produtos do fumo 2,006
601 Comércio 4,903884 325 Eletrodomésticos 1,2339
701 Transporte, armazenagem e correio 3,918671 319 Cimento 1,2002
901 Intermediação financeira e seguros 3,618476 334 Móveis e produtos das indústrias diversas 1,1357
1103 Serviços prestados às empresas 2,319657 315 Perfumaria, higiene e limpeza 1,0829
323 Produtos de metal - exclusive máquinas e equipamentos 1,361151 305 Artefatos de couro e calçados 0,9681
801 Serviços de informação 1,325122 317 Produtos e preparados químicos diversos 0,9588
311 Produtos químicos 1,316707 318 Artigos de borracha e plástico 0,7361
201 Petróleo e gás natural 1,195156 313 Produtos farmacêuticos 0,6882
1001 Serviços imobiliários e aluguel 0,929314 306 Produtos de madeira - exclusive móveis 0,6405
Production Chain - Chain Effects Results Cellulose and Paper
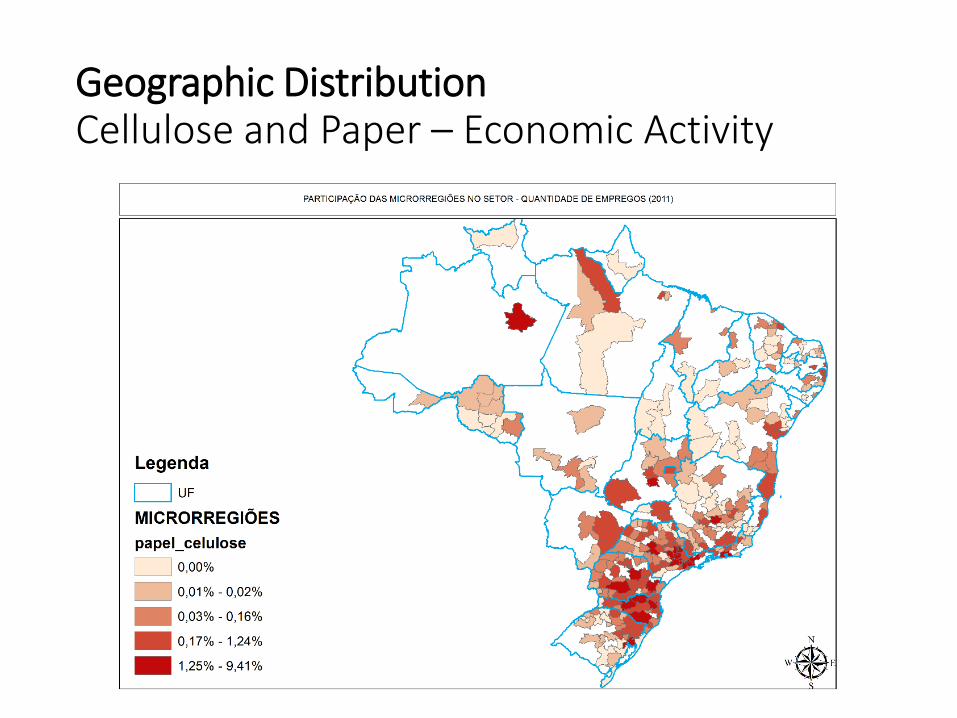
Geographic Distribution Cellulose and Paper – Economic Activity
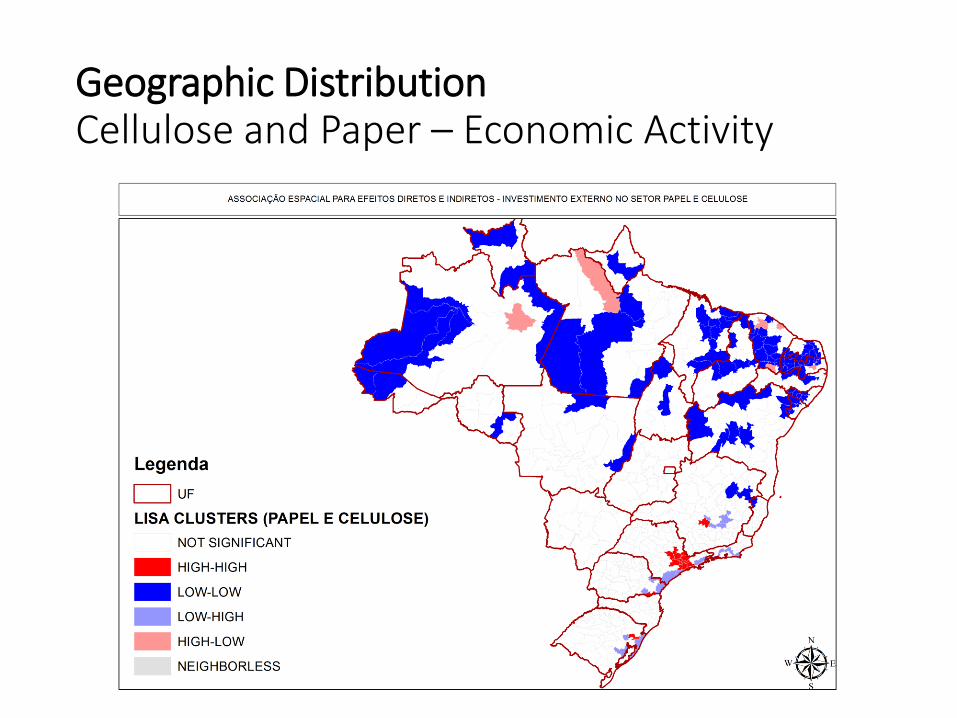
Geographic Distribution Cellulose and Paper – Economic Activity
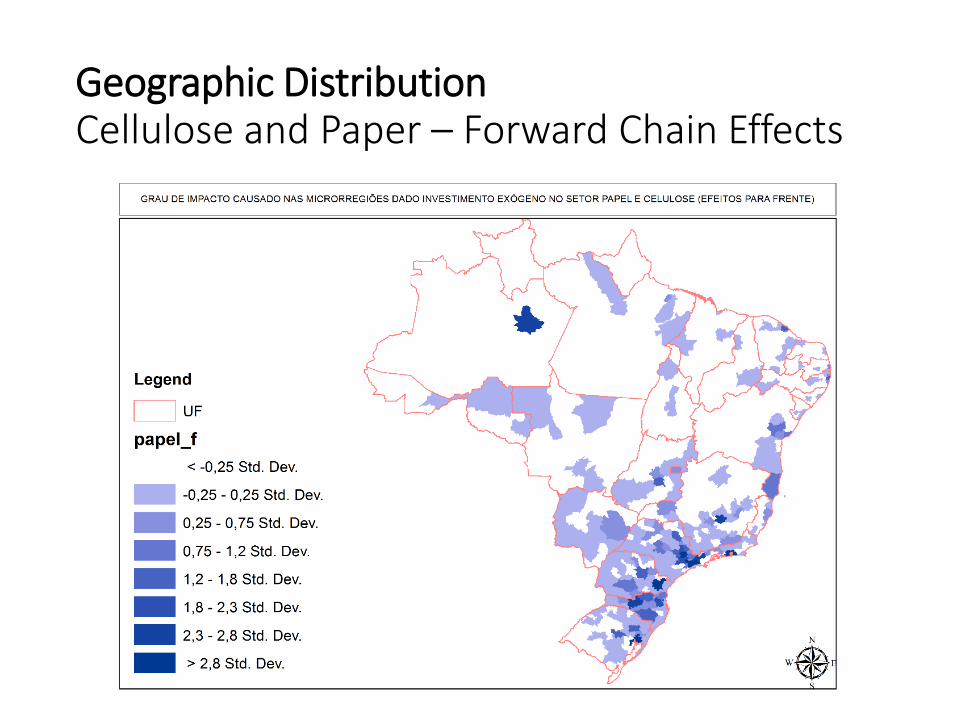
Geographic Distribution Cellulose and Paper – Forward Chain Effects
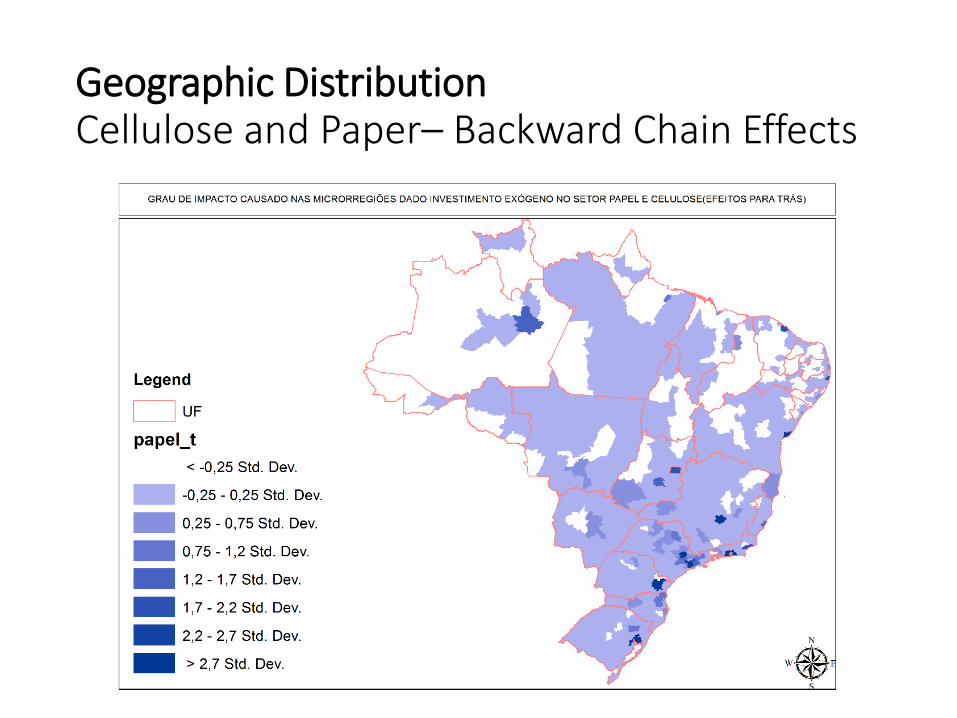
Geographic Distribution Cellulose and Paper– Backward Chain Effects
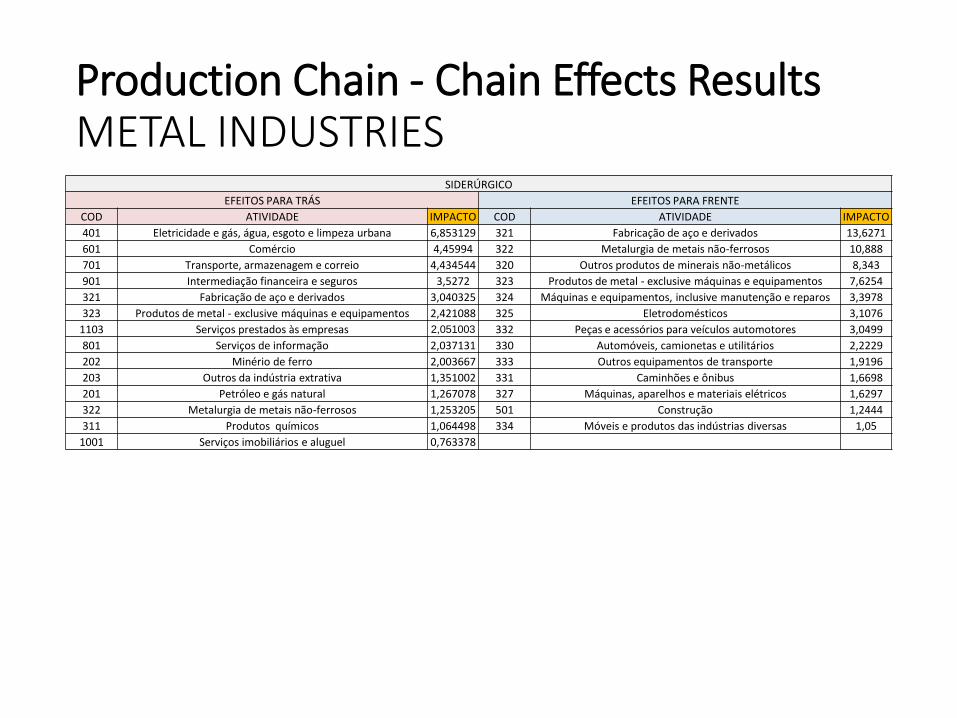
SIDERÚRGICO
EFEITOS PARA TRÁS EFEITOS PARA FRENTE
COD ATIVIDADE IMPACTO COD ATIVIDADE IMPACTO
401 Eletricidade e gás, água, esgoto e limpeza urbana 6,853129 321 Fabricação de aço e derivados 13,6271
601 Comércio 4,45994 322 Metalurgia de metais não-ferrosos 10,888
701 Transporte, armazenagem e correio 4,434544 320 Outros produtos de minerais não-metálicos 8,343
901 Intermediação financeira e seguros 3,5272 323 Produtos de metal - exclusive máquinas e equipamentos 7,6254
321 Fabricação de aço e derivados 3,040325 324 Máquinas e equipamentos, inclusive manutenção e reparos 3,3978
323 Produtos de metal - exclusive máquinas e equipamentos 2,421088 325 Eletrodomésticos 3,1076
1103 Serviços prestados às empresas 2,051003 332 Peças e acessórios para veículos automotores 3,0499
801 Serviços de informação 2,037131 330 Automóveis, camionetas e utilitários 2,2229
202 Minério de ferro 2,003667 333 Outros equipamentos de transporte 1,9196
203 Outros da indústria extrativa 1,351002 331 Caminhões e ônibus 1,6698
201 Petróleo e gás natural 1,267078 327 Máquinas, aparelhos e materiais elétricos 1,6297
322 Metalurgia de metais não-ferrosos 1,253205 501 Construção 1,2444
311 Produtos químicos 1,064498 334 Móveis e produtos das indústrias diversas 1,05
1001 Serviços imobiliários e aluguel 0,763378
Production Chain - Chain Effects Results METAL INDUSTRIES
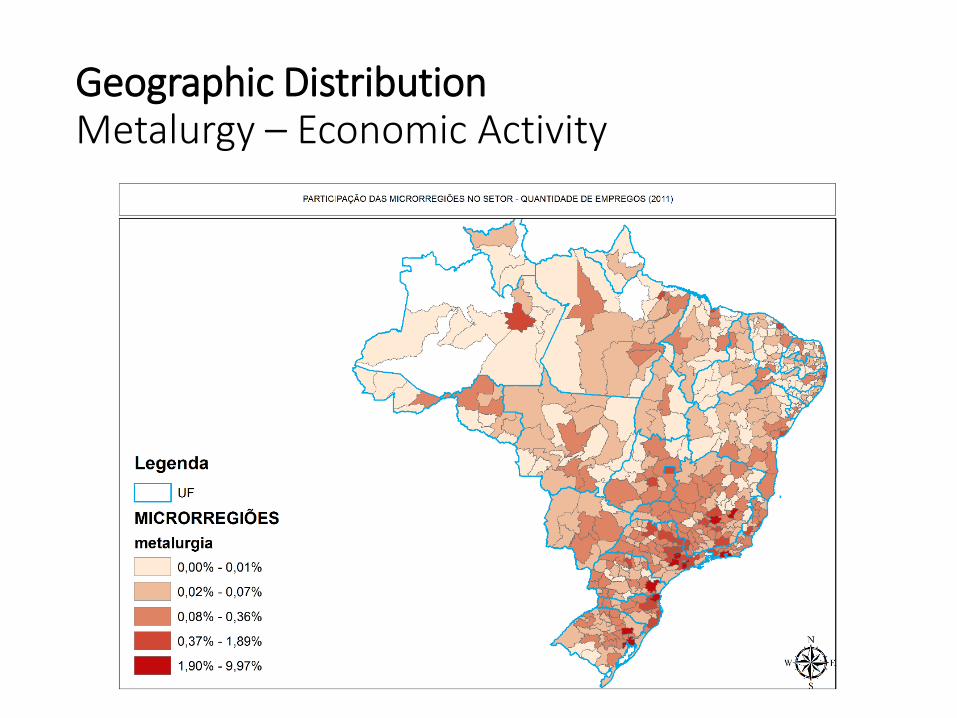
Geographic Distribution Metalurgy – Economic Activity
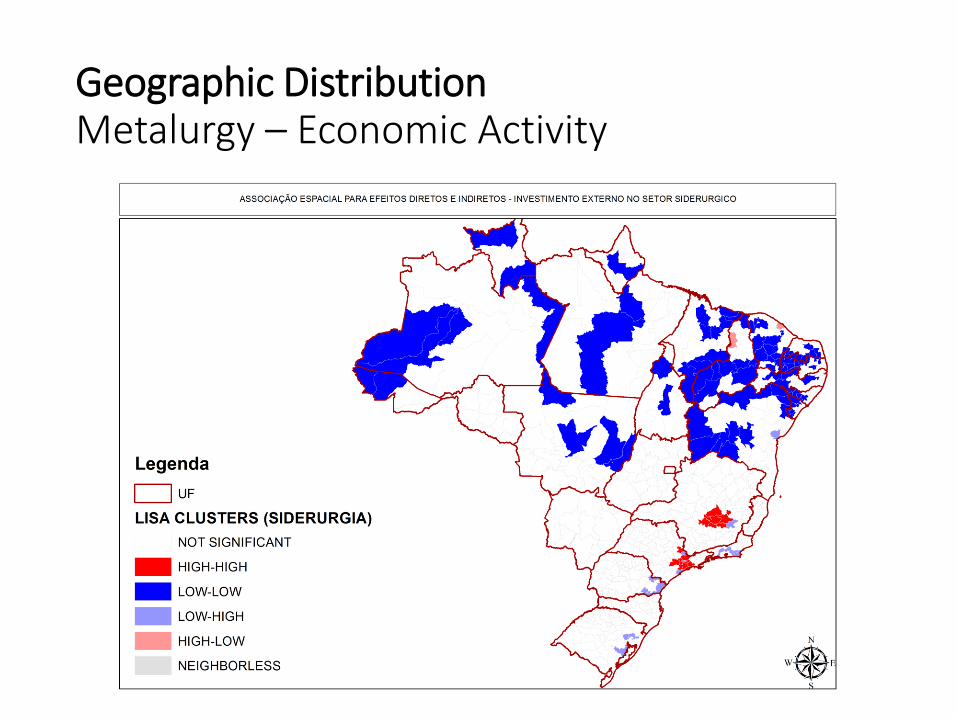
Geographic Distribution Metalurgy – Economic Activity
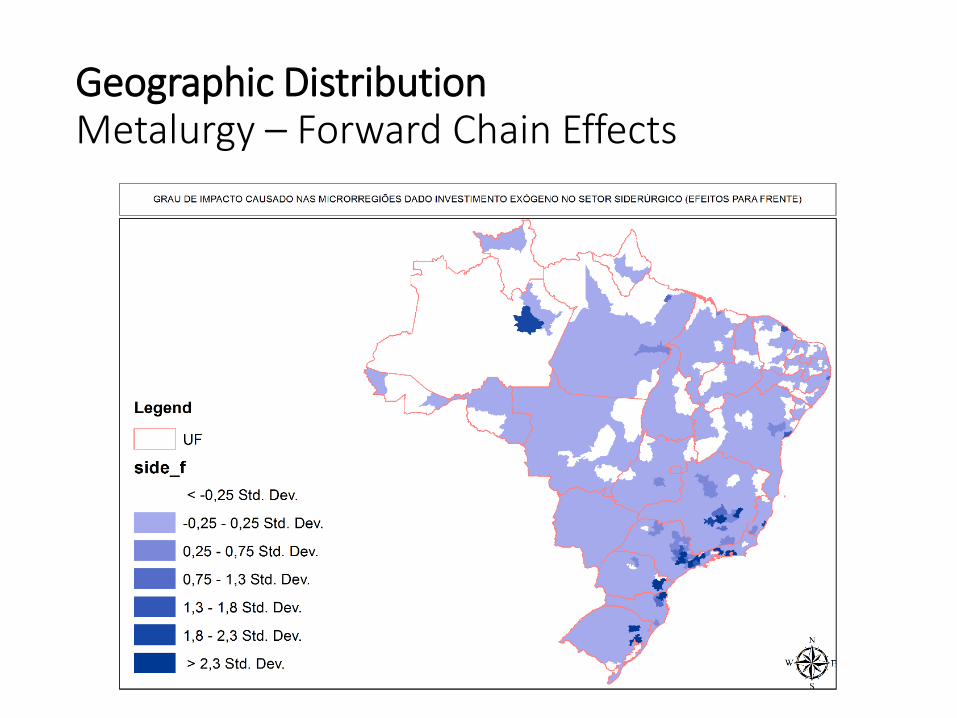
Geographic Distribution Metalurgy – Forward Chain Effects
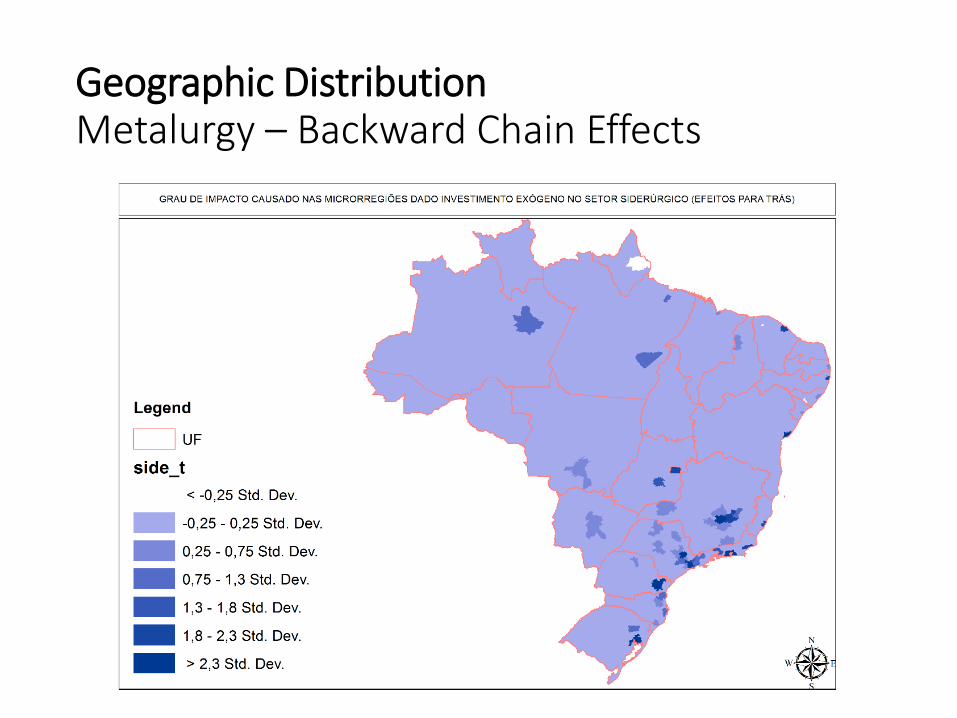
Geographic Distribution Metalurgy – Backward Chain Effects
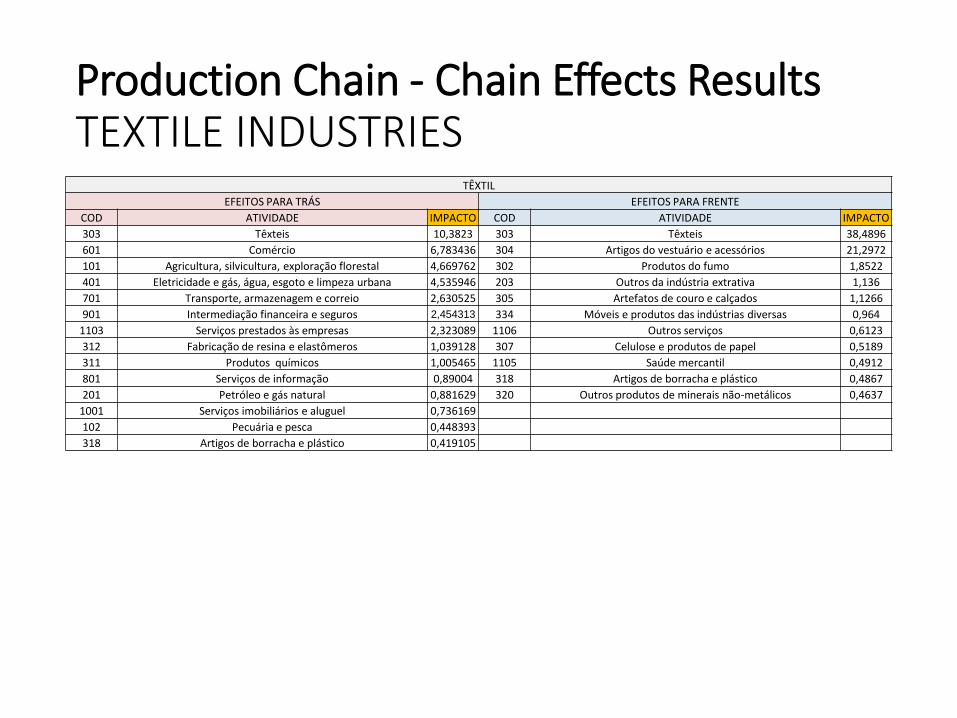
TÊXTIL
EFEITOS PARA TRÁS EFEITOS PARA FRENTE
COD ATIVIDADE IMPACTO COD ATIVIDADE IMPACTO
303 Têxteis 10,3823 303 Têxteis 38,4896
601 Comércio 6,783436 304 Artigos do vestuário e acessórios 21,2972
101 Agricultura, silvicultura, exploração florestal 4,669762 302 Produtos do fumo 1,8522
401 Eletricidade e gás, água, esgoto e limpeza urbana 4,535946 203 Outros da indústria extrativa 1,136
701 Transporte, armazenagem e correio 2,630525 305 Artefatos de couro e calçados 1,1266
901 Intermediação financeira e seguros 2,454313 334 Móveis e produtos das indústrias diversas 0,964
1103 Serviços prestados às empresas 2,323089 1106 Outros serviços 0,6123
312 Fabricação de resina e elastômeros 1,039128 307 Celulose e produtos de papel 0,5189
311 Produtos químicos 1,005465 1105 Saúde mercantil 0,4912
801 Serviços de informação 0,89004 318 Artigos de borracha e plástico 0,4867
201 Petróleo e gás natural 0,881629 320 Outros produtos de minerais não-metálicos 0,4637
1001 Serviços imobiliários e aluguel 0,736169
102 Pecuária e pesca 0,448393
318 Artigos de borracha e plástico 0,419105
Production Chain - Chain Effects Results TEXTILE INDUSTRIES
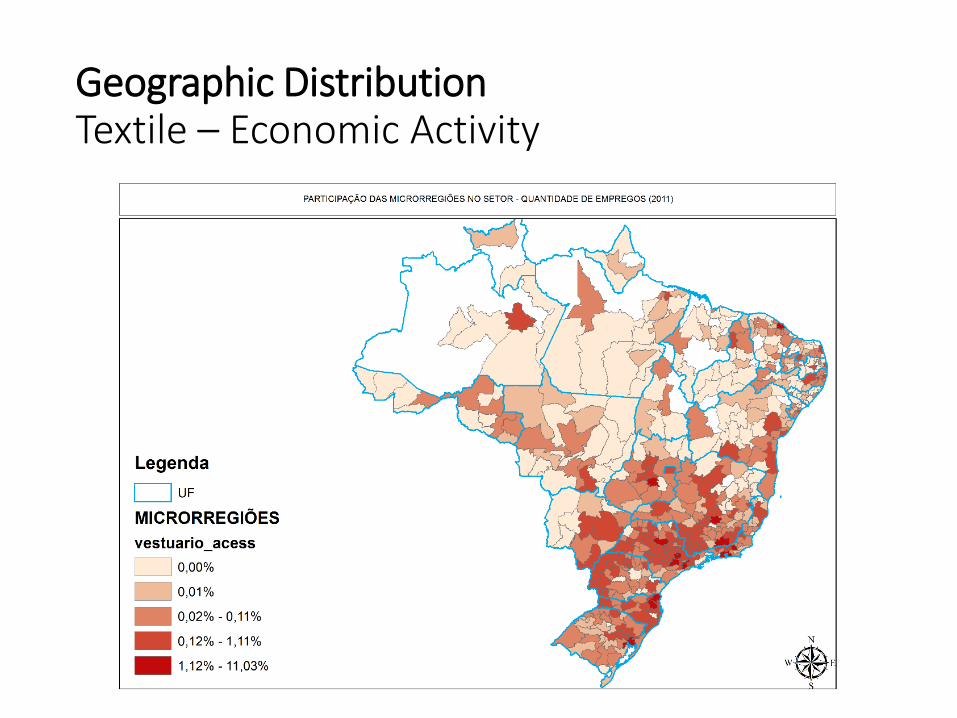
Geographic Distribution Textile – Economic Activity
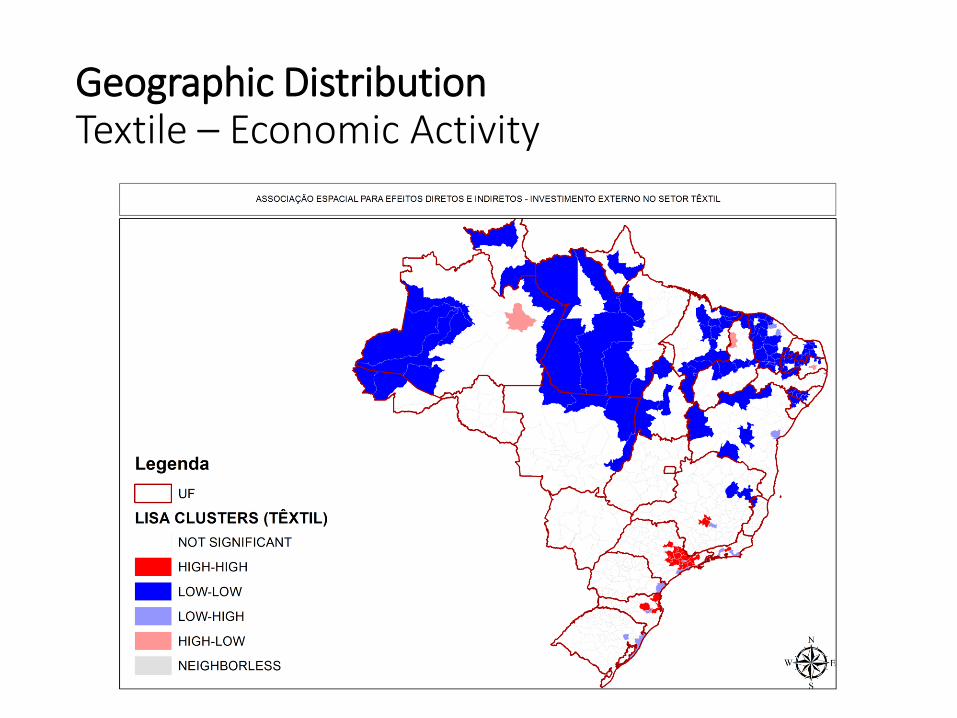
Geographic Distribution Textile – Economic Activity
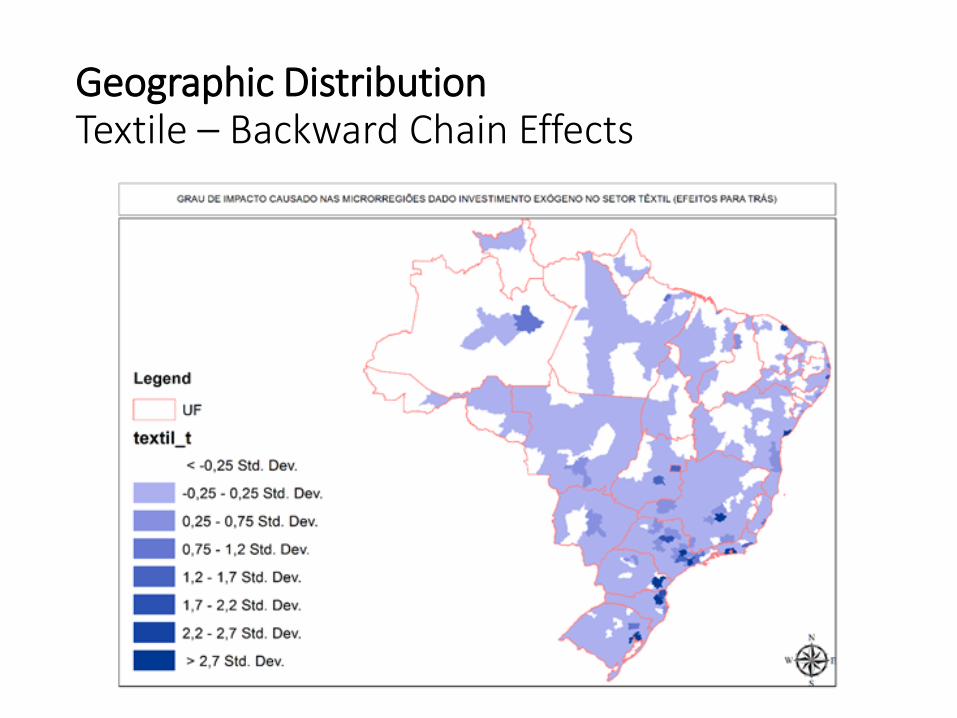
Geographic Distribution Textile – Backward Chain Effects
Co-location and Spatial Correlation Evidences
The role of interaction between invested sectors and their chain effects both forwards and backwards
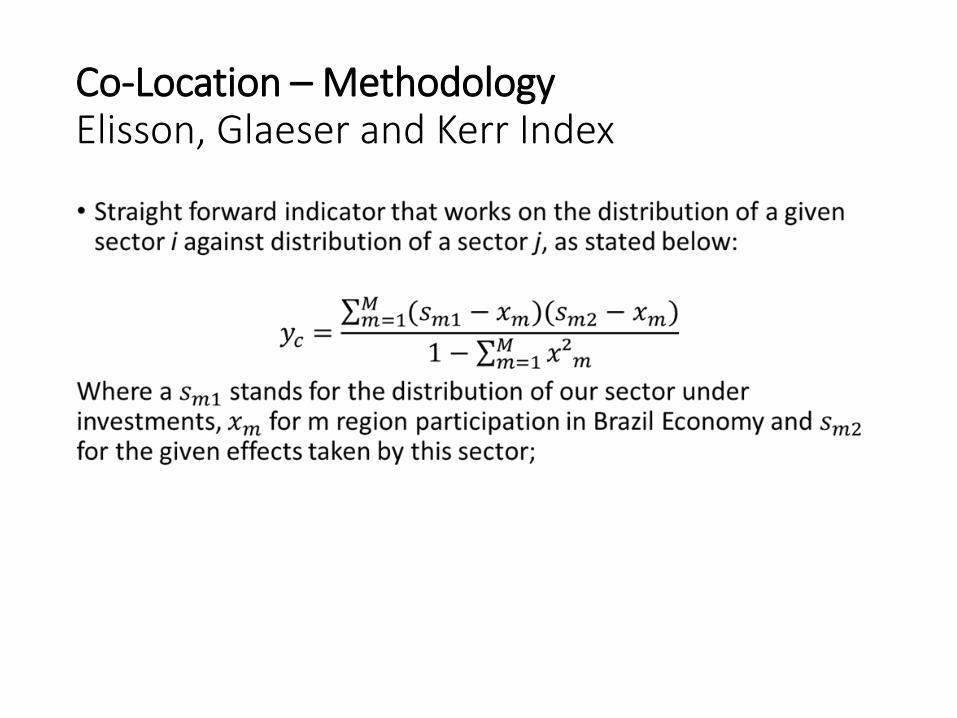
Co-Location – Methodology Elisson, Glaeser and Kerr Index
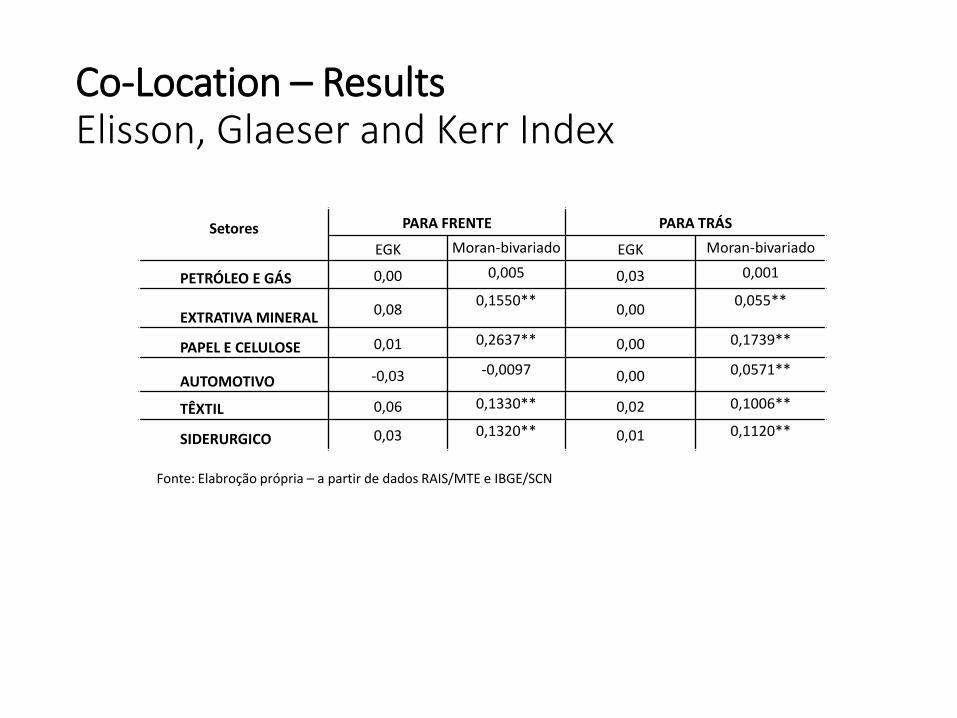
Co-Location – Results Elisson, Glaeser and Kerr Index
Setores
PARA FRENTE PARA TRÁS
EGK Moran-bivariado EGK Moran-bivariado
PETRÓLEO E GÁS 0,00 0,005 0,03 0,001
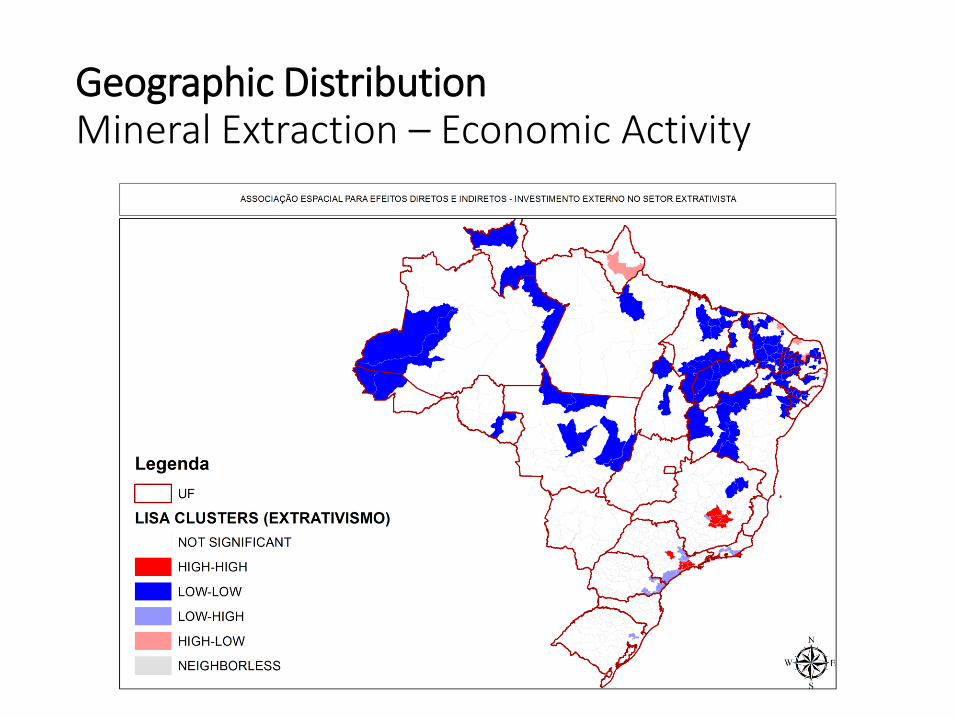
EXTRATIVA MINERAL 0,08
0,1550** 0,00
0,055**
PAPEL E CELULOSE 0,01 0,2637** 0,00 0,1739**
AUTOMOTIVO -0,03 -0,0097 0,00 0,0571**
TÊXTIL 0,06 0,1330** 0,02 0,1006**
SIDERURGICO 0,03 0,1320** 0,01 0,1120**
Fonte: Elabroção própria – a partir de dados RAIS/MTE e IBGE/SCN
Final Considerations
• Every sector investigated has significantly backwards effects, given any increase in production. Oil and Gas and Metalurgy has greater forward effects than its backwards.
• For some of the investments there are a strong spatial concentration.
• The study can outline some sectors that would intensify the production chain.
• The EGK test for co-location indicated patterns across Oil and Gas (backwards), textile (forwards). Interestingly it have been uneffective for automotive industries (despite their high spatial concentration).