co -egr: using co to enhance gas or condensate recovery
TRANSCRIPT

14th International Conference on Greenhouse Gas Control Technologies, GHGT-14
21st -25th October 2018, Melbourne, Australia
CO2-EGR: using CO2 to enhance gas or condensate recovery
Filip Neele *, Cor Hofstee, Daniel Loeve, Dries Hegen
TNO, Princetonlaan 6, Utrecht, The Netherlands
Abstract
A large number of gas fields in The Netherlands are in decline and within the next decade the production in many fields will
cease. End-of-field-life techniques are currently being investigated. One of the options to extend economic field life is enhanced
gas recovery (EGR). EGR is a technique to increase the ultimate recovery of natural gas and gas condensate through the injection
of carbon dioxide (CO2), or another drive gas like nitrogen, in a gas field. The understanding of the field properties or EGR
process parameters that determine the viability of EGR has been limited so far. The objective of this work is to find these success
factors of EGR using CO2 as a drive gas and to investigate the potential for this type of utilization of CO2. A parameteric study
was done on a realistic model of a gas field in the size range 1 – 5 bcm, varying a range of field properties (such as depth, GIIP,
permeability) and EGR scenario parameters (such as injection rate, timing of the start of injection) to find the parameters that
most affect additional recovery or the net present value of the EGR operation. This was done for both dry and wet (condensate)
gas fields. For dry gas fields, the key parameters are field size (with larger fields presenting a better case for EGR), permeability
(higher additional recovery is obtained in reservoirs of better quality). Typical additional recovery is in the range of 4 – 12% of
the GIIP, depending on the concentration of CO2 that is allowed in the produced gas stream. EGR should not be started before the
end of primary recovery; optimum injection rates are typically up to twice the production rate. A higher concentration results in
more additional sales gas, at the cost of gas treatment to comply with sales gas specifications. In wet gas fields, best results are
obtained when EGR starts as early as possible, to avoid condensate drop out in the reservoir. Although gas treatment
requirements after CO2 breakthrough may cause loss of methane production, additional condensate recovery can be as large as
40%.
Keywords: enhanced recovery, CO2 injection.
1. Introduction
1.1. Background
A large number of gas fields in The Netherlands are in decline and within the next decade the production in many
fields will cease. End-of-field-life techniques are currently being investigated. One of the options to extend
economic field life is enhanced gas recovery (EGR). EGR is a technique to increase the ultimate recovery of natural
gas and gas condensate through the injection of carbon dioxide (CO2), or another drive gas like nitrogen, in a gas
* Corresponding author. Tel.: +31 88 866 4859.
E-mail address: [email protected]
2 GHGT-14 Author name
field. As a result, the field is re-pressurised and the remaining gas is displaced towards the production well. In case
of a wet gas (condensate) field, drive gas injection results in higher recovery of the valuable condensate. However,
during simultaneous CO2 injection and gas production, the CO2 will reach the production well and lower the quality
of the produced gas. When the CO2 concentration exceeds the sales gas tolerance, gas separation facilities are
needed.
Concerns on the quality of the produced gas and the significant costs of installing and operating separation
facilities have kept operators from deploying EGR. In addition, for many Dutch gas fields recovery factors are high,
up to 95%. However, EGR could be an option for fields with lower ultimate recovery, but the understanding of the
field properties or EGR process parameters that determine the success of EGR has been limited so far. The objective
of this work is to define the success factors of EGR using CO2 as a drive gas and to investigate the potential for this
type of utilization of CO2.
1.2. Previous work
The injection of CO2 in depleted gas fields or gas condensate fields is not a new approach. It has been described
in recent literature, e.g.[1-8]. The method could be attractive, as the rate of gas recovery is increased and CO2
emissions are reduced. Most studies in literature focus on the additional recovery from EGR, or on certain aspects of
CO2 EGR like hydrate forming, Joule Thomson effect or the solubility of CO2 in brine.
As is described in this report, the focus in EGR should not only lie on the technical and operational feasibility,
but also on the economical evaluation of enhanced gas/hydrocarbon recovery. This has also been highlighted
previously [5, 9, 10].
One source ([9]) claimed an incremental recovery of 8% can be achieved by CO2 injection with a primary
recovery factor of 85%. A negative incremental contribution to the net present value coincided with CO2 content in
the gas production stream of 10%. The starting time of injection was taken to be the same as the start of production,
which is not representative for the Netherlands. In the Netherlands typically primary recovery factors of the order of
80-90% are realised. The remaining 10-20% of gas is the target of enhanced gas recovery processes.
Hussen et al. [5] showed that high injection rate and late start of EGR is economically most attractive. An
important constraint used in that study is that the reservoir pressure and temperature are such that the CO2 is always
at supercritical conditions. With the CO2 in supercritical state, mixing by diffusion will be considerably lower than
CO2 in gaseous state.
In contrast, a different study found that early start and low injection rate is economically the best option [10]. The
reason for this is that their study takes into account carbon taxes in the economic analysis. For every ton of CO2
released into the atmosphere a penalty (carbon tax) is applied, resulting in an economic optimum that is different
from that found by reported in [5).
The number of field cases of EGR described in literature is limited, especially on dry gas fields. A pilot test was
performed in a Hungarian field named Budafa Sfintelleti with an incremental recovery of 11% [11]. CO2 injection
has been ongoing since 2004 in the K12b field in the Dutch sector of the North Sea (e.g., [12]). Extending natural
gas production has been assessed in several case (desktop) studies (e.g. [13, 14]). Table 1 lists a number of studies
which report on additional gas production. The range in incremental production is large and emphasises the
dependence on site characteristics and EGR design. It is noted that only two of the cases reported in the table actual
field experience, one of which represents a commercial EGR project. The remaining case are desktop studies. One
operational project in the Netherlands illustrates EGR, as it is being deployed in an onshore field since 2013, with
future plans for several other fields [15]. The drive gas used is nitrogen, which has the benefit of easy availability
and relatively low cost of production. In addition, the tolerance for nitrogen in the sales gas in the Netherlands is
high and significant breakthrough of the gas at the producing wells can be allowed. The operator expects an increase
in ultimate field recovery from 73% to 83%. A recent study showed little difference between simulations of EGR
with CO2 or N2 [16].
There are several reasons for the absence of field cases in the Netherlands (apart from the project described in
[15]). Firstly, there is no large-scale CO2 capture industry and at present CO2 is only available in large industrial
regions. Secondly, there is a major concern of mixing of the CO2 with the natural gas and reducing the quality of the
GHGT-14 Author name 3
original gas in the reservoir. Thirdly, the high (primary) recovery factors gives in general limited scope for enhanced
gas recovery.
Table 1. Overview of literature on EGR, showing recovery increase, in percentages of additionally produced gas.
Field Source EGR (%) Description
Schönkirchen, Germany [17] 0 Simulation
Atzbach-Schwanenstadt, Gemany [13]; [18] <1 Simulation
Synthetic example [19] <10 Simulation
Schönkirchen, Germany [14] 1.5 Simulation
Höflein, Germany [14] 0 Simulation
Budafa-Szintfeletti, Hungary [20] 11.6 Field experience
K12-B, The Netherlands [21] -- Field test
1.3. Reading guide
The factors affecting the success of EGR were studied using a synthetic gas field model (section 2) in which an
EGR operation was simulated. By varying the geological properties of the synthetic field, as well as the parameters
of the EGR operation, the key parameters were determined, along with an estimate of the typical additional
recovery. EGR in both dry (section 3) and wet gas fields (section 4) was simulated.
2. Approach
2.1. Synthetic gas field model
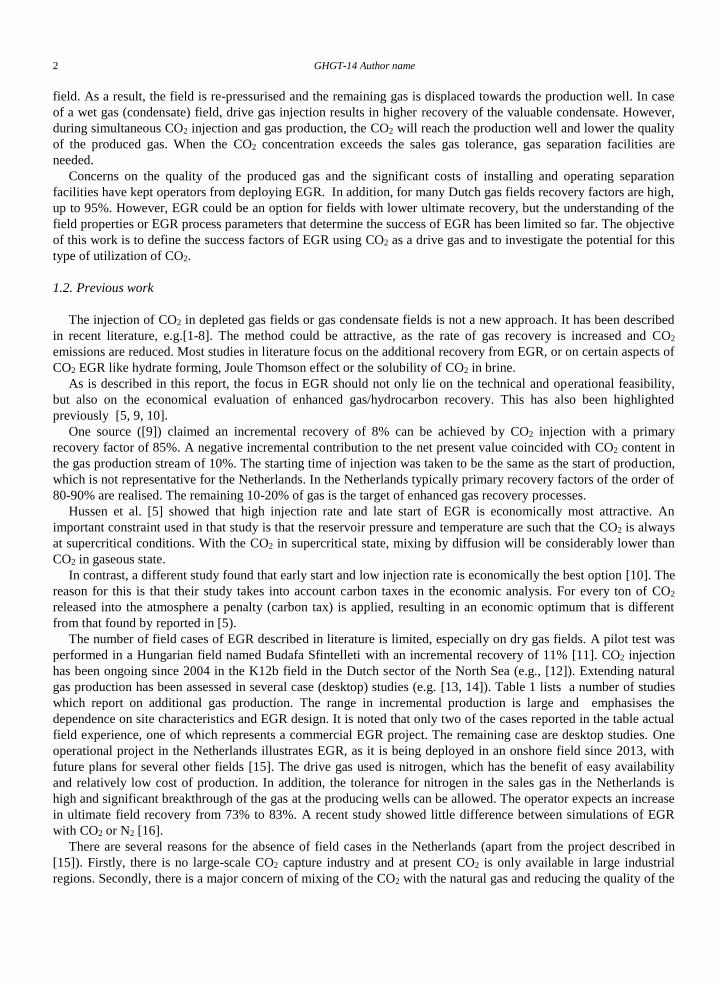
The benefit of EGR was studied with a dynamic model of a synthetic reservoir to identify the field properties and
production parameters that control the effectiveness of EGR. This parametric study targeted dry gas and gas
condensate fields with a size of 1 to 5 bcm (billion cubic meter; 35 – 175 bscf), with one injection well and one
production well, which represents the majority of Dutch gas fields (Fig. 1, field properties given in Table 1). The
feasibility of EGR was evaluated based on comparing the benefit of additional recovery of gas or condensates with
the cost of deploying EGR.
Fig. 1: Map view (left) and cross section view (right) of the synthetic box model water saturation at time zero. Blue corresponds to the water zone
and red corresponds to the gas zone. Injection and production wellheads are shown in the map view.

4 GHGT-14 Author name
2.2. Development Strategy
The base case production strategy was comprised of a vertical production well at a distance of 160 meter from the
northern boundary and a vertical injection well at a distance of 800 meters from the production well when going
down the flank. Both wells were placed at a distance of 500 meters from the eastern and western boundaries. The
injection well was perforated only in the gas interval (top 50 meters), whereas the production well was perforated
along the top 25 meters of the reservoir. The production and injection strategy used for the base case are described
in Table 3.
Table 2: Synthetic reservoir model description and reservoir properties.
Property Value Property Value
Reservoir size (l x w x h) 2 km x 1 km x 100 m Residual gas saturation (Sgcr) 0.3
Reservoir dip 5° Connate water sat. (Swcr= Swmin) 0.1
Porosity 0.15 Water rel. perm. at residual gas (Krwg) 0.1
Horizontal permeability kh 10 mD Gas rel. perm. at connate water (Krgw) 0.8
kv / kh 0.1 Corey gas exponent (ng) 2
NTG 0.9 Water density 1020.3 kg/m3
Rock compressibility 4.43910-5 bar-1 Water compressibility 4.245910-5 bar-1
Depth GWC 3050 m TVD Water viscosity 0.28589 cP
Initial Reservoir Pressure @ GWC 300.22 bar (hydrostatic eq.) Number of cells (l x w x h) 43 x 77 x 20
Temperature @ GWC 108 °C (gradient 35.4 °C/km) Grid dimensions (l x w x h) 25 m x 25 m x 5 m
GIIP 2.75109 m3 Heterogeneity none
Production of gas after the start of CO2 injection is continued until the concentration of CO2 in the produced gas
stream is 5% or 60%. The former is a typical value for the limiting CO2 concentration in sales gas supplied to the
Dutch gas networks; it is used here to represent an EGR operation in which no gas treatment (separation) facilities
are used. Clearly, the 60% case does require separation of co-produced CO2 from the produced gas stream prior to
delivery to the network.
The ratio of injection to production rates, which is one of the key parameters in an EGR operation (see below),
was varies between 1:4 (injection rate one quarter of the production rate) and 3:1 (injection rates three times larger
than the production rate).
Table 3: Base case development strategy for the synthetic reservoir model.
Production Well Parameter Injection Well Parameter
Start of production 01-01-2025 Start of Injection 01-11-2060
Maximum Production rate 200 000 Sm3/day Maximum Injection Rate 200 000 Sm3/day
Minimum BHP 40 bar Maximum BHP 300 bar
Minimum production rate 40 000 Sm3/day Fluid Composition 100% CO2
Table 4: Cost data for EGR operations, onshore. Produced gas flow rate 300,000 m3/d.
Onshore Offshore Onshore Offshore
Workover well [M€] 0.7 2 Compression, CAPEX [M€] 7 20
New well [M€] 7 20 Compression, OPEX [k€/d] 2 6
Gas treatment, CAPEX [M€] 15 45 Total CAPEX [M€] 30 87
Gas treatment, OPEX [k€/d] 3 10 Total OPEX [k€/d] 5 16

GHGT-14 Author name 5
2.3. Cost data
Table 4 gives an list of indicative CAPEX and OPEX values for facilities needed in an EGR operation.
Depending on the quality of the produced gas, a well workover may be needed to handle the corrosive mixtures
when CO2 breaks through at the producer well; well related costs data were taken from [22]. Gas treatment
equipment is needed when gas production is to continue when the concentration of CO2 in the produced gas exceeds
sales gas specifications; cost data were taken from [23]. Data on the cost of compression for re-injection was taken
from van [24]. Cost data are given for both onshore and offshore fields; a factor of three cost increase is assumed for
an offshore environment [25].
3. Dry gas fields: enhanced methane recovery
3.1. Reservoir properties
The reservoir parameters listed in Table 5 were selected as the most likely dominant parameters. The sensitivity
of both methane recovery and net present value (NPV) were determined, for the values given in the table under
‘Scenarios’.
Table 5: Parameters selected for the CO2-EGR sensitivity analysis. Heterogeneity coefficient: Dykstra-Parson coefficient.
Parameter Base case Scenarios
Reservoir depth [mTVD] 3000 2000, 4000
Reservoir dip [°] 5 0, 10
Horizontal permeability [mD] 10 5, 50, 100, 200
kv/kh [-] 0.1 0.01, 0.05, 0.5, 1
Dykstra Parson Heterogeneity 0 0.5, 0.8
GIIP [bcm] 2.75 1, 5
Start of CO2 injection [years] 36 26, 46
Fig. 2 shows results corresponding to the stopping criteria of 5% and 60% CO2 production, at an injection to
production rate ratio of 1:4. At this ratio the maximum increase in recovery factor (RF) was obtained; see below for
results from optimizing the net present value (NPV). The d_RF (along the vertical axis in Fig. 2) is defined as the
increase in RF after primary recovery. The following observations can be made.
• CO2-EGR results in an extra recovery factor between 4 and 10% (6% on average) at 5% CO2 stopping criteria
and 10 to 15% (12% on average) at 60% CO2 stopping criteria.
• Optimal timing of CO2 injection is immediately after primary recovery. Early CO2 injection results in reduced
recovery factor as CO2 breakthrough begins much earlier, leading to loss of gas, and late CO2 injection shows a
minor increase in the d_RF, as little residual gas is left for the EGR process.
• Reservoir permeability is the most important parameter in the feasibility of the CO2-EGR process in terms of
increase in RF. At low reservoir permeability, primary recovery results in a relatively low RF.
• The additional recovery factor exhibits the highest sensitivity to structure dip and the lowest sensitivity to depth
variations.
• Lower vertical stratification (higher Kv/Kh) leads to better EGR results, due to better gravity separation of CO2
and methane and later breakthrough of CO2.
The success of CO2-EGR depends on sweep efficiency, reservoir re-pressurization potential, and CO2
breakthrough time. For an ideal case, injected CO2 should be in its supercritical phase and re-pressurize the depleted
reservoir quickly while having a late breakthrough time. The supercritical CO2 would have the highest density

6 GHGT-14 Author name
contrast and can quickly segregate due to density difference between the CO2 and CH4. This would improve the
vertical sweep efficiency as well as delay CO2 breakthrough, assuming only the top of the production well
perforated.
Fig. 2: Increase in recovery factor (d-RF) at different geological settings assuming two stopping criteria of 5% and 60% CO2 in the producted gas
stream. Green and red lines show base case d_RF levels at 5% and 60% CO2 stopping criteria respectively.
In a similar manner as the RF parametric study, the net present value (NPV) was calculated for various geological
scenarios and injection/production strategies; a discount factor of zero was used. Fig. 3 shows a summary of the
values obtained for an injection to production rate ratio of 1:1 and a maximum CO2 production composition of 60%,
using onshore cost values. The EGR timing shows a drop in NPV for the earlier start of EGR, due to the loss of gas.
Late EGR showed a slight increase as time 0 for the NPV calculation was chosen to be the end of primary
production, similar to the other scenarios, but investment took place at the start of EGR (year 10). The scenarios are
ordered from top to bottom by impact on the NPV, with GIIP being the highest, heterogeneity (Dykstra-Parsons
coefficient) the lowest. It is noted that this scenario leads to negative NPV in the base case, which indicates that
EGR in the small fields analysed here, in the range of 1-5 bcm, is not economically viable – unless cost savings in
wells or facilities can be achieved. The only positive NPV shown in Fig. 3 is for a GIIP of 5 bcm.
GIIP
EGR timing
Dip
Depth
Permeability
Kv/Kh
Heterogeneity
NPV (M€)-25 -20 -15 -10 -5 0 5
LowHigh
Fig. 3: NPV for high and low cases for various reservoir parameters with an injection to production ratio of 1:1, a 60% maximum CO2 production
composition and an onshore field.
GHGT-14 Author name 7
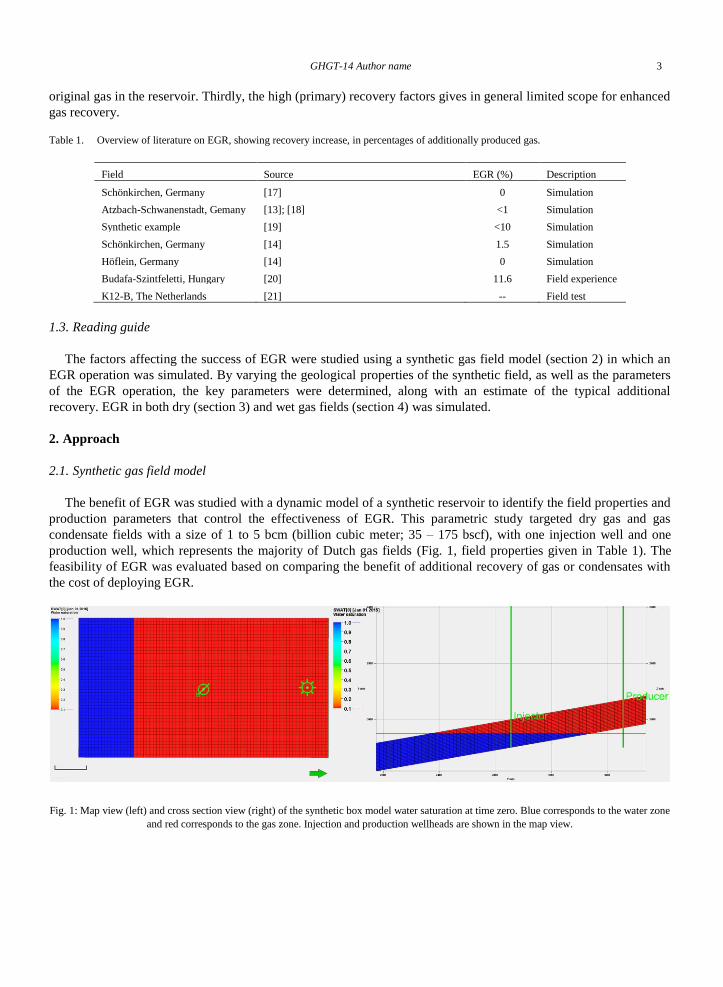
3.2. Injection rate
Fig. 2 and Fig. 3 show results for a single value of the injection to production rate ratio. The results obtained for
all scenarios considered suggest that this ratio is among the most relevant for the success of EGR. Fig. 4 shows the
increase in RF for the range of injection to production rate ratios considered, for the same set of geological
parameters shown in Fig. 2; the timing of EGR is not included. The stop criterion is 5% CO2 in the produced gas
stream. The results in Fig. 4 show that for the synthetic box model, lower injection rates lead to higher increase in
RF. The reason for this is that lower injection rates delay the CO2 breakthrough, resulting in a higher additional
recovery. Fig. 5 shows the NPV values for the scenarios in Fig. 4. For most of the scenarios, a lower injection rate
results in the highest NPV, as CO2 breakthrough is delayed and more CH4 can be produced.
Fig. 4: Additional recovery at 5% CO2 stopping criterion for scenarios with different injection to maximum production rate ratios.
Fig. 5: Onshore NPV at 5% CO2 stopping criterion for scenarios with different injection to maximum production rate ratios.

8 GHGT-14 Author name
Fig. 4 and Fig. 5 show results for an EGR project that produces additional up to a CO2 concentration in the
produced gas of 5%, to avoid the installation of gas separation facilities. This strongly reduces the volume of
additional gas that can be produced, leading to negative NPV values (Fig. 5). Fig. 6 shows an analysis of the effect
of injection rate ratio for the case of a 5 bcm field, with a limiting CO2 concentration in the produced gas stream of
60%, resulting in significant gas processing efforts. Although the d-RF shows a trend of lower rates leading to
higher RFs, the NPV tends to have an optimal rate ratio that in this case is 2:1. The NPV difference between the
highest and lowest case is approximately 20 M€ with a RF difference for these two scenarios of approximately 3%.
The business for an EGR operation can be improved by continuing injection of CO2 after production has ceased,
turning the EGR operation into a CO2 storage project. For such an approach to work, additional efforts are required,
such as monitoring of all CO2 streams in the operation and ensuring that all stored CO2 remains safely stored. This
has not been modelled here.
Fig. 6: Sensitivity of the RF and NPV for the GIIP scenario of 5 bcm and 60% CO2 production composition.
3.3. Conclusion
Multiple scenarios in terms of geological parameters and injection strategies were run for the synthetic parametric
dry gas model. The following conclusions are formulated.
• The RF was increased for all cases excluding the EGR process performed before primary depletion. Similar to
Jikich et al. (2003), an increased production rate was obtained but this also led to early CO2 breakthrough.
Therefore, EGR should follow immediately after primary depletion.
• The RF and NPV are highly sensitive to injection rates. Although high injection rates lead to earlier CO2
breakthrough and lower RF, the RF is increased sooner and NPV was higher due to the time dependency of the
calculation. Therefore, when designing an EGR process, operator objectives (RF, NPV, or a weighted average of
both) should be considered to determine case feasibility of EGR as different optimal injection strategies were
found for NPV and RF. Discernible trends were found from the results using the synthetic model, for example
higher permeabilities resulted in higher overall RF and NPV, but the increase in RF over primary depletion was
lower for the high permeability cases. The non-linearity of a field case and co-dependency of parameters makes
these results case dependent.
• Higher CO2 production percentages in the produced gas stream lead to higher NPV and RF. The length of time
needed to reach these higher values lowers the losses in terms of present value and assumes that the project was
initially designed to handle high volumes of CO2 production.

GHGT-14 Author name 9
• Table 6 compares the effect of different parameters on both the NPV and d_RF. For the values and case
investigated, the reservoir parameters resulting in the best NPV and d_RF are the same for most cases giving a
clear indication of reservoir properties to consider when selecting an EGR reservoir. Reservoir size (GIIP) and
permeability are the key controlling factors for the feasibility of EGR.
• The addition of a CO2 storage value can greatly increases the NPV of the project for high CO2 cut off values.
• The stopping criteria of CO2-EGR should not be based on percent of CO2 produced, instead RF and NPV should
be analysed to optimize these values (or any other goals for the project). A so-called FEED (Front End
Engineering Design) analysis should be performed in order to determine the size of the CO2 recycle facilities.
Table 6: Summary of EGR parameters and their effect on NPV and dRF.
Parameter Highest NPV Scenario Highest dRF
GIIP High (5 bcm) High (5 bcm)
Permeability High (200 mD) Low (5 mD)
Dip Angle High (10 degrees) High (10 degrees)
Depth High (4000 m) High (4000 m)
kh/kv High (1) High (1)
Dykstra Parson Heterogeneity High(V = 0.8) High (V = 0.8)
Time of Injection End of Primary Recovery End of Primary Recovery
4. Wet gas fields: enhanced condensate recovery
In the Netherlands most gas fields are dry gas fields, the few condensate gas fields are the exception to the rule.
Similar to the study presented above, a parametric study on enhanced condensate recovery is presented in this
section. The scope of the study below is narrower and the focus is on the most sensitive parameters as identified in
the dry gas parametric study.
The model set-up is the same as described in dry gas parametric study, but the reservoir is initialized with gas
condensate properties instead. The equation of state description, relative permeability and capillary pressure were
taken from an offshore wet gas field. The gas initially in place and the condensate initially in place are presented in
Table 7.
Table 7: Gas and condensate (oil) initially in place in the gas condensate synthetic field.
Parameter Value
Gas initially in place (GIIP) 1920 MMSm3
CH4 initially in place 1470 MMSm3
Condensates initially in place (FOIP) 0.509 MMSm3
The results proved to be most sensitive to the start of injection and the injection rate. Five scenarios were defined
in which these two parameters are varied (Table 8).
Table 8: Description of the five scenarios gas condensate parametric study.
Scenarios Description Injection rate (m3/day) Start injection (year)
BASE No EGR - -
Scenario 1 low injection rate, after depletion 1.0105 End of depletion
Scenario 2 low injection rate, early injection 1.0105 5
Scenario 3 high injection rate, after depletion 2.0105 End of depletion
Scenario 4 high injection rate, early injection 2.0105 5

10 GHGT-14 Author name
The cumulative methane production and condensate production in the five scenarios are shown in Fig. 7. The
highest improvement in condensate production is observed for scenario 4, with high injection rate of CO2 and early
start of injection. Injection after depletion shows a lower condensate recovery compared to early injection, which is
expected to be due to condensate drop-out below the dew-point pressure.
The drawback of an early start of injection is the contamination of the natural gas, due to breakthrough of CO2.
Therefore, the timing of the start of enhanced recovery will have to depend on the relative value of gas and
condensate.
The best scenario is scenario 4 (‘run4’ in Fig. 7) and which is used as a base case for the sensitivity study on
geological parameters. The scenario uses a high injection rate and an early start of injection (after five years); these
are the operational success factors of enhanced condensate recovery.
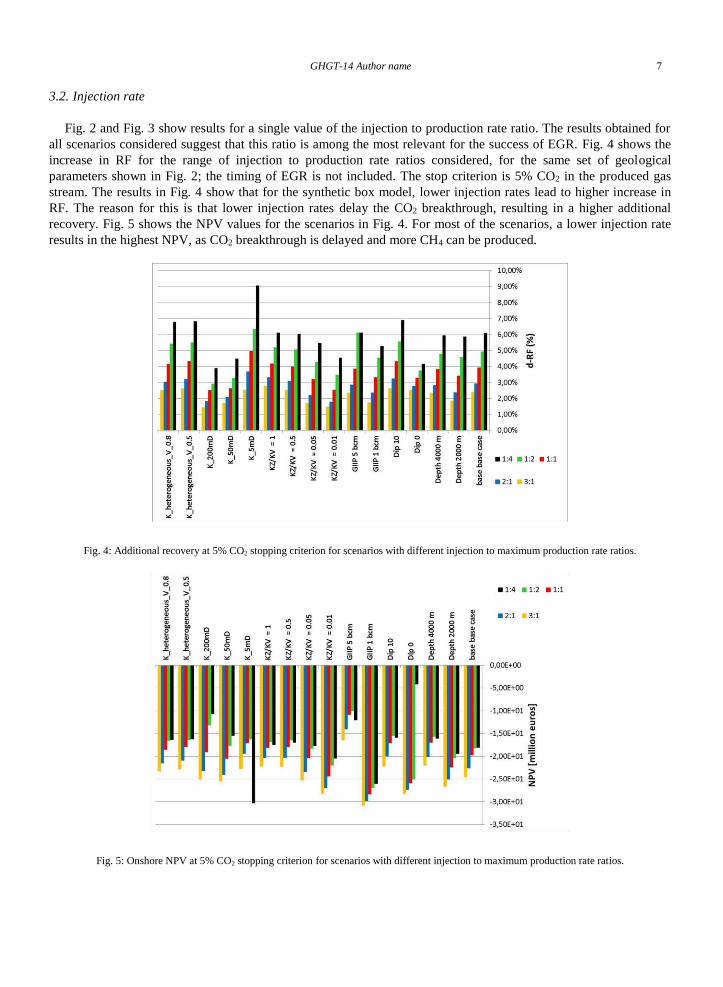
A limited sensitivity study into the impact of geological properties is shown in Fig. 8 and Fig. 9. Depending on
the maximum CO2 concentration in the produced gas stream, condensate recovery can be increased by up to about
40% (Fig. 8), while the methane recovery is negative (Fig. 9); the latter is due to contamination of the produced gas
with CO2.
Fig. 7: Additional methane recovery (left) and condensate recovery (right) in the four scenarios (‘run1’ through ‘run4’).
Fig. 8: Additional condensate recovery for the most sensitive geological parameters.
GHGT-14 Author name 11
4.1. Conclusion
For gas condensate reservoirs an optimum injection strategy will depend on the specific operational goals, e.g. on
the relative value of methane and condensate in the field. In this limited parametric study the production of
condensates was assumed to be more important. With this assumption, an early start of injection and a high injection
rate are the success factors of enhanced condensate recovery; both are linked to the operational strategy of reservoir
production.
Fig. 9: Additional methane recovery for the most sensitive geological parameters.
5. Discussion
The results show that the following reservoir properties and EGR process parameters control EGR feasibility.
• The two reservoir parameters that most significantly affect EGR potential are GIIP (gas initially in place) and
permeability. While for low-permeable fields the relative additional recovery is highest, additional production
times are long. The highest additional recovery in absolute terms is obtained for high-permeable fields. Fields
with a larger GIIP have more additional gas to produce and present a better case for EGR. The lower limit for
EGR feasibility is perhaps probably closer to 5 bcm than to 1 bcm, but this is site dependent.
• In all cases, deeper fields appear to have a higher EGR potential. This is due to decreasing difference in buoyancy
between CO2 and gas with increasing depth, which improves the sweep efficiency of the CO2 flood.
• EGR yield increases with increasing reservoir dip angle, with increasing vertical layering, as well as with
increasing reservoir heterogeneity.
• The injection rate should be lower, rather than higher, to reach higher additional recovery and to minimize
mixing of gas and CO2. Taking into account that much of the higher recovery at lower rates is obtained further
into the future, the highest net present value is reached when injection rates are about twice as high as the
production rates.
• The start of EGR in dry gas fields should be close to the end of primary production. If EGR is started earlier, the
cost associated with CO2 breakthrough cancels benefits from a higher pressure in the reservoir. When condensate
recovery is the main target, an early start of EGR is preferred, to prevent drop-out in the reservoir; the produced
gas, a mix of natural gas and drive gas, will be re-injected, due to high separation cost.
12 GHGT-14 Author name
The range of increase in recovery factor depends on the limiting CO2 concentration in the produced gas stream.
When 5% CO2 is allowed in the produced gas, the increase is in the range of 4 – 10% (percentage point). When
higher concentrations are allowed and separation facilities used to bring the produced gas to sales specifications, the
increase in recovery factor can be as high as 9 – 15% (percentage point).
One important success factor is the location of a gas field. As the cost of operation and of adapting a production
site is much lower than for offshore fields, EGR is more likely to be economically viable for onshore fields.
6. Conclusion
The results for this project suggest that enhanced gas recovery could be an economically viable end of field life
option for dry gas fields. In general, the potential for EGR is higher for onshore fields than for offshore fields, due to
the lower cost of onshore operations and facilities. If storing of CO2 during or after the EGR process brings benefits
through an emissions trading scheme, EGR operations could become interesting, also for dry gas fields.
The economic viability of EGR depends on, among other factors, the cost of a separation facility to strip the co-
produced CO2 from the sales gas. For gas condensate fields, the results suggest that EGR should be considered as an
option to be applied earlier during production of a field than for dry gas fields. In that case, rather than an end of
field life technique, EGR could be a key element of the field development plan.
References
[1] Oldenburg CM, Stevens SH, Benson, SM. Economic feasibility of carbon sequestration with enhanced gas recovery (CSEGR), 20 pp; 2001.
[2] Oldenburg CM. Carbon Sequestration in Natural Gas Reservoirs: Enhanced Gas Recovery and Natural Gas Storage. Proceedings TOUGH
Symposium, May 12-14, 2003, Lawrence Berkeley National Laboratory, Berkeley, California.
[3] Regan MLM. PhD thesis: A numerical investigation into the potential of Enhanced Natural Gas Recovery in water-drive gas reservoirs
through injection of CO2. University of Adelaide, Australia; 2010.
[4] Sidiq HHA. Enhanced Gas Recovery by CO2 injection. PhD thesis Curtin University; 2010.
[5] Hussen C, Amin R, Madden G, Evans B. Reservoir simulation for enhanced gas recovery: An economic evaluation. Journal of Natural Gas
Science and Engineering 2012; 5; 42-50.
[6] Luo F, Xu R-N, Jiang P-X. Numerical investigation of the influence of vertical permeability heterogeneity in stratified formation and of
injection/production well perforation placement on CO2 geological storage with enhanced CH4 recovery. Applied Energy 2013; 102; 1314–
1323.
[7] Kalra S, Wu X. CO2 injection for Enhanced Gas Recovery. SPE-169578-MS, 2014.
[8] Khatun F, Md. Minhaj Uddin Monir SM Nafefun A, Ab Wahid Z. Implementation of Carbon Dioxide Gas Injection Method for Gas
Recovery at Rashidpur Gas Field, Bangladesh, Int. J. Eng. Technol Sci 2016; 5; http://dx.doi.org/10.15282/ijets.5.2016.1.7.1046.
[9] Al-Hashami A, Ren SR, Tohidi B. CO2 injection for Enhanced Gas Recovery and Ge-Storage: Reservoir Simulation and Economics. SPE
94129; 2005.
[10] Khan C, Amin R, Madden G. Economic Modelling of CO2 Injection for Enhanced Gas Recovery and Storage: A Reservoir Simulation Study
of Operational Parameters, Energy and Environment Research 2012; 2, No. 2.
[11] Turta AT, Sim SSK, Singhal AK, Hawkins BF. Basic Investigations on Enhanced Gas Recovery by Gas-Gas Displacement; SPE: 08-10-39,
Journal of Canadian Petroleum Technology 2008; 47, 10.
[12] Vandeweijer VP, Van der Meer LGH, Hofstee C, Mulders F, D’Hoore D, Graven H.. Monitoring the CO2 injection site: K12-b, Energy
Procedia 2009; 4; 5471-5478.
[13] Polak S, Zweigel J, Pannetier-Lescoffit S, Lindeberg E, Zweigel P, Kunaver D, Kroos B, Alles S, Schultz H-M, Faber E, Teschner M,
Poppenburg J, May F. The Atzbach-Schwanenstadt gas field – a potential site for onshore CO2-storage and EGR, Leading Edge 2006; 25;
1272-1275.
[14] Clemens T, Secklehner S, Mantatzis K, Jacobs B. Enhanced Gas Recovery, Challenges Shown at the Example of three Gas Fields, SPE
130151, 2010.
[15] Goswami R, Seeberger FC, Bosman G. Enhanced gas recovery of an ageing field utilizing N2 displacement: De Wijk Field, The
Netherlands, Geological Society, London, Special Publications 2018; 469; https://doi.org/10.1144/SP469.2.
[16] Leeuwenburgh O, Neele F, Hofstee C, Weijermans PJ, de Boer H, Oosthoek P, Lefebvre A, Godderij R, Gutierrez-Neri, M. Enhanced gas
recovery – a potential ‘U’ for CCUS in The Netherlands, Energy Procedia 2014; 63; 7809-7820;
http://dx.doi.org/10.1016/j.egypro.2014.11.8158 .
[17] Secklehner S, Arzmüller G, Clemens T. Tight Ultra-deep Gas Field Production Optimisation - Development Optimisation and CO2
Enhanced Gas Recovery Potential of the Schoenkirchen Uebertief Gas Field, Austria, SPE 130154-MS, SPE Deep Gas Conference and
Exhibition, Manama, Bahrain, 2010.
[18] Polak S, Grimstad A-A. Reservoir simulation study of CO2 storage and CO2-EGR in the Atzbach–Schwanenstadt gas field in Austria,
Energy Procedia 2009; 1; 2961–2968.

GHGT-14 Author name 13
[19] Clemens T, Wit K. CO2 Enhanced Gas Recovery Studied for an Example Gas Reservoir, SPE: 77348-MS; SPE Annual Technical
Conference and Exhibition, San Antonio, Texas, 2002.
[20] Papay J. Improved Recovery of Conventional Natural Gas. Part II: Results of a Pilot Test; Erdoel, Erdgas, Kohle 1999; 115; 354-355.
[21] van der Meer LGH, Kreft E, Geel CR, D’Hoore D, Hartman. CO2 storage and testing enhanced gas recovery in the K12-B reservoir. 23rd
World Gas Conference, Amsterdam, 2006.
[22] Dynamis, 2008, http://www.sintef.no/projectweb/dynamis-hypogen/.
[23] Ho MT, Wiley DE. Economic Evaluation of Membrane Systems for Large Scale Capture and Storage of CO2 Mixtures. Refereed
Proceedings, Separations Technology VI: New Perspectives on Very Large-Scale Operations. Engineering Conferences International, 2004.
[24] Van Osch, et al., Inventory and quantitative characterisation of technologies available for each part of the CO2 infrastructure system, CATO
report CATO-2-WP2.1-D03, 2010.
[25] ZEP. The costs of CO2 storage – post-demonstration CCS in the EU, 2011 (http://www.zeroemissionsplatform.eu/downloads/814.html).