co-operative credit society of manitoba limited · pdf file2 credit union central of manitoba...
TRANSCRIPT

Credit Union Central of Manitoba Limited
Consolidated Financial Statements December 31, 2016 (in thousands of Canadian dollars)

Table of Contents
Independent Auditor’s Report..................................................................................................................... 1 Consolidated Statement of Financial Position ........................................................................................... 2 Consolidated Statement of Operations and Comprehensive Income ......................................................... 3 Consolidated Statement of Members’ Equity ............................................................................................. 5 Consolidated Statement of Cash Flows .................................................................................................... 6 Notes to Consolidated Financial Statements .............................................................................................. 6
1. General Information ........................................................................................................................ 6 2. Basis of preparation........................................................................................................................ 6 3. Summary of significant accounting policies .................................................................................... 6
a) Basis of measurement ............................................................................................................. 6 b) Consolidation ........................................................................................................................... 6 c) Investments in associates ........................................................................................................ 7 d) Recoveries from member credit unions ................................................................................... 7 e) Rental income ......................................................................................................................... 7 f) Financial instruments ............................................................................................................... 7 g) Income taxes ......................................................................................................................... 12 h) Property and equipment ........................................................................................................ 12 i) Foreign currency translation .................................................................................................. 12 j) Leased assets ....................................................................................................................... 13 k) Intangible assets ................................................................................................................... 13 l) Provisions .............................................................................................................................. 13 m) Critical accounting estimates and judgements ....................................................................... 13 n) Accounting standards and amendments issued but not yet adopted ..................................... 14
4. Liquidity pool ................................................................................................................................ 16 5. Income taxes ................................................................................................................................ 17 6. Intermediation pool ....................................................................................................................... 21 7. Property and equipment ............................................................................................................... 22 8. Share capital ................................................................................................................................ 23 9. Gains (losses) on financial instruments ........................................................................................ 24 10. Net operating recovery (expense) ................................................................................................ 25 11. Related party transactions ............................................................................................................ 26 12. Pension Plan ................................................................................................................................ 26 13. Commitments ............................................................................................................................... 27 14. Assets pledged as collateral ......................................................................................................... 27 15. Indemnifications ........................................................................................................................... 27 16. Risk management ........................................................................................................................ 28
a) Credit risk .............................................................................................................................. 29 b) Liquidity risk ........................................................................................................................... 34 c) Interest rate risk ..................................................................................................................... 35 d) Foreign exchange risk ........................................................................................................... 37
17. Fair value measurements ............................................................................................................. 38 18. Offsetting of financial instruments ................................................................................................. 41 19. Capital management .................................................................................................................... 42 20. Investment in Celero..................................................................................................................... 43 21. Comparative figures ..................................................................................................................... 44

2
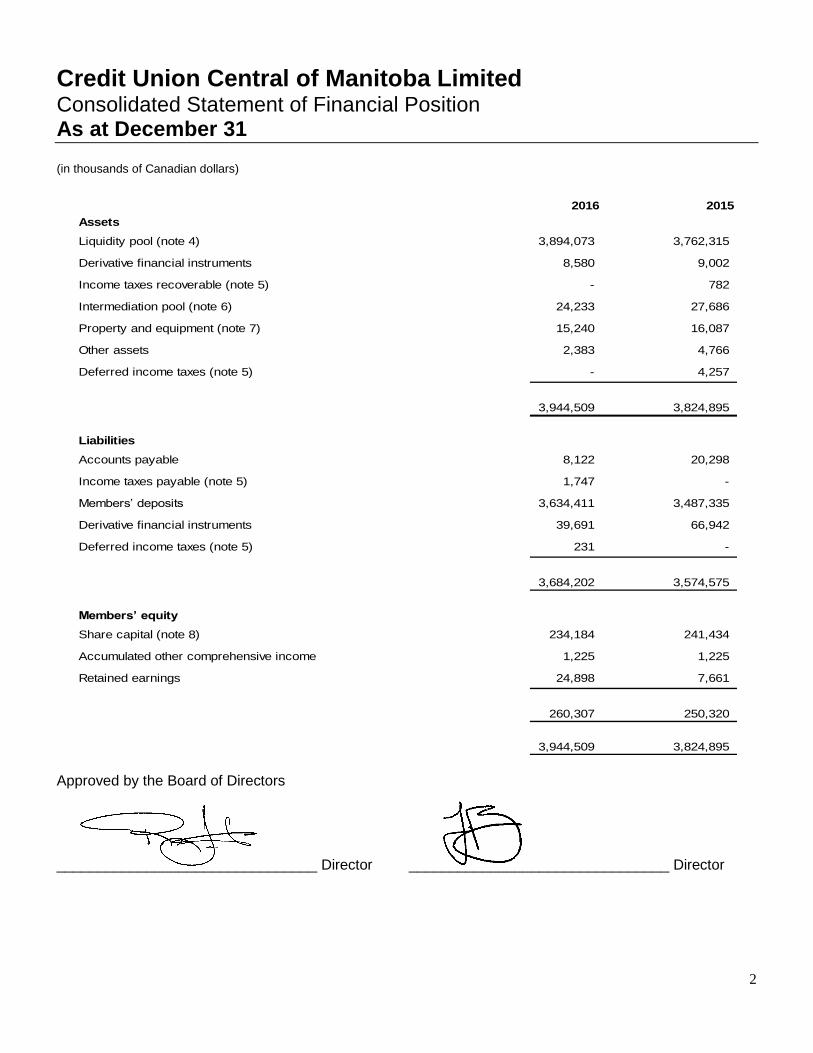
Credit Union Central of Manitoba Limited Consolidated Statement of Financial Position As at December 31 (in thousands of Canadian dollars)
2016 2015
Assets
Liquidity pool (note 4) 3,894,073 3,762,315
Derivative financial instruments 8,580 9,002
Income taxes recoverable (note 5) - 782
Intermediation pool (note 6) 24,233 27,686
Property and equipment (note 7) 15,240 16,087
Other assets 2,383 4,766
Deferred income taxes (note 5) - 4,257
3,944,509 3,824,895
Liabilities
Accounts payable 8,122 20,298
Income taxes payable (note 5) 1,747 -
Members’ deposits 3,634,411 3,487,335
Derivative financial instruments 39,691 66,942
Deferred income taxes (note 5) 231 -
3,684,202 3,574,575
Members’ equity
Share capital (note 8) 234,184 241,434
Accumulated other comprehensive income 1,225 1,225
Retained earnings 24,898 7,661
260,307 250,320
3,944,509 3,824,895 Approved by the Board of Directors ________________________________ Director ________________________________ Director

Credit Union Central of Manitoba Limited Consolidated Statement of Operations and Comprehensive Income (Loss) For the year ended December 31 (in thousands of Canadian dollars)
3
2016 2015
Financial revenue
Liquidity pool 88,021 78,830
Intermediation pool 660 892
88,681 79,722
Cost of funds 28,705 27,135
59,976 52,587
Unrealized losses on non-derivative financial
instruments (note 9)(11,756) (448)
Unrealized gains (losses) on derivative financial
instruments (note 9)32,811 (24,389)
Net cost of derivative financial instruments (note 9) (21,437) 11,374 (21,861) (46,250)
(382) (46,698)
Financial margin 59,594 5,889
Other income
Share of Celero’s income (note 3 f) iii) 1,437 1,251
Share of NEI's income (note 3 f) iii) 506 262
Rental income – net 297 176
Net operating recovery (note 10) 48 473
2,288 2,162
Income before credit union patronage distributions 61,882 8,051
Credit union distributions
Financial margin distribution (32,683) (25,455)
Distribution of Celero’s income (note 3 f) iii) (1,437) (1,251)
Distribution of NEI's income (note 3 f) iii) (506) (262)
(34,626) (26,968)
Income (loss) before income taxes 27,256 (18,917)
Income tax expense (recovery) (note 5) 4,039 (4,501)
Net income (loss) for the year 23,217 (14,416)
Other comprehensive income
Change in unrealized gains on available-for-sale assets - -
Comprehensive income (loss) 23,217 (14,416)

Credit Union Central of Manitoba Limited Consolidated Statement of Members’ Equity For the year ended December 31 (in thousands of Canadian dollars)
4
Share
Capital
Accumulated
Other
Comprehensive
Income
Retained
Earnings Total
Balance at December 31, 2014 151,943 1,225 27,159 180,327
Net loss for the year - - (14,416) (14,416)
Dividends to members - - (5,082) (5,082)
Members' shares issued (note 8) 89,491 - - 89,491
Balance at December 31, 2015 241,434 1,225 7,661 250,320
Balance at December 31, 2015 241,434 1,225 7,661 250,320
Net income for the year - - 23,217 23,217
Dividends to members - - (5,980) (5,980)
Members' shares redeemed (note 8) (7,250) - - (7,250)
Balance at December 31, 2016 234,184 1,225 24,898 260,307

Credit Union Central of Manitoba Limited Consolidated Statement of Cash Flows For the year ended December 31 (in thousands of Canadian dollars)
5
2016 2015
Cash provided by (used in)
Operating activities
Net income (loss) for the year 23,217 (14,416)
Items not affecting cash
Unrealized losses (gains) on FVTPL financial instruments (21,055) 24,837
Depreciation of property and equipment (note 7) 1,486 1,595
Loss on disposal of property and equipment (note 7) 1 206
Deferred income tax expense (recovery) 4,488 (4,117)
Increase in liquidity pool assets (205,145) (1,039,725)
Net change in derivative financial instruments 5,982 10,261
Decrease in intermediation pool assets 3,453 44,453
Increase in members' deposits 149,418 950,496
Decrease in repurchase agreements - (80,210)
Net change in other assets and accounts payable (7,264) 7,077
(45,419) (99,543)
Investing activities
Acquisition of property and equipment (note 7) (640) (701)
(640) (701)
Financing activities
Members’ shares issued (redeemed) (note 8) (7,250) 89,491
Dividends to members (5,980) (5,082)
(13,230) 84,409
Decrease in cash (59,289) (15,835)
Cash - Beginning of year 68,161 83,996
Cash - End of year 8,872 68,161
Supplementary cash flow information
Income tax paid 38 65
Income tax received 2,360 1,691
Credit Union Central of Manitoba Limited Notes to Consolidated Financial Statements December 31, 2016 (in thousands of Canadian dollars)
6
1 General information
Credit Union Central of Manitoba (the “Organization”) is incorporated under The Credit Unions And
Caisses Populaires Act (“CUCP Act”) of Manitoba and is domiciled in Canada. The address of its
registered office is 317 Donald St., Winnipeg, Manitoba, Canada. The Organization is the trade
association and service provider to Manitoba credit unions. The Organization manages liquidity
reserves, monitors credit granting procedures and provides trade services in areas such as corporate
governance, government relations, representation and advocacy. The Organization also provides
payment and settlement services, banking, treasury, human resources, market research,
communications, marketing, planning, lending, product/service research and development, business
consulting, and legal services to Manitoba credit unions. Manitoba credit unions jointly own the
Organization and the Organization’s operations are financed through assessments and fee income.
2 Basis of preparation
The Organization prepares its consolidated financial statements in accordance with the
Cooperative Credit Associations Act (“CCA Act”), which requires them to be in accordance with
Canadian generally accepted accounting principles as defined in Part 1 of the CPA Canada
Handbook - Accounting (International Financial Reporting Standards (“IFRS”)), except as
otherwise specified by the Office of the Superintendent of Financial Institutions Canada (“OSFI”).
The significant accounting policies used in the preparation of the consolidated financial statements
are summarized below.
These consolidated financial statements were approved by the Board of Directors for issue on February
23, 2017.
3 Summary of significant accounting policies
The significant accounting policies used in the preparation of these consolidated financial
statements are set out below. These policies have been consistently applied to all years
presented, unless otherwise stated.
a) Basis of measurement
The consolidated financial statements have been prepared using amortized cost, except for
certain investments in intermediation pool assets, liquidity pool assets, members’ deposits,
and derivative financial instruments, which are measured at fair value.
b) Consolidation
The financial statements consolidate the accounts of the Organization and its wholly owned
subsidiary, 317 Donald Inc. Subsidiaries are those entities which the Organization controls by
having the power to govern the financial and operating policies. Subsidiaries are fully
consolidated from the date on which control is obtained and are de-consolidated from the date
that control ceases. Intercompany transactions, balances, income and expenses, and profits and
losses are eliminated.

Credit Union Central of Manitoba Limited Notes to Consolidated Financial Statements December 31, 2016 (in thousands of Canadian dollars)
7
c) Investments in associates
Associates are entities over which the Organization exercises significant influence, but not
control. The Organization accounts for its investment in associates using the equity method.
The Organization’s share of profits or losses of associates is recognized in the consolidated
statement of operations.
Unrealized gains on transactions between the Organization and its associates are eliminated
to the extent of the Organization’s interest in the associates. Unrealized losses are also
eliminated unless the transaction provides evidence of an impairment of the asset transferred.
Dilution gains and losses arising from changes in interests of the Organization in associates
are recognized in the consolidated statement of operations.
For investments in associates, a significant or prolonged decline in fair value of the investment
below its carrying value is evidence that the investment is impaired. The impairment loss is the
difference between the carrying value and its recoverable amount at the measurement date.
The recoverable amount is the higher of an investment’s fair value less costs of disposal and
its value in use.
d) Recoveries from member credit unions
Revenue from the provision of services to members is recognized when earned, specifically
when amounts are fixed or can be determined and the ability to collect is reasonably assured.
e) Rental income
Third-party rental income related to the operations of 317 Donald Inc. are disclosed separately
in the consolidated statement of operations and comprehensive income. Rental income is
recognized when earned, specifically when amounts are fixed or can be determined and the
ability to collect is reasonably assured.
f) Financial instruments
Financial instruments, other than those required to be classified as held for trading, may be
classified on a voluntary and irrevocable basis as fair value through profit and loss (“FVTPL”)
provided that such classification:
eliminates or significantly reduces a measurement or recognition inconsistency that would
otherwise arise from measuring assets or liabilities or recognizing the related gains and
losses on different bases; and
allows for reliable measurement of the fair value of the financial instruments classified as
FVTPL.
Credit Union Central of Manitoba Limited Notes to Consolidated Financial Statements December 31, 2016 (in thousands of Canadian dollars)
8
The Organization has met the above requirements and has elected to classify certain of its
financial instruments as FVTPL as detailed below.
i. Liquidity pool
Investments held for trading
Financial instruments are classified as held for trading if they are a derivative or acquired
principally for selling or repurchasing in the near term or managed together for which there is
evidence of a recent pattern of short term profit taking. The Organization’s derivative financial
instruments are the only investments required to be classified as held for trading (note 3 f) ii).
Investments classified as FVTPL
These investments are recorded at their fair value initially using the trade date for recognizing
transactions and thereafter based on inputs other than quoted prices that are observable either
directly or indirectly. Interest income earned, amortization of premiums and discounts,
dividends received as well as realized gains and losses are included in financial revenue -
liquidity pool using the accrual basis of accounting. Gains and losses arising from subsequent
market valuations are recognized in the consolidated statement of operations and
comprehensive income in unrealized gains (losses) on non-derivative instruments.
Cash and cash equivalents
Cash and cash equivalents consists of cash, deposits and overdrafts with financial institutions.
Bank overdrafts are included as a component of cash as they represent an integral part of the
Organization's cash management. Cash and cash equivalents are classified as loans and
receivables and are carried at amortized cost, which is equivalent to fair value.
Transaction costs
All transaction costs are expensed as incurred for assets and liabilities classified as held for
trading and classified as FVTPL. Transaction costs for all other financial assets are included
in the initial carrying amount.
ii. Derivative financial instruments
Interest rate swap agreements
The Organization enters into interest rate swap agreements in order to manage its exposure
to changes in interest rates.
Additionally, the Organization, in its role as a financial intermediary, enters into interest rate
swap agreements with and at the direction of member credit unions. Concurrently, the
Organization enters into a mirroring counter agreement with a third party financial institution.
Credit Union Central of Manitoba Limited Notes to Consolidated Financial Statements December 31, 2016 (in thousands of Canadian dollars)
9
These agreements are recorded at their fair value based on a discounted cash flow
methodology using observable market inputs. Cash flows on both the receiving and paying leg
of the interest rate swap agreements are included in net cost of derivative financial instruments
used to manage interest rate risk (note 16 c). The fair value of interest rate swap agreements
is recorded in derivative financial instruments assets or liabilities, as appropriate, on the
consolidated statement of financial position with the corresponding gain or loss included in
unrealized gains (losses) on derivative financial instruments.
Foreign exchange forward rate agreements
The Organization enters into foreign exchange forward rate agreements in order to manage
its exposure to changes in foreign exchange rates.
Additionally, the Organization, in its role as a financial intermediary, also enters into foreign
exchange forward rate agreements with and at the direction of member credit unions.
Concurrently, the Organization may enter into a mirroring counter agreement with a third party
financial institution.
Foreign exchange forward rate agreements are recorded at their fair value based on a
discounted cash flow methodology using observable market inputs. The fair value of foreign
exchange forward rate agreements is recorded in derivative financial instruments assets or
liabilities, as appropriate, on the consolidated statement of financial position with the
corresponding gain or loss included in financial revenue - liquidity pool.
Embedded derivatives
A derivative instrument may be embedded in another financial instrument (“the host
instrument”). Embedded derivatives are treated as separate derivative financial instruments
when their economic characteristics and risks are not clearly and closely related to those of
the host instrument, the terms of the embedded derivatives are the same as those of a stand-
alone derivative financial instrument, and the combined contract is not classified as held for
trading or FVTPL. Embedded derivatives would be accounted for at fair value on the
consolidated statement of financial position and changes in fair value would be recorded on
the consolidated statement of operations and comprehensive income. The Organization
determined that no embedded derivatives require separation from the host instrument for the
periods presented.
iii. Intermediation pool
Equity instruments are classified as available for sale and are initially recognized at fair value
plus transaction costs that are directly attributable to their acquisition using the trade date for
recognizing transactions. Subsequently they are carried at fair value with changes in fair value
recorded in Other Comprehensive Income, unless they do not have a quoted market price in
an active market and fair value is not reliably determinable in which case they are carried at
cost.

Credit Union Central of Manitoba Limited Notes to Consolidated Financial Statements December 31, 2016 (in thousands of Canadian dollars)
10
All other instruments are classified as loans and receivables and are recorded at amortized
cost using the effective interest method. Interest and dividend income earned is included in
financial revenue - intermediation pool using the accrual basis of accounting. Accrued interest
or dividends receivable are included with the corresponding principal balance.
Investment in Celero Solutions (“Celero”)
Celero is an unincorporated operation domiciled in Canada that provides information
technology services to the Organization, credit unions and other organizations. Pursuant to its
agreement with the other investees, the Organization has a 331/3% ownership interest in Celero
which in turn has a 49% ownership interest in Everlink Payment Services Inc. (“Everlink”), an
incorporated entity that provides electronic switching services.
The Organization accounts for its investment in Celero using the equity method. The
Organization’s share of Celero’s net income (loss) is based upon the net income (loss) of the
business lines that the Organization and its member credit unions contributed to and its
ownership interest in the net income (loss) of Celero’s remaining activities.
Member credit unions that receive services through Celero are the beneficial owners of the
Organization’s interest therein. Accordingly, the Organization records an offsetting expense
and an amount distributable to member credit unions equal to its share of Celero’s net income.
Conversely, should Celero incur a net loss from operations, the Organization records an
offsetting contribution and an amount recoverable from its member credit unions.
Investment in Northwest & Ethical Investments L.P. (“NEI”)
NEI is an incorporated mutual fund company domiciled in Canada and is accounted for as an
available for sale investment accounted for at cost. The Organization has a 4.96% ownership
interest in NEI.
iv. Impairment of financial assets
At each reporting date, the Organization assesses whether there is objective evidence that
a financial asset, other than a financial asset classified as held for trading or FVTPL, is
impaired.
The criteria used to determine if there is objective evidence of an impairment loss include:
(i) significant financial difficulty of the obligor;
(ii) delinquencies in interest or principal payments; or
(iii) it becomes probable that the borrower will enter bankruptcy or other financial
reorganization.
For an equity security, a significant or prolonged decline in the fair value of the security below
its carrying value is also evidence that the asset is impaired. If such evidence exists, the

Credit Union Central of Manitoba Limited Notes to Consolidated Financial Statements December 31, 2016 (in thousands of Canadian dollars)
11
Organization recognizes an impairment loss. The impairment loss is the difference between
the carrying value of the asset and its fair value at the measurement date.
For financial assets carried at amortized cost, the impairment loss is the difference between
the amortized cost of the loan or receivable and the present value of the estimated future
cash flows, discounted using the instrument’s original effective interest rate. The carrying
amount of the asset is reduced by this amount either directly or indirectly through the use of
an allowance account.
Impairment losses on financial assets carried at amortized cost are reversed in subsequent
periods if the amount of the loss decreases and the decrease can be related objectively to an
event occurring after the impairment was recognized. Impairment losses on available-for-sale
equity instruments are not reversed.
v. Members’ deposits
Members’ deposits are classified as FVTPL and recorded at their fair value initially using the
trade date for recognizing transactions. Members’ deposits are redeemable at the option of
credit unions and are recorded at the amount payable on demand. The amount payable on
demand is computed by discounting contractual cash flows as follows:
for terms less than 13 months, using prevailing banker’s acceptance rates offered by the
Organization; and
for terms greater than 13 months, using the corresponding market yield on Schedule 1
bank senior debt.
Interest expense is included in cost of funds using the accrual basis of accounting. Gains and
losses arising from subsequent market valuations are recognized as unrealized gains (losses)
on non-derivative instruments.
vi. Offsetting of financial instruments
Financial assets and liabilities are offset and the net amount reported in the consolidated
statement of financial position where the Organization currently has a legally enforceable right
to offset the recognized amounts and there is an intention to settle on a net basis or realize
the asset and settle the liability simultaneously. In the normal course of business, the
Organization enters into various master netting agreements or other similar agreements that
do not meet the criteria for offsetting in the consolidated statement of financial position but still
allow for the related amounts to be offset in certain circumstances, such as bankruptcy or the
termination of the contracts (note 18).
vii. Obligations under repurchase agreements
The Organization enters into short-term sales of securities under agreements to repurchase
at predetermined prices and dates. The corresponding securities under these agreements
continue to be recorded in liquidity pool assets on the consolidated statement of financial

Credit Union Central of Manitoba Limited Notes to Consolidated Financial Statements December 31, 2016 (in thousands of Canadian dollars)
12
position. The obligations are classified as FVTPL and are recorded at fair value initially and
thereafter using the trade date for recognizing transactions. These agreements are treated as
collateralized borrowing transactions. Interest incurred on the obligation is reported in cost of
funds using the effective interest method.
g) Income taxes
The asset and liability method is used to account for deferred income taxes. Under this method,
deferred income tax assets and liabilities are recognized for the estimated future tax consequences
attributable to differences between the financial statement carrying amounts and the tax bases of
assets and liabilities. Deferred income tax assets and liabilities are measured using substantively
enacted tax rates in effect for the year in which those temporary differences are expected to be
recovered or settled. The effect of a change in tax rates on deferred income tax assets and liabilities
is recognized in the consolidated statement of operations and comprehensive income in the period
that includes the substantive enactment date. Deferred income tax assets are recognized to the
extent that realization is considered probable. Management periodically evaluates positions taken
in tax returns with respect to situations in which applicable tax regulation is subject to interpretation.
It establishes provisions where appropriate on the basis of amounts expected to be paid to the tax
authorities.
h) Property and equipment
Property and equipment is initially recorded at cost and subsequently measured at cost less
accumulated depreciation and any accumulated impairment losses with the exception of land which
is not depreciated. Depreciation is recognized by the Organization at rates and on bases
determined to charge the cost of property and equipment over its estimated useful life using the
straight-line method as follows:
Technology 3 to 10 years Furniture and equipment 5 to 10 years Leasehold improvements remaining term of the lease Building 50 years
Depreciation methods, useful lives and residual values are reviewed annually and adjusted if
necessary. Costs for property and equipment under development include direct development costs.
Direct development costs include overhead and interest, as applicable. Capitalization of costs
ceases and depreciation commences when the property and equipment is available for use.
i) Foreign currency translation
At the transaction date, each asset, liability, revenue and expense denominated in a foreign
currency is translated into Canadian dollars by the use of the exchange rate in effect at that date.
At the year-end date, unsettled monetary assets and liabilities are translated into Canadian dollars
by using the exchange rate in effect at the year-end date and the related translation differences are
recognized in financial margin.
Credit Union Central of Manitoba Limited Notes to Consolidated Financial Statements December 31, 2016 (in thousands of Canadian dollars)
13
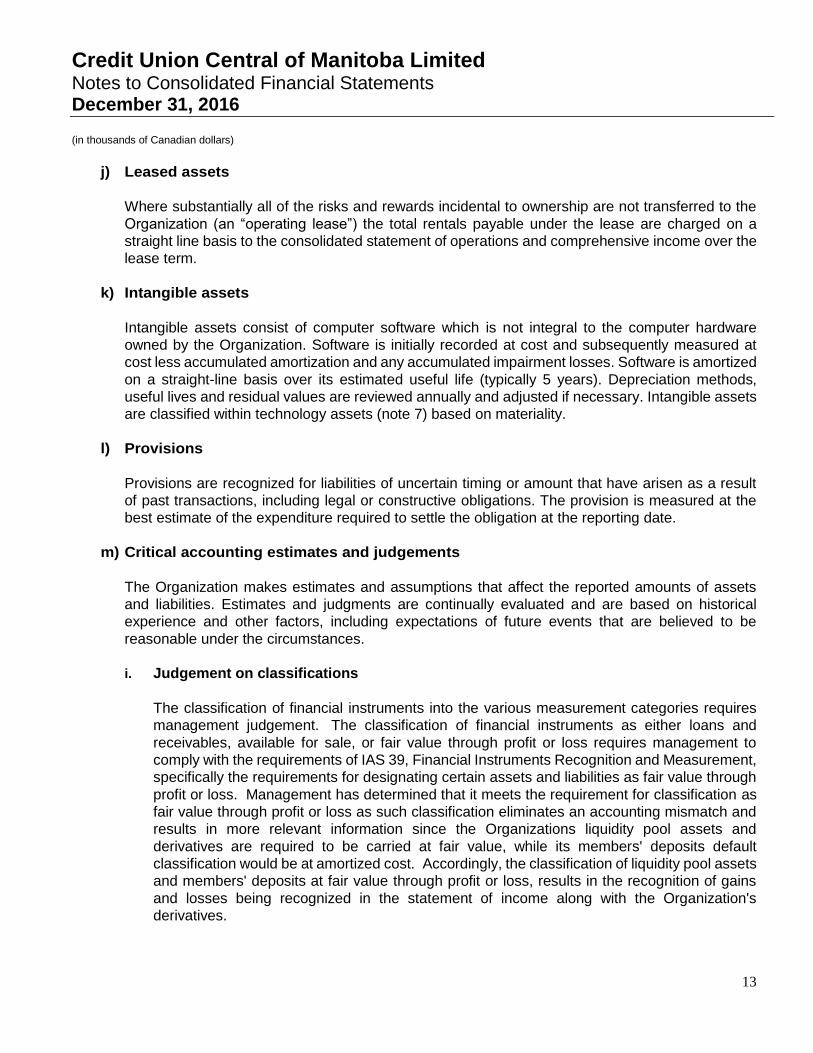
j) Leased assets
Where substantially all of the risks and rewards incidental to ownership are not transferred to the
Organization (an “operating lease”) the total rentals payable under the lease are charged on a
straight line basis to the consolidated statement of operations and comprehensive income over the
lease term.
k) Intangible assets
Intangible assets consist of computer software which is not integral to the computer hardware
owned by the Organization. Software is initially recorded at cost and subsequently measured at
cost less accumulated amortization and any accumulated impairment losses. Software is amortized
on a straight-line basis over its estimated useful life (typically 5 years). Depreciation methods,
useful lives and residual values are reviewed annually and adjusted if necessary. Intangible assets
are classified within technology assets (note 7) based on materiality.
l) Provisions
Provisions are recognized for liabilities of uncertain timing or amount that have arisen as a result
of past transactions, including legal or constructive obligations. The provision is measured at the
best estimate of the expenditure required to settle the obligation at the reporting date.
m) Critical accounting estimates and judgements
The Organization makes estimates and assumptions that affect the reported amounts of assets
and liabilities. Estimates and judgments are continually evaluated and are based on historical
experience and other factors, including expectations of future events that are believed to be
reasonable under the circumstances.
i. Judgement on classifications
The classification of financial instruments into the various measurement categories requires
management judgement. The classification of financial instruments as either loans and
receivables, available for sale, or fair value through profit or loss requires management to
comply with the requirements of IAS 39, Financial Instruments Recognition and Measurement,
specifically the requirements for designating certain assets and liabilities as fair value through
profit or loss. Management has determined that it meets the requirement for classification as
fair value through profit or loss as such classification eliminates an accounting mismatch and
results in more relevant information since the Organizations liquidity pool assets and
derivatives are required to be carried at fair value, while its members' deposits default
classification would be at amortized cost. Accordingly, the classification of liquidity pool assets
and members' deposits at fair value through profit or loss, results in the recognition of gains
and losses being recognized in the statement of income along with the Organization's
derivatives.
Credit Union Central of Manitoba Limited Notes to Consolidated Financial Statements December 31, 2016 (in thousands of Canadian dollars)
14
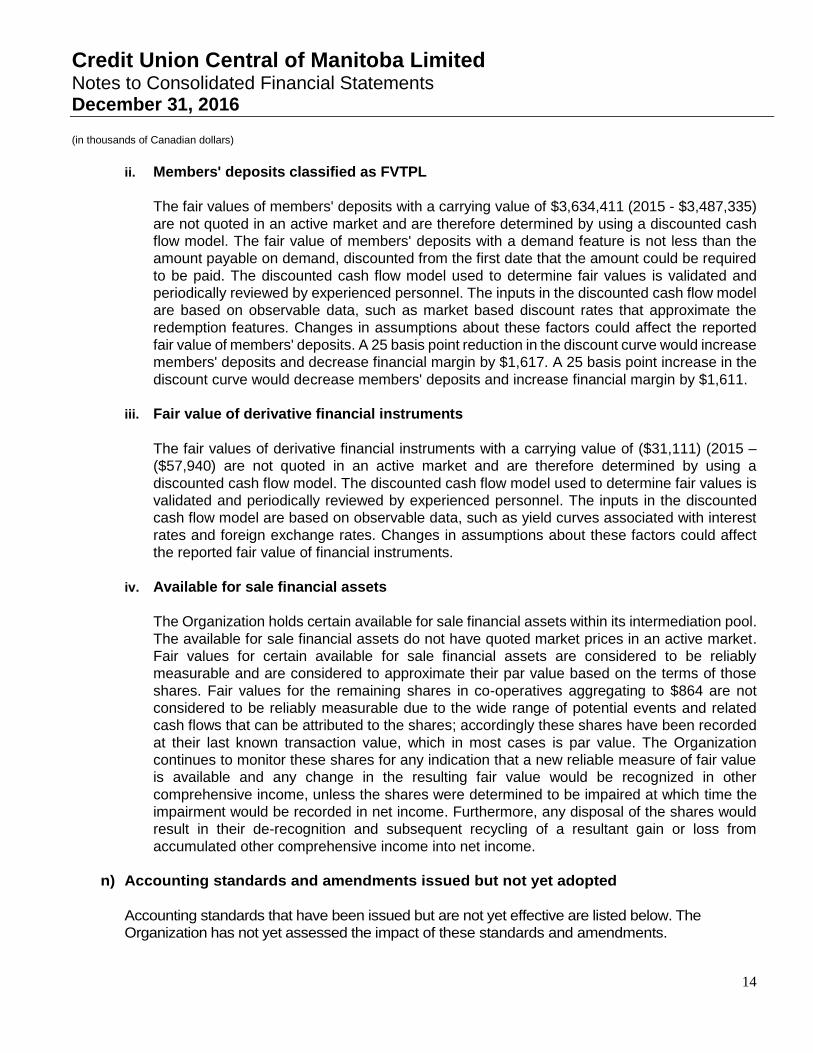
ii. Members' deposits classified as FVTPL
The fair values of members' deposits with a carrying value of $3,634,411 (2015 - $3,487,335)
are not quoted in an active market and are therefore determined by using a discounted cash
flow model. The fair value of members' deposits with a demand feature is not less than the
amount payable on demand, discounted from the first date that the amount could be required
to be paid. The discounted cash flow model used to determine fair values is validated and
periodically reviewed by experienced personnel. The inputs in the discounted cash flow model
are based on observable data, such as market based discount rates that approximate the
redemption features. Changes in assumptions about these factors could affect the reported
fair value of members' deposits. A 25 basis point reduction in the discount curve would increase
members' deposits and decrease financial margin by $1,617. A 25 basis point increase in the
discount curve would decrease members' deposits and increase financial margin by $1,611.
iii. Fair value of derivative financial instruments
The fair values of derivative financial instruments with a carrying value of ($31,111) (2015 –
($57,940) are not quoted in an active market and are therefore determined by using a
discounted cash flow model. The discounted cash flow model used to determine fair values is
validated and periodically reviewed by experienced personnel. The inputs in the discounted
cash flow model are based on observable data, such as yield curves associated with interest
rates and foreign exchange rates. Changes in assumptions about these factors could affect
the reported fair value of financial instruments.
iv. Available for sale financial assets
The Organization holds certain available for sale financial assets within its intermediation pool.
The available for sale financial assets do not have quoted market prices in an active market.
Fair values for certain available for sale financial assets are considered to be reliably
measurable and are considered to approximate their par value based on the terms of those
shares. Fair values for the remaining shares in co-operatives aggregating to $864 are not
considered to be reliably measurable due to the wide range of potential events and related
cash flows that can be attributed to the shares; accordingly these shares have been recorded
at their last known transaction value, which in most cases is par value. The Organization
continues to monitor these shares for any indication that a new reliable measure of fair value
is available and any change in the resulting fair value would be recognized in other
comprehensive income, unless the shares were determined to be impaired at which time the
impairment would be recorded in net income. Furthermore, any disposal of the shares would
result in their de-recognition and subsequent recycling of a resultant gain or loss from
accumulated other comprehensive income into net income.
n) Accounting standards and amendments issued but not yet adopted
Accounting standards that have been issued but are not yet effective are listed below. The
Organization has not yet assessed the impact of these standards and amendments.
Credit Union Central of Manitoba Limited Notes to Consolidated Financial Statements December 31, 2016 (in thousands of Canadian dollars)
15
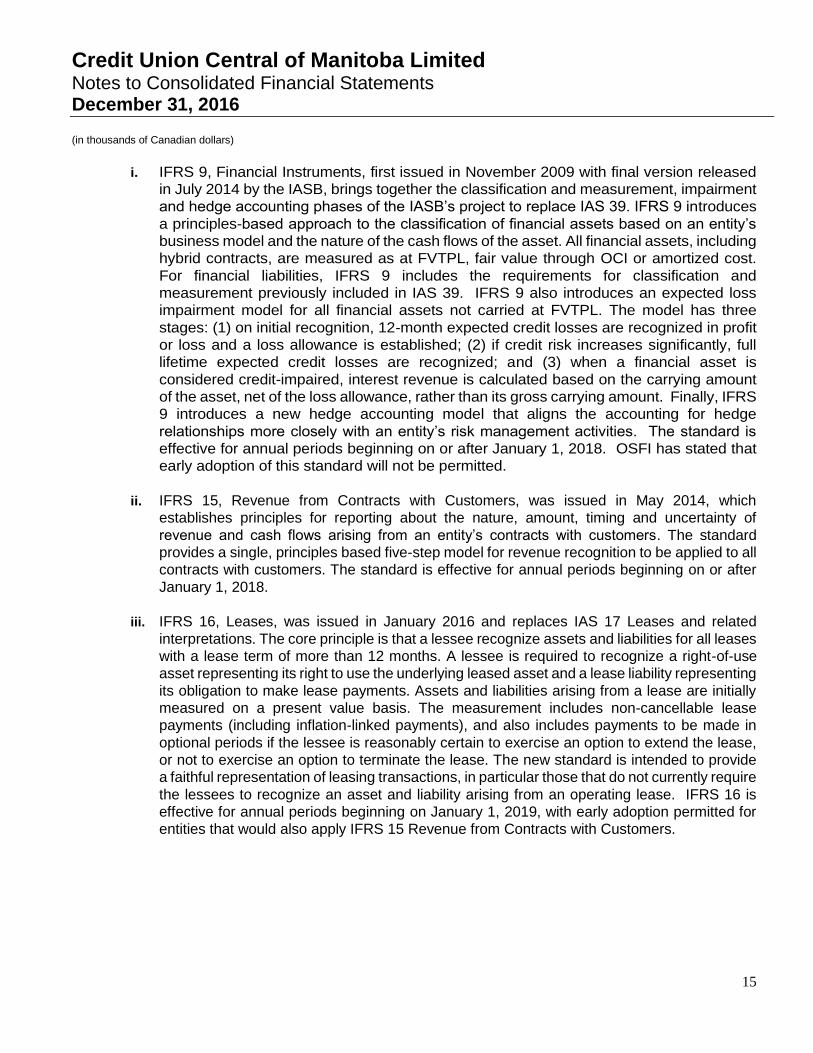
i. IFRS 9, Financial Instruments, first issued in November 2009 with final version released
in July 2014 by the IASB, brings together the classification and measurement, impairment
and hedge accounting phases of the IASB’s project to replace IAS 39. IFRS 9 introduces
a principles-based approach to the classification of financial assets based on an entity’s
business model and the nature of the cash flows of the asset. All financial assets, including
hybrid contracts, are measured as at FVTPL, fair value through OCI or amortized cost.
For financial liabilities, IFRS 9 includes the requirements for classification and
measurement previously included in IAS 39. IFRS 9 also introduces an expected loss
impairment model for all financial assets not carried at FVTPL. The model has three
stages: (1) on initial recognition, 12-month expected credit losses are recognized in profit
or loss and a loss allowance is established; (2) if credit risk increases significantly, full
lifetime expected credit losses are recognized; and (3) when a financial asset is
considered credit-impaired, interest revenue is calculated based on the carrying amount
of the asset, net of the loss allowance, rather than its gross carrying amount. Finally, IFRS
9 introduces a new hedge accounting model that aligns the accounting for hedge
relationships more closely with an entity’s risk management activities. The standard is
effective for annual periods beginning on or after January 1, 2018. OSFI has stated that
early adoption of this standard will not be permitted.
ii. IFRS 15, Revenue from Contracts with Customers, was issued in May 2014, which
establishes principles for reporting about the nature, amount, timing and uncertainty of
revenue and cash flows arising from an entity’s contracts with customers. The standard
provides a single, principles based five-step model for revenue recognition to be applied to all
contracts with customers. The standard is effective for annual periods beginning on or after
January 1, 2018.
iii. IFRS 16, Leases, was issued in January 2016 and replaces IAS 17 Leases and related
interpretations. The core principle is that a lessee recognize assets and liabilities for all leases
with a lease term of more than 12 months. A lessee is required to recognize a right-of-use
asset representing its right to use the underlying leased asset and a lease liability representing
its obligation to make lease payments. Assets and liabilities arising from a lease are initially
measured on a present value basis. The measurement includes non-cancellable lease
payments (including inflation-linked payments), and also includes payments to be made in
optional periods if the lessee is reasonably certain to exercise an option to extend the lease,
or not to exercise an option to terminate the lease. The new standard is intended to provide
a faithful representation of leasing transactions, in particular those that do not currently require
the lessees to recognize an asset and liability arising from an operating lease. IFRS 16 is
effective for annual periods beginning on January 1, 2019, with early adoption permitted for
entities that would also apply IFRS 15 Revenue from Contracts with Customers.
Credit Union Central of Manitoba Limited Notes to Consolidated Financial Statements December 31, 2016 (in thousands of Canadian dollars)
16
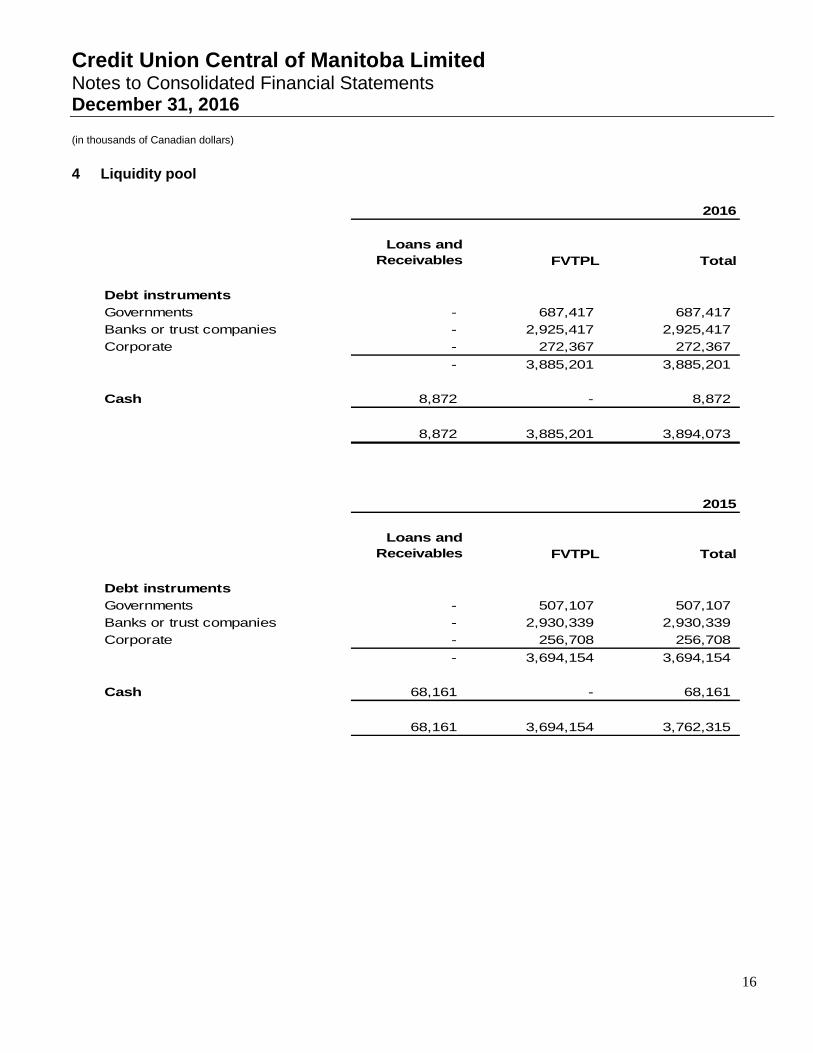
4 Liquidity pool
2016
Loans and
Receivables FVTPL Total
Debt instruments
Governments - 687,417 687,417
Banks or trust companies - 2,925,417 2,925,417
Corporate - 272,367 272,367
- 3,885,201 3,885,201
Cash 8,872 - 8,872
8,872 3,885,201 3,894,073
2015
Loans and
Receivables FVTPL Total
Debt instruments
Governments - 507,107 507,107
Banks or trust companies - 2,930,339 2,930,339
Corporate - 256,708 256,708
- 3,694,154 3,694,154
Cash 68,161 - 68,161
68,161 3,694,154 3,762,315
Credit Union Central of Manitoba Limited Notes to Consolidated Financial Statements December 31, 2016 (in thousands of Canadian dollars)
17
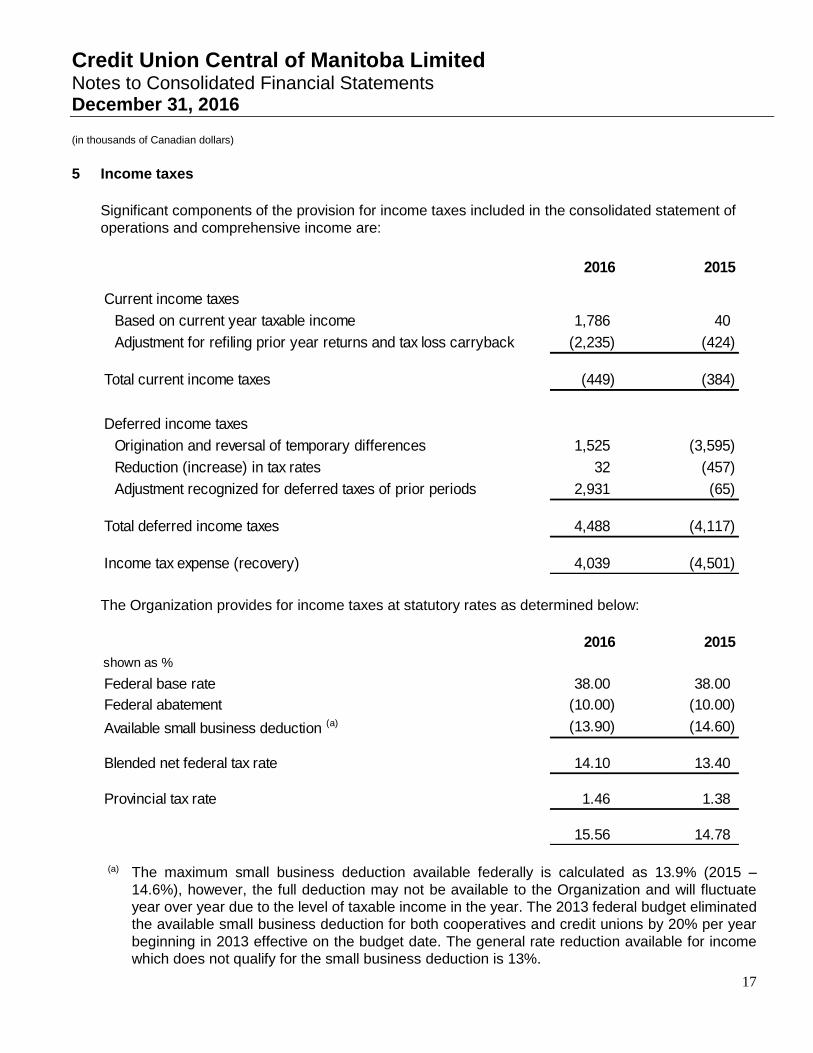
5 Income taxes
Significant components of the provision for income taxes included in the consolidated statement of
operations and comprehensive income are:
2016 2015
Current income taxes
Based on current year taxable income 1,786 40
Adjustment for refiling prior year returns and tax loss carryback (2,235) (424)
Total current income taxes (449) (384)
Deferred income taxes
Origination and reversal of temporary differences 1,525 (3,595)
Reduction (increase) in tax rates 32 (457)
Adjustment recognized for deferred taxes of prior periods 2,931 (65)
Total deferred income taxes 4,488 (4,117)
Income tax expense (recovery) 4,039 (4,501)
The Organization provides for income taxes at statutory rates as determined below:
2016 2015
shown as %
Federal base rate 38.00 38.00
Federal abatement (10.00) (10.00)
Available small business deduction (a) (13.90) (14.60)
Blended net federal tax rate 14.10 13.40
Provincial tax rate 1.46 1.38
15.56 14.78
(a) The maximum small business deduction available federally is calculated as 13.9% (2015 –
14.6%), however, the full deduction may not be available to the Organization and will fluctuate
year over year due to the level of taxable income in the year. The 2013 federal budget eliminated
the available small business deduction for both cooperatives and credit unions by 20% per year
beginning in 2013 effective on the budget date. The general rate reduction available for income
which does not qualify for the small business deduction is 13%.
Credit Union Central of Manitoba Limited Notes to Consolidated Financial Statements December 31, 2016 (in thousands of Canadian dollars)
18
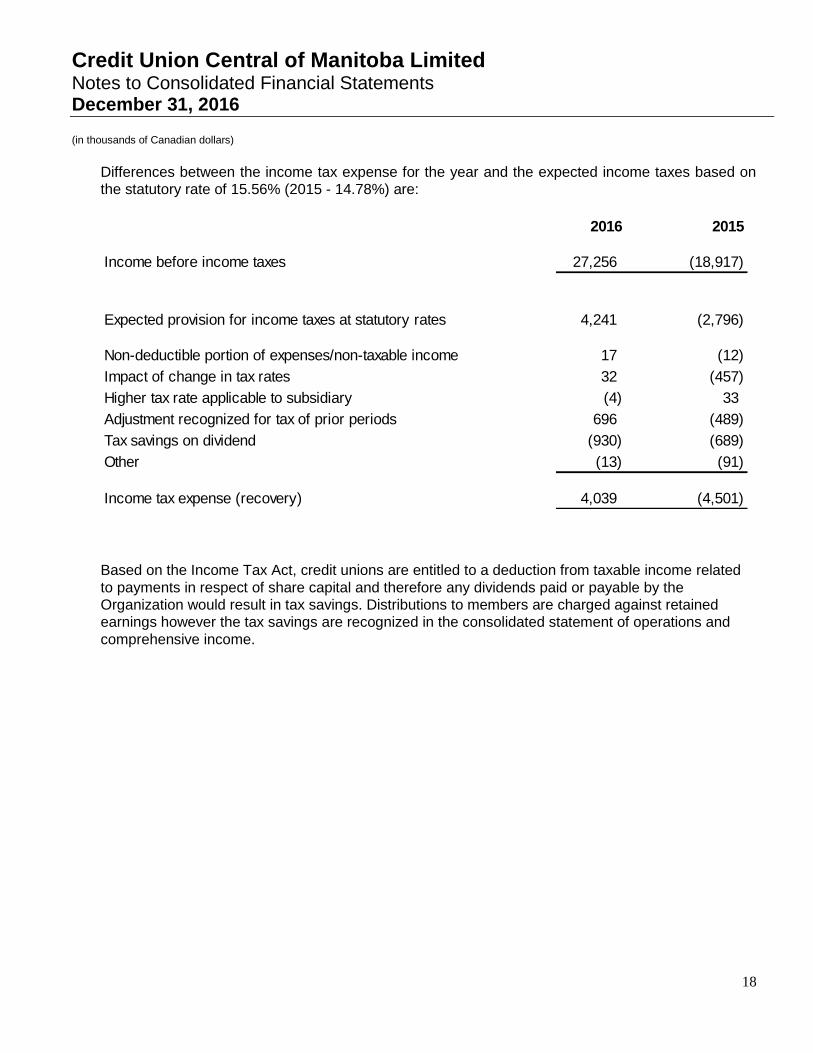
Differences between the income tax expense for the year and the expected income taxes based on
the statutory rate of 15.56% (2015 - 14.78%) are:
2016 2015
Income before income taxes 27,256 (18,917)
Expected provision for income taxes at statutory rates 4,241 (2,796)
Non-deductible portion of expenses/non-taxable income 17 (12)
Impact of change in tax rates 32 (457)
Higher tax rate applicable to subsidiary (4) 33
Adjustment recognized for tax of prior periods 696 (489)
Tax savings on dividend (930) (689)
Other (13) (91)
Income tax expense (recovery) 4,039 (4,501)
Based on the Income Tax Act, credit unions are entitled to a deduction from taxable income related
to payments in respect of share capital and therefore any dividends paid or payable by the
Organization would result in tax savings. Distributions to members are charged against retained
earnings however the tax savings are recognized in the consolidated statement of operations and
comprehensive income.
Credit Union Central of Manitoba Limited Notes to Consolidated Financial Statements December 31, 2016 (in thousands of Canadian dollars)
19
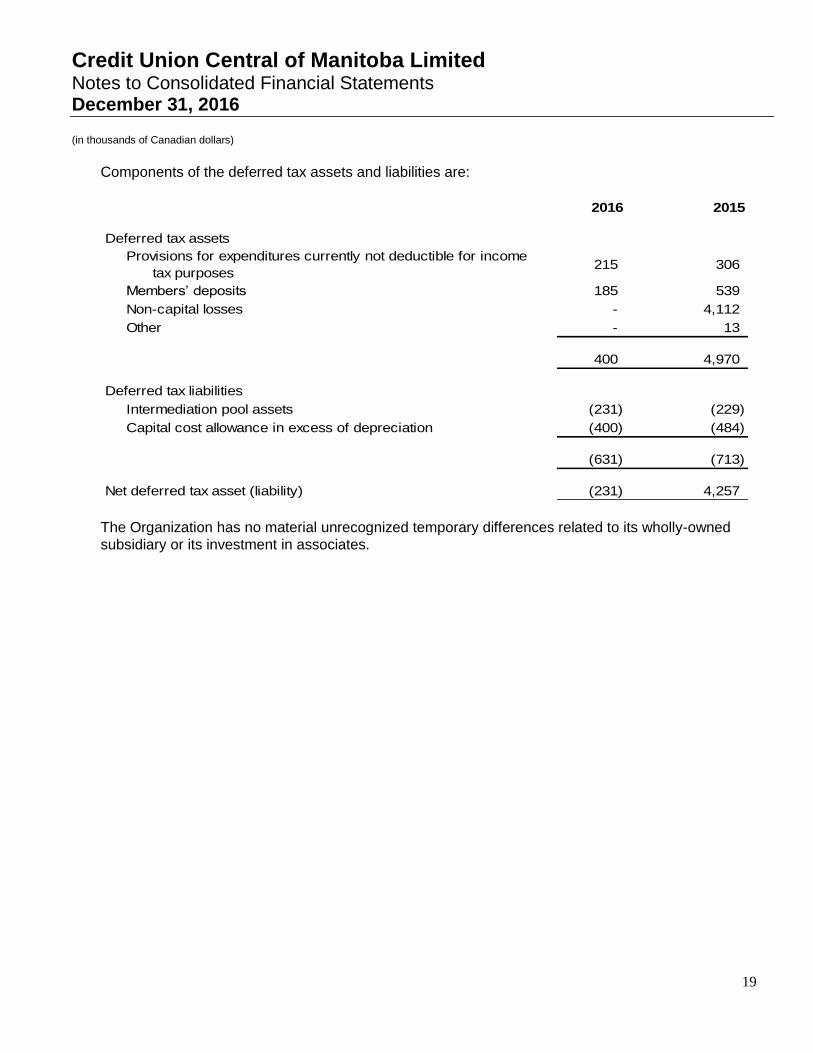
Components of the deferred tax assets and liabilities are:
2016 2015
Deferred tax assets
Provisions for expenditures currently not deductible for income
tax purposes215 306
Members’ deposits 185 539
Non-capital losses - 4,112
Other - 13
400 4,970
Deferred tax liabilities
Intermediation pool assets (231) (229)
Capital cost allowance in excess of depreciation (400) (484)
(631) (713)
Net deferred tax asset (liability) (231) 4,257
The Organization has no material unrecognized temporary differences related to its wholly-owned
subsidiary or its investment in associates.
Credit Union Central of Manitoba Limited Notes to Consolidated Financial Statements December 31, 2016 (in thousands of Canadian dollars)
20
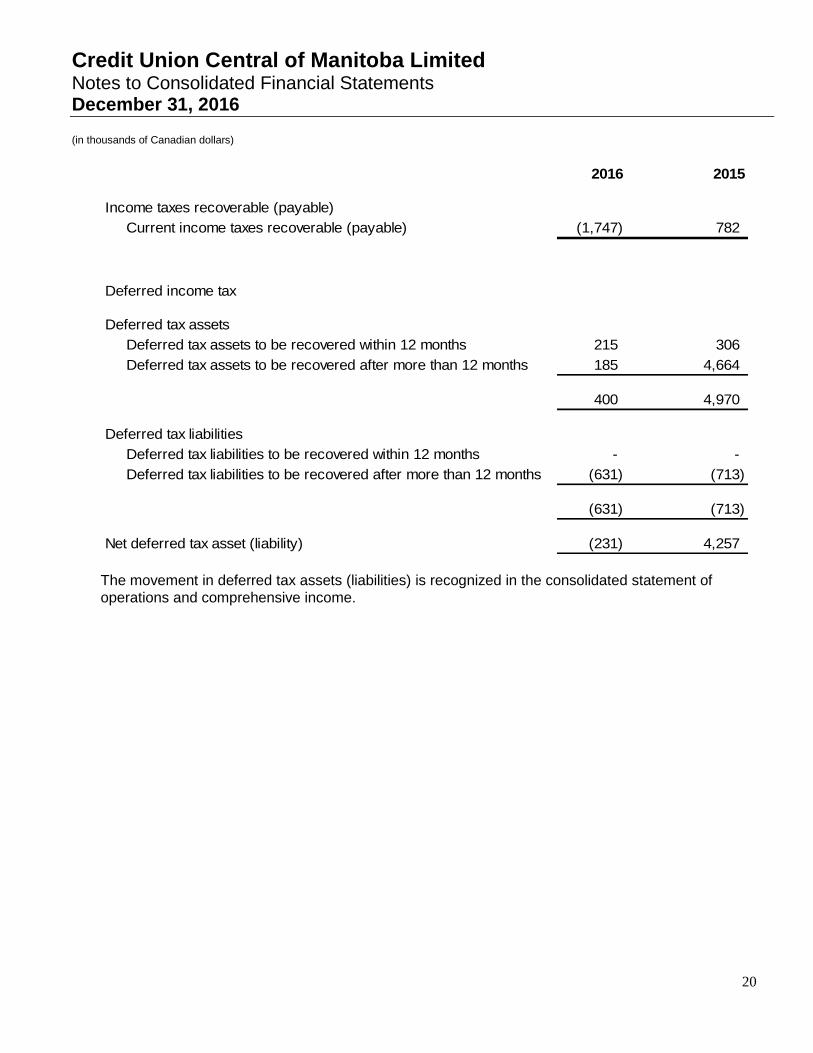
2016 2015
Income taxes recoverable (payable)
Current income taxes recoverable (payable) (1,747) 782
Deferred income tax
Deferred tax assets
Deferred tax assets to be recovered within 12 months 215 306
Deferred tax assets to be recovered after more than 12 months 185 4,664
400 4,970
Deferred tax liabilities
Deferred tax liabilities to be recovered within 12 months - -
Deferred tax liabilities to be recovered after more than 12 months (631) (713)
(631) (713)
Net deferred tax asset (liability) (231) 4,257
The movement in deferred tax assets (liabilities) is recognized in the consolidated statement of
operations and comprehensive income.

Credit Union Central of Manitoba Limited Notes to Consolidated Financial Statements December 31, 2016 (in thousands of Canadian dollars)
21
6 Intermediation pool
2016 2015
Loans and receivables
Member loans
Credit unions 2,500 6,600
Co-operatives 8,740 7,740
Mortgages 769 805
12,009 15,145
Available for sale financial assets
Shares in co-operatives 5,173 5,307
Equity accounted investments
Investment in Celero (note 20)
Loans receivable 3,169 3,620
Capital contribution 3,220 3,220
Accumulated share of income 662 394
7,051 7,234
24,233 27,686
The available for sale financial assets do not have quoted market prices in an active market. For certain
shares, fair value is considered to be reliably measurable and is considered to approximate par value
based on the terms of those shares. For shares where fair value is not considered to be reliably
measurable due to the wide range of potential events and related cash flows that can be attributed to
the shares, the shares have been recorded at their last known transaction value, which in most cases
is par value. The Organization continues to monitor these shares for any indication that a new reliable
measure of fair value is available.
Credit Union Central of Manitoba Limited Notes to Consolidated Financial Statements December 31, 2016 (in thousands of Canadian dollars)
22
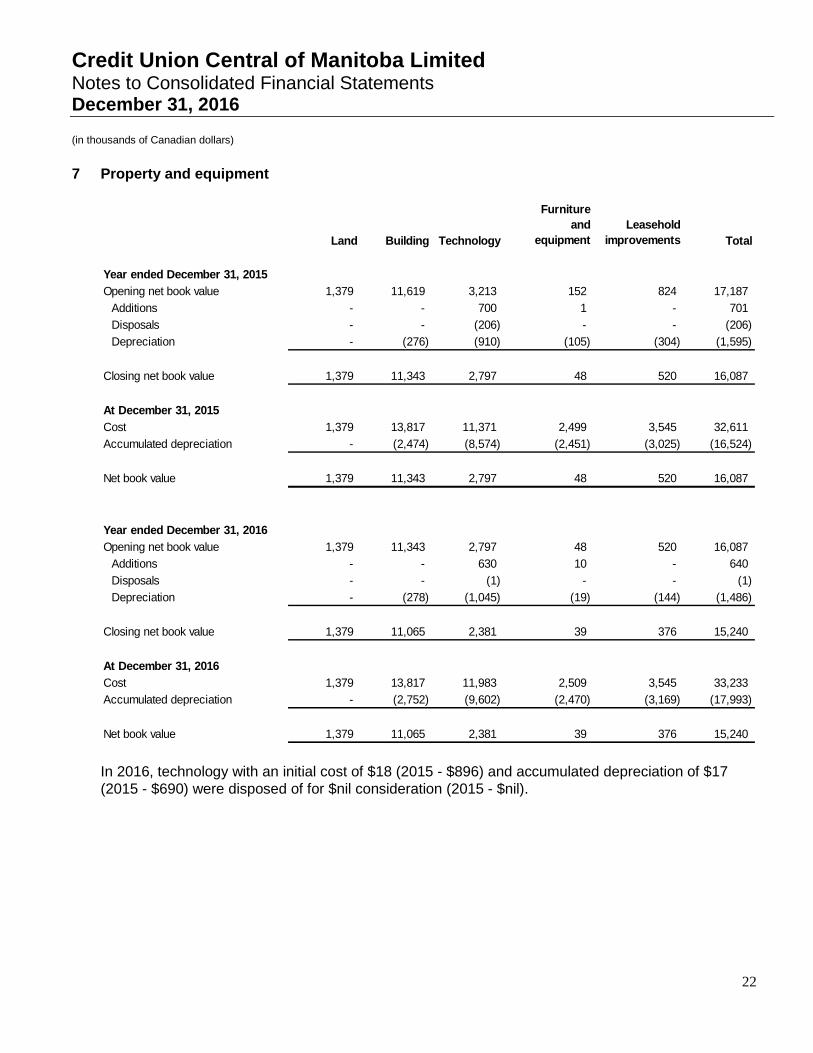
7 Property and equipment
Land Building Technology
Furniture
and
equipment
Leasehold
improvements Total
Year ended December 31, 2015
Opening net book value 1,379 11,619 3,213 152 824 17,187
Additions - - 700 1 - 701
Disposals - - (206) - - (206)
Depreciation - (276) (910) (105) (304) (1,595)
Closing net book value 1,379 11,343 2,797 48 520 16,087
At December 31, 2015
Cost 1,379 13,817 11,371 2,499 3,545 32,611
Accumulated depreciation - (2,474) (8,574) (2,451) (3,025) (16,524)
Net book value 1,379 11,343 2,797 48 520 16,087
Year ended December 31, 2016
Opening net book value 1,379 11,343 2,797 48 520 16,087
Additions - - 630 10 - 640
Disposals - - (1) - - (1)
Depreciation - (278) (1,045) (19) (144) (1,486)
Closing net book value 1,379 11,065 2,381 39 376 15,240
At December 31, 2016
Cost 1,379 13,817 11,983 2,509 3,545 33,233
Accumulated depreciation - (2,752) (9,602) (2,470) (3,169) (17,993)
Net book value 1,379 11,065 2,381 39 376 15,240
In 2016, technology with an initial cost of $18 (2015 - $896) and accumulated depreciation of $17
(2015 - $690) were disposed of for $nil consideration (2015 - $nil).

Credit Union Central of Manitoba Limited Notes to Consolidated Financial Statements December 31, 2016 (in thousands of Canadian dollars)
23
8 Share capital
Authorized
Share capital consists of an unlimited number of Class I and II shares, to be issued and redeemed at
$5 each.
Membership
Pursuant to the Organization’s by-laws, member credit unions maintain investments in both classes of
shares proportionate to their statutory (Class I) and excess (Class II) liquidity deposits held by the
Organization.
Every member of the Organization is required to own a minimum of two Class I shares.
Rights and privileges
At the discretion of the Organization’s directors, dividends may be declared and paid to either or both
classes of shares. On any return of capital, the holders of Class II shares have a preferential claim on
the Organization’s assets.
Issued and outstanding 2016 2015
Class 1
Member credit unions 124,198 128,926
24,839,584 shares (2015 –25,785,141)
Co-operatives 1,228 1,228
245,624 shares (2015 – 245,624)
Class 2
Member credit unions 95,539 99,264
19,107,793 shares (2015 – 19,852,887)
Co-operatives 13,219 12,016
2,643,800 shares (2015 – 2,403,200)
234,184 241,434 During the year, a net total of $7,250 of shares were redeemed (2015 - a net total of $89,491 of shares were issued).

Credit Union Central of Manitoba Limited Notes to Consolidated Financial Statements December 31, 2016 (in thousands of Canadian dollars)
24
9 Gains (losses) on financial instruments
2016 2015
Liquidity pool investments (14,098) (1,558)
Members’ deposits 2,342 1,110
Unrealized losses on non-derivative financial instruments
classified as FVTPL (11,756) (448)
Unrealized gains (losses) on derivative financial instruments used to
manage interest rate risk (note 16 c)) 32,811 (24,389)
Net cost of derivative financial instruments used to
manage interest rate risk (note 16 c)) (21,437) (21,861)
Net cost and unrealized gains (losses) on derivative financial instruments 11,374 (46,250)
Derivative financial instruments are economic hedges used to manage interest rate risk associated
with the Organization’s investment in long term debt instruments matched to short term members’
deposits. Such derivative financial instruments have the economic effect of converting a long term
fixed interest rate debt instrument to a synthetic floating rate instrument with a higher yield than
would otherwise be available, however hedge accounting is not applied.
Credit Union Central of Manitoba Limited Notes to Consolidated Financial Statements December 31, 2016 (in thousands of Canadian dollars)
25
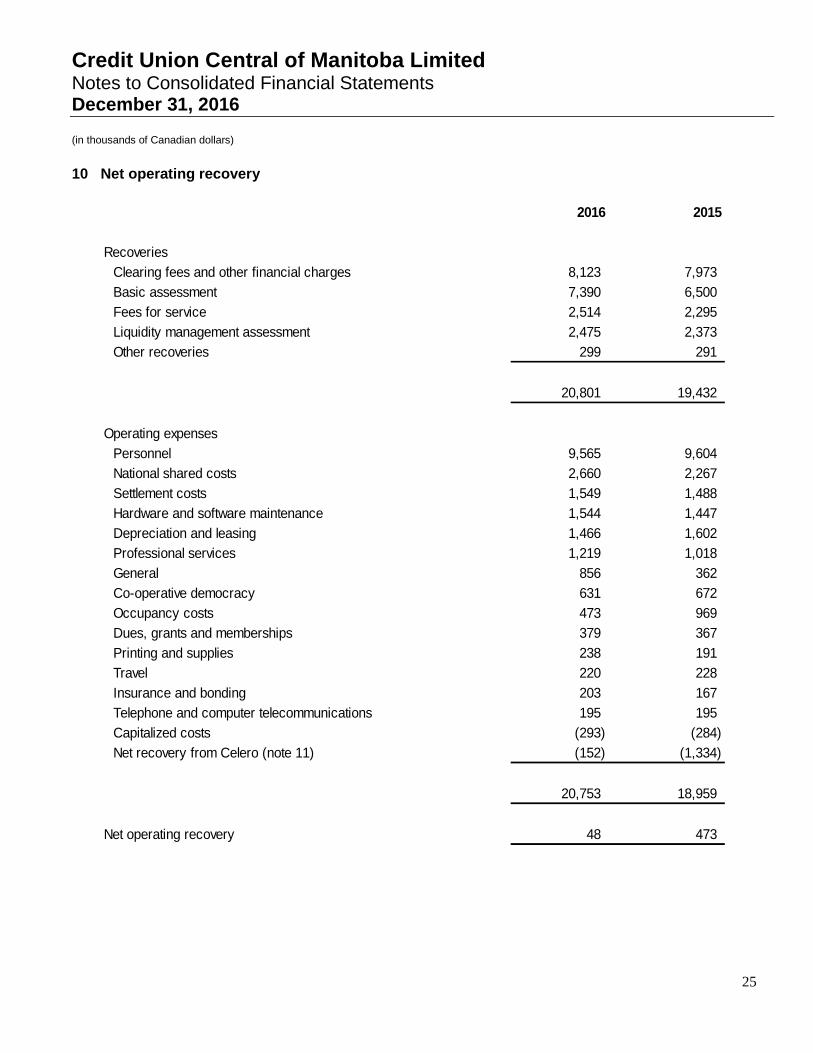
10 Net operating recovery
2016 2015
Recoveries
Clearing fees and other financial charges 8,123 7,973
Basic assessment 7,390 6,500
Fees for service 2,514 2,295
Liquidity management assessment 2,475 2,373
Other recoveries 299 291
20,801 19,432
Operating expenses
Personnel 9,565 9,604
National shared costs 2,660 2,267
Settlement costs 1,549 1,488
Hardware and software maintenance 1,544 1,447
Depreciation and leasing 1,466 1,602
Professional services 1,219 1,018
General 856 362
Co-operative democracy 631 672
Occupancy costs 473 969
Dues, grants and memberships 379 367
Printing and supplies 238 191
Travel 220 228
Insurance and bonding 203 167
Telephone and computer telecommunications 195 195
Capitalized costs (293) (284)
Net recovery from Celero (note 11) (152) (1,334)
20,753 18,959
Net operating recovery 48 473
Credit Union Central of Manitoba Limited Notes to Consolidated Financial Statements December 31, 2016 (in thousands of Canadian dollars)
26
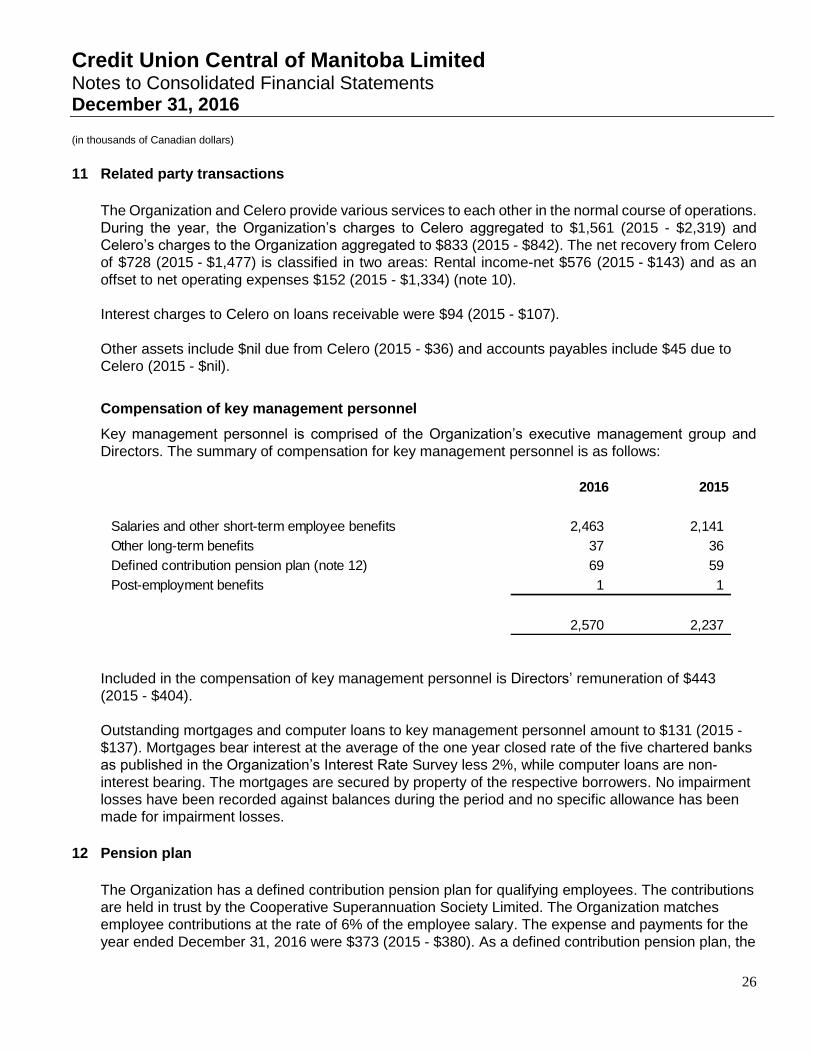
11 Related party transactions
The Organization and Celero provide various services to each other in the normal course of operations.
During the year, the Organization’s charges to Celero aggregated to $1,561 (2015 - $2,319) and
Celero’s charges to the Organization aggregated to $833 (2015 - $842). The net recovery from Celero
of $728 (2015 - $1,477) is classified in two areas: Rental income-net $576 (2015 - $143) and as an
offset to net operating expenses $152 (2015 - $1,334) (note 10).
Interest charges to Celero on loans receivable were $94 (2015 - $107).
Other assets include $nil due from Celero (2015 - $36) and accounts payables include $45 due to
Celero (2015 - $nil).
Compensation of key management personnel
Key management personnel is comprised of the Organization’s executive management group and
Directors. The summary of compensation for key management personnel is as follows:
2016 2015
Salaries and other short-term employee benefits 2,463 2,141
Other long-term benefits 37 36
Defined contribution pension plan (note 12) 69 59
Post-employment benefits 1 1
2,570 2,237
Included in the compensation of key management personnel is Directors’ remuneration of $443
(2015 - $404).
Outstanding mortgages and computer loans to key management personnel amount to $131 (2015 -
$137). Mortgages bear interest at the average of the one year closed rate of the five chartered banks
as published in the Organization’s Interest Rate Survey less 2%, while computer loans are non-
interest bearing. The mortgages are secured by property of the respective borrowers. No impairment
losses have been recorded against balances during the period and no specific allowance has been
made for impairment losses.
12 Pension plan
The Organization has a defined contribution pension plan for qualifying employees. The contributions
are held in trust by the Cooperative Superannuation Society Limited. The Organization matches
employee contributions at the rate of 6% of the employee salary. The expense and payments for the
year ended December 31, 2016 were $373 (2015 - $380). As a defined contribution pension plan, the

Credit Union Central of Manitoba Limited Notes to Consolidated Financial Statements December 31, 2016 (in thousands of Canadian dollars)
27
Organization has no further liability or obligation for future contributions to fund benefits to plan
members.
13 Commitments
During 2008, the Organization entered into a Managed Services Agreement with Misys International
Banking Systems Inc. with respect to the hosted Treasury Management System (Opics) under which
the Organization committed to pay $5,443 USD in hosting service fees over the ten year contract.
During 2010, the Organization entered into an agreement with Celero for the provision of eroWORKS
banking services. The annual operating fee will vary yearly based on the Organization’s proportionate
share of the eroWORKS banking cost for all Celero eroWORKS banking system clients. For 2016,
the annual operating fee was $222 based on the Organization’s share of total banking costs.
Commitments in each of the next five years are as follows:
2017 1,007 2018 423 2019 226 2020 47 2021 -
14 Assets pledged as collateral
The Organization pledges assets primarily for collateral purposes for accessing the Bank of Canada’s
large value transfer system. The Organization participates in an arrangement with SaskCentral,
Alberta Central, and Central 1 (the “Group Clearing Agreement”) whereby Central 1, on behalf of the
participants, acts as the Group Clearer with the Canadian Payments Association.
The Organization also pledges assets for margining purposes for over-the-counter derivative
liabilities, for collateral purposes for issuing Letters of Credit on behalf of its members, and for
collateral purposes for obligations under repurchase agreements.
The carrying value of the Organization’s assets pledged totaled $311,917 (2015 - $340,902). The
assets pledged are included in the liquidity pool (note 4).
15 Indemnifications
The Organization has agreed to indemnify its current and former directors and officers to the extent
permitted by law against any and all charges, costs, expenses, amounts paid in settlement and
damages incurred by the directors and officers as a result of any lawsuit or any other judicial
administrative or investigative proceeding in which the directors and officers are sued as a result of
their service. These indemnification claims will be subject to any statutory or other legal limitation
period. The nature of such indemnification prevents the Organization from making a reasonable
estimate of the maximum potential amount it could be required to pay to counterparties. The
Organization maintains liability insurance coverage for directors and officers.
Credit Union Central of Manitoba Limited Notes to Consolidated Financial Statements December 31, 2016 (in thousands of Canadian dollars)
28
Under the Group Clearing Agreement, the Organization guarantees and indemnifies the Group
Clearer and each member of the Group Clearing Agreement against any losses arising from the
payment obligation for settlement drawn on or payable by the Organization and its member credit
unions.
16 Risk management
The Organization’s primary financial objective is to manage the liquidity of Manitoba’s credit unions. A
certain amount of financial risk is inherent in the Organization’s operations. The purpose of sound risk
management is to provide reasonable assurance that incurred risks do not exceed acceptable
thresholds and that risk-taking contributes to the creation of member value. The Organization manages
and mitigates risk through the diversification of its financial instruments and development of risk
management policies. For the Organization this means striking a balance between risk and return.
In the normal course of business, the Organization is primarily exposed to the financial risks described
below:
Credit risk - Risk of a financial loss if an obligor does not fully honour its contractual commitments
to the Organization. Obligors may include issuers of securities, counterparties or borrowers;
Liquidity risk - Risk that the Organization will encounter difficulty in meeting obligations associated
with financial liabilities that are settled by delivering cash or another financial asset; and
Market risk:
Interest rate risk - Risk of a change in income resulting from changes in interest rates;
Foreign exchange risk - Risk of a change in income resulting from changes in foreign exchange
rates; and
Other price risk - Risk that the fair value of a financial instrument will fluctuate due to changes
in market prices.
The Organization’s risk management framework includes policies designed to identify and analyze
risks, to set appropriate risk limits and controls, and to monitor the risks and adherence to limits by
means of reliable and up-to-date information systems. The Organization’s risk management framework
involves identifying particular events or circumstances relevant to objectives, assessing them in terms
of probability and magnitude, determining a response strategy, and monitoring progress. The
Organization regularly reviews its risk management policies and systems to account for changes in its
objectives, markets, products, and emerging best practice.
Risk management is carried out by a number of delegated committees reporting to the Board of
Directors. Risk tolerance and overall risk management are documented within the Organization’s
Enterprise Risk Management Framework and its risk management policies which are approved by the
Board. Management regularly reports to the Board on compliance with those policies. In addition, the
Organization maintains an Internal Audit function which is partly responsible for review of risk
management and the Organization’s control environment.
Credit Union Central of Manitoba Limited Notes to Consolidated Financial Statements December 31, 2016 (in thousands of Canadian dollars)
29
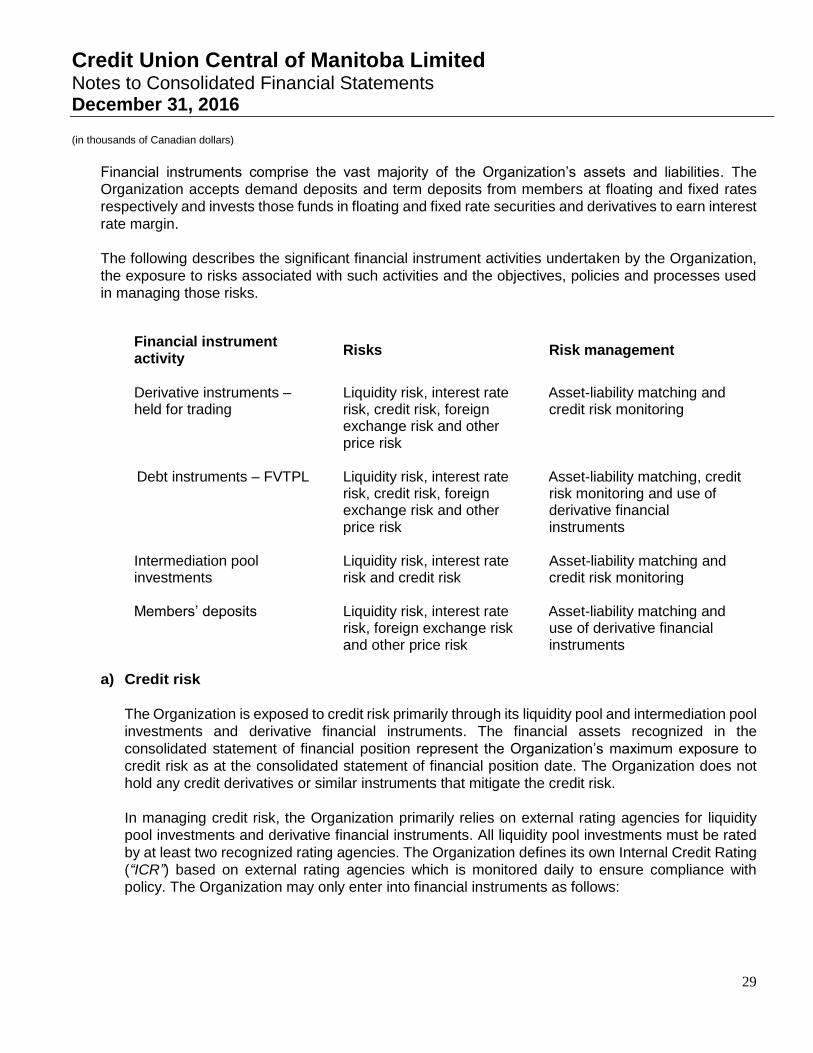
Financial instruments comprise the vast majority of the Organization’s assets and liabilities. The
Organization accepts demand deposits and term deposits from members at floating and fixed rates
respectively and invests those funds in floating and fixed rate securities and derivatives to earn interest
rate margin.
The following describes the significant financial instrument activities undertaken by the Organization,
the exposure to risks associated with such activities and the objectives, policies and processes used
in managing those risks.
Financial instrument activity
Risks Risk management
Derivative instruments – held for trading
Liquidity risk, interest rate risk, credit risk, foreign exchange risk and other price risk
Asset-liability matching and credit risk monitoring
Debt instruments – FVTPL
Liquidity risk, interest rate risk, credit risk, foreign exchange risk and other price risk
Asset-liability matching, credit risk monitoring and use of derivative financial instruments
Intermediation pool investments
Liquidity risk, interest rate risk and credit risk
Asset-liability matching and credit risk monitoring
Members’ deposits Liquidity risk, interest rate
risk, foreign exchange risk and other price risk
Asset-liability matching and use of derivative financial instruments
a) Credit risk
The Organization is exposed to credit risk primarily through its liquidity pool and intermediation pool
investments and derivative financial instruments. The financial assets recognized in the
consolidated statement of financial position represent the Organization’s maximum exposure to
credit risk as at the consolidated statement of financial position date. The Organization does not
hold any credit derivatives or similar instruments that mitigate the credit risk.
In managing credit risk, the Organization primarily relies on external rating agencies for liquidity
pool investments and derivative financial instruments. All liquidity pool investments must be rated
by at least two recognized rating agencies. The Organization defines its own Internal Credit Rating
(“ICR”) based on external rating agencies which is monitored daily to ensure compliance with
policy. The Organization may only enter into financial instruments as follows:
Credit Union Central of Manitoba Limited Notes to Consolidated Financial Statements December 31, 2016 (in thousands of Canadian dollars)
30
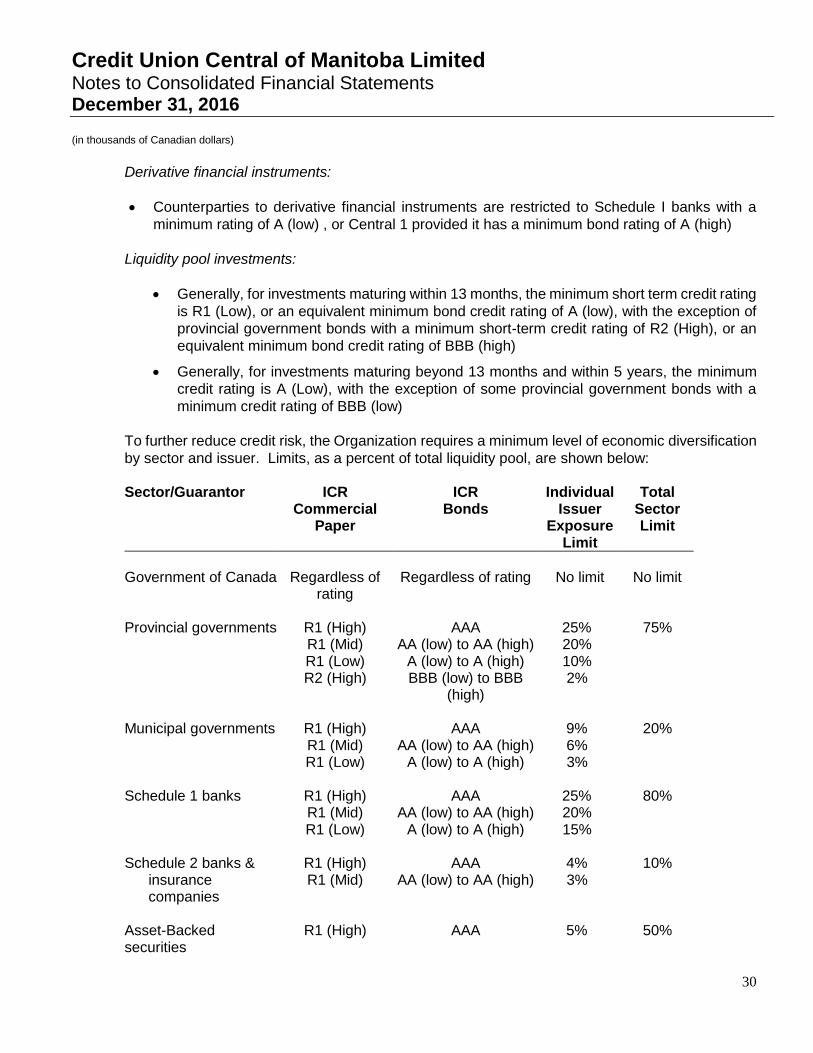
Derivative financial instruments:
Counterparties to derivative financial instruments are restricted to Schedule I banks with a
minimum rating of A (low) , or Central 1 provided it has a minimum bond rating of A (high)
Liquidity pool investments:
Generally, for investments maturing within 13 months, the minimum short term credit rating
is R1 (Low), or an equivalent minimum bond credit rating of A (low), with the exception of
provincial government bonds with a minimum short-term credit rating of R2 (High), or an
equivalent minimum bond credit rating of BBB (high)
Generally, for investments maturing beyond 13 months and within 5 years, the minimum
credit rating is A (Low), with the exception of some provincial government bonds with a
minimum credit rating of BBB (low)
To further reduce credit risk, the Organization requires a minimum level of economic diversification
by sector and issuer. Limits, as a percent of total liquidity pool, are shown below:
Sector/Guarantor ICR Commercial
Paper
ICR Bonds
Individual Issuer
Exposure Limit
Total Sector Limit
Government of Canada Regardless of
rating Regardless of rating No limit No limit
Provincial governments R1 (High)
R1 (Mid) R1 (Low) R2 (High)
AAA AA (low) to AA (high)
A (low) to A (high) BBB (low) to BBB
(high)
25% 20% 10% 2%
75%
Municipal governments R1 (High)
R1 (Mid) R1 (Low)
AAA AA (low) to AA (high)
A (low) to A (high)
9% 6% 3%
20%
Schedule 1 banks R1 (High)
R1 (Mid) R1 (Low)
AAA AA (low) to AA (high)
A (low) to A (high)
25% 20% 15%
80%
Schedule 2 banks &
insurance companies
R1 (High) R1 (Mid)
AAA AA (low) to AA (high)
4% 3%
10%
Asset-Backed securities
R1 (High) AAA 5% 50%
Credit Union Central of Manitoba Limited Notes to Consolidated Financial Statements December 31, 2016 (in thousands of Canadian dollars)
31
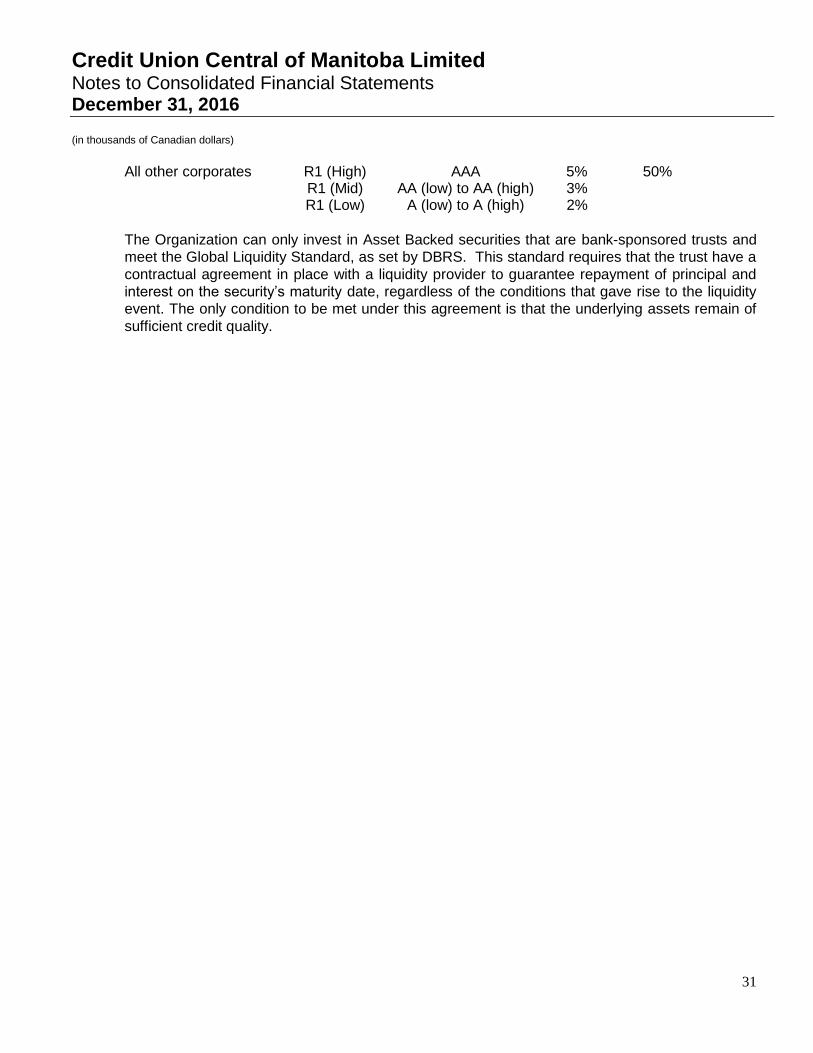
All other corporates R1 (High) R1 (Mid) R1 (Low)
AAA AA (low) to AA (high)
A (low) to A (high)
5% 3% 2%
50%
The Organization can only invest in Asset Backed securities that are bank-sponsored trusts and
meet the Global Liquidity Standard, as set by DBRS. This standard requires that the trust have a
contractual agreement in place with a liquidity provider to guarantee repayment of principal and
interest on the security’s maturity date, regardless of the conditions that gave rise to the liquidity
event. The only condition to be met under this agreement is that the underlying assets remain of
sufficient credit quality.
Credit Union Central of Manitoba Limited Notes to Consolidated Financial Statements December 31, 2016 (in thousands of Canadian dollars)
32
The maximum investment term for each instrument must not exceed five years unless the
investment is:
specifically matched against a member deposit maturing beyond five years;
retractable at the Organization’s option within 5 years;
a callable bond issued by a Schedule I bank, has an ICR of "A (low)" or higher and pays a
fixed rate for a remaining term not exceeding 5 years; or has an ICR of "A(mid)" or higher
and pays a fixed rate for a remaining term not exceeding 7 years;
guaranteed by the federal or a qualifying provincial government and is matched to a
derivative financial instrument, resulting in the net receipt of a floating interest rate;
is not guaranteed by the federal or a qualifying provincial government and is matched to a
derivative financial instrument, resulting in the net receipt of a floating interest rate. Total
such investments maturing beyond 5 years are limited to no more than 10% of the Total
Liquidity Pool; or
identified as funded by the Organization’s share capital.
Liquidity pool investments by credit rating and term to maturity are:

Credit Union Central of Manitoba Limited Notes to Consolidated Financial Statements December 31, 2016 (in thousands of Canadian dollars)
33
2016
Less than
6 months
6 months
to 1 year
Greater
than 1 year
and up to
5 years
Greater than
5 years Total
AAA / R1 (High) 242,359 5,306 3,008 - 250,673
AA / R1 (Middle) 8,337 210,141 1,061,359 1,016,507 2,296,344
A / R1 (Low) 315,410 424,977 597,797 - 1,338,184
566,106 640,424 1,662,164 1,016,507 3,885,201
2015
Less than
6 months
6 months
to 1 year
Greater
than 1 year
and up to
5 years
Greater than
5 years Total
AAA / R1 (High) 204,510 22,332 - 32,143 258,985
AA / R1 (Middle) 121,291 50,948 1,000,597 715,355 1,888,191
A / R1 (Low) 184,081 253,831 1,109,066 - 1,546,978
509,882 327,111 2,109,663 747,498 3,694,154
The change in fair value of investments classified as FVTPL is primarily due to changes in market
risk.
Intermediation pool investments:
The Organization is committed to investing in Credit Union Central of Canada and Central
1 as required.
Investments in other co-operatives, Celero, and mortgages and loans require a credit risk
assessment and approval of the Board of Directors.
Loans and overdrafts to member credit unions are secured by a Global Loan Agreement
which specifies that the Organization holds a security interest in all book debts and
accounts. In the event of default, the Organization is authorized to realize on all security
and apply the proceeds therefrom to its amount receivable.
Credit Union Central of Manitoba Limited Notes to Consolidated Financial Statements December 31, 2016 (in thousands of Canadian dollars)
34
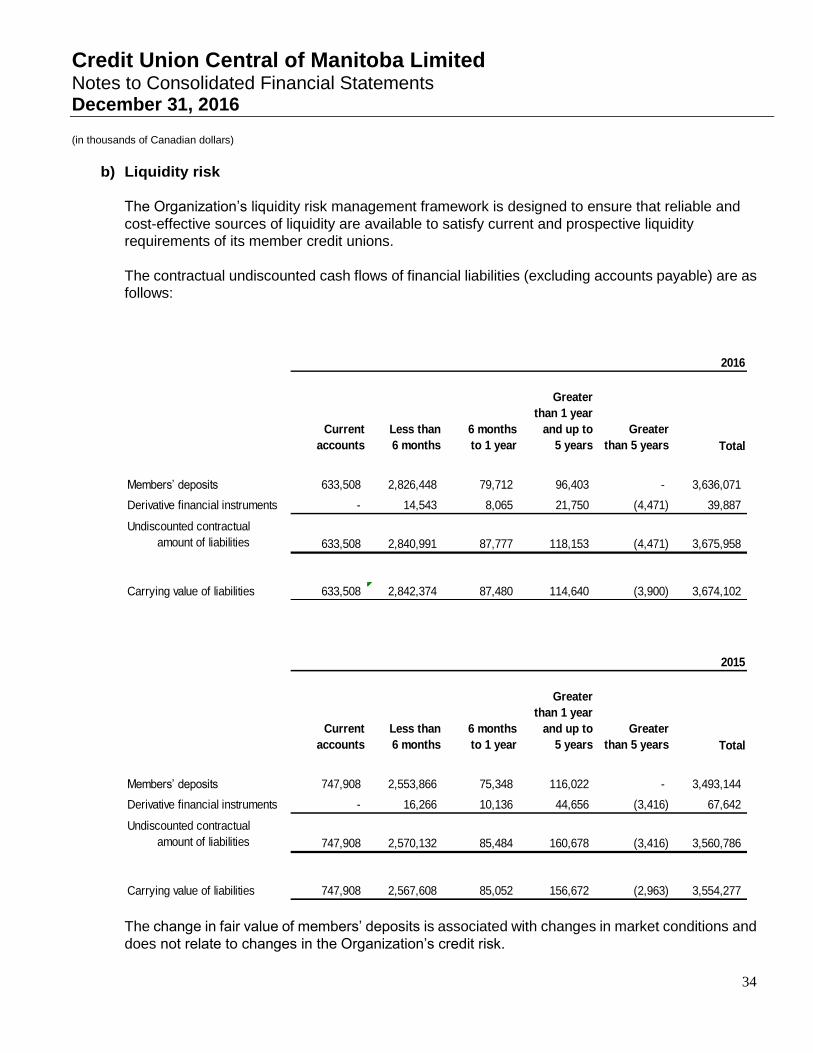
b) Liquidity risk
The Organization’s liquidity risk management framework is designed to ensure that reliable and
cost-effective sources of liquidity are available to satisfy current and prospective liquidity
requirements of its member credit unions.
The contractual undiscounted cash flows of financial liabilities (excluding accounts payable) are as
follows:
2016
Current
accounts
Less than
6 months
6 months
to 1 year
Greater
than 1 year
and up to
5 years
Greater
than 5 years Total
Members’ deposits 633,508 2,826,448 79,712 96,403 - 3,636,071
Derivative financial instruments - 14,543 8,065 21,750 (4,471) 39,887
Undiscounted contractual
amount of liabilities 633,508 2,840,991 87,777 118,153 (4,471) 3,675,958
Carrying value of liabilities 633,508 2,842,374 87,480 114,640 (3,900) 3,674,102
2015
Current
accounts
Less than
6 months
6 months
to 1 year
Greater
than 1 year
and up to
5 years
Greater
than 5 years Total
Members’ deposits 747,908 2,553,866 75,348 116,022 - 3,493,144
Derivative financial instruments - 16,266 10,136 44,656 (3,416) 67,642
Undiscounted contractual
amount of liabilities 747,908 2,570,132 85,484 160,678 (3,416) 3,560,786
Carrying value of liabilities 747,908 2,567,608 85,052 156,672 (2,963) 3,554,277
The change in fair value of members’ deposits is associated with changes in market conditions and
does not relate to changes in the Organization’s credit risk.
Credit Union Central of Manitoba Limited Notes to Consolidated Financial Statements December 31, 2016 (in thousands of Canadian dollars)
35
c) Interest rate risk
Interest rate risk is the risk that a change in market interest rates will impact the Organization’s
financial margin as reported in the consolidated statement of operations and comprehensive
income. Accordingly, the Organization establishes policy limits approved by the Board of Directors
on the level of interest rate re-pricing risk that may be undertaken, which is monitored by the
Organization’s management.
Interest-sensitive assets and interest-sensitive liabilities are matched by amount and interest rate
re-pricing terms so as to minimize income fluctuations should market interest rates change. The
Organization sets policy limits on the maximum amount of mismatch as follows:
Interest-sensitive liabilities with term over 13 months
All financial assets and liabilities (liquidity pool investments and members’ deposits,
respectively) maturing beyond 13 months must be matched.
Interest-sensitive liabilities with term of 6 to 13 months
Unmatched financial instruments maturing within 10 to 13 months and 6 to 10 months are
permitted to a maximum of 2% and 4%, respectively, of the total liquidity pool investment
portfolio.
Interest-sensitive liabilities with term of less than 6 months
The weighted average terms of these assets and liabilities is calculated and monitored
daily. The difference between the two may not exceed 30 days.
The following summarized schedules shows the Organization’s sensitivity to interest rate changes
based on the notional value of assets and liabilities:

Credit Union Central of Manitoba Limited Notes to Consolidated Financial Statements December 31, 2016 (in thousands of Canadian dollars)
36
2016
Interest
re-pricing
period
Interest
sensitive
Non-interest
sensitive
Notional
Derivative
receiving
Notional
Derivative
paying
Net
asset/liability
mis-match
0 to 6 months (2,907,756) (130,171) 2,591,770 279,076 (167,081)
6 to 13 months 641,485 (16,349) - (481,568) 143,568
13 months to
2 years 408,162 (28,500) - (371,043) 8,619
2 to 3 years 681,519 (12,600) - (663,303) 5,616
3 to 4 years 149,523 (10,235) - (151,914) (12,626)
4 to 5 years 283,424 (11,250) - (255,364) 16,810
Over 5 years 962,748 (10,000) - (947,654) 5,094
219,105 (219,105) 2,591,770 (2,591,770) -
2015
Interest
re-pricing
period
Interest
sensitive
Non-interest
sensitive
Notional
Derivative
receiving
Notional
Derivative
paying
Net
asset/liability
mis-match
0 to 6 months (2,710,053) (141,029) 2,851,099 (199,718) (199,701)
6 to 13 months 305,707 (8,250) - (124,848) 172,609
13 months to
2 years 770,955 (36,109) - (726,869) 7,977
2 to 3 years 378,006 (26,500) - (340,474) 11,032
3 to 4 years 660,498 (9,600) - (646,555) 4,343
4 to 5 years 115,487 (10,236) - (119,115) (13,864)
Over 5 years 711,124 - - (693,520) 17,604
231,724 (231,724) 2,851,099 (2,851,099) -
Investments and deposits may be sold or redeemed before maturity; however no projections or
adjustments have been made for potential sales or redemptions. Assets and liabilities that are non-
interest sensitive have been categorized in re-pricing periods that correspond to the Organization’s
asset/liability deployment policies and investment strategies.
A positive asset/liability mismatch for a given interest re-pricing period (period gap) indicates that
a rise in interest rates would decrease the Organization’s financial margin effective with that period
while a fall in interest rates would increase the financial margin. If the period gap for a given re-
pricing period is negative, then an increase or decrease would have the opposite effect from a
Credit Union Central of Manitoba Limited Notes to Consolidated Financial Statements December 31, 2016 (in thousands of Canadian dollars)
37
positive gap. The above-noted policy restricts the mismatch in each period to prevent significant
financial margin fluctuations.
The Organization enters into interest rate swap agreements and cross-currency interest rate swap
agreements (“swaps”) for the purpose of managing interest rate risk, the notional amounts of which
are reflected in the table above. A swap is a contractual agreement between the Organization and
a counterparty involving the exchange of fixed rate and floating rate payments structured in a
manner to reduce the extent of the Organization’s interest rate risk to a level which management
believes is reasonable. The contracted terms of the swaps are specifically matched to specific
terms of the Organization’s assets. The Organization does not enter into swaps for speculative
purposes.
Additionally, the Organization, in its role as a financial intermediary, enters into swaps on behalf of
its member credit unions. The credit risk associated with these swaps is the responsibility of the
member credit unions and security is held by the Organization through Assignments of Book Debts.
Including the effect of the derivative financial instruments, the weighted average effective return for
interest-sensitive assets is 3.06% (2015 – 3.06%) and the weighted average effective cost for
interest-sensitive liabilities is 2.28% (2015 - 2.41%).
Sensitivity analysis is used to assess the change in reported value of the Organization’s financial
instruments against a range of incremental basis point changes in interest rates. Based on the
characteristics of the Organization’s financial instruments as at December 31, 2016, the
Organization estimates that an immediate and sustained 25 basis point decrease in interest rates
would generate unrealized gains of $27,478 on non-derivative financial instruments and unrealized
losses of $27,073 on derivative financial instruments while an immediate and sustained 25 basis
point increase in interest rates would generate unrealized losses of $27,065 on non-derivative
financial instruments and unrealized gains of $26,648 on derivative financial instruments.
d) Foreign exchange risk
The Organization manages foreign exchange risk to minimize the risk of financial loss due to
fluctuations in currency exchange rates. This is done primarily by implementing a policy framework
approved by the Board of Directors that prohibits exposure to currencies other than the US dollar
and restricts the US dollar asset (liability) exposure to no more than USD $250. The Organization
enters into foreign exchange forward rate agreements with derivative counterparties to provide a
financial intermediary role for member credit unions, to offset future contractual obligations of the
Organization, and for cash management purposes. A foreign exchange forward rate agreement is
a contractual arrangement between the Organization and a counterparty involving the commitment
of a purchase or sale of US dollar funds to settle on a future date at a predetermined exchange
rate. The Organization does not enter into foreign exchange forward rate agreements for
speculative purposes.
The Organization also enters into cross-currency interest rate swap agreements with derivative
counterparties to manage its interest rate risk (note 16 c)) where asset (liability) matching involves
mixed currencies. A cross-currency interest rate swap agreement is an interest rate swap
Credit Union Central of Manitoba Limited Notes to Consolidated Financial Statements December 31, 2016 (in thousands of Canadian dollars)
38
agreement (note 16 c)) involving the exchange of US dollar funds and Canadian dollar funds
between the counterparties at the outset, the exact amount of which are reversed on maturity, and
under which the fixed and floating interest payments are of different currencies.
The net US dollar asset (liability) mismatch as of December 31, 2016 was USD $21 (2015 - USD
($2)).
As at December 31, 2016, the Organization has entered into foreign exchange forward rate
agreements to buy US dollars aggregating USD $3,480 and to sell US dollars aggregating USD
$3,085, inclusive of transactions with member credit unions (2015 - buy US dollars aggregating
USD $4,028 and to sell US dollars aggregating USD $2,743, inclusive of transactions with member
credit unions). The credit risk associated with these agreements is the responsibility of the
Organization. On a weighted-average basis, these agreements will settle within six months.
As at December 31, 2016, if the Canadian dollar had strengthened or weakened by 1% relative to
the US dollar, with all other variables held constant, income before income taxes for the year would
have increased or decreased by a nominal amount, respectively (2015 - impact was nominal).
17 Fair value measurements
IFRS 7 specifies a hierarchy of valuation techniques based on whether the inputs to those valuation
techniques are observable or unobservable. Observable inputs reflect market data obtained from
independent sources; unobservable inputs reflect the Organization’s market assumptions and are
classified pursuant to the following fair value hierarchy:
Level 1 - Quoted prices (unadjusted) in active markets for identical assets or liabilities. This level
includes listed equity securities on exchanges and exchange traded derivatives like futures.
Level 2 - Inputs other than quoted prices included within Level 1 that are observable for the asset
or liability, either directly (that is, as prices) or indirectly (that is, derived from prices). This level
includes the Organization’s derivative financial instruments, debt instruments and members’
deposits. The sources of input parameters like Banker’s Acceptance (BA) rates, Canadian Dollar
Offered Rates (CDOR), London Interbank Offered Rates (LIBOR), swap yield curves or composite
yield curves for Schedule 1 bank senior debt are from Bloomberg.
Level 3 - Inputs for the asset or liability that are not based on observable market data
(unobservable inputs). This level includes equity investments and debt instruments with significant
unobservable components.
This hierarchy requires the use of observable market data when available. The Organization considers
relevant and observable market prices in its valuations where possible.
The Organization’s policy is to recognize transfers into and transfers out of the fair value hierarchy
levels as of the date of the event or change in circumstances that caused the transfer. During the year
the Organization had no transfers between fair value hierarchy levels.
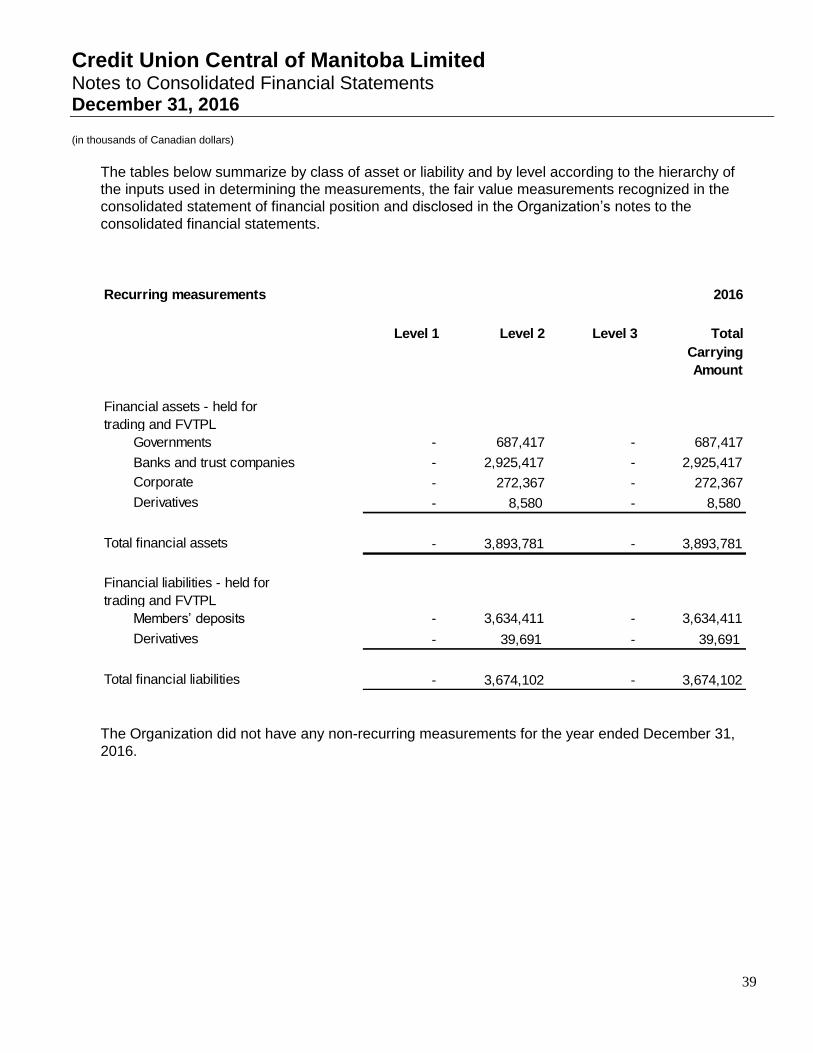
Credit Union Central of Manitoba Limited Notes to Consolidated Financial Statements December 31, 2016 (in thousands of Canadian dollars)
39
The tables below summarize by class of asset or liability and by level according to the hierarchy of
the inputs used in determining the measurements, the fair value measurements recognized in the
consolidated statement of financial position and disclosed in the Organization’s notes to the
consolidated financial statements.
Recurring measurements 2016
Level 1 Level 2 Level 3 Total
Carrying
Amount
- 687,417 - 687,417
- 2,925,417 - 2,925,417
- 272,367 - 272,367
- 8,580 - 8,580
- 3,893,781 - 3,893,781
- 3,634,411 - 3,634,411
- 39,691 - 39,691
- 3,674,102 - 3,674,102Total financial liabilities
Derivatives
Financial liabilities - held for
trading and FVTPL
Members’ deposits
Derivatives
Banks and trust companies
Corporate
Financial assets - held for
trading and FVTPL
Governments
Total financial assets
The Organization did not have any non-recurring measurements for the year ended December 31,
2016.
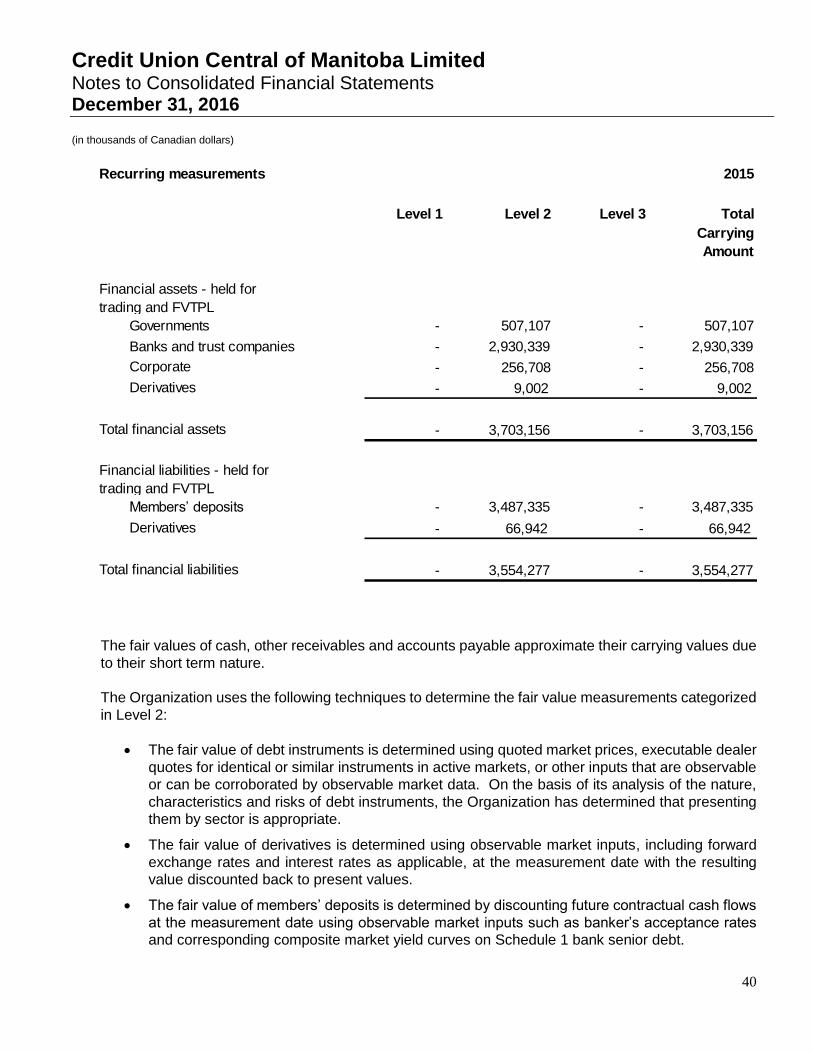
Credit Union Central of Manitoba Limited Notes to Consolidated Financial Statements December 31, 2016 (in thousands of Canadian dollars)
40
Recurring measurements 2015
Level 1 Level 2 Level 3 Total
Carrying
Amount
- 507,107 - 507,107
- 2,930,339 - 2,930,339
- 256,708 - 256,708
- 9,002 - 9,002
- 3,703,156 - 3,703,156
- 3,487,335 - 3,487,335
- 66,942 - 66,942
- 3,554,277 - 3,554,277
Derivatives
Total financial liabilities
Derivatives
Total financial assets
Financial liabilities - held for
trading and FVTPL
Members’ deposits
Corporate
Financial assets - held for
trading and FVTPL
Governments
Banks and trust companies
The fair values of cash, other receivables and accounts payable approximate their carrying values due
to their short term nature.
The Organization uses the following techniques to determine the fair value measurements categorized
in Level 2:
The fair value of debt instruments is determined using quoted market prices, executable dealer
quotes for identical or similar instruments in active markets, or other inputs that are observable
or can be corroborated by observable market data. On the basis of its analysis of the nature,
characteristics and risks of debt instruments, the Organization has determined that presenting
them by sector is appropriate.
The fair value of derivatives is determined using observable market inputs, including forward
exchange rates and interest rates as applicable, at the measurement date with the resulting
value discounted back to present values.
The fair value of members’ deposits is determined by discounting future contractual cash flows
at the measurement date using observable market inputs such as banker’s acceptance rates
and corresponding composite market yield curves on Schedule 1 bank senior debt.
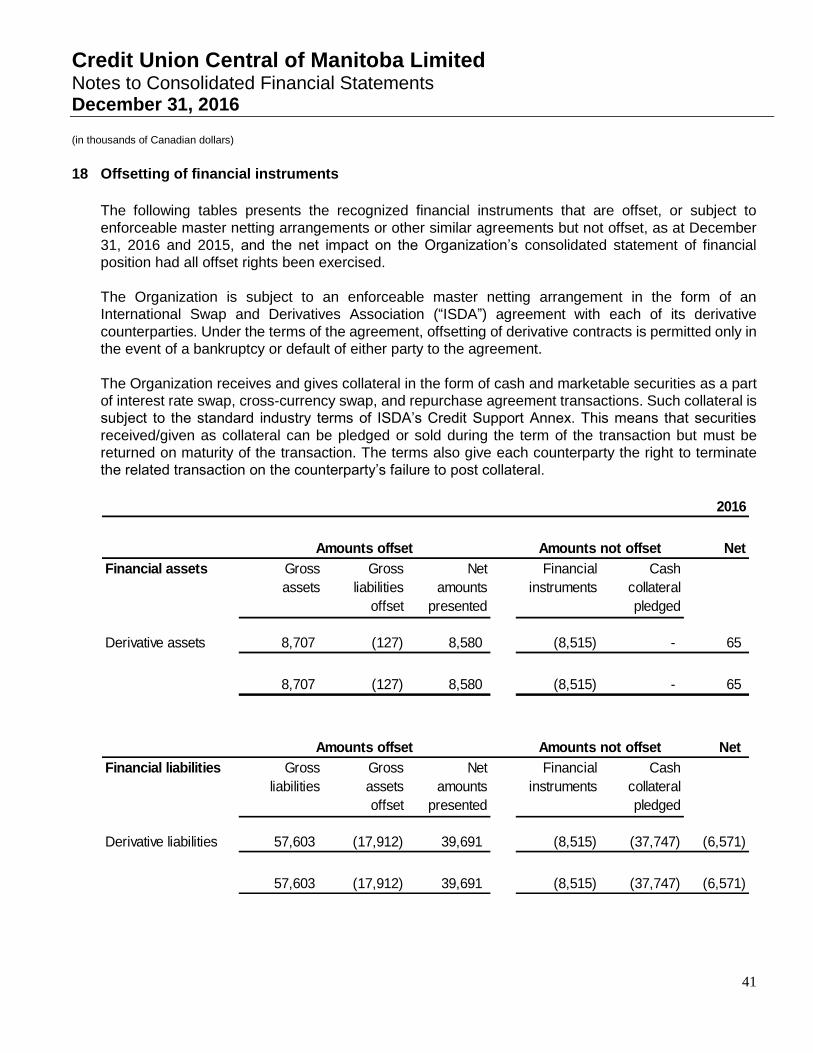
Credit Union Central of Manitoba Limited Notes to Consolidated Financial Statements December 31, 2016 (in thousands of Canadian dollars)
41
18 Offsetting of financial instruments
The following tables presents the recognized financial instruments that are offset, or subject to
enforceable master netting arrangements or other similar agreements but not offset, as at December
31, 2016 and 2015, and the net impact on the Organization’s consolidated statement of financial
position had all offset rights been exercised.
The Organization is subject to an enforceable master netting arrangement in the form of an
International Swap and Derivatives Association (“ISDA”) agreement with each of its derivative
counterparties. Under the terms of the agreement, offsetting of derivative contracts is permitted only in
the event of a bankruptcy or default of either party to the agreement.
The Organization receives and gives collateral in the form of cash and marketable securities as a part
of interest rate swap, cross-currency swap, and repurchase agreement transactions. Such collateral is
subject to the standard industry terms of ISDA’s Credit Support Annex. This means that securities
received/given as collateral can be pledged or sold during the term of the transaction but must be
returned on maturity of the transaction. The terms also give each counterparty the right to terminate
the related transaction on the counterparty’s failure to post collateral.
2016
Net
Financial assets Gross
assets
Gross
liabilities
offset
Net
amounts
presented
Financial
instruments
Cash
collateral
pledged
Derivative assets 8,707 (127) 8,580 (8,515) - 65
8,707 (127) 8,580 (8,515) - 65
Net
Financial liabilities Gross
liabilities
Gross
assets
offset
Net
amounts
presented
Financial
instruments
Cash
collateral
pledged
Derivative liabilities 57,603 (17,912) 39,691 (8,515) (37,747) (6,571)
57,603 (17,912) 39,691 (8,515) (37,747) (6,571)
Amounts offset Amounts not offset
Amounts offset Amounts not offset
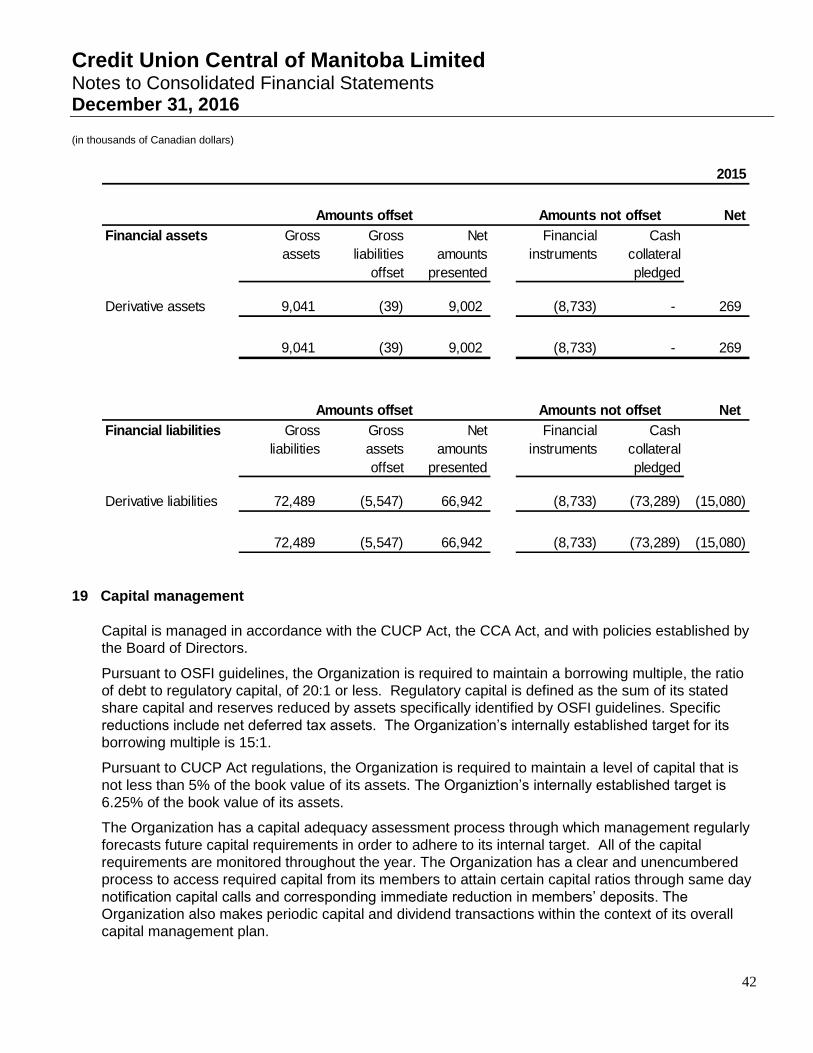
Credit Union Central of Manitoba Limited Notes to Consolidated Financial Statements December 31, 2016 (in thousands of Canadian dollars)
42
2015
Net
Financial assets Gross
assets
Gross
liabilities
offset
Net
amounts
presented
Financial
instruments
Cash
collateral
pledged
Derivative assets 9,041 (39) 9,002 (8,733) - 269
9,041 (39) 9,002 (8,733) - 269
Net
Financial liabilities Gross
liabilities
Gross
assets
offset
Net
amounts
presented
Financial
instruments
Cash
collateral
pledged
Derivative liabilities 72,489 (5,547) 66,942 (8,733) (73,289) (15,080)
72,489 (5,547) 66,942 (8,733) (73,289) (15,080)
Amounts offset Amounts not offset
Amounts offset Amounts not offset
19 Capital management
Capital is managed in accordance with the CUCP Act, the CCA Act, and with policies established by
the Board of Directors.
Pursuant to OSFI guidelines, the Organization is required to maintain a borrowing multiple, the ratio
of debt to regulatory capital, of 20:1 or less. Regulatory capital is defined as the sum of its stated
share capital and reserves reduced by assets specifically identified by OSFI guidelines. Specific
reductions include net deferred tax assets. The Organization’s internally established target for its
borrowing multiple is 15:1.
Pursuant to CUCP Act regulations, the Organization is required to maintain a level of capital that is
not less than 5% of the book value of its assets. The Organiztion’s internally established target is
6.25% of the book value of its assets.
The Organization has a capital adequacy assessment process through which management regularly
forecasts future capital requirements in order to adhere to its internal target. All of the capital
requirements are monitored throughout the year. The Organization has a clear and unencumbered
process to access required capital from its members to attain certain capital ratios through same day
notification capital calls and corresponding immediate reduction in members’ deposits. The
Organization also makes periodic capital and dividend transactions within the context of its overall
capital management plan.
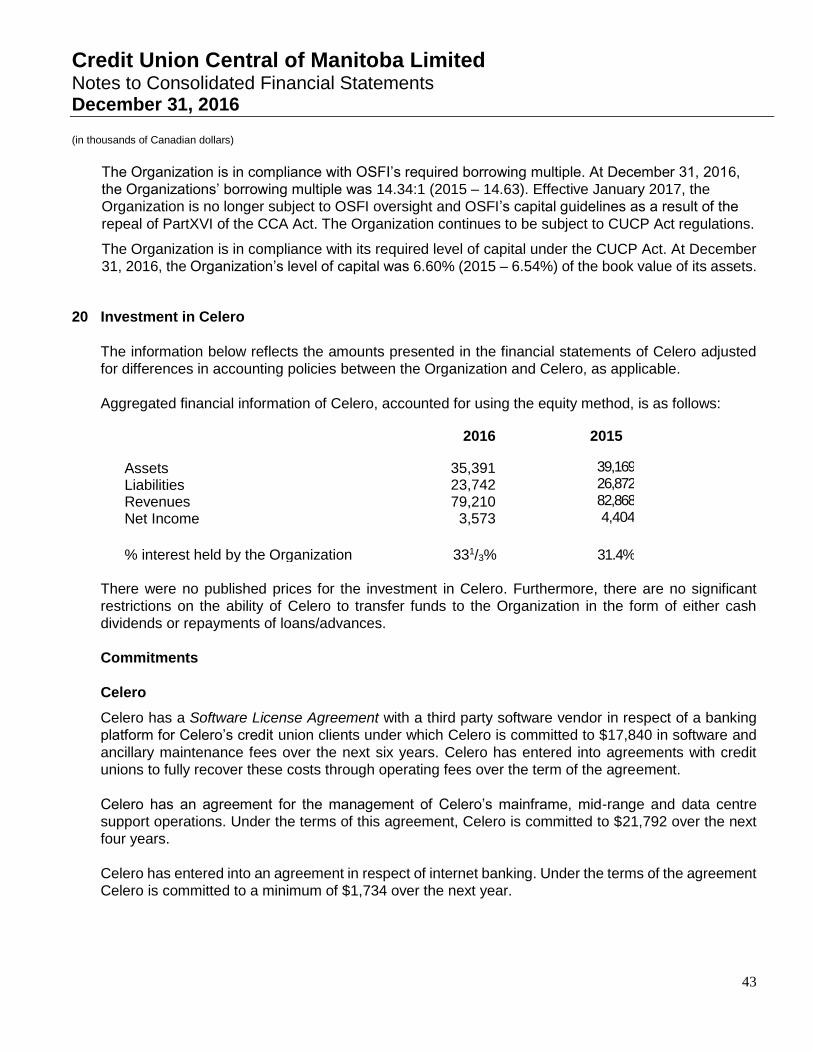
Credit Union Central of Manitoba Limited Notes to Consolidated Financial Statements December 31, 2016 (in thousands of Canadian dollars)
43
The Organization is in compliance with OSFI’s required borrowing multiple. At December 31, 2016,
the Organizations’ borrowing multiple was 14.34:1 (2015 – 14.63). Effective January 2017, the
Organization is no longer subject to OSFI oversight and OSFI’s capital guidelines as a result of the
repeal of PartXVI of the CCA Act. The Organization continues to be subject to CUCP Act regulations.
The Organization is in compliance with its required level of capital under the CUCP Act. At December
31, 2016, the Organization’s level of capital was 6.60% (2015 – 6.54%) of the book value of its assets.
20 Investment in Celero
The information below reflects the amounts presented in the financial statements of Celero adjusted
for differences in accounting policies between the Organization and Celero, as applicable.
Aggregated financial information of Celero, accounted for using the equity method, is as follows:
2016 2015 Assets 35,391 39,169
Liabilities 23,742 26,872
Revenues 79,210 82,868
Net Income 3,573 4,404
% interest held by the Organization 331/3% 31.4%
There were no published prices for the investment in Celero. Furthermore, there are no significant
restrictions on the ability of Celero to transfer funds to the Organization in the form of either cash
dividends or repayments of loans/advances.
Commitments
Celero
Celero has a Software License Agreement with a third party software vendor in respect of a banking
platform for Celero’s credit union clients under which Celero is committed to $17,840 in software and
ancillary maintenance fees over the next six years. Celero has entered into agreements with credit
unions to fully recover these costs through operating fees over the term of the agreement.
Celero has an agreement for the management of Celero’s mainframe, mid-range and data centre
support operations. Under the terms of this agreement, Celero is committed to $21,792 over the next
four years.
Celero has entered into an agreement in respect of internet banking. Under the terms of the agreement
Celero is committed to a minimum of $1,734 over the next year.

Credit Union Central of Manitoba Limited Notes to Consolidated Financial Statements December 31, 2016 (in thousands of Canadian dollars)
44
Celero has other obligations under various agreements for equipment, licensing, maintenance and
professional fees totaling $393 over the next five years.
The Organization is indirectly liable in proportion to its 331/3% ownership interest in Celero for all of
Celero’s covenants and obligations under these agreements. Proportionate commitments in each of
the next five years and thereafter are as follows:
Banking Licenses & Internet Data Centre
Maintenance Banking Management Other Total 2017 1,172 578 1,816 64 3,630 2018 990 - 1,816 27 2,833 2019 966 - 1,816 16 2,798 2020 939 - 1,816 12 2,767 2021 939 - - 12 951 2022 and thereafter 939 - - - 939
Everlink
Celero has a 49% ownership interest in Everlink. The Organization is indirectly liable in proportion to
its 331/3% ownership interest in Celero for covenants and obligations under the following Everlink
agreements:
Financing arrangements
Everlink has entered into financing agreements consisting of a line of credit to a maximum of
$2,000 and an authorized overdraft facility to a maximum of $6,500. Celero has provided a
guarantee on these agreements in proportion to its shareholding in Everlink. At December 31,
2016 there were no draws (2015 - no draws) against the line of credit or the authorized overdraft
facility.
21 Comparative figures
Certain comparative amounts may have been reclassified to conform to the current year’s
presentation.