co-simulation of a low-voltage utility grid controlled
TRANSCRIPT

HAL Id: hal-01206352https://hal.archives-ouvertes.fr/hal-01206352
Submitted on 5 Oct 2016
HAL is a multi-disciplinary open accessarchive for the deposit and dissemination of sci-entific research documents, whether they are pub-lished or not. The documents may come fromteaching and research institutions in France orabroad, or from public or private research centers.
L’archive ouverte pluridisciplinaire HAL, estdestinée au dépôt et à la diffusion de documentsscientifiques de niveau recherche, publiés ou non,émanant des établissements d’enseignement et derecherche français ou étrangers, des laboratoirespublics ou privés.
Co-simulation of a Low-Voltage Utility Grid Controlledover IEC 61850 protocol
Ekanki Sharma, Antoneta Iuliana Bratcu, Claudiu Chiculita, Yvon Besanger
To cite this version:Ekanki Sharma, Antoneta Iuliana Bratcu, Claudiu Chiculita, Yvon Besanger. Co-simulation of aLow-Voltage Utility Grid Controlled over IEC 61850 protocol. DRPT 2015 - 5th IEEE InternationalConference on Electric Utility Deregulation and Restructuring and Power Technologies, Nov 2015,Changsha, China. pp.2365-2372. �hal-01206352�

Co-simulation of a Low-Voltage Utility Grid Controlled over IEC 61850 protocol
Ekanki SHARMA AntonetaIuliana BRATCU
Grenoble Alpes University GIPSA-Lab, Control Systems
Department 38402, Saint-Martin d’Hères, France
[email protected], [email protected]
Claudiu CHICULIŢĂ Faculty of Control Engineering,
Computers, Electrical Engineering and Electronics
“Dunărea de Jos” University of Galaţi
800008, Galaţi, Romania [email protected]
Yvon BÉSANGER Grenoble Alpes University
Grenoble Electrical Engineering Laboratory (G2ELab)
38031, Grenoble, France [email protected]
.fr
Abstract—This paper presents a co-simulation model using
MATLAB® toolboxes to illustrate an interaction between the communication system and the energy grid, coherent with the concept of smart grid that employs IEC 61850 communication standard. The MMS (Manufacturing Message Specification) protocol supported by IEC 61850, based on TCP/IP, is used for the vertical communication between the Supervisory and Data Acquisition (SCADA) system and Intelligent Electronic Devices (IEDs) embedding the local control of different parts of the smart grid. In this paper an IED supporting the power control of a photovoltaic (PV) plant connected to a low-voltage (LV) utility grid is considered. Communication system consisting of the transport layer and a router placed on the network layer is modeled as an event-driven system using SimEvents® toolbox and energy grid is modeled as a time-driven system using SimPowerSystems® toolbox. Co-simulation results are obtained by combining different communication scenarios and time-varying irradiance scenarios for the PV plant when this one is required to provide a certain power in response to a power reference received from SCADA over the communication network. The analysis aims at illustrating the impact that stochastic behavior and delays due to network communication have on the global system behavior.
Keywords—Co-simulation; delay; IEC 61850; Manufacturing Message Specification (MMS); TCP/IP; low-voltage (LV) grid
I. INTRODUCTION The concept of smart grid at distribution level characterizes
the information flow using latest communication technologies. A smart distribution grid is a modernized electrical grid (fully au-tomated distribution system) that uses information and commu-nication technology to improve reliability, security and efficien-cy of energy delivery [1]. So smart grids use complex commu-
nication networks in order to allow communication between the DERs (Distribution Energy Resources) to implement functions such as power monitoring, energy management and ADA func-tions (Advanced Distribution Automation). Smart grids are therefore highly automated cyber-physical systems. The concept of smart distribution grid has led to the development and im-plementation of new communication standards able to provide interoperability [2,3]. This increasing role of communication network in the operation and control of power system results in strong dependence of the global performance on the performance of communication [1]. As information flows through the com-munication network, it exhibits variable delays that can cause unstable behavior and some asynchronous events that can lead to loss of data. This highly automated power system is prone to vulnerabilities caused by interdependencies with communication and information systems [4].
Recent work has been reported in the literature [4, 5] on identifying and modeling these interdependencies. The imple-mentation of widely used advanced protocols like IEC 61850 has been investigated in [3] and [6]. The detailed simulation of energy systems along with the communication architecture requires hybrid models, i.e., models including both continuous time-based and discrete-event-based simulation aspects. There are different domain-specific simulation tools that have been developed and described in the literature to simulate the dynamic system beha-vior for power systems in different frameworks, e.g., electrical systems, cyber-physical systems, control or stochastic environ-mental behavior [7]. A commonly tool available for such kind of analysis is Simulink® of MathWorks that can help in studying the behavior of models with hybrid dynamics. Other than this, de-veloping co-simulation framework is also possible that allows the use of most appropriate expert tool for each domain. But in this case it has a disadvantage of making the different tools to work together efficiently [7]; e.g., time synchronization and data ex-change of two fundamentally different simulators are major
This work was partially supported by the CNRS (Conseil National de laRechercheScientifique) grant within the framework of CYBERGRIDExploratory Project.

SCADA/ supervisory level (sending the power setpoint)
IED/ PV plant connected to LV grid (receiving the power setpoint
as a reference input)
Setpoint is sent over MMS protocol supported by IEC
61850 communication standard
challenges [8]. Concerning the co-simulation framework, there are lot of approaches proposed in the literature that include using free and open-source available tools such as GridLAB-D and PSAT [7], or co-simulation tools, such as VPNET [8], combining INSPIRE & HLA [9]. The work proposed in this paper is using a more flexible approach for setting up a kind of co-simulation scenario in MATLAB®, as compared to the one discussed in [7-11]. Fig.1 suggests the main idea of the implemented co-simulation architecture.
Use of IEC 61850 protocol over the energy grid results in hybrid global dynamics. This paper deals with the implementa-tion of Manufacturing Message Specification (MMS) protocol supported by IEC 61850 communication protocol standard for controlling a photovoltaic (PV) plant connected to a low-voltage (LV) utility grid. Communication system consisting of the transport layer and a router placed on the network layer is mod-eled as an event-driven system using SimEvents® toolbox and energy grid is modeled as a time-driven system using SimPo-werSystems® toolbox. Mechanisms related to acknowledgments and retransmissions specific to TCP/IP as well as management of router’s queue length by means of Random Early Detection (RED) algorithm and congestion avoidance are implemented.
Co-simulation is performed to illustrate interaction between the communication system and the power system in terms of latencies affecting the global behavior of PV system. Fig. 1 de-picts the general scenario of the studied interaction.
Fig 1. Overview of co-simulation approach implemented.
This paper is organized as follows. Section II discusses the
IEC 61850-based communication system modelling. It is fol-lowed by Section III that describes LV utility grid modelling. In Sections IV and V, the coupled model and co-simulation results are presented, respectively, followed by conclusion of the work in Section VI, the final one.
II. IEC 61850-BASED COMMUNICATION SYSTEM MODELLING USING SIMEVENTS® / MATLAB®
A. IEC 61850-based Communication System IEC 61850 standard characterizes a comprehensive structure
for designing power utility automation system. This standard provides a data flow mechanism to exchange information among
the Intelligent Electronic Devices (IEDs) that embed the local control of different parts of smart grid.
Fig 2. IEC 61850 communication architecture [12]. Fig. 2 shows the communication architecture of the standard,
including three protocols: GOOSE (Generic Object Oriented Substation Event) messaging, MMS (Manufacturing Message Specification) and SV (Sampled Values) with two interface buses that support the data exchange.
B. Relation between IEC 61850 Standard and TCP/IP IEC 61850 standard supports three protocols, namely GOOSE,
SV and MMS to allow the data flow.
Fig 3. OSI mapping of IEC 61850 protocol.
MMS protocol supports MMS traffic that allows SCADA systems placed at supervisory level to access vertically all the IED objects. Its functioning is based on TCP/IP (layer 3). GOOSE traffic allows IEDs to access data horizontally. SV traffic carries the current and voltage samples used in discrete-time control. Out of the three mentioned protocols, MMS is the one that is based on TCP/IP layers and allows traditional supervision operations, i.e., read, write and report.
C. Transport Layer in TCP/IP Transport layer is an end-to-end protocol that provides
communication between two processes (application programs) running over different hosts. This layer sends data in segments. Transport layer supports two protocols: UDP (User Datagram Protocol) and TCP (Transmission Control Protocol). UDP is an unreliable connectionless protocol, whereas TCP is a connection-oriented protocol that provides reliable transport by establishing the connection between client and server before data transfer begins and releasing the connection after data transfer ends up. Hence TCP ensures error and flow control, as well as congestion control [13, 14].
D. TCP with RED (Random Early Detection) Router It is difficult to build a router that does not drop packets even
when it is overloaded with the incoming flow of packets. In order to allow the router to work properly, RED [15] algorithm is implemented, so as to keep a check on the moment of time the router should start discarding packets. Algorithm calculates the average queue length and, if it exceeds a pre-specified threshold, some packets are dropped on random basis. Main idea of the generalized RED algorithm is given below:
for each packet arrival calculate the average queue size (avg) if avg calculate probability with probability : mark the arriving packet else if
mark the arriving packet
E. Error Control in TCP TCP provides reliability using error control based on me-
chanism for detecting corrupted, lost, out-of-order and dupli-cated segments using simple tools like acknowledgment, re-transmission and segment reassembly.
• Acknowledgment: TCP uses ACK signals to confirm the receipt of data segments.
• Retransmission: sender retransmits the data segment, in case segment is lost or delayed. This occurs in two conditions: when retransmission timer expires or when sender receives three duplicate ACKs.
Retransmission RTO: one retransmission time-out timer is maintained for all sent, but not acknowledged segments. When timer matures, earliest outstanding segment is retransmitted. The value of RTO is updated based on round trip time (RTT) of segments.
RTT: time needed for a segment to reach the destination and for an acknowledgement to be received.
• Segment reassembly: TCP guarantees data to be delivered to process in ordered sequence.
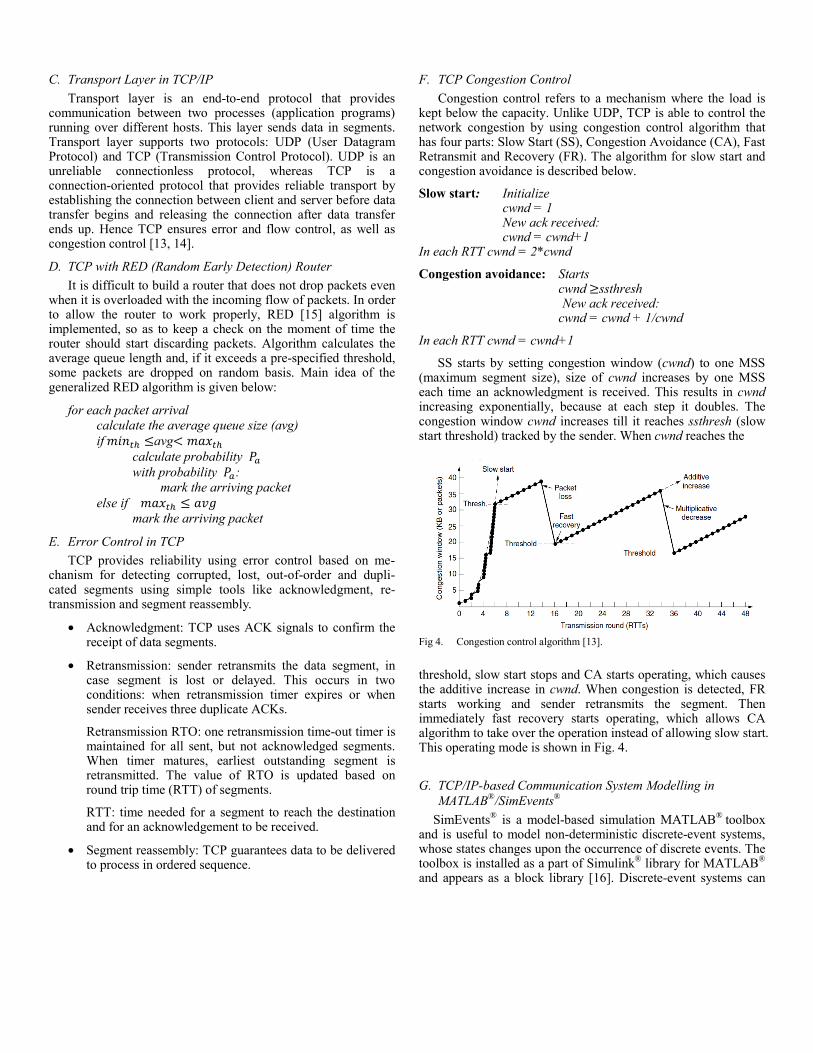
F. TCP Congestion Control Congestion control refers to a mechanism where the load is
kept below the capacity. Unlike UDP, TCP is able to control the network congestion by using congestion control algorithm that has four parts: Slow Start (SS), Congestion Avoidance (CA), Fast Retransmit and Recovery (FR). The algorithm for slow start and congestion avoidance is described below.
Slow start: Initialize cwnd = 1 New ack received: cwnd = cwnd+1 In each RTT cwnd = 2*cwnd
Congestion avoidance: Starts cwnd ssthresh
New ack received: cwnd = cwnd + 1/cwnd
In each RTT cwnd = cwnd+1
SS starts by setting congestion window (cwnd) to one MSS (maximum segment size), size of cwnd increases by one MSS each time an acknowledgment is received. This results in cwnd increasing exponentially, because at each step it doubles. The congestion window cwnd increases till it reaches ssthresh (slow start threshold) tracked by the sender. When cwnd reaches the
Fig 4. Congestion control algorithm [13].
threshold, slow start stops and CA starts operating, which causes the additive increase in cwnd. When congestion is detected, FR starts working and sender retransmits the segment. Then immediately fast recovery starts operating, which allows CA algorithm to take over the operation instead of allowing slow start. This operating mode is shown in Fig. 4.
G. TCP/IP-based Communication System Modelling in MATLAB®/SimEvents®
SimEvents® is a model-based simulation MATLAB® toolbox and is useful to model non-deterministic discrete-event systems, whose states changes upon the occurrence of discrete events. The toolbox is installed as a part of Simulink® library for MATLAB® and appears as a block library [16]. Discrete-event systems can

+ –
∼ ∼
…
…
…
Irr11 Irr12 Irr1m
Irr21 Irr22 Irr2m
Irrn1 Irrn2 Irrnm . . .
Voa
IPVa
VPVa
Ich IDC
VDC
DC-DC boost converter inverter
i
CDC CPV
three-phase utility grid
*chu
+ –
DC-link voltage control
iinv
VDC
*DCV
voltage control
+ –
VPVa V*
PVa
captured (active) power control n-by-m PV plant
+ –
PPVa
imposed operating point, *PVaP
UPPER-LEVEL CONTROL
LOW-LEVEL CONTROL
*invu
DC-link
i*inv_dq
be constructed as entity processor units. Various blocks such as generators, queues and servers can be used to process the entities. This part of work includes an efficient implementation of TCP/IP-based communication system in SimEvents®. The TCP/IP protocol has been analyzed and its above described characteristic strategies have been implemented using SimEvents®. Basic simulation models reported in [17] have been used here.
III. LOW-VOLTAGE (LV) UTILITY GRID MODELLING USING SIMPOWERSYSTEMS®/MATLAB®
A. Photovoltaic (PV) Generation System In this paper an IED supporting the power control of a PV
plant connected to an LV utility grid is considered. A PV system is a power source designed to supply usable solar power by means of photovoltaic cells. Several single PV cells can be con-nected in series and parallel to form PV modules, and PV mod-ules (or panels) can themselves be connected in series and pa-
rallel in order to increase power.
A PV system includes then an arrangement of solar panels that absorb and convert sunlight into electricity. The PV panels produce DC current and are connected to the AC grid by means of inverters; here, a so-called back-to-back structure consisting of a DC/DC boost converter and DC/AC three-phase inverter is used (Fig. 5).
The PV plant consists of an n-by-m array of PV modules, where n is the number of parallel-connected strings, each with m number of series-connected cells. Here n=7 and m=5. The control block diagram of the grid-connected PV plant in Fig. 5 shows the two levels of control structure: an upper-level control containing the active power control and a low-level control in charge with DC/DC converter’s voltage control. Notations in Fig. 5 are: is the power reference, is the boost converter duty cycle reference, is inverter duty cycle reference, is DC-link voltage, is DC-link current and _ is inverter current references in dq frame.
Fig 5. Grid-connected PV energy conversion system along with a two-level control structure [18].
B. Maximum Power Point Tracking (MPPT) Grid-connected PV systems are usually required to provide a
certain level of power whenever possible under the given irra-diance conditions. When irradiance level is not sufficient to en-sure the required power level, PV plant is controlled to provide the maximum power available. It is thus important to have an effective and appropriate MPPT algorithm for the PV system irrespective of irradiance variation. Lot of MPPT algorithms have been implemented in the literature [19-23], that include, among others, Perturb & Observe (P&O), Incremental Conduc-tance (IC), Hill Climbing (HC).
In this work Hill Climbing algorithm has been used, namely
by varying the DC/DC boost converter duty cycle (D) by comparing the power at present and previous time. Thus, if incremental power 0, then D is increased in order to make 0 ; otherwise, if 0 , then D is reduced to make 0 . The current operating point is moved towards the maximum power one, characterized by ⁄ 0.
C. Modified Maximum Power Point Tracking The MPPT algorithm has been modified with the possibility
of power control in order to get a certain power level, denoted by . If the required power is larger than the maximum one that PV plant can deliver, then MPPT operation must be ensured.

Fig 6. Power-voltage curve of a PV plant for a given irradiance level Irr1.
In Fig. 6 the general power-voltage curve of a PV plant for a given irradiance level is shown. is the power reference coming from an upper level; here the upper level is denoted as a dispatcher or supervisor, where the dispatcher is unaware of the maximum power that PV plant can provide at a given time. Modifications brought to the original MPPT algorithm are explained next. P(n) and P(n–1) denote measured PV power at current time and previous time steps, respectively.
CASE A : When
CASE A.1: Voltage must increase as long as 1 1 .
CASE A.2: Voltage must decrease as long as 1 1 .
So in case A sign of voltage variation is same as in MPPT.
CASE B : When
CASE B.1: Voltage must decrease as long as 1 1 .
CASE B.2: Voltage must increase as long as 1 1 .
So in case B sign of voltage variation must be reversed compared to the one for MPPT.
In conclusion, wherever the current operating point is placed, if voltage variation is the one used for MPPT multiplied by , then power regulation at is whenever irradiance level allows it. The modified MPPT algorithm flowchart is given in Fig. 7.
Fig 7. Modified MPPT algorithm.
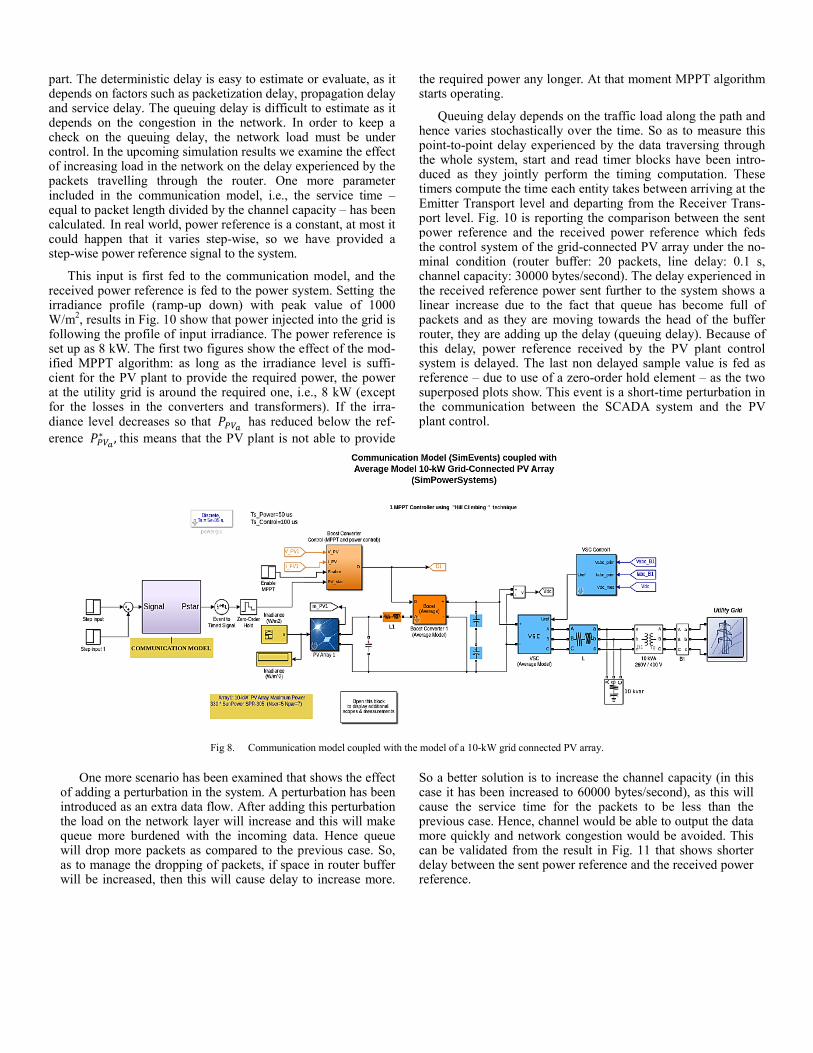
IV. CO-SIMULATION MODEL It is considered that the PV plant included in the low-voltage
distribution grid receives power setpoint, , from a dispatcher which belongs to a more complex and remotely located SCADA system. Therefore, reference signal must be transmitted over a communication network. The protocol used to this end is the MMS from IEC 61850 operating over TCP/IP, used for communication between SCADA and the considered low-voltage distribution grid control system acting as an IED. Fig. 8 shows the coupling between the two models as a single Simulink® diagram, i.e., the event-driven communication model – detailed in Fig. 9 – and the time-driven model of the low-voltage distribution grid together with its control. An event-to-timed based signal conversion block was necessary to couple these two models.
V. CO-SIMULATION RESULTS Simulation results shown next have been obtained under
nominal conditions for the communication system. Thus, the network layer in the communication model is equipped with buffer space (queue) at the router that can store maximum 20 packets at a time. The router buffer has high capacity link at its input (as it can receive large number of packets without delay), but limited channel capacity output of 30000 bytes/second and this can lead to congestion in the network. The communication model has a constant line propagation delay of 0.1 seconds. This part of work is not concerned with the router behavior of distributing packets along the different paths, but instead with the router behavior in case of congestion, as that affects the delay times of the packets travelling through it. The delay experienced on the end-to-end path in the network can be decomposed into a deterministic (e.g., propagation) and a stochastic (e.g., queuing)
_
Region 1
Region 2 1: P/dV >0 2: P/dV <0
part. The deterministic delay is easy to estimate depends on factors such as packetization delay, pand service delay. The queuing delay is difficultdepends on the congestion in the network. In check on the queuing delay, the network loadcontrol. In the upcoming simulation results we exof increasing load in the network on the delay expackets travelling through the router. One included in the communication model, i.e., thequal to packet length divided by the channel capcalculated. In real world, power reference is a cocould happen that it varies step-wise, so we step-wise power reference signal to the system.
This input is first fed to the communicationreceived power reference is fed to the power syirradiance profile (ramp-up down) with peakW/m2, results in Fig. 10 show that power injectefollowing the profile of input irradiance. The poset up as 8 kW. The first two figures show the eified MPPT algorithm: as long as the irradiancient for the PV plant to provide the required pat the utility grid is around the required one, i.for the losses in the converters and transformdiance level decreases so that has reduceerence , this means that the PV plant is no
Fig 8. Communicati
One more scenario has been examined thatof adding a perturbation in the system. A pertuintroduced as an extra data flow. After addingthe load on the network layer will increase anqueue more burdened with the incoming dawill drop more packets as compared to the pas to manage the dropping of packets, if spacewill be increased, then this will cause delay t
or evaluate, as it propagation delay t to estimate as it order to keep a
d must be under xamine the effect xperienced by the more parameter e service time – pacity – has been onstant, at most it have provided a
n model, and the stem. Setting the
k value of 1000 ed into the grid is ower reference is
effect of the mod-ce level is suffi-power, the power e., 8 kW (except
mers). If the irra-ed below the ref-ot able to provide
the required power any longer. At thstarts operating.
Queuing delay depends on the trhence varies stochastically over thepoint-to-point delay experienced bythe whole system, start and read tiduced as they jointly perform thetimers compute the time each entityEmitter Transport level and departiport level. Fig. 10 is reporting the power reference and the received the control system of the grid-connminal condition (router buffer: 20channel capacity: 30000 bytes/seconthe received reference power sent flinear increase due to the fact thapackets and as they are moving torouter, they are adding up the delaythis delay, power reference receivsystem is delayed. The last non dereference – due to use of a zero-ordsuperposed plots show. This event ithe communication between the Splant control.
ion model coupled with the model of a 10-kW grid connected PV array.
t shows the effect urbation has been
g this perturbation nd this will make ata. Hence queue revious case. So, e in router buffer to increase more.
So a better solution is to increase thcase it has been increased to 60000cause the service time for the paprevious case. Hence, channel woulmore quickly and network congestican be validated from the result in delay between the sent power referereference.
hat moment MPPT algorithm
raffic load along the path and e time. So as to measure this y the data traversing through imer blocks have been intro-e timing computation. These y takes between arriving at the ing from the Receiver Trans-comparison between the sent power reference which feds
nected PV array under the no-0 packets, line delay: 0.1 s, nd). The delay experienced in further to the system shows a at queue has become full of wards the head of the buffer
y (queuing delay). Because of ved by the PV plant control elayed sample value is fed as der hold element – as the two is a short-time perturbation in SCADA system and the PV
he channel capacity (in this 0 bytes/second), as this will ackets to be less than the ld be able to output the data ion would be avoided. This Fig. 11 that shows shorter
ence and the received power

Fig 9.
F
Fig 11. Co-simulation re
Communication model included in the coupled model.
Fig 10. Co-simulation results in the nominal case.
sults when perturbation is added in input and channel capacity is increase
MPPT
ed.

VI. CONCLUSION This paper investigates how the interaction between the
communication system and the energy grid affects the global behavior of a smart grid, as the communication parameters affect the data transmission in the power system. The communication model based on TCP/IP protocol (MMS from IEC 61850) has been incorporated for establishing the vertical communication between the SCADA system and IEDs, where the IED considered here is the local control system of a PV array connected to an LV grid. The MATLAB® co-simulation results have shown that changing the parameters such as input to the communication system, router buffer, and channel capacity changes the data flow in the power system. It can be concluded that if the input data flow is increased, the router buffer can help in reducing the data loss but on the other hand it will lead to increase in delay. A better idea is to increase the channel capacity wherever possible, so as to avoid the network congestion.
Future work will aim at enriching the proposed co-simulation model and using it to derive an as general as possible formal model suitable for a large class of smart grids.
REFERENCES [1] W. Li, M. Ferdowsi, M. Stevic, A. Monti, F. Ponci, "Cosimulation for
Smart Grid Communications," IEEE Trans. on Industrial Informatics, vol. 10, no. 4, pp. 2374-2384, November 2014.
[2] E. Padilla, K. A E. Padilla, K. Agbossou, A. Cardenas, "Towards Smart Integration of Distributed Energy Resources Using Distributed Network Protocol Over Ethernet," IEEE Trans. on Smart Grid, vol. 5, no. 4, pp. 1686 – 1695, July 2014.
[3] M. Manbachi, M. Nasri, B. Shahabi, H. Farhangi, A. Palizban, S. Arzanpour, M. Moallem, D.C. Lee, "Real–Time Adaptive VVO/CVR Topology Using Multi–Agent System and IEC 61850 – Based Communication Protocol," IEEE Trans. on Sustainable Energy, vol. 5, no. 2, pp. 587 – 597, April 2014.
[4] B. Rozel, M. Viziteu, R. Caire, N. Hadjsaid, J.-P. Rognon, "Towards a Common Model for Studying Critical Infrastructure Interdependencies," in Procs. IEEE Power and Energy Society General Meeting – Conversion and Delivery of Electrical Energy in the 21st century, pp. 1-6, July 2008.
[5] R. Caire, J. Sanchez, N. Hadjsaid, "Vulnerability Analysis of Coupled Heterogeneous Critical Infrastructures: a Co – simulation Approach with a Testbed Validation," in Procs. 4th IEEE/PES, Innovative Smart Grid Technologies Europe (ISGT EUROPE), pp. 1- 5, October 2013.
[6] P. Ferrari, A. Flammini, S. Rinaldi, E. Sisinni, G. Prytz, "Co-simulation of Network Infrastructure for Substation Automation Systems," in Procs. ETFE, pp. 1-4, September 2013.
[7] M. Stifter, E. Widl, F. Andren, A. Elsheikh, T. Strasser, P. Palensky, "Co-simulation of Components, Controls and Power Systems based on
Open Source Software," in Procs. IEEE/ PES, pp. 1-5, July 2013. [8] M. Stevic, W. Li, M. Ferdowsi, A. Benigni, F. Ponci , A. Monti, "A
Two-Step Simulation Approach for Joint Analysis of Power Systems and Communication Infrastructures," in Procs. 4th IEEE/PES Innovative Smart Grid Technologies Europe (ISGT EUROPE), pp. 1-5, October 2013.
[9] H. Georg, S. C. Muller, C. Rehtanz, C. Wietfeld, "Analyzing Cyber-Physical Energy Systems: The INSPIRE Cosimulation of Power and ICT Systems using HLA," IEEE Trans. on Industrial Informatics, vol. 10, no. 4, pp. 2364 – 2373, November 2014.
[10] B. Jablkowski, O. Spinczyk, M. Kuech, C. Rehtanz, "A Hardware-in-the-Loop Co-Simulation Architecture for Power System Applications in Virtual Execution Environments," 2014 Workshop on Modeling and Simulation of Cyber-Physical Energy Systems (MSCPES), pp. 1-6, April 2014.
[11] V, Kounev, D. Tipper, M. Levesque, B. M. Grainger, T. McDermott, G. F. Reed, "A Microgrid Co-Simulation Framework," 2015 Workshop on Modeling and Simulation of Cyber-Physical Energy Systems (MSCPES), pp. 1-6, April 2015.
[12] Euro-System, IEC 61850 training session. [13] A. S. Tanenbaum, D. J. Wetherall, Computer Networks, 5th ed.
Cambridge: Pearson, 2010. [14] B. A. Forouzan, Data Communications and Networking, 4th ed.
Columbus: McGraw-Hill Higher Education, 2006. [15] S. Floyd, V. Jacobson, "Random Early Detection Gateways for
Congestion Avoidance," IEEE/ACM Trans. on Networking, vol. 1, no. 4, pp. 397- 413, August 1993.
[16] X. Xu, Z. Wang, "Networked Modeling and Simulation Based on SimEvents,” International Conference on Semantic Computing (ICSC) on System Simulation and Scientific Computing, vol. 1, no. 4, pp. 1421-1424, October 2008.
[17] C. Chiculiţă, Contributions on control structures for telepresence systems (in Romanian: Contribuţii privind structurile de conducere pentru sistemele de teleprezenţă), Ph.D. Thesis, “Dunărea de Jos” University of Galaţi, Romania, 2012.
[18] A.I. Bratcu, I. Munteanu, S. Bacha, B. Raison, "Maximum Power Point Tracking of Grid-connected Photovoltaic Arrays by Using Extremum Seeking Control,” Control Engineering and Applied Informatics, vol. 10, no. 4, pp. 3-12, 2008.
[19] Ting-Chung Yu, Yu-Cheng Lin, "A Study on Maximum Power Point Tracking Algorithms for Photovoltaic Systems,” IEEE Applied Power Electronics Colloquium (IAPEC), April 2011.
[20] K. Ishaque, Z. Salam, "A review of maximum power point tracking techniques of PV system for uniform insolation and partial shading condition,” Renewable and Sustainable Energy Reviews, vol. 19, pp. 475–488, 2013.
[21] P. Bhatnagar, R. K. Nem, "Maximum power point tracking control techniques: State-of-the-art in photovoltaic applications,” Renewable and Sustainable Energy Reviews, vol. 23, pp. 224–241, 2013.
[22] V. Salas, E. Olías, A. Barrado, A. Lázaro, "Review of the maximum power point tracking algorithms for stand-alone photovoltaic systems,” Solar Energy Materials and Solar Cells, vol. 90, pp. 1555-1578, 2006.
[23] M.A. Gomes de Brito, L. Galotto, Jr., L. Poltronieri Sampaio, G. de Azevedo e Melo, C.A. Canesin, "Evaluation of the Main MPPT Techniques for Photovoltaic Applications,” IEEE Trans. on Industrial Electronics, vol. 60, no. 3, pp. 1156-1167, March 2013.