co2 conversion by plasma technology: insights from modeling the plasma chemistry and plasma reactor...
TRANSCRIPT

This content has been downloaded from IOPscience. Please scroll down to see the full text.
Download details:
IP Address: 62.44.99.95
This content was downloaded on 10/06/2017 at 14:58
Please note that terms and conditions apply.
CO2 conversion by plasma technology: insights from modeling the plasma chemistry and
plasma reactor design
View the table of contents for this issue, or go to the journal homepage for more
2017 Plasma Sources Sci. Technol. 26 063001
(http://iopscience.iop.org/0963-0252/26/6/063001)
Home Search Collections Journals About Contact us My IOPscience
You may also be interested in:
Modeling plasma-based CO2 conversion: crucial role of the dissociation cross section
Annemie Bogaerts, Weizong Wang, Antonin Berthelot et al.
CO2 conversion in a gliding arc plasma: 1D cylindrical discharge model
Weizong Wang, Antonin Berthelot, Stanimir Kolev et al.
Evaluation of the energy efficiency of CO2 conversion in microwave discharges using a reaction
kinetics model
Tomáš Kozák and Annemie Bogaerts
Modeling of plasma-based CO2 conversion: lumping of the vibrational levels
Antonin Berthelot and Annemie Bogaerts
Dielectric barrier discharges used for the conversion of greenhouse gases: modeling the plasma
chemistry by fluid simulations
Christophe De Bie, Tom Martens, Jan van Dijk et al.
Splitting of CO2 by vibrational excitation in non-equilibrium plasmas: a reaction kinetics model
Tomáš Kozák and Annemie Bogaerts
Plasmas for environmental issues: from hydrogen production to 2D materials assembly
E Tatarova, N Bundaleska, J Ph Sarrette et al.
An investigation of CO2 splitting using nanosecond pulsed corona discharge: effect of argon
addition on CO2 conversion and energy efficiency
M S Moss, K Yanallah, R W K Allen et al.

Topical Review
CO2 conversion by plasma technology:insights from modeling the plasmachemistry and plasma reactor design
A Bogaerts1 , A Berthelot1, S Heijkers1, St Kolev2, R Snoeckx1, S Sun1,G Trenchev1, K Van Laer1 and W Wang1
1Research group PLASMANT, Department of Chemistry, University of Antwerp, Universiteitsplein 1,B-2610 Wilrijk-Antwerp, Belgium2 Faculty of Physics, Sofia University, 5 James Bourchier Boulevard, 1164 Sofia, Bulgaria
E-mail: [email protected]
Received 23 October 2016, revised 12 February 2017Accepted for publication 3 April 2017Published 15 May 2017
AbstractIn recent years there has beengrowing interest in the use of plasma technology for CO2
conversion. To improve this application, a good insight into the underlying mechanisms is ofgreat importance. This can be obtained from modelingthe detailed plasma chemistry in ordertounderstand the chemical reaction pathways leading to CO2 conversion (either in pure form ormixed with another gas). Moreover, in practice, several plasma reactor types are beinginvestigated for CO2 conversion, so in addition it is essential to be able to model these reactorgeometriesso thattheir design can be improved, andthe most energy efficient CO2 conversioncan be achieved. Modeling the detailed plasma chemistry of CO2 conversion in complex reactorsis, however, very time-consuming. This problem can be overcome by using a combination oftwo different types of model:0D chemical reaction kinetics models are very suitable fordescribing the detailed plasma chemistry, while the characteristic features of different reactorgeometries can be studied by 2D or 3D fluid models. In the first instancethe latter canbedeveloped in argon or heliumwith a simple chemistryto limit the calculation time; however,theultimate aim is to implement the more complex CO2 chemistry in these models. In the presentpaper, examples will be given of both the 0D plasma chemistry models and the 2D and 3D fluidmodels for the most common plasma reactors used for CO2 conversion in orderto emphasize thecomplementarity of both approaches. Furthermore, based on the modeling insights, the paperdiscusses the possibilities and limitations of plasma-based CO2 conversion indifferent types ofplasma reactors, as well aswhat isneeded to make further progress in this field.
Keywords: plasma modeling, plasma chemistry, plasma reactors, CO2 conversion, 0D chemicalreaction kinetics modeling, fluid modeling
1. Introduction
Global warming is one of the major problems of the 21stcentury. To solve this problem, the atmospheric CO2 con-centration needs to be drastically reduced. Several initiativesare being undertaken, such as reducingCO2 emissionsbyincreasing the overall energy efficiency of various processes,
using more sustainable energy sources instead of burningfossil fuels, andalso using carbon capture and storage (CCS)or utilization (CCU), for example. The latter technique isparticularly interesting, because the CO2 can be convertedinto value-added chemicals, which can be used as feedstockfor the chemical industry or as renewable fuels. This con-version might thus simultaneously be able to solve two
Plasma Sources Science and Technology
Plasma Sources Sci. Technol. 26 (2017) 063001 (34pp) https://doi.org/10.1088/1361-6595/aa6ada
0963-0252/17/063001+34$33.00 © 2017 IOP Publishing Ltd1

important problems, namelyglobal warmingandalso ourdependence on fossil feedstocks for transport, energy and asbuilding blocks in the chemical industry. Furthermore, turn-ing a waste product like CO2 into new feedstock fits into theframework of green chemistry and also complies with therevolutionary ‘cradle-to-cradle’ principle [1].
A lot of research is being done on energy-efficient con-version technologies, such as thermal catalysis, electro-catalysis, photocatalysis, bioelectrocatalysis, etc (e.g.[2–4]).In recent years, there hasalso been growing interestinplasma and plasma catalysis as a possible energy-efficientalternative, because the conversion can proceed inmildreaction conditions. Indeed, the gas does not have to beheated as a whole, because the electrons can activate the gasby electron impact excitation, dissociation and ionization.Moreover, as plasma can easily be switched on/off, it alsohas great potential for the temporary storage of excessrenewable energy during peak production. Thus, plasmatechnology can contribute to the solution for a third majorproblem of the 21st century—namelythe integration ofintermittent renewable energy into the existing electricity grid—and thusprovide a solution for the current imbalancebetween the supply and demand forenergy, by usingexcessrenewable energy for the conversion of CO2 into new fuels.
However, more basic research is still essential beforeplasma technology can be successfully applied tothis appli-cation. This is possible through experiments, but also bymodeling the plasma chemistry for CO2 conversion and bymodeling the plasma reactors typically used for this purpose.
The most commonly used plasma reactor types for CO2
conversion are (packed-bed) dielectric barrier discharges(DBDs) [5–18], microwave (MW) plasmas [19–24] and low-current non-thermal gliding arc (GA) discharges [25–33]—although ns-pulsed [34] and spark discharges [35–37] havealso been employed. There is a clear need for more detailedmodeling of these plasma reactor types in orderto reveal theircharacteristic featuresandbetter understand how these fea-tures affect their energy efficiency. Indeed, the energy effi-ciency of CO2 conversion is one of the major criteria in thesearch for optimal plasma reactor design. Until now, thehighest energy efficiency that has been reportedisup to90%for an MW plasma[19], but it is important to realizethat this was obtained under very specific conditions,namely,supersonic gas flow and reduced pressure (∼100–200 Torr), while anincrease ofthe pressure to 1 atm, which isdesirable for industrial applications, causessignificantlylower energy efficiency ofaround 40% at normal flowconditions [37]. Moreover, such high values have not yetbeen reproduced since then. The highest energy efficiencyreported more recently for an MW plasma is55% [22],but this was again at reduced pressure and supersonicflow. Furthermore, an energy efficiency of 50% wasrecentlyobtained for an MW plasma at atmospheric pressure,by applying a reverse vortex flow [23]. A GA plasma alsoexhibits quitehigh energy efficiency,even at atmosphericpressure, namelyaround 30%–35% for a conversion of about10% in the case of CO2 splitting, as obtained in a reversevortex flow (RVF) GA [27, 33], and even around 60% for a
conversion of 8%–16%, for the dry reforming of methane(DRM) [29]. Moreover, the combination of a GA plasma withcatalysts in a heat-insulated reactor has shown to yield adramatic rise in energy efficiency (up to 86%) with a CH4
conversion of 92% and a CO2 conversion of 23% [32]. Theenergy efficiency of a DBD is more limited atup to 10% for aCO2 conversion of 30% (e.g.[16]), but this value can beimproved by inserting(dielectric) packing into the reactor,yielding a so-called packed-bed DBD reactor (e.g.[14, 18]).Moreover, when the packing is catalytically active, thisenables the selective production of targeted compounds, inso-called plasma catalysis (e.g.[7–9, 12, 13]). Furthermore, aDBD reactor typically operates at atmospheric pressure andhas a very simple design, making it suitable for upscaling.Therefore, it also has potential for industrial applications.
To investigate which reactor designs can lead toimproved CO2 conversion, 2D or even 3D fluid models areprobably the most suitable approaches, in terms of providingacompromise between the level of detail and calculationtime. However, such fluid models still require a long calcul-ation time, certainly in the case of complex geometries or gasflow patterns (e.g.supersonic flow or reverse vortex flow),which are of interest for improved CO2 conversion, as men-tioned above. Therefore, to our knowledge, there exist no 2Dor 3D models yet for describing CO2 conversion. The fluidmodels that have been developed up to now in theliteraturefor the above types of plasma reactors are typically developedfor argon or helium, or sometimes for air, with limitedchemistry.
For packed-bed DBD reactors, different types of mod-eling approaches can be found in the literature. Chang [38]applied a 0D plasma chemistry model, simply predicting theenhancement factor of the electric field in the voids betweenthe ferroelectric pellets from the ratio of the dielectric constantof the pellets and the gas phase, while Takaki et al [39]developed a simplified time-averaged 1D model for N2, basedon solving the transport equations and Poisson’s equation. Yaet al [40] developed a 2D particle-in-cell/Monte Carlo col-lision (PIC/MCC) model to describe the filamentary dis-charge behavior in a parallel-plate packed-bed DBD reactor inair. Furthermore, some 2D fluid modeling efforts have alsobeen reported. Kang et al [41] developed a 2D model of aDBD reactor with two stacked ferroelectric beads inside,studying the propagation of the microdischarges during thefirst 20 ns, and describing the behavior of electrons and ionsby a set of fluid equations, althoughno plasma chemicalspecies were taken into account. Russ et al [42] applied a 2Dfluid model to simulate transient microdischarges in a packed-bed DBD reactor filled with dry exhaust gas, but onlyfocusing on a short discharge (afew tens of nanoseconds).Kushner and co-workers [43] recently presented 2D fluidmodel simulations for a packed-bed reactor constructed out ofdielectric rodsin humid air, studyingthe mechanism of dis-charge propagationin detail, while Van Laer et al [44, 45]developed two complementary 2D fluid models to describe apacked-bed DBD reactor in helium.
For MW plasmas, there exist a large number of modelingapproaches in the literature, atvarious levels of detail, and a
2
Plasma Sources Sci. Technol. 26 (2017) 063001 Topical Review

recent overview was presented in [46]. Self-consistent 2Dfluid models, solving the Maxwell equations for the ele-tromagnetic field and a set of plasma fluid equations,assuming ambipolar diffusion, have been developed by vanDijk, van der Mullen and co-workers [47–49] and by Graves,Moisan and co-workers [50]. Some of these models wereapplied to atmospheric pressure cylindrical (surfaguide orsurfatron) MW plasmas [48, 50], while others were applied tointermediate pressure coaxial microwave discharges [49].These models are very valuable, but they havenot beenapplied in the context of CO2 conversion. Recently, a com-parison between two fluid models, based on the coupledsolution of the species conservation equations and Poisson’sequation (i.e. theso-called non-quasi-neutral approach) on theone hand, and on a quasi-neutral approach on the other, waspresented at intermediate pressure—again for argon—butwith the intention ofextending it to CO2 [46]. Finally, Chenet al showed calculated 2D electron density and electrontemperature profiles, again in an argon MW plasma obtainedby a quasi-neutral fluid approach, but in the context of cata-lyst activation for CO2 decomposition [51].
For low-current non-thermal GA discharges (typicallynear 1 A or below), some simple 1D analytical or semi-ana-lytical models have been developed [52–57], such as the so-called plasma string model [52] and the Elenbaas–Hellermodel.Theseassumetheequilibrium plasma and the radiusof the plasma channel to be constant [53–55] or with a cor-rection based on an analytical relation between the electricfield and the electron and gas temperatures for a non-equili-brium plasma [56]. Some studies have also focused on thecalculation of theelectrical parameters of the discharge [57].However, these simple models do not includedetailedchemistry, and they cannot describe the complex behavior ofthe GA, including unsteady behavior in time and space, arcrestrike, non-equilibrium effects, theeffects of flow patterns,etc, so they inevitably cause a large deviation from the actualsituation. Recently, Gutsol and Gangoli presented a simple2D model of a GA, in the plane parallel to the gas flow andperpendicular to the discharge current, providing very usefulinformation about the gas–discharge interaction [58]. Withinour group, we have also developed a 2D non-quasi-neutralfluid model to study the arc gliding process in an argon GA[59], and we compared the glow and arc mode in this setup[60]. Moreover, we also presented a 2D quasi-neutral model[61], and this approach hasalso been applied in 3D modelingfor a classical (diverging electrode) GA [62] and anRVF GA(also called a GA plasmatron:GAP) [63]. These models wereall developed for argon, but recently, we also presented a 0Dmodel [64] and a 1D model [65] for a GA in CO2, consideringthe detailed plasma chemistry of CO2 conversion. Further-more, Indarto et alalso presented a 0D model for a GA,describing the chemistry of CH4 conversion [66, 67].
Describingdetailed plasma chemistry in 2D or 3Dmodels, with hundreds of species and chemical reactions, iscurrently not yet feasible, as it would yield excessively longcalculation times. For this purpose, 0D plasma chemistrymodeling is much more suitableforelucidatingthe under-lying chemical reaction pathways. In the 80s and 90s of the
previous century, some paperson CO2 plasma chemistrymodelinghad already beenpublished, albeit for applicationsto CO2 lasers [68–70]. Furthermore, some papers studied thevibrational kinetics of CO2 for gas flow applications, althoughnot with a focus on the plasma chemistry [71, 72]. Rusanov,Fridman and Sholin were the first to develop a model for CO2
conversion in an MW plasma, based on particle and energyconservation equations for the neutral species, as well as ananalytical description of the vibrational distribution function[73]. This model was able to predictCO2 conversion andenergy efficiency in good agreement with the experimentaldata, but it stilldid notinclude the full plasma chemistry withcharged species ora self-consistent calculation of the electrondensity.
In the last two decades, a large number ofplasmachemistry models have been developed in the literature, forpure CO2 splitting [16, 64, 65, 74–89] andalso forCH4 (which is of interest for hydrocarbon reforming)[66, 67, 90, 91], as well as in various mixtures, such asCO2/CH4 [92–104], CH4/O2 [104–110], CO2/H2O [111]and CO2/H2 [7, 112]. Indeed, mixtures of CO2 with aH-source gas—such as CH4, H2O or H2—are being investi-gated in order to produce a variety of value-added chemicals,such assyngas (aCO/H2 mixture), which can be used inFischer–Tropsch synthesis for the production of liquidhydrocarbons. Moreover, the direct formation of oxygenatesand higher hydrocarbons by plasma technology is beinginvestigated as well. Furthermore, some papers have focusedon modeling the plasma chemistry in CO2/N2 [113, 114] orCH4/N2 [115–120] mixtures. These mixtures are indeed ofgreat interest, because N2 is a major component in effluentgases, and investigating these mixtures can reveal whethertoxic (NOx) compounds would be formed in the presence ofN2—or vice versa, whether this provides the potential forN-fixation if sufficiently high concentrations of these com-pounds canbe formed. It should be noted that most of theabove studies are based on 0D chemical kinetics models,although some are based on 1D fluid modeling.
In the following, a brief description of both 0D chemicalkinetics modeling, applied to CO2 or CH4 conversion and theabove-mentioned mixtures, as well as 2D or 3D fluid mod-eling approaches for the various plasma reactors of interest forCO2 conversion, will be presented. Subsequently, sometypical modeling results will be illustrated, mainly from ourown work, but complemented bysome data from the litera-ture. We will show that these modeling results can givemoreinsights into the underlying mechanisms, andreveal thepossibilities and limitations for CO2 conversion (and itsmixtures) in various types of plasmas. Finally, in the con-clusion, we will give an outlook of what is needed fromfu-ture modelingto make further progress in this field, and wewill also make an assessment of the most suitable reactor andreaction conditions for CO2 conversion, based on the mod-eling insights presented in this paper. Finally, based onthese results, we will indicate whether plasma technologycan be competitive with other emerging CO2 conversiontechnologies.
3
Plasma Sources Sci. Technol. 26 (2017) 063001 Topical Review

2. Model description
2.1. Zero-dimensionalchemical kinetics modeling
As mentioned above, the most convenient way of study-ingdetailed plasma chemistry isby means of 0D plasmachemistry models, as they allowa large number of species tobe described, and incorporate a large number of chemicalreactionswith limited computational effort. A 0D chemicalkinetics model is based on solving the balance equations forall thedensities of the species, based on the production andloss rates, as defined by the chemical reactions:
n
ta a k n
d
di
jij ij j
lla2 1 lj
1
å = -{( ) }( ) ( )( )
where aij1( ) and aij
2( ) are the stoichiometric coefficients ofspecies i, onthe left- and right-hand side of a reaction j,respectively, nl is the species density onthe left-hand sideof the reaction, and kj is the rate coefficient of reaction j(see below).
Table 1 illustrates the species typically included in suchmodelsforpure CO2 andpure CH4, as well as the extra speciesincluded in CO2/CH4, CO2/H2O, CO2/H2andCH4/O2 gasmixtures, and in CO2/N2 and CH4/N2 mixtures. Note that thesame species can be included in the CO2/CH4, CO2/H2O, CO2/H2 and CH4/O2 models, because these combinations indeedyield the production of similar molecules. For the CO2/N2 andCH4/N2 mixtures, again mostly the same species can be inclu-ded in the model, but with some exceptions. Details of thesechemistries for the specific gas mixtures can be foundin[16, 74–76, 100–102, 104, 111–114, 120].
As the vibrational levels of CO2 can play an importantrole in energy-efficient CO2 conversion—at least in MW andGA plasmas [121]—a lot of attention should be paid to adetailed description of the vibrational kinetics of CO2, espe-cially when modeling MW or GA conditions. This is espe-cially true for the asymmetric stretch mode of CO2, becausethe latter is considered as the most important channel fordissociation [121]. Additionally, when modeling a CO2/N2
mixture in an MW or GA plasma, it is also important toincorporate the N2 vibrational levels, which turn out to be
Table 1. An overview of the species typically included in plasma chemistry models for pure CO2, pure CH4, as well as extra species includedin CO2/CH4, CO2/H2O, CO2/H2 and CH4/O2 gas mixtures, and in CO2/N2 or CH4/N2 mixtures.
Molecules Charged species Radicals Excited species
Species of interest in pure CO2 models
CO2, CO CO ,2+ CO ,4
+ CO+, C O ,2 2+
C O ,2 3+ C O ,2 4
+ C ,2+ C+,
CO ,3- CO4
-
C2O, C, C2 CO2(Va, Vb, Vc, Vd), CO2(V1-V21),CO2(E1, E2), CO(V1-V10),CO(E1-E4)
O2, O3 O+, O ,2+ O ,4
+ O−, O ,2-
O ,3- O4
-O O2(V1-V4), O2(E1-E2)
Electrons
Species of interest in pure CH4 models
CH4 CH ,5+ CH ,4
+ CH ,3+ CH ,2
+
CH+, C+CH3, CH2, CH, C CH4
*
C2H6, C2H4, C2H2, C2 C H ,2 6+ C H ,2 5
+ C H ,2 4+ C H ,2 3
+
C H ,2 2+ C2H
+, C2+
C2H5, C2H3, C2H C2H6*, C2H4
*, C2H2*
C3H8, C3H6, C4H2 C3H7, C3H5 C3H8*
H2 H ,3+ H ,2
+ H+, H− H H2*
Extra species typically included in CO2/CH4, CO2/H2O, CO2/H2 or CH4/O2 models
H2O, H2O2 H3O+, H2O
+, OH+, OH− OH, HO2 H2O*
CH2O, CH3OH, CH3OOH CHO, CH2OH, CH3O,CH3O2
C2H5OH, C2H5OOH,CH3CHO, CH2CO
CHCO, CH3CO, CH2CHO,C2H5O, C2H5O2
Extra species typically included in CO2/N2 and/or CH4/N2 models
N2 N+, N ,2+ N ,3
+ N4+ N N2(V1-V14), N2(C u
3P ), N2(A3
uS+),N2(a′
1 ,uS-) N2(B g3P ), N(2D), N(2P)
N2O, N2O3, N2O4, N2O5 NO+, N2O+, NO ,2
+ NO−,N2O
−, NO ,2- NO ,3
- N O2 2+
NO, NO2, NO3,
HCN, ONCN, C2N2 HCN+ H2CN, CN, NCO, NCNNH3 NH ,4
+ NH ,3+ NH ,2
+ NH+ NH2, NH NH3*
N2H4, N2H2 N2H3, N2H
4
Plasma Sources Sci. Technol. 26 (2017) 063001 Topical Review
important for populating the CO2 vibrational levels in an MWplasma [113]. Furthermore,the CO vibrational levels are alsotypically taken into account, up to level ten(see table 1).They are, however, not so important at the conditions understudy, although the first levels of CO can have a minorinfluence on the CO2 conversion. Besides, fourCO electro-nically excited states are included in table 1, but they donothave much effect. Indeed, in the reduced chemistry modelthat we developed for the MW plasma [85], we were able toremove both the vibrationally and electronically excited statesof CO without affecting the results. On the other hand, thevibrational levels of O2 are more important for studying theCO2 conversion, since the dissociation of O2 creates an Oatom, which can react with another CO2 molecule, and thusenhance the overall conversion. Therefore, some of the lowestO2 vibrational levels with the highest population should alsobe included in themodels for CO2 conversion, at least for anMW and GA plasma. Of course, the higher the CO2 con-version, the more CO and O2 are produced, and the more wecan expect these levels to have an influence on the results.
The vibrationally and electronically excited levels ofCO2, CO, O2 and N2, which are typically included in thesemodels, are indicated in table 1 with the symbols ‘V’ and ‘E’.Details ofthese notations can be found in [75, 113]. For theN2 electronically excited levels, the detailed notations aregiven in table 1. Note that vibrationally excited levels mightalso be important for the CH4, H2O and H2 molecules, whenmodeling the CO2/CH4, CO2/H2O, CO2/H2 and CH4/O2
mixtures in an MW or GA plasma. However,to our knowl-edge, such models have not yet been developed in the lit-erature, and these mixtures have only been described up tonow for a DBD plasma, where the vibrational levels areconsidered to be of minor importance [121]. For this reason,and to avoidmajor complexity in the chemical description, novibrational levels of CH4, H2O or H2have beenincluded upto now in the existing models in the literature, and the CO2,CO and O2 vibrational levels havealso been disregarded inthese mixtures in theDBD plasma, to reduce the complexityand calculation time. However, a variety of higher orderhydrocarbons and oxygenates were included in these models,to elucidate whether such value-added chemicals can beformed in these gas mixtures. The exact list of plasma speciesincluded in each of the modelscan differ slightly, and thesame is true for their chemical reactions (i.e.electron–neutral,electron–ion, ion–ion, ion–neutral and neutral–neutral reac-tions) and the corresponding rate coefficients. Details ofthesechemical reactions canbe found in the references cited above.
The above balance equations for thedensities of all thespeciesonly account for the timevariations, thus neglectingthe spatial variations due to transport in the plasma (e.g.diffusion). Nevertheless, spatial variations in the plasma canalso be included in such 0D models, by imposing a certaininput power or gas temperature as a function of time. In thisway, we can, for instance, account for the occurrence ofmicrodischarge filaments in a DBD reactor, through whichthe gas molecules will pass when flowing through it, byapplying a number of pulses as a function of time. Thisisillustrated in [74, 101, 122], for example. Likewise, the
power deposition in an MW plasma ismaximum at theposition of the waveguide, which can also be accountedforby means of a temporal profile. Indeed, we can translatethe timevariation into a spatial variation in the reactor, bymeans of the gas flow rate. In other words, the plasma reactorsare considered as a plug flow reactor, where the plasmacharacteristics vary as a function of the distance traveled bythe gas, in the same way as they would vary in time in a batchreactor. The time in the balance equations thus corresponds totheresidence time of the gas in the reactor.
Next to the densities of the species, a 0D plasma chem-istry model typically also calculates the average electronenergy by means of an energy balance equation, again withenergy source and loss terms, defined by the power deposition(or electric field) and the chemical reactions. From the aver-age electron energy, the energy-dependent rate coefficients ofthe electron processes can then be determined, while the ratecoefficients of the chemical reactions between the neutralspecies or ions are typically adopted from the literature.
In our 0D models, the balance equations for thedensitiesof the speciesare coupled to the solution of the Boltzmannequation (Bolsig+), which calculates the electron energydistribution function (EEDF) and the rate coefficients of allthe electron impact reactions as a function of the electronenergy. However, the Bolsig+ code is not called during everytimestep, so the EEDF is not updated each time, but onlywhen certain plasma quantities (e.g.the gas temperature, thereduced electric field, the electron number density or thenumber density of any other species, as defined by the user)have changed by more than a certain factor, as also defined bythe user. A more detailed description of the free electronkinetics in CO2 plasma is provided in [78–83], where a state-to-state vibrational kinetic model isself-consistently coupledto atime-dependent electron Boltzmann equation. Note thatwhen the EEDF is calculated with a Boltzmann solver, thereis, strictly speaking, no need to solve the electron energybalance equation as well, because the electron impact ratecoefficients can also be directly adopted from the Boltzmannsolver when cross section data is available, and the electrontemperature is obtained from T ,e e
2
3e= where εe is the mean
electron energy.From thecalculated densities of the plasma speciesat the
beginning and the end of the simulations, corresponding tothe inlet and outlet of the plasma reactor, the gas conversion,the product yields and selectivities can be obtained from the0D models. Furthermore, based on the power introducedintothe plasma and the gas flow rate, the specific energyinput (SEI) can be computed, and from the latter, the energyefficiency (η) can be obtained with the following formulas:
H X
SEIkJ
l
Plasma power kW
Flow ratel
min
60s
min
%
kJ
mol%
SEIkJ
l22.4
l
mol
R CO2
*
*
*h
=
=D
⎜ ⎟⎜ ⎟
⎜ ⎟
⎜ ⎟ ⎜ ⎟
⎜ ⎟⎛⎝
⎞⎠ ⎛
⎝⎞⎠
⎛⎝
⎞⎠
⎛⎝
⎞⎠
⎛⎝
⎞⎠
⎛⎝
⎞⎠
( )
( )( )
5
Plasma Sources Sci. Technol. 26 (2017) 063001 Topical Review

where ΔHR is the reaction enthalpy of the reaction beingstudied(e.g.279.8 kJ mol−1 for CO2 splitting) and XCO2
isthe CO2 conversion. Note that the latter formula is applicableto pure CO2 splitting. A very similar formula is applied to theother gas mixtures as well, but using another reactionenthalpy and accounting not only for the CO2 conversion, butalso for the conversion of the other gas(es) in the mixture.
The SEI can be expressed in kJl−1, as indicated in theabove formula, but it is also often expressed in Jcm−3
(1 kJ l−1=1 J cm−3), or in eV/molec, using the followingconversion (at atmospheric pressure and room temperature):
SEI
.
SEI 0.25
eV
molec
SEIJ
cm
2.446 10 1.602 10
J
cm
3
19 molecule
cm319 J
eV
3 *
=
=
⋅ ⋅ ⋅ -
⎜ ⎟⎛⎝
⎞⎠
( )
( )( ) ( )
2.2. Two-dimensionalor three-dimensionalfluid modeling
Although 0D chemical kinetics models are the most suitableapproach for describing detailed plasma chemistry, and somespatial dependenceof the plasma reactors can be taken intoaccount as explained above, they cannot really account forthedetails in the reactor configuration, nor predict howmodifications to the reactor geometry would give rise to betterCO2 conversion and energy efficiency. For this purpose, 2Dor even 3D models are required.
As mentioned in the introduction, to our knowledge,there exist no 2D or 3D models yet for CO2 conversion,because of the extensive computational cost, but some 2D andeven 3D fluid models exist in the literature for the reactors ofinterest for CO2 conversion, but mostly for helium or argonand with simplified chemistry. In recent years, we alsodeveloped such fluid models in helium or argon, and theygive some insight into the effect of reactor design on the gasflow behavior and plasma characteristics. It is our purpose,however, to extend these models to CO2and its mixtures withthe other gases mentioned above. In this paper, we show somecharacteristic results of these plasma reactor modeling efforts,in argon or helium, as well as the first results when extendingsuch models to CO2. In the following paragraphs, we givesome more detail on the fluid models that we developed for apacked-bed DBD, MW and GA plasma.
The fluid models used to describe the plasma behavior inthese reactors consist of solving conservation equations forthe densities of the various plasma species and for the averageelectron energy. The energy of the other plasma species isassumed to be in thermal equilibrium with the gas. Theconservation equations for the species densities are againbased on source and loss terms, defined by the chemicalreactions, like in the 0D models. The source of the electronenergy is due to heating by the electric field, and the energyloss is again dictated by collisions. In addition, transport isnow also included in the conservation equations, andit isdefined by diffusion and by migration in the electric field (for
the charged species). Furthermore, in the MW and GA plasmareactors, transport by convection due to the gas velocity (seebelow) is taken into account as well.
These conservation equations are coupled with thePoisson equation for a self-consistent calculation of theelectric field distribution from the charged species densities.Moreover, for the GA reactor, we have also developed a moresimplified quasi-neutral (QN) model, as described below, inorder to further reduce the calculation time.
Finally, in the MW and GA models, the gas temperatureand the gas flow behavior are calculated with a heat transferequation and the Navier–Stokes equations, and in the GAmodel, the cathode heat balance is also accounted for in theso-called axisymmetric model (see below), to properlydescribe the electron emission processes, which are veryimportant for an accurate description of the arc gliding pro-cess, as explained in section 3.2 below. The fluid (plasma)model and the models for gas flow and gas heating arecombined into a multiphysics model, where the calculated gasvelocity is inserted into the transport equations of the plasmaspecies, and the gas temperature determines the gas densityprofile, and thus the chemical reaction rates.
These models are being developed with the COMSOLMultiphysics Simulation Software. The specific features ofthe models for the packed-bed DBD, MW and GA plasmareactors are described below.
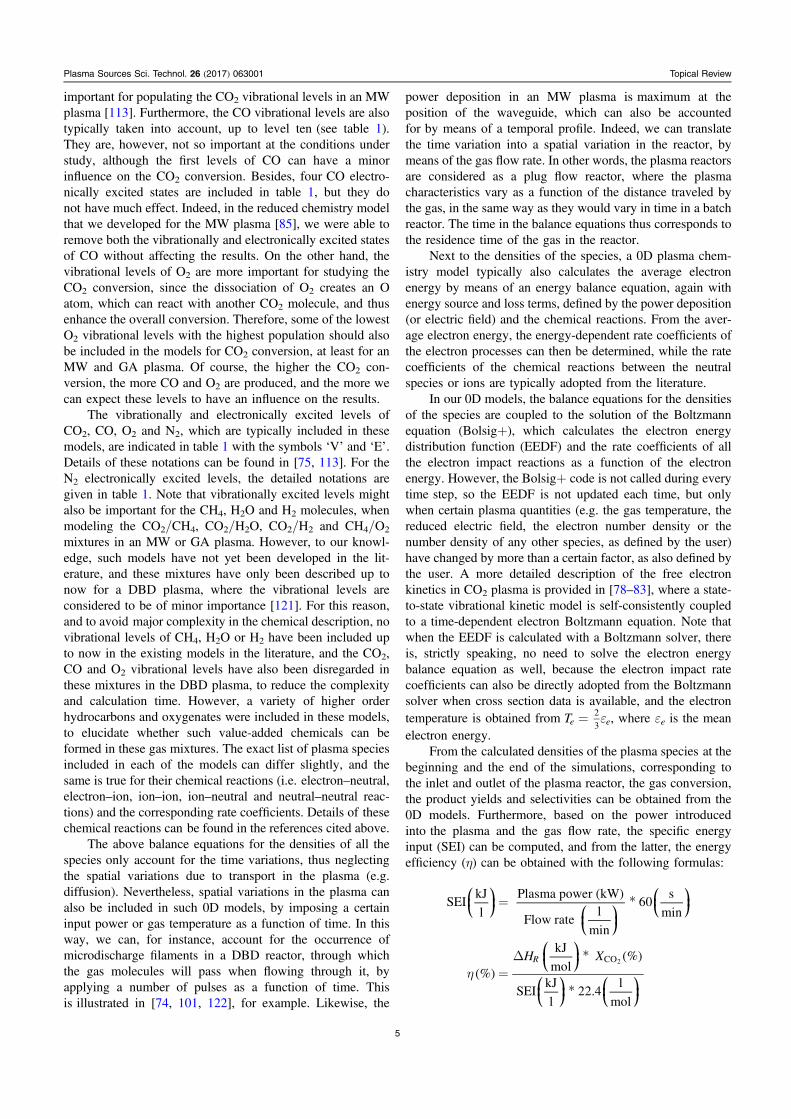
2.2.1. Packed-bed DBD reactor. A packed-bed DBD reactorshould, in principle, be described in 3Dto fully account forthe packing geometry. However, due to very fine meshrequirements, which are inherent inthe packing geometry, thecalculation time in 3D, even with a simple chemistry, wouldbe over a few months with today’s computational powers.Therefore, in order to approach the 3D geometry, we havedeveloped two different complementary axisymmetric 2Dfluid models, based on the3D unit cell of a closelypackedDBD reactor, i.e.a so-called ‘contact point’ model and a‘channel of voids’ model; see figure 1 [44]. Indeed, thecombination of these two models allowsthe two importantfeatures of a packed-bed plasma reactor to be described,namely,the contact between the beads, which enhances thelocal electric field in the discharge due to polarization effects,and the fact that the voids between the beads are connected,allowing the plasma to travel from one side of the dischargegap to the other. The first model accounts for two packingbeads, which are slightly larger than in the real (3D)geometry, to allow them to be in direct contact with eachother, while the second model describes three packing beads,with the same size as in reality, with a ‘channel of voids’ inbetween them. The packing beads are treated as solid objectsin the model, with zero space charge and certain dielectricproperties inside the beads and charge accumulation on theirsurface. These models were developed in helium, (i) becauseof the simplified plasma chemistry, thus reducing thecalculation time, and (ii) because helium yields ahomogeneous discharge in a DBD, which is easier to
6
Plasma Sources Sci. Technol. 26 (2017) 063001 Topical Review
describe with a fluid model. Details ofboth models and theirgeometries can be found in [44].
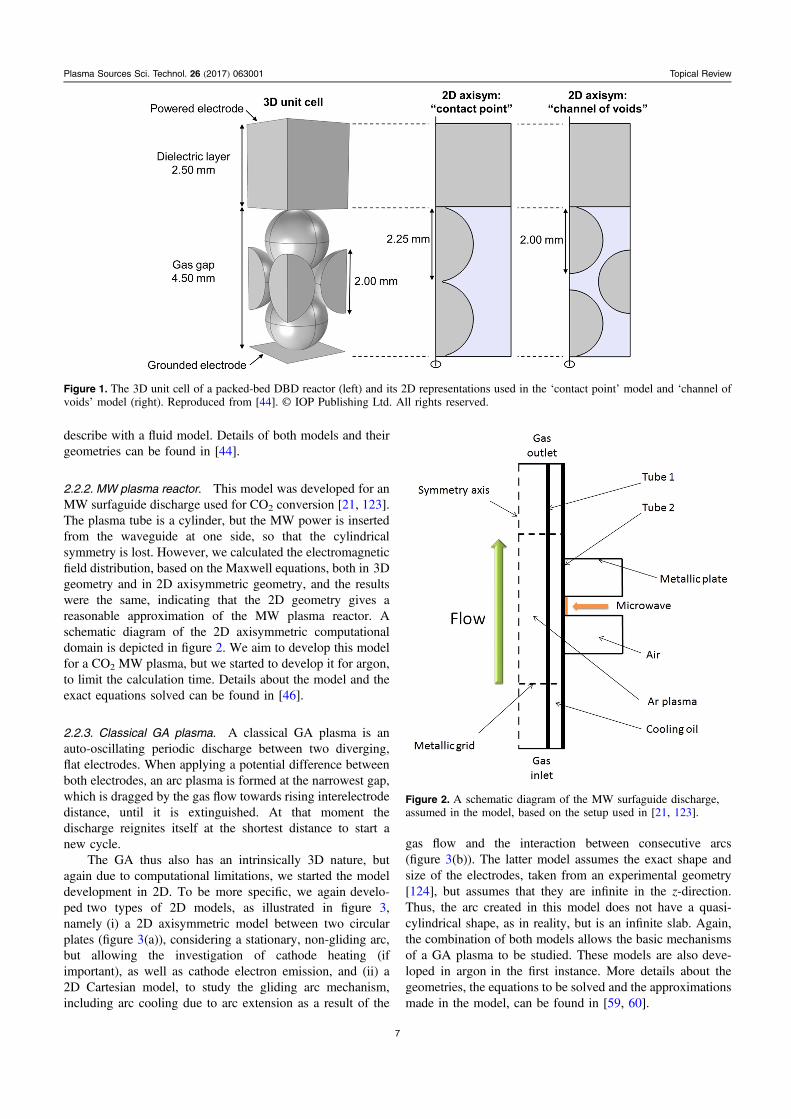
2.2.2. MW plasma reactor. This model was developed for anMW surfaguide discharge used for CO2 conversion [21, 123].The plasma tube is a cylinder, but the MW power is insertedfrom the waveguide at one side, so that the cylindricalsymmetry is lost. However, we calculated the electromagneticfield distribution, based on the Maxwell equations, both in3Dgeometry and in2D axisymmetric geometry, and the resultswere the same, indicating that the 2D geometry gives areasonable approximation of the MW plasma reactor. Aschematic diagram of the 2D axisymmetric computationaldomain is depicted in figure 2. We aim to develop this modelfor a CO2 MW plasma, but we started to develop it for argon,to limit the calculation time. Details about the model and theexact equations solved can be found in [46].
2.2.3. Classical GA plasma. A classical GA plasma is anauto-oscillating periodic discharge between two diverging,flat electrodes. When applying a potential difference betweenboth electrodes, an arc plasma is formed at the narrowest gap,which is dragged by the gas flow towards rising interelectrodedistance, until it is extinguished. At that moment thedischarge reignites itself at the shortest distance to start anew cycle.
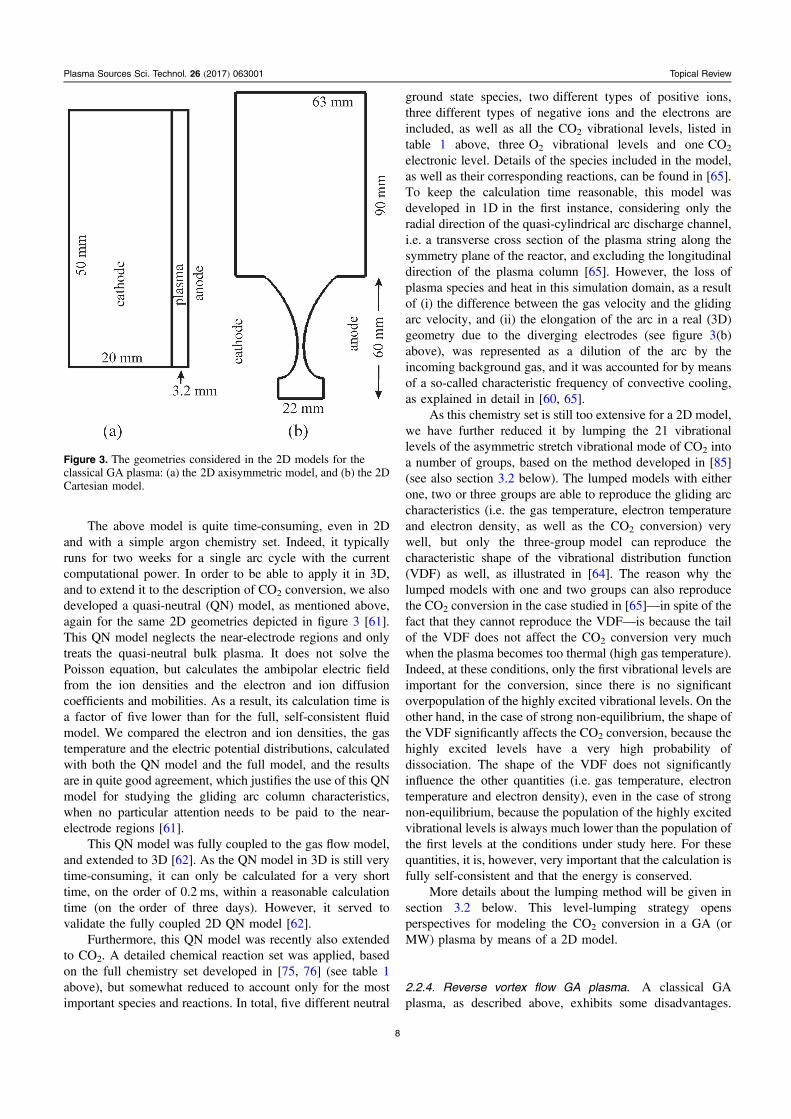
The GA thus also has an intrinsically 3D nature, butagain due to computational limitations, we started the modeldevelopment in 2D. To be more specific, we againdevelo-pedtwo types of 2D models, as illustrated in figure 3,namely(i) a 2D axisymmetric model between two circularplates (figure 3(a)), considering a stationary, non-gliding arc,but allowing the investigation of cathode heating (ifimportant), as well as cathode electron emission, and (ii) a2D Cartesian model, to study the gliding arc mechanism,including arc cooling due to arc extension as a result of the
gas flow and the interaction between consecutive arcs(figure 3(b)). The latter model assumes the exact shape andsize of the electrodes, taken from an experimental geometry[124], but assumes that they are infinite in the z-direction.Thus, the arc created in this model does not have a quasi-cylindrical shape, as in reality, butis an infinite slab. Again,the combination of both models allowsthe basic mechanismsof a GA plasma to be studied. These models are alsodeve-loped in argonin the first instance. More details about thegeometries, the equations to be solved and the approximationsmade in the model, can be found in [59, 60].
Figure 1. The3D unit cell of a packed-bed DBD reactor (left) and its 2D representations used in the ‘contact point’ model and ‘channel ofvoids’ model (right). Reproduced from [44].© IOP Publishing Ltd. All rights reserved.
Figure 2. A schematic diagram of the MW surfaguide discharge,assumed in the model, based on the setup used in [21, 123].
7
Plasma Sources Sci. Technol. 26 (2017) 063001 Topical Review
The above model is quite time-consuming, even in 2Dand with a simple argon chemistry set. Indeed, it typicallyruns for two weeks for a single arc cycle with the currentcomputational power. In order to be able to apply it in 3D,and to extend it to the description of CO2 conversion, we alsodeveloped a quasi-neutral (QN) model, as mentioned above,again for the same 2D geometries depicted in figure 3 [61].This QN model neglects the near-electrode regions andonlytreatsthe quasi-neutral bulk plasma. It does not solve thePoisson equation, but calculates the ambipolar electric fieldfrom the ion densities and the electron and ion diffusioncoefficients and mobilities. As a result, its calculation time isa factor of fivelower than for the full, self-consistent fluidmodel. We compared the electron and ion densities, the gastemperature and the electric potential distributions, calculatedwith both the QN model and the full model, and the resultsare in quite good agreement, which justifies the use of this QNmodel for studying the gliding arc column characteristics,when no particular attentionneeds to be paid to the near-electrode regions [61].
This QN model was fully coupled tothe gas flow model,and extended to 3D [62]. As the QN model in 3D is still verytime-consuming, it can only be calculated for a very shorttime, onthe order of 0.2 ms, within a reasonable calculationtime (on theorder of three days). However, it served tovalidate the fully coupled 2D QN model [62].
Furthermore, this QN model was recently also extendedto CO2. A detailed chemical reaction set was applied, basedon the full chemistry set developed in [75, 76] (see table 1above), but somewhat reduced to account only for the mostimportant species and reactions. In total, fivedifferent neutral
ground state species, twodifferent types of positive ions,threedifferent types of negative ions and the electrons areincluded, as well as all the CO2 vibrational levels, listed intable 1 above, threeO2 vibrational levels and oneCO2
electronic level. Details of the species included in the model,as well as their corresponding reactions, can be found in [65].To keep the calculation time reasonable, this model wasdeveloped in 1Din the first instance, considering only theradial direction of the quasi-cylindrical arc discharge channel,i.e.a transverse cross section of the plasma string along thesymmetry plane of the reactor, and excluding the longitudinaldirection of the plasma column [65]. However, the loss ofplasma species and heat in this simulation domain, as a resultof (i) the difference between the gas velocity and the glidingarc velocity, and (ii) the elongation of the arc in a real (3D)geometry due to the diverging electrodes (see figure 3(b)above), was represented as a dilution of the arc by theincoming background gas, and it was accounted for by meansof a so-called characteristic frequency of convective cooling,as explained in detail in [60, 65].
As this chemistry set is still too extensive for a 2D model,we have further reduced it by lumping the 21 vibrationallevels of the asymmetric stretch vibrational mode of CO2 intoa number of groups, based on the method developed in [85](see also section 3.2 below). The lumped models with eitherone, twoor threegroups are able to reproduce the gliding arccharacteristics (i.e. thegas temperature, electron temperatureand electron density, as well as the CO2 conversion) verywell, but only the three-groupmodel canreproduce thecharacteristic shape of the vibrational distribution function(VDF) as well, as illustrated in [64]. The reason why thelumped models with oneand twogroups can also reproducethe CO2 conversion in the case studied in [65]—in spite of thefact that they cannot reproduce the VDF—is because the tailof the VDF does not affect the CO2 conversion very muchwhen the plasma becomes too thermal (high gas temperature).Indeed, at these conditions, only the first vibrational levels areimportant for the conversion, since there is no significantoverpopulation of the highly excited vibrational levels. On theother hand, in the case of strong non-equilibrium, the shape ofthe VDF significantly affects the CO2 conversion, because thehighly excited levels have a very high probability ofdissociation. The shape of the VDF does not significantlyinfluence the other quantities (i.e.gas temperature, electrontemperature and electron density), even in thecase of strongnon-equilibrium, because the population of the highly excitedvibrational levels is always much lower than the population ofthe first levels at the conditions under study here. For thesequantities, it is, however, very important that the calculation isfully self-consistent and that the energy is conserved.
More details about the lumping method will be given insection 3.2 below. This level-lumping strategy opensperspectives for modeling the CO2 conversion in a GA (orMW) plasma by means of a 2D model.
2.2.4. Reverse vortex flow GA plasma. A classical GAplasma, as described above, exhibits some disadvantages.
Figure 3. The geometries considered in the 2D models for theclassical GA plasma: (a) the2D axisymmetric model, and (b) the 2DCartesian model.
8
Plasma Sources Sci. Technol. 26 (2017) 063001 Topical Review

Indeed, the flat 2D electrode geometry makes it lesscompatible with industrial systems, and the gas conversionis non-uniform because a considerable fraction of the gas doesnot pass through the active plasma region. Moreover, a highgas flow rate is needed to drag the arc, so the gas residencetime is limited, which will limit the gas conversion. Toovercome these drawbacks, a 3D cylindrical GA plasmareactor wasdeveloped, based on reverse vortex flowstabilization [25, 27]. The gas flows into the reactor througha tangential inlet and follows a vortex movement along thewalls. An arc is again formed between both electrodes, anddragged with the tangential gas flow, thereby expanding untilit extinguishes, followed by a new cycle. The vortex motionof the gas creates an isolating and cooling effect, and when itreaches one end of the reactor (closed), it continues itsmovement in the other direction, but with a smaller vortex(due to loss of inertia) until it leaves the reactor at the otherend, where the outlet is located. Hence, this reverse vortex gasflow mixes with the arc plasma, which will be concentrated inthe center. This characteristic feature seems to result in a moreenergy-efficient CO2 conversion [27, 33].
To properly account for the vortex flow and gliding arcbehavior, this reverse vortex flow GA reactor must bedescribed with a 3D model. To limit the calculation time, wehave applied the QN model, as mentioned in a previoussection. The gas flow is modeled with the so-called k-εReynolds-averaged Navier–Stokes (RANS) turbulent model.A schematic picture of the reactor is illustrated in figure 4.There are four tangential inlets in this setup. Details ofthereactor geometry, equations solved, assumptions and bound-ary conditions of the modelcan be found in [63].
3. Results and discussion
3.1. Zero-dimensionalchemical kinetics modeling
As mentioned, chemical kinetics modeling is most suitable forelucidating the underlying chemistry of the conversion pro-cess, i.e.which pathways are important for which conditionsand in which type of plasma. This will be illustrated below,
mainly based on our own modeling results, complementedwith some results from the literature, for the different gas(mixtures) of interest, i.e.pure CO2 splitting, pure CH4
conversion, as well as CO2/CH4, CH4/O2, CO2/H2 andCO2/H2O mixtures. More details about the modeling resultsin these mixtures—including the calculated conversions,product yields and energy efficiencies—and comparison withthe experimental data, can be found in the original researchpapers mentioned below, as well as in another recent reviewpaper [125], and will thus not be repeated here. Indeed, in thispaper, we will mainly focus on the reaction pathways in thesegas mixtures, and how these reaction pathways can explainthe differences in energy efficiency for the different reactortypes. However, we will show some more detailed calculationresults for a CO2/H2O DBD plasma, as well as formixturesof CO2 or CH4 with N2, in terms of conversion, energyefficiency and product formation, as these case studies werenot included in [125], and they allow us to demonstrate whattype of (other) information can be obtained from the models,as well ashow plasma chemical modeling can give moreinformation on the underlying reaction pathways, whichmight help to solve specific problems.
3.1.1. Pure CO2 splitting3.1.1.1. DBD conditions. Figure 5 illustrates the dominantreaction pathways for CO2 splitting in a DBD plasma, aspredicted from the model in [16]. A DBD is characterized byrelatively high reduced electric field values (i.e.typically above200 Td), and thus relatively high electron energies (several eV),and for this reason, electron impact reactions with CO2 groundstate molecules dominate the chemistry. This includes electronimpact dissociation into CO and O (which proceeds through anelectronically excited level of CO2, i.e.so-called electronimpact excitation–dissociation), electron impact ionization intoCO2
+ (which recombines with electrons or O2- ions into CO
and O and/or O2), and electron dissociative attachment intoCO and O–(see the thick black arrow lines in the reactionscheme of figure 5). Electron impact excitation–dissociation,ionization and dissociative attachment contributeabout 50%,25% and 25%, respectively, to the total CO2 conversion [74].Because these processes require more energy than is strictlyneededfor breakingthe C=O bond (i.e.5.5 eV), the energyefficiency for CO2 splitting in a DBD reactor is predicted to bequite limited, i.e.up to a maximum of 10% for a conversion ofup to 30%, as also observed experimentally (see introduction).
The created CO molecules are relatively stable, but at along enough residence time, they can recombine with O− ionsor O atoms, to formCO2 again(see thin black arrow lines infigure 5). These backward reactions explain why the CO2
conversion typically tends to saturate at long enoughresidence times (corresponding to low gas flow rates). Onthe other hand, the O atoms also recombine quickly into O2 orO3. There are several reactions possible between O, O2 andO3, also involving the O− and O2
- ions, as indicated by theblue arrow lines in figure 5, and this will affect the balancebetween the formation of O2 and O3 as stable products, asexplained in detail in [16].
Figure 4. A schematic diagram of the reverse vortex flow GAreactor, illustrating the four inlets and the outlet. The radius of thereactor is 6.35 mm; the radius of the outlet is 2 mm; the reactorheight is 5 mm.
9
Plasma Sources Sci. Technol. 26 (2017) 063001 Topical Review

A crucial aspect in plasma chemistry modeling, ingeneral, is the accuracy of the input data, like the crosssections and rate coefficients. This is also true for modelingthe plasma chemistry of CO2 conversion. More specifically,there is some confusion in the literature about the mostaccurate cross section for CO2 dissociation, as the latterprocess is believed to proceed through electron impactexcitation, as mentioned above, but it is not clear from theliterature which excitation channels effectively lead todissociation. The various cross sections have beendiscussedin detail in a recent paper [126]. Pietanza et al performed aparametric evaluation, for a wide range of reduced electricfields and vibrational temperatures, to compare the calculatedEEDF and the CO2 dissociation rates in pure CO2 plasmas,using two different electron impact excitation–dissociationcross sections—more specifically, the data from Phelps[127–129]with a threshold of 7 eV, and thatof Cosby andHelm [130]with a threshold of 12 eV. They reporteddifferences up to orders of magnitude, depending on thereduced electric field assumed, and they advised usingtheexcitation cross section with a threshold of 7 eV reported byPhelps as the dissociation channel, while considering theprocess with the threshold of 10.5 eV as normal electronicexcitation [78–80].
Ponduri et al [77] developed a 1D fluid model, based ona very similar plasma chemistry,as developed in our group[74–76], to model the CO2 conversion in a DBD. Whenassuming only electron impact dissociation based onItikawa’s cross section [131], their calculated CO2 conversionwas about one order of magnitude lower than the exper-imental values, obtained in a wide range of specific energy
input (SEI), as illustrated in figure 6. On the other hand, whenalso including the excitation cross sections with thresholds of7 eV and 10.5 eV reported by Phelps for the dissociationprocess, their calculated CO2 conversion was too high.Finally, when only including the dissociation cross section ofItikawa and the excitation cross section with the 7 eVthreshold for the dissociation process, reasonable agreement
Figure 5. The dominant reaction pathways of CO2 splitting and the further reactions between O, O2 and O3 in a DBD plasma, as obtainedfrom the model in [16]. The thick black arrow lines represent the most important reactions for CO2 splitting (mostly attributed to electronimpact collisions). The thin black arrow lines point towards the opposite reactions, i.e. therecombination of CO with either O–or O, intoCO2. The blue arrow lines indicate the conversions between O, O2 and O3.
Figure 6. Calculated CO2 conversion as a function of the specificenergy input (SEI) for various residence times (70, 230 and 800 ms),as obtained from the model in [77], considering only electron impactdissociation according to the Itikawa cross section (full symbols) andalso considering the Phelps cross section with a threshold of 7 eV(open symbols), and a comparison with the experimental data of[132]. Reproduced from [77], with the permission of AIPPublishing.
10
Plasma Sources Sci. Technol. 26 (2017) 063001 Topical Review
with the experiments was reached, although the calculatedCO2 conversion was overestimated by a factor oftwo(seefigure 6).
In [122] we also investigated the effect of variousdissociation cross sections on the CO2 conversion, andcameto similar conclusions. The cross sections proposed byItikawa [131], as well as those by Polak and Slovetsky[133], both underestimate the CO2 conversion, while the datareported by Phelps with athreshold of 7 eV and 10.5 eV yielda CO2 conversion that is only slightly lower than theexperimental data, althoughthe sum of both cross sectionsoverestimated the values [122]. This indicates that these crosssections most probably also include other excitation channels,not leading to dissociation.
Because of the complex plasma chemistry and theuncertainties of some of the assumptions made in the models,as well as possible uncertainties in the experimental data, it isnot possible to draw final conclusions on which cross sectionis the most realistic, but we believe that the Phelps crosssection with a 7 eV threshold should give rise to dissociation,as well as a certain fraction of the Phelps cross section withthe 10.5 eV threshold. However, more detailed investigationson the CO2 electron impact excitation–dissociation crosssections, either through measurements or quantum chemicalcalculations, are crucially needed to elucidateexactly whichexcitation channelslead to dissociation. As long as this is notknown, we propose that future modeling studies may use thePhelps 7 eV cross section, keeping in mind that it mightneglect some additional dissociation channels (probablyassociated with the 10.5 eV threshold), and thus it mightunderestimatethe actual CO2 conversionto some extent.
3.1.1.2. MW and GA conditions. While at typical DBDconditions, our calculations predict that about94% of the CO2
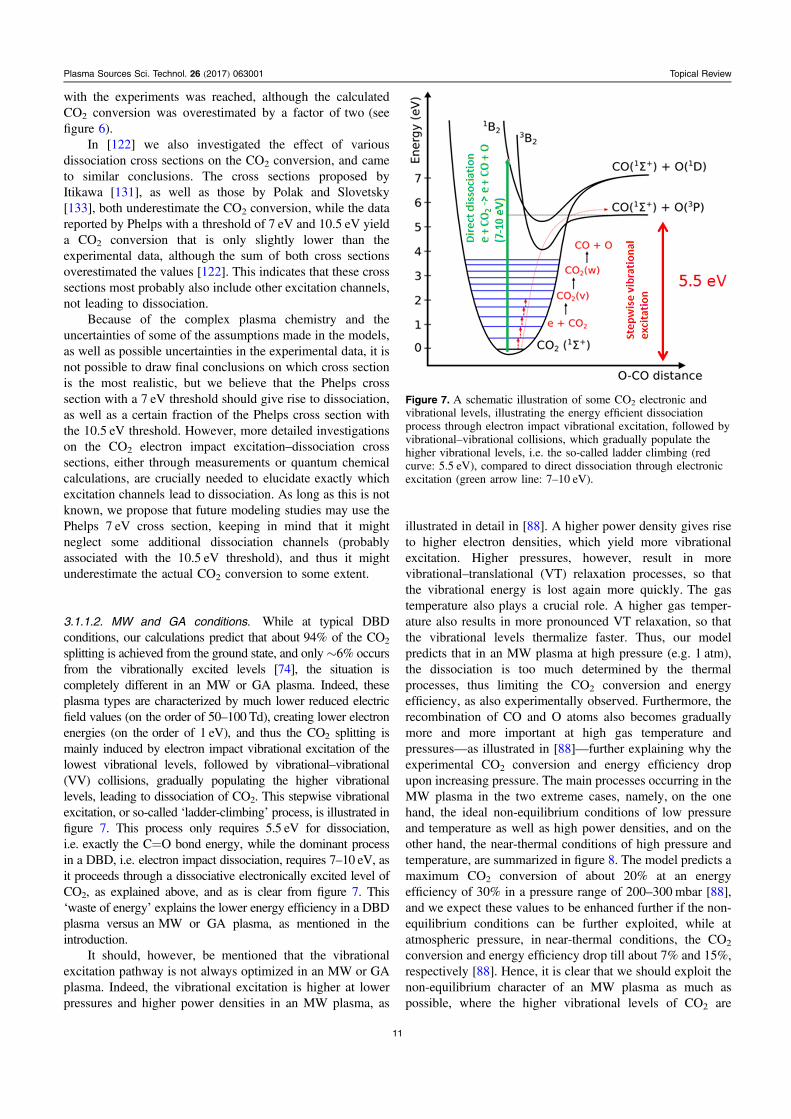
splitting is achieved from the ground state, and only∼6% occursfrom the vibrationally excited levels [74], the situation iscompletely different in an MW or GA plasma. Indeed, theseplasma types are characterized by much lower reduced electricfield values (onthe order of 50–100 Td), creating lower electronenergies (on theorder of 1 eV), and thus the CO2 splitting ismainly induced by electron impact vibrational excitation of thelowest vibrational levels, followed by vibrational–vibrational(VV) collisions, gradually populating the higher vibrationallevels, leading to dissociation of CO2. This stepwise vibrationalexcitation, or so-called ‘ladder-climbing’ process, is illustrated infigure 7. This process only requires 5.5 eV for dissociation,i.e.exactly the C=O bond energy, while the dominant processin a DBD, i.e.electron impact dissociation, requires 7–10 eV, asit proceeds through a dissociative electronically excited level ofCO2, as explained above, and as is clear from figure 7. This‘waste of energy’ explains the lower energy efficiency in a DBDplasma versusanMW or GA plasma, as mentioned in theintroduction.
It should, however, be mentioned that the vibrationalexcitation pathway is not always optimized in an MW or GAplasma. Indeed, the vibrational excitation is higher at lowerpressures and higher power densities in an MW plasma, as
illustrated in detail in [88]. A higher power density gives riseto higher electron densities, which yield more vibrationalexcitation. Higher pressures, however, result in morevibrational–translational (VT) relaxation processes, so thatthe vibrational energy is lost again more quickly.The gastemperature alsoplays a crucial role. A higher gas temper-ature also results in more pronounced VT relaxation, so thatthe vibrational levels thermalize faster. Thus, our modelpredicts that in an MW plasma at high pressure (e.g.1 atm),the dissociation is too much determinedby the thermalprocesses, thus limiting the CO2 conversion and energyefficiency, as also experimentally observed. Furthermore, therecombination of CO and O atoms also becomes graduallymore and more important at high gas temperature andpressures—as illustrated in [88]—further explaining why theexperimental CO2 conversion and energy efficiency dropupon increasing pressure. The main processes occurring in theMW plasma in the two extreme cases, namely,on the onehand, the ideal non-equilibrium conditions of low pressureandtemperature as well ashigh power densities, and on theother hand, the near-thermal conditions of high pressure andtemperature, are summarized in figure 8. The model predicts amaximum CO2 conversion of about 20% at an energyefficiency of 30% in a pressure range of 200–300 mbar [88],and we expectthese valuestobe enhanced further if the non-equilibrium conditions can be further exploited, while atatmospheric pressure, innear-thermal conditions, the CO2
conversion and energy efficiency drop till about 7% and 15%,respectively [88]. Hence, it is clear that we should exploitthenon-equilibrium character of an MW plasma as much aspossible, where the higher vibrational levels of CO2 are
Figure 7. A schematic illustration of some CO2 electronic andvibrational levels, illustrating the energy efficient dissociationprocess through electron impact vibrational excitation, followed byvibrational–vibrational collisions, which gradually populate thehigher vibrational levels, i.e. theso-called ladder climbing (redcurve: 5.5 eV), compared to direct dissociation through electronicexcitation (green arrow line: 7–10 eV).
11
Plasma Sources Sci. Technol. 26 (2017) 063001 Topical Review

overpopulated, as this is important for energy-efficient CO2
conversion. To realize this, it is thus beneficial to work atreduced pressure, and at the same time at sufficiently highpower densities, while keeping the gas temperature undercontrol [88].
Likewise, also in a GA plasma, our models predict thatthe CO2 conversion canbe further enhancedby moreexploitingthe role of the higher vibrational levels of CO2.Indeed, the major dissociation process intypical GA condi-tions appears to be electron impact dissociation of the lowerCO2 vibrational levels, because the vibrational distributionfunction (VDF) is toothermal, i.e.there is no significant
overpopulation of the higher CO2 vibrational levels. This waspredicted both in theclassical GA [64] as well as in theRVFGA, where at high temperatures (∼2500K–3000 K) the CO2
dissociationproceeds mainly from the ground state, asobtained by the model [33]. Indeed, the models reveal thatreactions of the higher vibrational levels with heavy particles(i.e.either O atoms or any arbitrary molecules in the plasma),which would be the most energy-efficient process for CO2
conversion, are of minor importance in both the classical andRVF GA instandard conditions. Just like in the MW plasma,the model predicts that a significant overpopulation of theVDF, and thus a more energy efficient CO2 conversion,can
Figure 8. The dominant reaction pathways of CO2 splitting in an MW plasma, as obtained from the model in [88], for two extreme cases: (a)the ideal non-equilibrium conditions of low pressure and temperature as well ashigh power densities, and (b) the near-thermal condition ofhigh pressure and temperature.
12
Plasma Sources Sci. Technol. 26 (2017) 063001 Topical Review

be realized by decreasing the temperature or by increasing thepower density [64].
This is schematically illustrated in figure 9: the predictedCO2 conversion and energy efficiency are about 7% and 30%inthe standard conditions of the model (i.e. anassumed gastemperature inside the arc of 1200 K, apower density of3.6×104W cm−3, and assuming that 20% of the gas canpass through the arc) [64], butaccordingto the model thesevalues can be significantly improvedto a conversion ofnearly 20% and a corresponding energy efficiency of up to80%–100%, when either the gas temperature in the arc isreduced to 1000 K, or the power density rises to 4.6×10⁴W cm−3, or when the backward (recombination) reactionis removed from the model. Furthermore, if the gas fractionthat can pass through the arc zone couldbe enhanced—forinstance by inducing a difference in gas flow velocity and arcgliding velocity (see below)—both the conversion and energyefficiency would also increase, provided that the larger treatedgas fraction can compensate for the reduced processing timein each part of the treated gases.
3.1.2. Pure CH4 reforming. Besides CO2 splitting,reformingCH4into higher hydrocarbons and H2 by means of plasmatechnology is also of great interest. The dominant reactionpathways in a DBD plasma, as predicted by the model in [91],are illustrated in figure 10. Like in the case of CO2 splitting, theCH4 conversion is initiated by electron impact dissociationinto CH3 radicals. The latter will recombine into higherhydrocarbons, such as C2H6 and C3H8. These hydrocarbons, aswell as the CH4 itself, will also dissociate into H2 formation.Moreover, various dissociation and recombination reactions
lead tootherunsaturated hydrocarbons. Details ofthe exactreaction mechanisms can be found in [91].
3.1.3. CO2/CH4 mixture. Combining CO2 and CH4
conversion in a plasma leads to the formation of H2, CO,higher hydrocarbons and oxygenates. The dominantpathways, as predicted by the model in [104] are illustratedin figure 11. The thickness of the lines corresponds to the‘importance’ of the reaction. As illustrated above, CH4
dissociation is initiated by electron impact, forming CH3
radicals, which recombine into higher hydrocarbons.Moreover, theelectron impact dissociation of CH4 and ofthe higher hydrocarbons also yields H2 formation, like in thecase of the pure CH4 plasma (see above). However, in theCO2/CH4 plasma, the CH3 radicals do not only create higherhydrocarbons, but also methanol (CH3OH) and CH3O2
radicals, albeit to a lesserextent. Furthermore, the CH2
radicals, which are also created from the electron impactdissociation of CH4, react with CO2 to form formaldehyde(CH2O) and CO. Finally, the O atoms, created from theelectron impact dissociation of CO2 (see also figure 5 above),also initiate the formation of higher oxygenates, likeacetaldehyde (CH3CHO), which reacts further into CH3COradicals, and the latter can be further converted into ketene(CH2CO). However, these pathways are not so important inabsolute terms, as indicated by the thin dashed lines infigure 11.
3.1.4. CH4/O2 mixture. To compare the chemistry in theCO2/CH4 mixture, i.e. used for the dry reforming of methane,with that of the partial oxidation of methane, i.e.a CH4/O2
mixture, we illustrate the reaction pathways of the lattermixture in figure 12, as predicted again by the model in [104].The thickness of the arrow lines is again correlated to the rateof the net reactions. It is quite obvious that the CH4/O2
mixture leads to a completely different chemistry than theCO2/CH4 mixture, in spite of the fact that the same chemicalspecies are included in the models (see table 1 above). Theelectron impact dissociation of CH4 again leads to CH3
radicals, which will recombine into methanol or higher
Figure 9. The energy efficiency versusCO2 conversion in a classicalGA reactor, as calculated by the model of [64] for standardconditions as assumed by the model, and improvements predicted bythe model, by either reducing the gas temperature in the arc from1200 K to 1100 K and 1000 K (nos. 1 and 2, at apower density of3.6×104 W cm−3), or increasing the power density (from3.6×104 to 4.1×10⁴ and 4.6×10⁴ W cm−3 (nos. 3 and 4, atTg=1200 K) or by removing the backward (recombination)reaction from the model (no. 5).
Figure 10. The dominant reaction pathways for the conversion ofCH4 into higher hydrocarbons and H2 in a DBD plasma, as obtainedfrom the model in [87]. The most important reactions are indicatedwith a solid line, while the dashed lines represent the less importantreactions. [125] John Wiley & Sons. [© 2016 WILEY-VCH VerlagGmbH & Co. KGaA, Weinheim].
13
Plasma Sources Sci. Technol. 26 (2017) 063001 Topical Review

hydrocarbons. However, the recombination into CH3O2
radicals, which form either CH3O radicals or methylhydroperoxide (CH3OOH), is now more important. The
CH3O radicals produce methanol, which is obviously a moreimportant formation mechanism than the recombination ofCH3 with OH radicals (seethe arrow line thickness in
Figure 11. The dominant reaction pathways for the conversion of CH4 and CO2 into higher hydrocarbons, H2, CO and higher oxygenates, ina 70/30 CH4/CO2 DBD plasma, as obtained from the model in [104]. The thickness of the arrow lines corresponds to the importance of thereaction paths. [125] John Wiley & Sons. [© 2016 WILEY-VCH Verlag GmbH & Co. KGaA, Weinheim].
Figure 12. Dominant reaction pathways for the conversion of CH4 and O2 into (mainly) higher oxygenates, as well as some full oxidationproducts, in a 70/30 CH4/O2 DBD plasma, as obtained from the model in [104]. The thickness of the arrow lines corresponds to theimportance of the reaction paths. [125] John Wiley & Sons. [© 2016 WILEY-VCH Verlag GmbH & Co. KGaA, Weinheim].
14
Plasma Sources Sci. Technol. 26 (2017) 063001 Topical Review

figure 12), and methanol can also react further into CH2OHradicals, producing formaldehyde. The latter is also easilyconverted into CHO radicals, and further into CO (note thethickness of these arrow lines, indicating the importance ofthese reactions) and CO2. Furthermore, formaldehyde is alsopartially converted into H2O. It is important to stress that thispathway is illustrated for a 70/30 CH4/O2 mixture, whichobviously leads to thenearly full oxidation of CH4, ratherthan partial oxidation, where the major end-products shouldbe the higher oxygenates. When less O2ispresent in themixture, our model predicts that methanol and methylhydroperoxide will beformed in nearly equal amounts asCO and H2O [104].
As far as O2 is concerned, it is mainly converted into CO,O atoms and HO2 radicals, as is clear from figure 12. Also,some O3 is formed out of O2, but the reverse process—i.e.theproduction of two O2 molecules out of O3 and O atoms—ismore important, explaining why the arrow points from O3
towards O2. The balance between O, O2 and O3isalso clearfrom figure 5 above, and is explained in detail in [16].Furthermore, the O atoms are converted into CH3O and OHradicals, producing methanol and water, respectively. Thelatter reaction (from OH to H2O) appears to be especiallyimportant, as indicated bythe thick arrow line, and thus,significant amounts of H2O are formed, as predicted by themodel [104].
In summary, the comparison between figures 11 and 12clearly points out that the chemical pathways in a CH4/O2
and CH4/CO2 plasma are quite different, even at the samemixing ratios. Furthermore, it is clear that in both mixtures alarge number of different chemical compounds can beformed, but due to the reactivity of the plasma, there is noselective production of some of the targeted compounds. Toreach the latter, the plasma will have to be combined with acatalyst.
3.1.5. CO2/H2 mixture. Another possible candidate for theproduction of value-added chemicals from CO2 is a CO2/H2
mixture. Figure 13 illustrates the dominant reaction pathwaysfor the conversion of CO2 and H2 in a 50/50 CO2/H2 DBDplasma, as predicted by the model in [112]. Again, thethickness of the arrow lines is proportional to the rates of thenet reactions. Like before, the conversion starts with theelectron impact dissociation of CO2, yielding CO and Oatoms.Occurring simultaneously, and much more pronounced,is the electron impact dissociation of H2, resulting in theformation of H atoms (seethe thickness of the arrow line). TheO and H atoms recombine into the formation of OH radicals,and further into H2O. The model thus predicts that H2O willbeproduced at a relatively high density [112], which is not aninteresting product, in contrast toCO,for instance.
The CO molecules will partially react back into CO2,mainly through the formation of CHO radicals. This pathwayappears to be more important than the direct three-bodyrecombination between CO and O atoms into CO2, which isthe dominant pathway in a pure CO2 plasma. The H atomsthus contribute significantly to the back reaction of CO intoCO2, and this explains why the CO2 conversion is quitelimited in the CO2/H2 mixture, as predicted by the model[112]. In addition, the electron impact dissociation of COresults in the formation of C atoms, which react further intoCH, CH2, C2HO and CH3 radicals in several successiveradical recombination reactions. The CH2 radicals react withCO2 inthe formation of CH2O, while the CH3 radicals easilyform CH4. The latter appears much more favored than theformation of CH3OH out of CH3. Finally, CH4 partially reactsfurther into higher hydrocarbons (CxHy).
It is thus clear from figure 13 that several subsequentradical reactions are needed for the formation of (higher)hydrocarbons and oxygenates, such as CH4, C2H6, CH2O andCH3OH. This explains the very low yields and selectivities of
Figure 13. The dominant reaction pathways for the conversion of CO2 and H2 into various products, in a 50/50 CO2/H2 DBD plasma, asobtained from the model in [112]. The thickness of the arrow lines corresponds to the rates of the net reactions. The stable molecules areindicated with black rectangles. Reprinted with permission from [112]. Copyright (2016) American Chemical Society.
15
Plasma Sources Sci. Technol. 26 (2017) 063001 Topical Review

these end products, as predicted by the model [112]. Insummary, the lack of direct formation of CH2 and CH3 in theCO2/H2 mixture, which is important in CO2/CH4 gasmixtures (see figure 11 and [104]), combined with the verylow conversion of CO2, which is again due to the absence ofCH2 as animportant collision partner for the loss of CO2,seems to make the CO2/H2 mixture less interesting for theformation of higher hydrocarbons and oxygenates than aCO2/CH4 mixture inthe conditions under study. In addition,H2 itself is a useful product, while CH4, besides being a fuel,also greatly contributes to global warming;thus, the simulta-neous conversion of CO2 and CH4wouldreduce theconcentration of two greenhouse gases. Furthermore, CO2/CH4 mixtures are available from biomass installations, andtheir simultaneous conversion is thereforeconsidered to be adirect valorization of biogas. Thus, we may conclude that aCO2/H2 DBD plasma (at least without catalysts) might not bean optimal choice for CO2 conversion into value-addedchemicals.
3.1.6. CO2/H2O mixture. Finally, the cheapest and thereforemost interesting H-source that could be added to the CO2
plasma, in order to directly produce value-added chemicals,like oxygenated hydrocarbons or syngas (H2/CO mixture) isH2O. The combined conversion of CO2 and H2O wouldmimic the natural photosynthesis process. However, it wasdemonstratedby means of combined modeling andexperimentsthat when adding H2O (in concentrations of upto 8%) to a CO2 DBD plasma, the CO2 conversion is reduced,and only quite low CO2 and H2O conversions can beobtained. More importantly, however, no oxygenatedhydrocarbons were detected in the experiments, and thecalculated concentrations were no higher than theppblevel [111].
Because the CO2 and H2O conversion, the H2/CO ratio,and the other product selectivities were in very goodagreement between the model calculations and experiments[111], the model was used to run simulations in a wider rangeof H2O concentrations, which could not be realized in theDBD setup used in [111]. Although extreme caution isadvised when extrapolating models outside their validatedrange, previous experience with these plasma chemistries tellsus thatin general most behaviorand trends can indeed beextrapolated to a somewhat wider range of conditions[102, 114, 120]. This allows us to investigate whether thesame results can be expected in this wider range, and/orwhether certain products can be formed in larger amounts,and thuswhether it would be worth pursuing these otherconditions experimentally.
Figure 14 illustrates the calculated CO2 and H2Oconversions, as well as the obtained H2/CO ratio, as afunction of the H2O concentration in the gas mixture, for awide range of SEI values. The CO2 conversion increases withthe SEI, as expected, and it drops with an increasing H2Oconcentration over the entire range, although the initial drop(from 0% to 10% H2O content) is most pronounced. Thisresult is thus similar to the observations made in [111].
The H2O conversion, however, shows some interestingbehavior: it exhibits different trends depending on the SEI.For a low SEI of 5 and 10 J cm−3 the H2O conversionincreases with the SEI and decreases with an increasing H2Ocontent, while for an SEI of 100 and 250 J cm−3 the H2Oconversion increases upon rising H2O content. Moreover, at
Figure 14. CO2 (a) and H2O (b) conversion, and H2/CO ratio (c), asa function of H2O content in a CO2/H2O DBD plasma, for differentvalues of SEI, as obtained with the model in [111].
16
Plasma Sources Sci. Technol. 26 (2017) 063001 Topical Review
alow H2O content, the H2O conversion drops with anincreasing SEI, which is rather unexpected. The results at 25and 50 Jcm–3 show intermediate behavior.
It seems thatwitha low H2O contentin the mixture andlow SEI values, increasing the SEI will lead to more H2Oconversion, as expected, but only until about 25 J cm−3, whilehigher SEI values cause a drop in the H2O conversion. Ourmodel indeed reveals that an equilibrium in the chemistry isreached, where the backward reactions (i.e.the recombinationof OH and H into H2O) start to become equally important asthe forward reactions (i.e.the splitting of H2O into OH andH). This means that the conversion stops increasing and evenstarts decreasing upon higher SEI values.
The H2/CO ratio, plotted in figure 14(c), increasesdrastically with the H2O content, which is asexpected.Moreover, it drops with an increasing SEI, as was alsoreported in the literature [134]. This drop can be explainedinfigures 14(a) and(b), because the CO2 conversion keepson increasing with the SEI, while the H2O conversion starts tosaturate with an increasing SEI—oreven drops with the SEIat a low H2O content. As CO is formed out of the CO2
conversion, while H2 is created from the H2O conversion, it isquite logical that the H2/CO ratio shoulddropwith aris-ing SEI.
As illustrated in figure 14(c), the H2/CO ratio variesbetween 0.0076 (at low H2O contentand a high SEI value of250 J cm−3) and 8.6 (for the highest H2O content of 90% andan SEI value of 5 Jcm−3). Thus, it is clear that plasmatechnology allows for a process with an easily controllableH2/CO ratio, and that the ratio can be controlled in two ways,i.e.usingboth the H2O content and the SEI value. The highH2/CO ratio obtained at a high H2O contentand low SEIvalues is important for applications, as this mixture might bedirectly used in Fischer−Tropsch synthesis for the productionof liquid hydrocarbons, and it might also be suitable formethanol synthesis. Thus, even if no direct methanol (or otheroxygenated hydrocarbon) formation is possible in the plasma,the H2/CO ratio obtained might be useful for valorizationpurposes.
With respect to the formation of other products, ourmodel predicts that besides the syngas components (CO andH2), O2will bethe main product of the CO2/H2O mixture, aswas also observed in [111], and that again no oxygenatedhydrocarbons will beformed—at least not in concentrationsabove 20 ppm. However, the production of H2O2 increasessignificantly with arising SEI and H2O content in themixture, reaching concentrations between 300 ppm and 2.2%,depending on the SEI and H2O content.
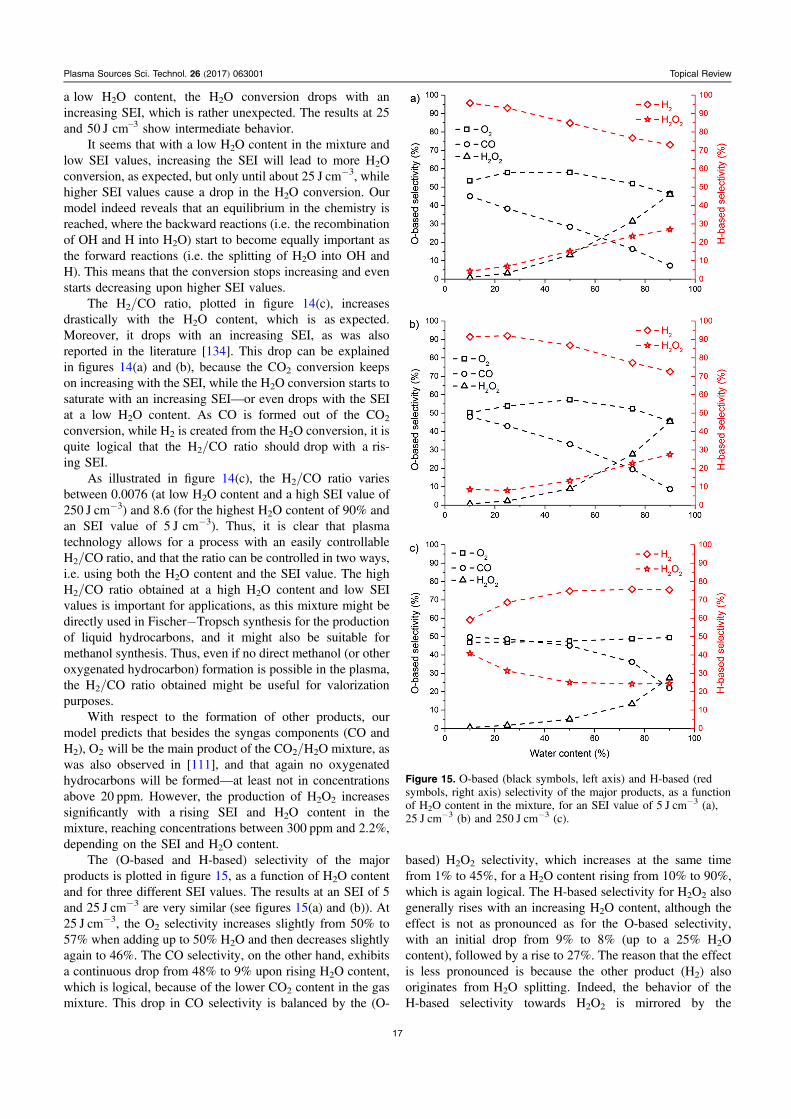
The (O-based and H-based) selectivity of the majorproducts is plotted in figure 15, as a function of H2O contentand for three different SEI values. The results at an SEI of 5and 25 J cm−3 are very similar (seefigures 15(a) and(b)). At25 J cm−3, the O2 selectivity increases slightly from 50% to57% when adding up to 50% H2O and then decreases slightlyagain to 46%. The CO selectivity, on the other hand, exhibitsa continuous drop from 48% to 9% upon rising H2O content,which is logical, because of the lower CO2 content in the gasmixture. This drop in CO selectivity is balanced by the (O-
based) H2O2 selectivity, which increases at the same timefrom 1% to 45%, for a H2O contentrising from 10% to 90%,which is again logical. The H-based selectivity for H2O2 alsogenerally rises with an increasing H2O content, although theeffect is not aspronounced as for the O-based selectivity,with an initial drop from 9% to 8% (up to a 25% H2Ocontent), followed by a rise to 27%. The reason that the effectis less pronounced is because the other product (H2) alsooriginates fromH2O splitting. Indeed, the behavior of theH-based selectivity towards H2O2 is mirrored by the
Figure 15. O-based (black symbols, left axis) and H-based (redsymbols, right axis) selectivity of the major products, as a functionof H2O content in the mixture, for an SEI value of 5 J cm−3 (a),25 J cm−3 (b) and 250 J cm−3 (c).
17
Plasma Sources Sci. Technol. 26 (2017) 063001 Topical Review

selectivity towards H2, which first increases from 91% to92%, followed by a drop to 73%. At 5 Jcm−3, the results arealmost the same, with only slight differences in the absolutevalues.
At 250 J cm−3, the trends forO-based selectivity are alsosimilar (see figure 15(c)), although the CO selectivity issomewhat higher and the H2O2 selectivity is somewhat lowerthan at the lower SEI values. The H-based selectivity,however, is clearly different, with an increasing H2 selectivityand a decreasing H2O2 selectivity upon rising H2O content,which is opposite to the trends observed at lower SEI values.This illustrates that the H2O chemistry seems to undergodrastic changes with increasing SEI, due to the equilibriumreached between H2O splitting and formation, as could alsobe deduced from the H2O conversion plotted in figure 14(b)above. With alow H2O content in the mixture, the H2O2
selectivity is 40%, but it drops to 25% at high H2O content.Combining these (O-based and H-based) H2O2 selectivitieswith the conversions of H2O and CO2 plotted in figure 14above, tells us that significant yields of H2O2 can be formed,up to the percentagerange, as mentioned above.
As good agreement was obtained between the model andexperiments in the range of H2O concentrations investigatedexperimentally, we believe that the model gives a realisticdescription of the underlying chemistry. Hence, we can try toexplain the trends observed here, by means of a kineticanalysis of the reaction chemistry, as revealed by the model.The model predicts that the CO radicals, formed out of CO2
splitting, quickly react with the OH radicals, created out ofH2O splitting, yielding H atoms and CO2. Furthermore, theseH atoms and the ones originating from the H2O splitting, reactback into H2O through a number of steps, involving O, O2,HO2 and OH (see details in [111]). These reactions explainwhy the H2O conversion is limited to a maximum of 10% (seefigure 14(b)), because an equilibrium is reached between H2Osplitting and formation, as also mentioned above. Moreimportantly, it also explains why the CO2 conversion isreduced upon the addition of H2O in the mixture (seefigure 14(a)). Note that this drop in CO2 conversion isremarkable, because in general, a rise in (absolute) CO2
conversion is found upon the addition of another gas, such asN2 [113, 114], He [6, 17] or Ar [17].
Moreover, the kinetic analysis clarifies why no oxyge-nated hydrocarbons are formed in the CO2/H2O mixture.Indeed, the H atoms react with O into OH and subsequentlyinto H2O, as indicated above, instead of forming CH andCHO fragments, which are essential forcreatingmethanoland other oxygenated hydrocarbons, for example. Therefore,the plasma chemistry model indicates that H2O might not be asuitable H-source for the direct formation of oxygenatedhydrocarbons, because of the abundance of O atoms, O2
molecules and OH radicals in the plasma, trapping the Hatoms. We believe that a catalyst will be needed in order toproduce significant amounts of oxygenated hydrocarbons in aCO2/H2O plasma, and more specifically a catalyst (orcatalytic system) that is able to (i) scavenge the O atoms,so that the H atoms can recombine into H2, before they reactwith O atoms into OH and H2O, and (ii) transform the H2
together with CO into methanol, before CO recombines withOH into CO2.
Finally, the kinetic analysis also reveals why H2O2 isformed in larger amounts with ahigher H2O contentin themixture, because the OH radicals (as well as the HO2 radicals)formed from H2O splitting, will easily recombine into H2O2.A summary of the reaction pathways in the CO2/H2O mixtureis given in figure 16. A more detailed explanation about themechanisms can be found in [111]).
We can conclude thatalthough a CO2/H2O plasmamight not be suitable for the direct formation of oxygenatedhydrocarbons, it seems to be able to produce H2/CO ratios ina wide range between 0.0076 and 8.6, and this ratio can becontrolled by the H2O content in the mixture and the SEIvalue. Furthermore,significant amounts of H2O2, up thepercentagerange, can also be formed. The latter caneasily beseparated by condensation, together with water, and used as adisinfectant or for biomedical purposes.
3.1.7. CO2/N2 mixture. Real industrial gas flows typically donot contain pure CO2, but they are a mixture consisting ofother gases and impurities. In most cases, N2 is the mostimportant component [3]. Therefore, it is of great interest toinvestigate how the CO2 conversion and energy efficiency areaffected in the presence of N2, and moreover, which products(e.g.useful products or harmful NOx compounds) would beformed in this gas mixture. To answer these questions,modeling can again be very valuable. Therefore, a model wasdeveloped for a CO2/N2 mixture, and validated byexperiments, both for an MW plasma [113] and for a DBDplasma [114], in order to compare both setups in terms ofconversion and energy efficiency, as well as in terms of thespecies formed. This model does not only include thevibrational levels of CO2, but also those of N2 (see table 1above), because of the important role of the vibrationalkinetics in an MW plasma [121].
Figure 17(a) illustrates the calculated and measuredabsolute CO2 conversion as a function of N2 content, for botha DBD and an MW plasma, as obtained from [113, 114]. TheDBD reactor operates at atmospheric pressure, while the MWplasma is maintained at a pressure of 2660 Pa, as requiredtoallow comparison with the experimental data [113]. To enablea fair comparison between the DBD and MW plasma, theresults are presented for the same SEI of 2.7 eV/molec. Note,however, that the SEI in Jcm–3 is significantly lower in theMW plasma (0.27 J cm−3) than in the DBD reactor(11 J cm−3), because of the much lower pressure (2660 Paversusatmospheric pressure), so there are fewermoleculesper volume. Therefore, comparing at the same SEI expressedin eV/molec provides the most ‘fundamental’ comparison,because it tells us exactly how much energy is going to eachmolecule (on average).
The absolute CO2 conversion increases with risingfraction of N2in both types of plasma, both in thecalculations and the experimental data. The exact trends inthe MW plasma are somewhat different, indicating that theunderlying chemistry might not yet havebeen 100% captured
18
Plasma Sources Sci. Technol. 26 (2017) 063001 Topical Review

by the model. As the agreement is much better for the DBDreactor, we expectthe discrepancy to berelated to thevibrational kinetics, which are important in the MW plasmaand more or less negligible in the DBD reactor, as explainedabove. We think that the model could be further improved byadding a more detailed description of the vibrational kinetics,e.g.by includingthe symmetric mode levelsin more detail,so that the molecules can exchange vibrational energy witheach other, as well as within one molecule. The energy levelsclose to the dissociation limit then become so close to eachother that they form a quasi-continuum, which is currently nottaken into account. Furthermore, the rate coefficients of thereactions of the vibrational levels are based on scaling laws,and more accurate scaling laws would probably also improvethe accuracy of the model predictions.
Nevertheless, the absolute values are in reasonableagreement. This rising trend indicates that N2 has a beneficialeffect on the CO2 splitting, in both types of plasma, but themechanism appears to be completely different, as iselucidated by the model. In the DBD reactor, the electro-nically excited metastable N2(A
3uS+) molecules are respon-
sible for the enhanced CO2 splitting, giving rise to CO, O andground state N2 molecules. In the MW plasma, on the otherhand, CO2 is mainly dissociated through the vibrationallyexcited CO2 levels. Indeed, these levels are much morepopulated in the MW plasma than in theDBD, as outlinedabove, and this is especially true in CO2/N2 gas mixtures,because N2 helps to populate the CO2 vibrational levelsbyVV relaxation processes [113]. As the CO2 dissociation fromthe vibrationally excited levels is much more efficient thandissociation from the ground state, this also explains thehigher CO2 conversion in the MW plasma than in the DBDreactor, as illustrated in figure 17(a).
In spite of the higher absolute CO2 conversion whenadding N2 to the plasma, the effective or overall CO2
conversion will drop, because of the lower absolute fractionof CO2 in the gas mixture. The effect is minor up to about60% N2 in the mixture, but more pronounced for higher N2
fractions. This effective CO2 conversion determines theoverall energy efficiency of the process, which is illustratedas a function of N2 content, for both the DBD and MWplasma, in figure 17(b). Because of the somewhat lowereffective CO2 conversion at high N2 fractions, it is notsurprising that the energy efficiency also drops when addingmore N2 to the mixture, as some of the energy is used forionization, excitation and dissociation of the N2 molecules.Moreover, both the calculated and measured energy efficiencyappear to be a factor of two to threehigher in the MW plasmathan in the DBD reactor, for the reason explained above.
Finally, both the modeling and experimental resultsreveal that several NOx compounds are produced in theCO2/N2 plasma, especially NO, NO2, N2O and N2O5.Figure 18 shows a detailed comparison between theircalculated concentrations and the corresponding experimentaldata for the DBD plasma, at the same conditions as infigure 17. The experiments were performed with FTIR, butacalibration curve was only availablefor NO and NO2,allowing us to express the measured results in absoluteconcentrations. For N2O and N2O5, no calibration curveswere available, so the data isonly shown in arbitrary units(a.u.), as measured absorbance in the FTIR cell.
It is clear that both the calculated and measuredconcentration of each NOx compound typically reaches itsmaximum at intermediate N2 fractions in the mixture (around50%). Indeed, the NOx formation is initiated by the reactionof either N atoms or metastable N2(A
3uS+) molecules with O
atoms (see below), and these species originate from N2 andCO2, respectively, so it is logical that the maximum NOx
formation shouldbeattained when both reactants are presentin more or less equal concentrations.
Figure 16. The dominant reaction pathways for the conversion of CO2 and H2O and their interactions in a DBD plasma, as obtained from themodel in [111]. The full green lines are the formation rates above 1017 cm−3 s−1, the yellow dashed lines indicate the formation rates between1016 and 1017 cm−3 s−1, while the red dotted lines are the formation rates between 1015 and 1016 cm−3 s−1.
19
Plasma Sources Sci. Technol. 26 (2017) 063001 Topical Review

The maximum measured NO and NO2 concentrations areabout 550 ppm and 54 ppm, while the calculated NO and NO2
concentrations are at maximum 115 and 34 ppm, hencesomewhat lower, but still onthe same order of magnitude (seefigures 18(a), (b)). These values are significantly higher thanwhat is allowed, for instance, under European emissionstandards for passenger cars or for industrial emissions (seedetails in [114]).
The calculated N2O5 concentration even reaches valuesof up to 1000 ppm (see figure 18(c)). It was not possible toobtain absolute concentrations in the experiments, but it isclear that both calculated and measured data show almost thesame behavior as a function of N2 content in the mixture, witha variation over two orders of magnitude over the entire rangeof N2 content. Finally, the maximum calculated N2Oconcentration is about 55 ppm (see figure 18(d)). Althoughthis does not seem to be a very high value, N2O is a verypotent greenhouse gas, with a global warming potential(GWP) that is300 times higher than for CO2. Based on theabsolute CO2 conversion, plotted in figure 17(a) above, andthe fraction of CO2 in the mixture, it is clear that effectively
about 4% CO2 is converted inthe conditions under study.Hence, this means that if the N2O concentrationexceeded130 ppm, the reduction in GWP by converting CO2 in thepresence of N2 would effectively be zero. Thus, theproduction of N2O seriously limits the greenhouse gasmitigation potential of plasma technology in this case.
In general, although the NOx concentrations remain in theppm range, these values are quite significant, and they maycause serious environmental problems. A detailed chemicalkinetics analysis, as obtained from the model, can help us tofind out how the NOx formation can be reduced. An overallreaction scheme is illustrated in figure 19. Initially, N2 isexcited to a metastable state N2(A
3uS+), as well as dissociated
into N atoms, both upon electron impact. The N2(A3
uS+)molecules react with O atoms to create NO, or with O2 toform N2O. The N atoms react with both O and O3 intheformation of NO. NO can be converted into NO2 uponreaction with O, but the opposite reaction, due to collisionwith either O or N atoms, occurs as well, making NO2 themain source of NO production and vice versa.
After these initial reactions, the N atoms are trapped intwo reaction loops, i.e.between NO, NO2 and N2O3, andbetween NO2, NO3 and N2O5. Note that the NO3 and N2O3
concentrations in the plasma are very low, and therefore theyhavenot been presented in figure 18 above. The only way toescape from these loops, is by the reaction of NO2 to N2O(which can react back to N2 and N upon collision withN2(A
3uS+) and N2
+), or by the reaction of NO with either Natoms or N2(a′
1uS-) molecules, forming N2 molecules or N
atoms again (see figure 19).Note that the reaction scheme illustrated in figure 19
applies to a DBD plasma. In an MW plasma, the NOx
formation occurs mainly through the reaction of vibrationallyexcited N2 molecules with O atoms, forming N and NO, asexplained in [113]. Due to the higher CO2 (and N2)conversion in the MW plasma, the formation of NOx
compounds will also be somewhat higher than for the DBDplasma, but the concentrations were still found to be in theppm range [113]. Note that if concentrations in thepercentagerange areformed, it would be interesting forN-fixation [135], but the values obtained at the conditionsunder study are too low to have anyeconomic value andinstead they cause an ecological/economic cost.
Thus, if we want to avoid the formation of NOx
compounds, it is clear from the reaction pathways in figure 19that the reaction between the reactive N-species(i.e.N2(A
3uS+) and N in a DBD plasma, or vibrationally
excited N2 molecules in an MW plasma) and the O species(O, O2 or O3) should be prevented. Reducing the concentra-tions of reactive N-species in the plasma is not verystraightforward. Hence, we believe that the only optionforavoiding NOx formationis to remove the O atoms fromthe plasma, by means of O-scavengers,separation membranesor a catalytic system, as this would also inhibit the formationof O2 and O3. If the latter was successful, it would effectivelyeliminate NOx formation, and thus the need for either a pre-purification (N2) or post-purification (denox) step.
Figure 17. Calculated (dashed lines) and measured (solid lines)absolute CO2 conversion (a) and energy efficiency (b) as a functionof N2 content in the gas mixture, for an MW plasma at 2660 Pa(black) and a DBD reactor at atmospheric pressure (red), at the sameSEI of 2.7 eV/molec, as obtained from the model and experimentsdescribed in [113, 114].
20
Plasma Sources Sci. Technol. 26 (2017) 063001 Topical Review

3.1.8. CH4/N2 mixture. Finally, we present here some resultson the effect of theaddition of N2on the CH4 conversion intoH2 in a DBD, both as an impurity (up to 50 000 ppm), whichis always present in natural gas, and as additive gas (in the
range between 1% and 99%), to investigate whether this gasmixture gives rise to the formation of nitrogenatedcompounds, which could also be of interest for thechemical industry.
Figure 20 illustrates the absolute CH4 conversion (a), theeffective CH4 conversion (b), and the corresponding absoluteand effective H2 yields (c) and(d), as a function of the N2
admixture, as obtained from the calculations as well asfrom the experiments. It is clear that the calculations andexperiments are in very good agreement.
For aN2 contentup to 17.5%, the absolute CH4
conversiondrops slightlyfrom 3.4% to 2.6% (barely visiblein figure 20(a), but we refer to [120] for more details). Thisdrop was also observed in the ppm range [120]. However,above 17.5%N2 content, the absolute CH4 conversion startsrising nearly exponentially upon an increasingfraction of N2,which is mostly visible above 70%. A kinetic analysis basedon the model results indicates that this trend is the result oftwo competing effects, i.e.the initial drop in CH4 conversionis due to a lower electron density at a higher N2 content, whilethe subsequent rise in CH4 conversion is attributed to theincreasing role of N2 metastable molecules for CH4 dissocia-tion, as well as the lower reaction rate constants for severalthree-body recombination reactions of CH3 radicals back intoCH4, upon collision with N2versusCH4 as a third body.
Figure 18. Calculated (red lines, left axis) and measured (black lines, right axis) concentrations of the four main NOx compounds formed inthe CO2/N2 DBD plasma, as a function of N2 content in the mixture, at an SEI of 12 J cm−3 and a residence time of 0.73 s, as obtained fromthe model and experiments described in [114]: (a) NO, (b) NO2, (c) N2O5 and(d) N2O.
Figure 19. The dominant reaction pathways leading to NOx
formation in a CO2/N2 DBD plasma, as obtained from the model in[114];see details in the text. The thickness of the arrow linescorresponds to the time-integrated reaction rates, indicating theimportance of the reactions.
21
Plasma Sources Sci. Technol. 26 (2017) 063001 Topical Review
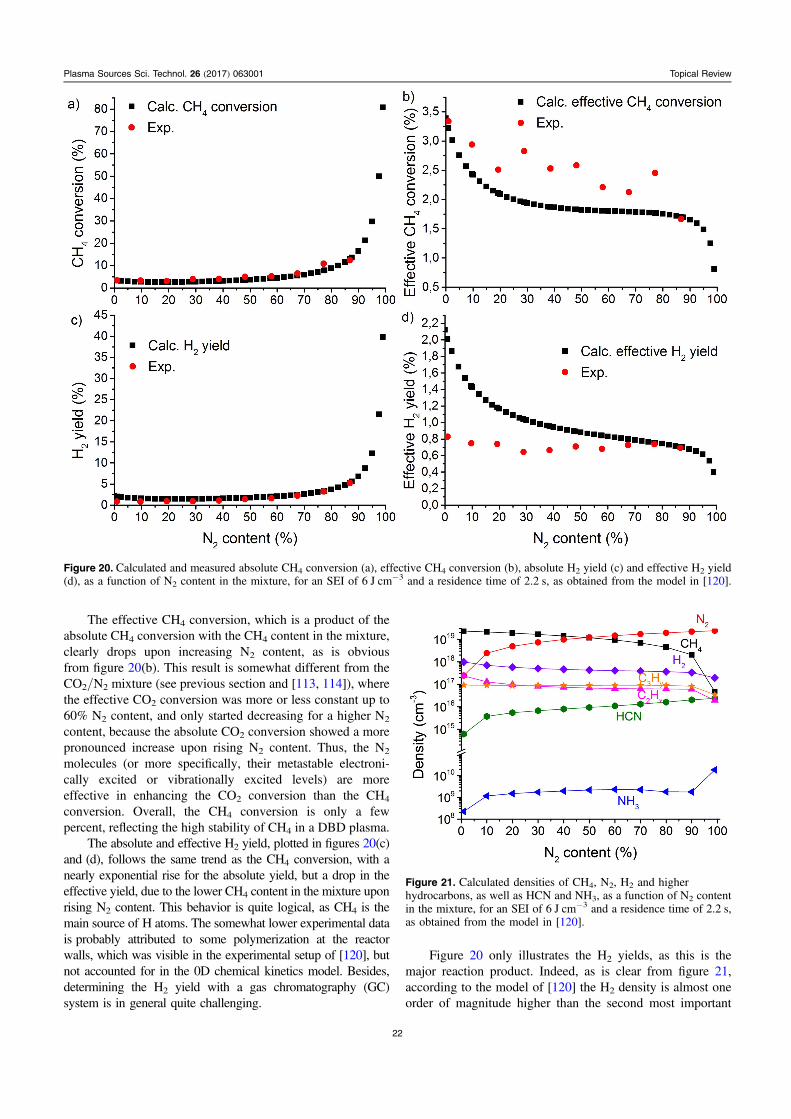
The effective CH4 conversion, which is aproduct of theabsolute CH4 conversion with the CH4 content in the mixture,clearly drops upon increasing N2 content, as is obviousfrom figure 20(b). This result is somewhat different from theCO2/N2 mixture (see previous section and [113, 114]), wherethe effective CO2 conversion was more or less constant up to60% N2 content, and only started decreasingfor a higher N2
content, because the absolute CO2 conversion showed a morepronounced increase upon rising N2 content. Thus, the N2
molecules (or more specifically, their metastable electroni-cally excited or vibrationally excited levels) are moreeffective in enhancing the CO2 conversion than the CH4
conversion. Overall, the CH4 conversion is only a fewpercent, reflecting the high stability of CH4 in a DBD plasma.
The absolute and effective H2 yield, plotted in figures 20(c)and(d), follows the same trend as the CH4 conversion, with anearly exponential rise for the absolute yield, but a drop in theeffective yield, due to the lower CH4 content in the mixture uponrising N2 content. This behavior is quite logical, as CH4 is themain source ofH atoms. The somewhat lower experimental dataisprobably attributed to some polymerization at the reactorwalls, which was visible in the experimental setup of [120], butnot accounted for in the 0D chemical kinetics model. Besides,determining the H2 yield with a gas chromatography (GC)system is in general quite challenging.
Figure 20 only illustrates the H2 yields, as this is themajor reaction product. Indeed, as is clear from figure 21,according to the model of [120] the H2 density is almost oneorder of magnitude higher than the second most important
Figure 20. Calculated and measured absolute CH4 conversion (a), effective CH4 conversion (b), absolute H2 yield (c) and effective H2 yield(d), as a function of N2 content in the mixture, for an SEI of 6 J cm−3 and a residence time of 2.2 s, as obtained from the model in [120].
Figure 21. Calculated densities of CH4, N2, H2 andhigherhydrocarbons, as well as HCN and NH3, as a function of N2 contentin the mixture, for an SEI of 6 J cm−3 and a residence time of 2.2 s,as obtained from the model in [120].
22
Plasma Sources Sci. Technol. 26 (2017) 063001 Topical Review
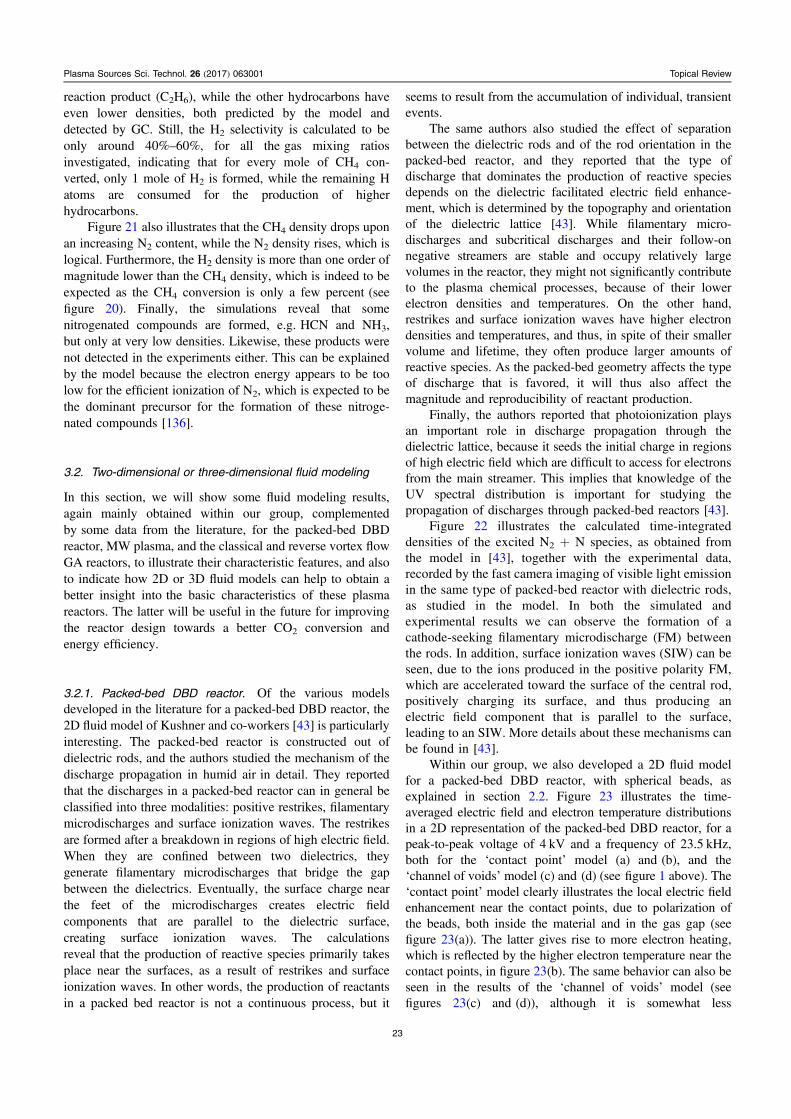
reaction product (C2H6), while the other hydrocarbons haveeven lower densities, both predicted by the model anddetected by GC. Still, the H2 selectivity is calculated to beonly around 40%–60%, for all thegas mixing ratiosinvestigated, indicating that for every mole of CH4 con-verted,only 1 mole of H2 is formed, while the remaining Hatoms are consumed for the production of higherhydrocarbons.
Figure 21 also illustrates that the CH4 density drops uponan increasing N2 content, while the N2 density rises, which islogical. Furthermore, the H2 density is more than one order ofmagnitude lower than the CH4 density, which isindeed to beexpected as the CH4 conversion is only a few percent(seefigure 20). Finally, the simulations reveal that somenitrogenated compounds are formed, e.g.HCN and NH3,but only at very low densities. Likewise, these products werenot detected in the experiments either. This can be explainedbythe model because the electron energy appears to be toolow for the efficient ionization of N2, which is expected to bethe dominant precursor for the formation of these nitroge-nated compounds [136].
3.2. Two-dimensionalor three-dimensionalfluid modeling
In this section, we will show some fluid modeling results,again mainly obtained within our group, complementedbysome data from the literature, for the packed-bed DBDreactor, MW plasma, and the classical and reverse vortex flowGA reactors, to illustrate their characteristic features, and alsoto indicate how 2D or 3D fluid models can help to obtain abetter insight intothe basic characteristics of these plasmareactors. The latter will be useful in the future for improvingthe reactor design towards a better CO2 conversion andenergy efficiency.
3.2.1. Packed-bed DBD reactor. Of the various modelsdeveloped in the literature for a packed-bed DBD reactor, the2D fluid model of Kushner and co-workers [43] is particularlyinteresting. The packed-bed reactor is constructed out ofdielectric rods, and the authors studiedthe mechanism of thedischarge propagation in humid airin detail. They reportedthat the discharges in a packed-bed reactor can in general beclassified into three modalities: positive restrikes, filamentarymicrodischarges and surface ionization waves. The restrikesare formed after a breakdown in regions of high electric field.When they are confined between two dielectrics, theygenerate filamentary microdischarges that bridge the gapbetween the dielectrics. Eventually, thesurface chargenearthe feet of the microdischarges creates electric fieldcomponents that are parallel to the dielectric surface,creating surface ionization waves. The calculationsrevealthat the production of reactive species primarily takesplace near the surfaces, as a result of restrikes andsurfaceionization waves. In other words, the production of reactantsin a packed bed reactor is not a continuous process, but it
seems to result from the accumulation of individual, transientevents.
The same authors also studied the effect of separationbetween the dielectric rods and of the rod orientation in thepacked-bed reactor, and they reported that the type ofdischarge that dominatesthe production of reactive speciesdepends on the dielectric facilitated electric field enhance-ment, which is determined by the topography and orientationof the dielectric lattice [43]. While filamentary micro-discharges and subcritical discharges and their follow-onnegative streamers are stable and occupy relatively largevolumes in the reactor, they might not significantly contributeto the plasma chemical processes, because of their lowerelectron densities and temperatures. On the other hand,restrikes and surface ionization waves have higher electrondensities and temperatures, and thus, in spite of their smallervolume and lifetime, they often produce larger amounts ofreactive species. As the packed-bed geometry affects the typeof discharge that is favored, it will thus also affect themagnitude and reproducibility of reactant production.
Finally, the authors reported that photoionization playsan important role in discharge propagation through thedielectric lattice, because it seeds the initial charge in regionsof high electric fieldwhich are difficult to access for electronsfrom the main streamer. This implies that knowledge of theUV spectral distribution is important for studying thepropagation of discharges through packed-bed reactors [43].
Figure 22 illustrates the calculated time-integrateddensities of the excited N2 + N species, as obtained fromthe model in [43], together with the experimental data,recorded by the fast camera imaging of visible light emissionin the same type of packed-bed reactor with dielectric rods,as studied in the model. In both the simulated andexperimental results we can observe the formation of acathode-seeking filamentary microdischarge (FM) betweenthe rods. In addition, surface ionization waves (SIW) can beseen, due to the ions produced in the positive polarity FM,which are accelerated toward the surface of the central rod,positively charging its surface, and thus producing anelectric field component that is parallel to the surface,leading to an SIW. More details about these mechanisms canbe found in [43].
Within our group, we also developed a 2D fluid modelfor a packed-bed DBD reactor, with spherical beads, asexplained in section 2.2. Figure 23 illustrates the time-averaged electric field and electron temperature distributionsin a 2D representation of thepacked-bed DBD reactor, for apeak-to-peak voltage of 4 kV and a frequency of 23.5 kHz,both for the ‘contact point’ model (a) and(b), and the‘channel of voids’ model (c) and(d) (seefigure 1 above). The‘contact point’ model clearly illustrates the local electric fieldenhancement near the contact points, due to polarization ofthe beads, both inside the material and in the gas gap (seefigure 23(a)). The latter gives rise to more electron heating,which is reflected by the higher electron temperature near thecontact points, in figure 23(b). The same behavior can also beseen in the results of the ‘channel of voids’ model (seefigures 23(c) and(d)), although it is somewhat less
23
Plasma Sources Sci. Technol. 26 (2017) 063001 Topical Review

pronounced, because the beads are not in direct contact witheach other. The reality will probably be somewhere inbetween (seethe description of both 2D models, to mimic the3D geometry, as presented in section 2.2 above). At thisrelatively low applied voltage of 4 kV, the plasma is initiatedat the contact points, and remains in this region, reflecting the
properties of a Townsend discharge. At a higher appliedvoltage, e.g.7.5 kV (peak-to-peak), the discharge will spreadout more into the bulk of the reactor, from one void space tothe other,ultimately covering the whole gas gap, showing theproperties of a glow discharge. More details about thisbehavior can be found in [44].
Figure 22. Calculated time-integrated densities of excited N2 + N species in a packed-bed reactor with dielectric rods, operating in humid air,at an applied voltage of −30 kV and a bead separation of 0.7 mm, obtained from 2D fluid simulations by Kushner and co-workers (a).Measured visible light emission, recorded with an ICCD camera at an observation gate width of 0.5 μs, in the same packed-bed reactor asstudied in the model (b). Reproduced from [43]. © IOP Publishing Ltd. All rights reserved.
Figure 23. Calculated time-averaged 2D profiles of the electric field and electron temperature in a packed-bed DBD reactor, for the two 2Dgeometries illustrated in figure 1, i.e.a ‘contact point’ geometry (a) and(b), and a ‘channel of voids’ geometry (c) and(d)at a peak-to-peakvoltage of 4 kV and a frequency of 23.5 kHz, as obtained from the model in [44].
24
Plasma Sources Sci. Technol. 26 (2017) 063001 Topical Review

Validation of these calculation results with experimentaldata is difficult, because the presence ofpacking does notmakeplasma diagnosticsstraightforward,due to the visualblocking of the optical diagnostics. However, a qualitativecomparison is possible with the experiments performed byKim and co-workers, by means of an intensified chargecoupled device (ICCD) camera [137, 138]. Indeed, theseauthors also observed that at a low applied potential thedischarge stays local at the contact points, while at a higherpotential, it spreads across the surface of the packing material.Similar observations were also made by Tu et al [139].
Although the above models have beendeveloped forhelium, we expectsimilar behavior in a CO2 plasma. Thehigher electron temperature will result in more electronimpact ionization, excitation and dissociation of the CO2
molecules, for the same applied power, and this can explainwhy a packed-bed DBD gives a higher CO2 conversion andenergy efficiency than an empty reactor (e.g.[14, 18]).
3.2.2. MW plasma reactor. In figure 24 the calculatedelectron density, electron temperature, gas temperature andMW electric field distributions are plottedfor the MWsurfaguide setup illustrated in figure 2 above, at a pressureof 700 Pa, a gas flow rate of 125 sccm, a frequency of2.45 GHz and a power of 100W.
The electron density (figure 24(a)) reaches a maximumvalue of 7×10¹⁹ m−3 in front of the waveguide (located atz=30 cm), and decreases more or less linearly in the axialdirection, from the center towards the ends of the plasma. Atthe same time, it exhibits a wave-like pattern, as a result ofresonance due to the metallic grids (indicated with white
dashed lines; seealso figure 2 above). The electron temper-ature (figure 24(b)) is fairly constant at about 1.3 eV, in theentire plasma volume, at least within the region confined bythe metallic grids. The gas temperature (figure 24(c)) shows amaximum of 1500 K at the position of the waveguide, i.e.theposition of maximum power deposition. Finally, the electricfield due to the MW power (figure 24(d)) shows a pronouncedmaximum near the walls, indicating the skin effect, and lowvalues in the center of the plasma. Furthermore, the metallicgrids clearly prevent any leakage of the electric field outsideof the cavity. These results are in reasonable agreement withdata from the literature, for a similar setup and a similarpressure [140].
As mentioned in section 2.2.2 above, we aim to extendthis model to a CO2 plasma, so thatbesides the abovequantities,information can also be obtained about thedensities of the reactive species(including the vibrationallevels), the CO2 conversion and the energy efficiency. If theentire plasma chemistry set, as listed in table 1 above, wasintroduced into the model, it would yield excessively longcalculation times. Therefore, the chemistry set was recentlyreduced, from 126 species to 36 or 39 species (depending onthe pressure, see details in [85]). This reduced set stillaccounts for all theCO2 vibrational levels, i.e.21 levels ofthe asymmetric stretch mode and fourcombined symmetricmode levels (see table 1 above), because the vibrationalkinetics play a key role in energy-efficient CO2 conversion, asmentioned above. However, to further reduce the chemistryset, a lumped-levelmodel was developed that allowsthe 21vibrational levels of the asymmetric stretch mode to belumpedinto a number of groups [85]. The effectiveness of
Figure 24. Calculated 2D distributions of electron density (a), electron temperature (b), gas temperature (c) and MW electric field (d), at700 Pa, a gas flow rate of 125 sccm, a frequency of 2.45 GHz and a power of 100 W, as obtained from the (non-quasi-neutral fluid) modeldescribed in [46].
25
Plasma Sources Sci. Technol. 26 (2017) 063001 Topical Review

this level-lumping strategy was investigated for one, twoandthreegroups. Using more groups was found to be redundant,and wouldbe less effective for reducing the calculation time.The models with either one, twoor threegroups were all ableto predict the same gas temperature, electron density andelectron temperature profiles as in the full model, but like inthe GA case (see section 2.2.3 above), only the model withthreegroups can reproduce the shape of the vibrationaldistribution function (VDF) and thus gives the most reliableprediction of the CO2 conversion. More details ofthis levellumping strategy can be found in [85].
As a result of this level lumping, the 21 balanceequations for the 21 individual vibrational levels wereremoved from the model, yielding only 15 (or 18) equations(depending on the pressure; see above) for the remainingplasma species, plus twoequations for each of the groups(i.e.one equation for the density of the group and oneequation for its mean vibrational energy). In this way, a modelwith n groups needs to solve 15+2n equations (or 18+2n,depending on the pressure) for the chemical kinetics part.This means a reduction in calculation time, andwill openpossibilities for describing the CO2 conversion in a 2D (oreven 3D) MW plasma model. This work is currently inprogress in our group.
3.2.3. Classical GA plasma. Figure 25 presents the time-evolution of the electron density in a classical GA reactor, asobtained from the model in [59], illustrating the expansion ofthe gliding arc. Indeed, the arc is dragged by the gas flow, soit bends downstream, and the anode arc root moves upward.To allow the cathode spot to move as well,a so-called fieldenhancement factor was applied in a limited region—at apoint downstream—corresponding to the position of theanode arc root, which initiates a second cathode spot. Thus,the cathode spot jumps from one point to another, and thisresults in the so-called ‘gliding’ process of the arc. Thisprocedure has beenexplained in detail in [59].
In spite of its name, the gliding arc can also operate inglow mode. Both discharge modes (i.e.arc and glow)produce a very similar plasma column at a similar dischargecurrent. However, substantial differences are observednear the cathode, due to the different electron emission
mechanisms. Indeed, in the glow regime, the cathode rootfollows the anode root, while in the arc regime, the cathoderoot remains connected to an electron emission center for alonger period of time, until it jumps to the next position,following the anode root displacement, as explained above.This different way ofattaching the plasma channel to thecathode will result in a longer plasma column in the arcregime than in the glow regime, as was also explained in [60].The latter can affect the CO2 conversion in a GA. Indeed, alonger plasma channel means an increased plasma volume,and this will lead tostronger plasma–gas interaction, possiblyleading to more CO2 conversion. This issue was also brieflydiscussed in section 3.1.1 above. The regime thatoccurs mostin practicewill depend on the operating conditions and on theconditioning of the cathode. Note that the discharge operationin the two regimes hasalso been demonstrated experimen-tally in [141], showing qualitatively the same behavior asexplained above.
Another characteristic feature of a GA, observedexperimentally, is the so-called back-breakdown phenom-enon, or backward-jump motion of the GA, which wasstudied with a fully coupled gasflow-plasma model [62].Figure 26 shows the time-evolution of the gas temperature,with and without back-breakdown, as calculated by thismodel. By comparing both figures, it is clear that the back-breakdown phenomenon causes a drop in the gas temperature,as the heat is now spread over a larger domain and not onlyconcentrated within the initial arc channel. Indeed, before theback-breakdown (0.3 ms), the temperature is the same in bothcases, but after the back-breakdown, the gas temperature inthe center between both electrodes is about 700 K and 890 K(at 0.4 and 0.5 ms, respectively; see figure 26 (upper panels)),which is obviously lower than in the case without back-breakdown, where values of 900 K and 1000 K are obtainedat the same moments in time (figure 26 (lower panels)).Furthermore, this figure also illustrates that the back-break-down causes a delay in the arc velocity with respect to the gasflow velocity (seethe case with and without back-break-down). Both effects are of great interest for CO2 conversionapplications, as the lower temperature results in more non-equilibrium conditions, which is beneficial for energy-efficient CO2 conversion, and the delay in arc velocity allows
Figure 25. Calculated electron density at different moments in time, as obtained from the model in [59], illustrating the arc evolution duringone cycle, from ignition at the shortest interelectrode distance, until extinction.
26
Plasma Sources Sci. Technol. 26 (2017) 063001 Topical Review

more gas to pass through the arc, which can lead to more CO2
conversion (as also briefly discussed in section 3.1.1 above).As mentioned in section 2.2 above, within our group we
have also developed a 1D cylindrical QN model for a GA,used for CO2 conversion. Figure 27 shows the number
densities of CO2, CO, O2, Oand the electrons (a), as well asthe electron temperature, the gas temperature and vibrationaltemperature of the CO2 asymmetric stretch mode (b), as afunction of radial position, as calculated with this model [65].Note that the radius of the (quasi-cylindrical) arc is assumedto be 2 mm, based on [52, 54]. It is clear from figure 27(a) thatCO2 is the dominant species in most of the arc, except in thevery center, where CO has a higher density. This indicatesthatwithin just 0.1 mm from the center, a considerablefraction of the CO2 gas is converted into CO, O and O2. Thiscan be explained bythe electron density profile, as well as thevarious temperature profiles, depicted in figure 27(b). Indeed,both the electron density and the various temperatures dropsignificantly as thedistance rises from the center. Theelectron density is fiveorders of magnitude lower than thegas density, corresponding to a weakly ionized plasma. Theelectron temperature is almost 3 eV (or 30 000 K) in thecenter of the arc, but drops to thermal values within 0.5 mmfrom the center. The vibrational temperature and gastemperature also reach their maximum (i.e.onthe order of2500 K) in the center, and drop significantly upon risingradial distance. The dominant CO2 conversion mechanismsappear to be dissociation from the CO2 vibrational levels,either upon electron impact or upon collision with the Oatoms (see details in [65]). As the vibrational temperature, theO atom density, the electron density and temperature all dropas a function of radial position, it is logical that the CO2
conversion should also dropupon rising radial position,explaining the density profiles shown in figure 27(a).
The calculated values of electron number density andtemperature, gas temperature and vibrational temperaturecorrespond well with the experimental data for low currentatmospheric pressure gliding arc discharges from theliterature, as elaborated in [65], although it should be realizedthat an exact quantitative comparison is not straightforward,due to the different gliding arc setups with different reactorgeometries and operating insomewhat different dischargeconditions.
3.2.4. Reverse vortex flow GA plasma. In figure 28 a typicalgas flow pattern is plotted, as well as snapshots of the electrondensity, showing the arc evolution over time, for the reversevortex flow GA plasma reactor, depicted in figure 4 above, asobtained from the model in [63].
After entering the reactor, the gas first flows downwardsin an outer vortex, with typical velocities of 70–80 m s−1, andthen flows upwards in a smaller (inner) vortex, with velocitiesgradually decreasing to 10 m s−1, and finally leaves thereactor through the outlet at the top, as illustrated infigure 28(a).
From the snapshots of the electron density, it is clear thatthe arc ignites as a straight plasma column, attached to theouter edge (b) and crawls along the outer edge (c), until itstabilizes at the reactor center, after about 1 ms (d). Thus, thegas, when moving in the inner vortex flow (seefigure 28(a)),will largely pass through the arc column. This result is veryinteresting for the application of CO2 conversion, as it shows
Figure 26. Calculated gas temperature in a GA, at different momentsin time, with back-breakdown (upper panels) and without back-breakdown (lower panels), as obtained from the model in [62].
Figure 27. Calculated number densities of CO2, CO, O2, Oandelectrons (a), and the electron, gas and vibrational temperature of theCO2 asymmetric stretch mode (b), as a function of the radial positionin the GA as obtained from the model in [65].
27
Plasma Sources Sci. Technol. 26 (2017) 063001 Topical Review
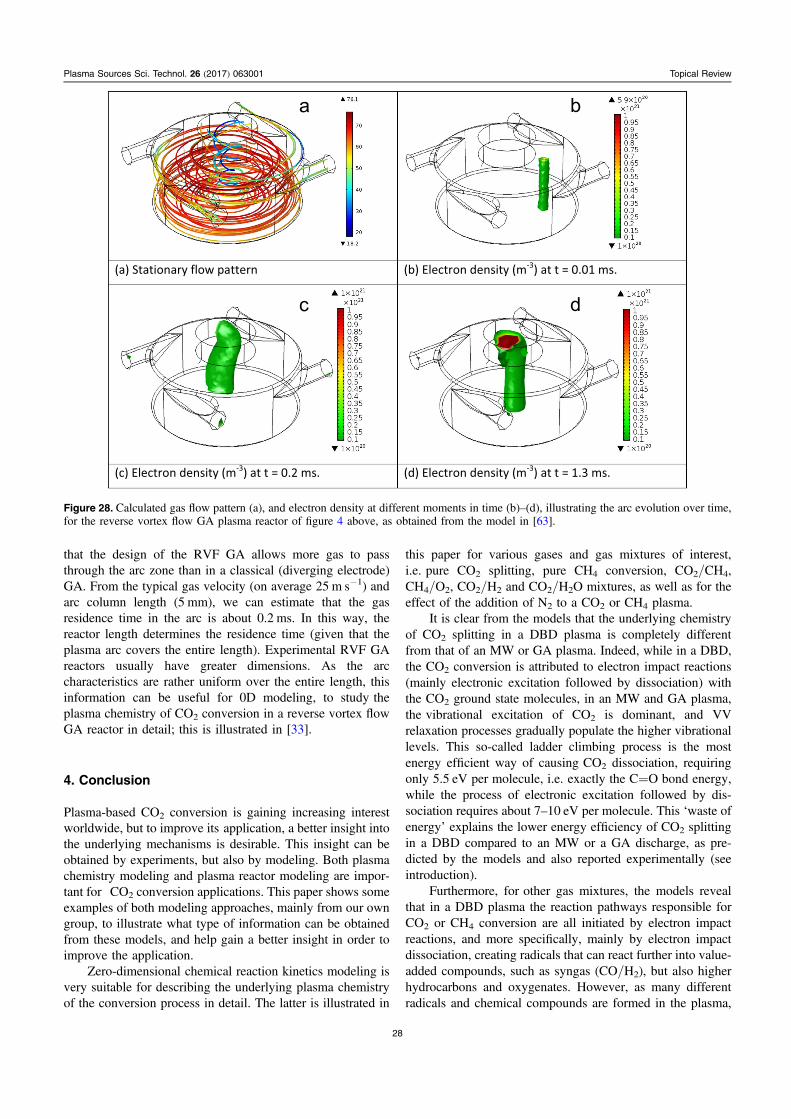
that the design of the RVF GA allows more gas to passthrough the arc zone than in a classical (diverging electrode)GA. From the typical gas velocity (on average 25 m s−1) andarc column length (5 mm), we can estimate that the gasresidence time in the arc is about 0.2 ms. In this way, thereactor length determines the residence time (given that theplasma arc covers the entire length). Experimental RVF GAreactors usually have greater dimensions. As the arccharacteristics are rather uniform over the entire length, thisinformation can be useful for 0D modeling, to studytheplasma chemistry of CO2 conversion in a reverse vortex flowGA reactorin detail;this is illustrated in [33].
4. Conclusion
Plasma-based CO2 conversion is gaining increasing interestworldwide, but to improve itsapplication, a better insight intothe underlying mechanisms is desirable. This insight can beobtained by experiments, but also by modeling. Both plasmachemistry modeling and plasma reactor modeling are impor-tant forCO2 conversion applications. This paper shows someexamples of both modeling approaches, mainly from our owngroup, to illustrate what type of information can be obtainedfrom these models, andhelpgaina better insightin order toimprove theapplication.
Zero-dimensionalchemical reaction kinetics modeling isvery suitable for describingthe underlying plasma chemistryof the conversion processin detail. The latter is illustrated in
this paper for various gases and gas mixtures of interest,i.e.pure CO2 splitting, pure CH4 conversion, CO2/CH4,CH4/O2, CO2/H2 and CO2/H2O mixtures, as well as for theeffect of the addition ofN2to a CO2 or CH4 plasma.
It is clear from the models that the underlying chemistryof CO2 splitting in a DBD plasma is completely differentfrom that ofan MW or GA plasma. Indeed, while in a DBD,the CO2 conversion is attributed to electron impact reactions(mainly electronic excitation followed by dissociation) withthe CO2 ground state molecules, in an MW and GA plasma,thevibrational excitation of CO2 is dominant, and VVrelaxation processes gradually populate the higher vibrationallevels. This so-called ladder climbing process is the mostenergy efficient way of causingCO2 dissociation, requiringonly 5.5 eV per molecule, i.e.exactly the C=O bond energy,while the process of electronic excitation followed by dis-sociation requires about 7–10 eV per molecule. This ‘waste ofenergy’ explains the lower energy efficiency of CO2 splittingin a DBD compared to an MW or a GA discharge, as pre-dicted by the models and also reported experimentally (seeintroduction).
Furthermore, forother gas mixtures, the models revealthat in a DBD plasma the reaction pathways responsible forCO2 or CH4 conversion are all initiated by electron impactreactions, and more specifically, mainly by electron impactdissociation, creating radicals that can react further into value-added compounds, such as syngas (CO/H2), but also higherhydrocarbons and oxygenates. However, as many differentradicals and chemical compounds are formed in the plasma,
Figure 28. Calculated gas flow pattern (a), and electron density at different moments in time (b)–(d), illustrating the arc evolution over time,for the reverse vortex flow GA plasma reactor of figure 4 above, as obtained from the model in [63].
28
Plasma Sources Sci. Technol. 26 (2017) 063001 Topical Review
the selective production of targeted compounds is not possi-ble. For this purpose, a catalyst must be inserted in theplasma. Our models show that CO2/CH4 and CH4/O2 mix-tures exhibit totally different chemical reaction pathways,yielding different product distributions. Furthermore, aCO2/H2 mixture does not produce many higher hydrocarbonsoroxygenates, in contrast to the CO2/CH4 and CH4/O2
mixtures, and moreover the CO2 conversion is very limited.This isattributed to the lack of CH2 (and CH3) radical for-mation in the CO2/H2 mixture, as the CH2 radicals are themain collision partners of CO2 in the CO2/CH4 mixture.
Likewise, the model for the CO2/H2O mixture showsthat adding H2O to a CO2 DBD plasma results in a drop of theCO2 conversion. Moreover, the H2O conversion itself is alsolimited, and virtually no oxygenated hydrocarbons areformed. All these trends canbe explained bythe chemicalreaction pathways. The insight obtained in this way might beuseful forprovidingpossible solutions. For instance, ourkinetic analysis reveals that no oxygenated hydrocarbons areformed upon the addition of H2Oto a CO2 plasma, becausethe H atoms react with the O atoms intoOH radicals, andsubsequently intoH2O, instead of forming CH and CHOfragments, which are needed to createmethanol and otheroxygenated hydrocarbons. To overcome this problem, webelieve that a catalyst will be needed, which is able to (i)scavenge the O atoms, so that the H atoms can recombine intoH2, before they react with O atoms into OH and H2O, and (ii)transform the H2 together with CO into methanol, before COrecombines with OH into CO2. On the other hand, theCO2/H2O plasma seems to be able to produce H2/CO ratiosin a very wide range, and this ratio can be controlled by theH2O content in the mixture and the SEI value. This is veryuseful for Fischer–Tropsch synthesis for the production ofliquid fuels, and also for methanol synthesis. Thus, even ifmethanol formation seemsunfeasible in a direct one-stepplasma process without a catalyst, it might be possible in atwo-step process. Furthermore, our model alsopredictsthatsignificant amounts of H2O2 can be formed, up to thepercentagerange, which is a useful compoundfor disinfec-tion or biomedical purposes.
Another example of 0D chemical kinetics modeling isgiven for a CO2/N2 plasma. This is of interest because N2 istypically a very important component in real industrial gasflows. A comparison is made between the DBD and MWplasma conditions, and it is shown that the CO2 conversionand energy efficiency are clearly higher in the MW plasma,which is again attributed to the vibrational kinetics. In con-trast to the CO2/H2O plasma, where the CO2 conversiondrops upon the addition ofH2O, both the calculations andexperiments in the CO2/N2 plasma demonstrate that theaddition of N2enhances the (absolute) CO2 conversion, bothin the DBD and MW plasma. The underlying mechanism is,however, different for both types of plasmas, i.e.it is attrib-uted to the N2 metastable molecules in the DBD plasma,while in the MW plasma it is due to the N2 vibrational levelswhich populate the CO2 vibrational levels. The CO2/N2
mixture, however, also produces NOx compounds in ppmconcentrations, which can causeseveral environmental
problems. Again, the model can be used to explain theirformation, and this is useful forprovidingpossible solutionson how this NOx formation can be avoided.
Finally, the last example is given for a CH4/N2 mixture,as CH4 reforming by plasma is also very relevant, and N2 isalways present in natural gas. Furthermore, it is useful toknow whether nitrogenated compounds (e.g.HCN or NH3)canbe formed, which would also be of interest for valoriza-tion purposes. However, the model reveals that almost nonitrogenated compounds are formed, and this canbeexplained because of the limited electron impact ionization ofN2, which was reported in theliterature to be mainlyresponsible for the formation of these compounds.
Although 0D models can give useful informationondetailed plasma chemistry, and thus the reaction pathwaysleading to certain products, they cannot really account fordetails in the plasma reactor configuration. In order to be ableto predict how modifications to the reactor design might leadto improved CO2 conversion, 2D or 3D fluid models ofspecific reactor designs are needed. However, developingsuch fluid models for a detailed plasma chemistry leads toexcessive calculation times. Therefore,up to now thesemodels havemainly been developed for argon or helium,which are characterized by asimpler chemistry. Here we haveshownexamples of the typical calculation results, obtainedfor the three types of plasma reactors most commonly usedfor CO2 conversion, namelya packed-bed DBD reactor, anMW plasma, and both a classical and reverse vortex flow GAplasma reactor.
In future work, it would be necessary to implement themore complex CO2 chemistry (either pure or mixed withother gases) in such fluid models, to obtain the completepicture of CO2 conversion in these plasma reactors. Further-more, at thisstage, it will be necessary to compare the calc-ulation results with experimental data. The most obviousresults to be compared are the electrical characteristics, aswell as the CO2 conversion, product yields and energy effi-ciency—as has beendone already for the 0D chemicalkinetics models—as this information can more easily beobtained in the experiments. Detailed comparison of othercalculation results, like the spatially resolved densities ofplasma species, electron temperature, gas temperature, gasflow behaviorand information about the vibrational kinetics,is more difficult to realize at this stage, because the 2Dmodels are still based on some approximations, which makethe comparison less straightforward, and because of a generallack of experimental data in the literature for these plasmareactors. The latter also stresses the added value of modeling.However, we sincerely hope that more experimental data forthese plasma reactor types will become available in the nearfuture, to better validate the models.
As mentioned above, implementing more complexplasma chemistries in 2D or 3D models is quite challenging interms of calculation time. To overcome this problem, reducedchemistry sets must be developed for CO2 (and its gas mix-tures), either without vibrational kinetics, applicable to aDBD reactor [16], as well as with detailed vibrational kinet-ics, which is crucial for describing an MW or GA plasma
29
Plasma Sources Sci. Technol. 26 (2017) 063001 Topical Review

reactor [85]. Furthermore, the level-lumping strategy that wasdeveloped in [85] enablesthe vibrational levels of theasymmetric stretch mode of CO2to be put into a number ofgroups, to further reduce the calculation time, as demon-strated in [64, 85]. This method opens possibilities for theimplementation of more complicated reaction chemistries in2D (and hopefully in the future in 3D) plasma reactor models,which is of course the ultimate goal of the models tobe developed for this application. In general, we indeedbelievethat a combination of 0D chemical kinetics models (toobtain a detailed insight into the entire plasma chemistry, andto develop reduced chemistry sets, identifying the main spe-cies and chemical reactions) and 2D/3D fluid models (for adetailed insight into the effect of the reactor design) is themost promising approach formakingfurther progress inthis field.
As the modeling results presented here provide anoverview of the plasma chemistry for various gas mixtures ofinterest, and in the three major types of plasma reactors forthis application, we can use them to gain further insight intowhat would be the ‘ultimate’ reactor and reaction conditionsto maximize the conversion and energy efficiency, and whe-ther plasma technology is competitive with other emergingconversion technologies, and has the potential to becomeindustrially relevant.
According to the models, the energy efficiency of CO2
conversion will always be too limited in a DBD. This isattributed to the strong reduced electric field values (200 Tdand above), giving rise to relatively high electron energies(several eV), and thereby inducing electron impactelectronicexcitation, ionization and dissociation of the CO2 ground statemolecules, which are energy inefficient processes. Indeed,they require more energy than strictly needed forC=O bondbreaking, compared to the vibrational pathway, which onlyrequires astrict minimum of 5.5 eV. The conversion can beimproved in packed-bed DBD reactors, due toenhancedelectric fields at the contact points, causing higher electronenergies, as demonstrated by the 2D modeling results pre-sented in this paper, yielding more electron impact processesfor the same applied power. However, these processes areobviously still electronic excitation, ionization and dissocia-tion, because for vibrational excitation lower electron ener-gies are needed. Thus we believe that DBD reactors willnever yieldsufficiently high energy efficiency for the indus-trial exploitation of pure CO2 splitting, unless drasticallydifferent conditions canbe reached, which can tune thereduced electric field down to lower values, suitable forelectron impact vibrational excitation, usingnovel types ofpower supplies, for example. It is clear, indeed, that thevibrational pathway for CO2 dissociation should be targetedto really improve the energy efficiency of this process. On theother hand, packed-bed DBD reactors might still be of interestin the case of CO2 mixtures with a H-source, such as CH4,H2O and H2, as they easily allow the implementation of acatalyst. If a suitable catalyst can be found to selectivelyproduce chemical compounds with high added value, thismight compensate for the limited energy efficiency of thepacked-bed DBD reactor, because plasma catalysis could then
allow the direct production of these value-added compounds,instead of a two-step process through syngas productionfollowed by the Fischer–Tropsch synthesis. However,a lot ofbasic research will still be needed in the search for suitablecatalysts, as the latter might be different from classical ther-mal catalysts, because of the completely different conditionsof plasma catalysis.
On the other hand, the models reveal thatMW and GAplasmas are more promising for energy efficient CO2 con-version, because they are characterized by lower reducedelectric field values (on theorder of 50–100 Td), producingelectron energies of around 1 eV, which are themost suitablefor efficient vibrational excitation. However, currently, mostMW and GA plasmas do not yet operate at the most suitableconditions to maximize the vibrational pathway, as the con-version process is often too much dictated by thermal pro-cesses, as a result of the high gas temperature.
The model calculations clearly demonstrate the need toexploit the non-equilibrium, non-thermal character of an MWplasma, where the higher vibrational levels of CO2 areoverpopulated, as this is crucial for energy efficient CO2
conversion. This can be realized when operating at reducedpressure and sufficiently high power densities, while keepingthe gas temperature as low as possible, as demonstrated in thispaper. On the other hand, for industrial applications, it wouldbe beneficial to work at atmospheric pressure, to avoid theextra cost of pumping, which also contributes to the overallenergy cost of the process. We believe that there are severalpossible options forreaching these non-equilibrium condi-tions, while still operating at atmospheric pressure ofCO2 gasentering the reactor. One option is to work with a supersonicgas flow, as already demonstrated by Asisov et al in 1983,reaching energy efficiencies of 90% [19], because such asetup can combine a reduced pressure in the plasma regio-nand a low temperature, with high power density. Anotherpossibility is to apply a reverse vortex gas flow, as currentlyexplored in DIFFER [23], because this leads to gas cooling,as well as stabilization of the plasma at atmospheric pressure.A third option could be to apply pulsed power, which willalso allow high power densities to be reached, with reducedgas heating. We plan to investigate these options in our futuremodeling work.
Also in a GA plasma, the models predict that the CO2
conversion is still too much dictated by thermal processes,due to the relatively high temperature inside the arc region,thus limiting the energy efficiency reached up to now.However, we believe that in a GA plasma there is also clearroom for improvement. Indeed, the calculations demonstratethatsignificant overpopulation of the higher vibrational levelsin the VDF can be realized by decreasing the temperature orby increasing the power density, just like in an MW plasma.The first option can probably be targeted by using a high-frequency discharge, so that the arc doesnot haveenoughtime to heat up. The second option couldbe realized by usinga micro-scale gliding arc reactor, as demonstrated in[142],although this will limit the throughput, unless using severalreactors in parallel.
30
Plasma Sources Sci. Technol. 26 (2017) 063001 Topical Review

Another limitation of a GA, at least in the classical(diverging electrodes) configuration, is the limited gas frac-tion that passes through the arc. Indeed, the model calcula-tions reveal that inside the arc,CO2 splitting into CO and O2
can reach up to 100%, but the overall CO2 conversion islimited by the fraction of gas passing through the arc, which isonthe order of 10%–20% [143, 144]. In addition, as a resultof this high conversion, the backward (recombination) reac-tions become equally as important as the forward (dissocia-tion) ones, thereby limiting the overall conversion. This wasconvincingly demonstrated in [64], by removing the recom-bination reaction from the model (see also figure 9 in thispaper). We believe that the backward reactions would bereduced if some chemical scavengers could be added, such asCH4, which produce H atoms that quickly react with the Oatoms, before the latter can recombine with the CO moleculesinto CO2. A similar principle was also illustrated both bymodeling and experiments in [145] for a DBD to chemicallytrap the O atoms into H2O instead of O2, and thus allo-wingeasier separation of the products formed. Furthermore,working at a lower gas temperature willreduce the backwardreactions, because the O atoms willbe usedmore efficientlyfor other reactions (e.g. O3 formation).
Finally, another way ofreducingthe backward reactionsis to make sure that the CO molecules leave the arc dischargezone once they are formed. This canbe realized when there isa difference in velocity between the gas flow and the arcmovement. In addition, the latter would result in more CO2
gaspassing through the arc, thereby also reducing the limitedgas fraction that can be treated, which is, in our opinion, themost crucial limitation of (classical) GA discharges. A dif-ference in gas flow velocity versusarc gliding velocity mayresult from the phenomenon of back-breakdown, whichindeed causes a lower gliding arc velocity, as demonstratedby the 2D fluid modeling results presented in this paper, aswell as in the literature [146–148]. Experimentally, someoperating parameters can be adjusted to control the occur-rence of the back-breakdown process, such as the gas flowrate, the electrical current and the reactor/electrode geometry.In addition, the back-breakdown phenomenon will reduce thegas temperature, as illustrated by the model calculationspresented in this paper, because the heat will be spread outover a larger region, so this will also be beneficial forexploiting the non-equilibrium conditions of the GA. Finally,applying a different design ofGA reactor, such asa reversevortex flow GA, also allows more gas to pass through the arc.Indeed, the 3D model calculations presented in this paperdemonstrate that in this setup the gas first flows in a vortexclose to the reactor walls to one end of the reactor, followedby an inner vortex in the reverse direction, and that the arc isstabilized in the middle of the reactor, so that this inner vortexpasses through the arc, thereby allowing a larger gas fractionto be converted in the arc zone. Themodel calculations pre-dict this fraction to bearound 40% for the RVF GA reactordeveloped in [25, 27], but this can probably be furtherimproved by modifyingthe reactor setup.
In conclusion, the model calculations reveal that there isstill room for improvement inthe energy efficiency ofan
MW and GA plasma, by further exploiting the non-equili-brium conditions, and by enhancing the gas fraction thatpasses through the arc in the case of the GA reactor. The mostimportant general message from the models is thatin order tooptimize the energy efficiency of CO2 conversion in any kindof plasma, the vibrational pathway should be maximized, i.e.theelectron impact vibrational excitation to the lower levels,followed by VV relaxation, gradually populating the higherlevels, which can then dissociate upon collision with heavyparticles. To reach this, the VDF must be strongly non-ther-mal, with a pronounced overpopulation of the higher vibra-tional levels.
We believe that if these non-equilibrium conditions canbe further exploited, plasma technology will be competitivewith other emerging CO2 conversion technologies, such aselectrocatalytic, photocatalytic and solar thermochemicalconversion. All these emerging technologies directly orindirectly use sunlight for the production of fuels. Therefore,the key performance indicator forcomparingthese differenttechnologies is the solar-to-fuel energy conversion efficiency.Photocatalytic and solar thermochemical conversion tech-nologies directly use sunlight.The solar-to-fuel efficiency ofphotocatalytic conversion is currently less than 2% [149], buta lot of research is going on to improve this number.Nevertheless, the theoretical maximum solar-to-fuel effi-ciency will be limited to 17%, due to the band gap energy ofthe photocatalyst [150]. For solar thermochemical conversion,theoretical solar-to-fuel efficiencies exceeding 30% arereported, but values above 10% are still pending experimentaldemonstration with robust and scalable solar reactors[149, 151, 152]. It is stated that a value of 20% is required forsolar fuels to become cost competitive [153]. Other novelconversion technologies indirectly use sunlight, the mostwidespread one being water electrolysis. When using photo-voltaic cells, which currently have an efficiency of 25%,solar-to-fuel efficiencies of 7%–10% are reported for waterelectrolysis [149].
As mentioned in the introduction, plasma technologyalso has the potential for use in temporary storage of excessrenewable energy infuels, during peak production ofsolarpanels, for example. Hence, assuming that the electricityneeded for our plasma process is produced by solar panels,with an efficiency of 25%, an energy efficiency of 50% forCO2 conversion in the plasma, as was predicted by the modelsunder suitable conditions, and which has also already bee-nexperimentallydemonstrated, would yield a solar-to-fuelefficiency of 12.5%. This value is already better than severalother emerging technologies, and close to being cost com-petitive. Furthermore, we are convinced bythe model calcu-lations that there is still room for improvement inenergyefficiency, certainly forMWs and GAs, as outlined above.Finally, the overall energy efficiency can be further improvedwhen the efficiency of solar panels becomes higher. Fur-thermore, besides relying on solar-based renewable energy,plasma technology can also take advantage of other sources ofrenewable electricity. Note that the latter option is obviouslynot possible for photochemical and solar thermochemical
31
Plasma Sources Sci. Technol. 26 (2017) 063001 Topical Review

technologies, which directly use sunlight, pointing towardsthe higher flexibility of plasma technology.
Acknowledgments
We would like to thank T Silva, N Britoun, Th Godfroid andR Snyders (Université de Mons and Materia Nova ResearchCenter), A Ozkan, Th Dufour and F Reniers (Université Librede Bruxelles) andK Van Wesenbeeck and S Lenaerts (Uni-versity of Antwerp) for providingexperimental data tovalidate our models. Furthermore, we acknowledge thefinancial support from the IAP/7 (Inter-university AttractionPole) program ‘PSI-Physical Chemistry of Plasma-SurfaceInteractions’ by the Belgian Federal Office for Science Policy(BELSPO), the Francqui Research Foundation, the EuropeanUnion’s Seventh Framework Programme for research, tech-nological development and demonstration under grantagreement no. 606889, the European Marie Skłodowska-Curie Individual Fellowship project ‘GlidArc’ within Hor-izon2020, the Methusalem financing of the University ofAntwerp, the Fund for Scientific Research, Flanders (FWO;grant nos. G.0383.16N and 11U5316N) and the Institute forthe Promotion of Innovation by Science and Technology inFlanders (IWT Flanders). The calculations were carried outusing the Turing HPC infrastructure at the CalcUA corefacility of the Universiteit Antwerpen (UAntwerpen), a divi-sion of the Flemish Supercomputer Center VSC, funded bythe Hercules Foundation, the Flemish Government (depart-ment EWI) and the UAntwerpen.
References
[1] McDonough W and Braungart M 2002 Cradle to Cradle:Remaking the Way We Make Things (New York: NorthPoint Press)
[2] Centi G, Quadrelli E A and Perathoner S 2013 EnergyEnviron. Sci. 6 1711
[3] Aresta M, Dibenedetto A and Angelini A 2014 Chem. Rev.114 1709
[4] Styring P, Quadrelli E A and Armstrong K 2015 CarbonDioxide Utilization: Closing the Carbon Cycle (Amsterdam:Elsevier)
[5] Paulussen S, Verheyde B, Tu X, De Bie C, Martens T,Petrovic D, Bogaerts A and Sels B 2010 Plasma SourcesSci. Technol. 19 034015
[6] Pinhao N R, Janeco A and Branco J B 2011 Plasma ChemPlasma Proc. 31 427
[7] Eliasson B, Kogelschatz U, Xue B and Zhou L-M 1998 Ind.Eng. Chem. Res. 37 3350
[8] Wang Q, Cheng Y and Jin Y 2009 Catal. Today 148 275[9] Zhang A-J, Zhu A-M, Guo J, Xu Y and Shi C 2010 Chem.
Eng. J. 156 601[10] Tu X, Gallon H J, Twigg M V, Gorry P A and Whitehead J C
2011 J. Phys. D: Appl. Phys. 44 274007[11] Nozaki T and Okazaki K 2013 Catal. Today 211 29[12] Gómez-Ramírez A, Rico V J, Cotrino J,
González-Elipe A R and Lambert R M 2014 ACS Catalysis4 402
[13] Scapinello M, Martini L M and Tosi P 2014 Plasma ProcessPolym. 11 624
[14] Mei D, Zhu X, He Y, Yan J D and Tu X 2015 PlasmaSources Sci. Technol. 24 015011
[15] Ozkan A, Dufour T, Arnoult G, De Keyzer P, Bogaerts A andReniers F 2015 J. CO2 Util. 9 74
[16] Aerts R, Somers W and Bogaerts A 2015 ChemSusChem.8 702
[17] Ramakers M, Michielsen I, Aerts R, Meynen V andBogaerts A 2015 Plasma Process. Polym. 12 755
[18] Van Laer K and Bogaerts A 2015 Energy Technol. 3 1038[19] Asisov R I, Givotov V K, Krasheninnikov E G, Potapkin B V,
Rusanov V D and Fridman A 1983 Sov. Phys., Doklady271 94
[20] Spencer L F and Gallimore A D 2013 Plasma Sources Sci.Technol. 22 015019
[21] Silva T, Britun N, Godfroid T and Snyders R 2014 PlasmaSources Sci. Technol. 23 025009
[22] Goede A P H, Bongers W A, Graswinckel M F,van de Sanden M C M, Leins M, Kopecki J, Schulz A andWalker M 2013 EPJ Web of Conf. 3rd Eur. EnergyConference
[23] Bongers W et al 2017 Plasma Process. Polym. (https://doi.org/10.1002/ppap.201600126)
[24] van Rooij G J, van den Bekerom D C M, den Harder N,Minea T, Berden G, Bongers W A, Engeln R,Graswinckel M F, Zoethout E and van de Sanden M C M2015 Faraday Discuss. 183 233
[25] Kalra C S, Cho Y I, Gutsol A, Fridman A and Rufael T S2005 Rev. Sci. Instrum. 76 025110
[26] Indarto A, Yang D R, Choi J-W, Lee H and Song H K 2007J. Hazard. Mater. 146 309
[27] Nunnally T, Gutsol K, Rabinovich A, Fridman A,Gutsol A and Kemoun A 2011 J. Phys. D: Appl. Phys. 44274009
[28] Lee H and Sekiguchi H 2011 J. Phys. D: Appl. Phys. 44274008
[29] Tu X and Whitehead J C 2014 Int. J. Hydrogen Energy 39 9658[30] Liu J L, Park H W, Chung W J and Park D W 2016 Chem.
Eng. J. 285 243[31] Liu J L, Park H W, Chung W J and Park D W 2016 Plasma
Chem. Plasma Process. 36 437[32] Li K, Liu J L, Li X S, Zhu X and Zhu A M 2016 Chem. Eng.
J. 288 671[33] Ramakers M, Trenchev G, Heijkers S, Wang W and
Bogaerts A ChemSusChem. at press (https://doi.org/10.1002/cssc.201700589)
[34] Scapinello M, Martini L M, Dilecce G and Tosi P 2016J. Phys. D: Appl. Phys. 49 075602
[35] Shapoval V, Marotta E, Ceretta C, Konjevic N, Ivkovic M,Schiorlin M and Paradisi C 2014 Plasma Process Polym.11 787
[36] Zhu B, Li X S, Shi C, Liu J L, Zhao T L and Zhu A M 2012Int. J. Hydrogen Energy 37 4945
[37] Zhu B, Li X S, Liu J L, Zhu X and Zhu A M 2015 Chem.Eng. J. 264 445
[38] Chang J S, Kostov K G, Urashima K, Yamamoto T,Okayasu Y, Kato T, Iwaizumi T and Yoshimura K 2000IEEE Trans. Ind. Appl. 36 1251
[39] Takaki K, Chang J-S and Kostov K G 2004 IEEE Trans.Dielectr. Electr. Insul. 11 481
[40] Zhang Y, Wang H-Y, Jiang W and Bogaerts A 2015 New J.Phys. 17 083056
[41] Kang W S, Park J M, Kim Y and Hong S H 2003 IEEE Trans.Plasma Sci. 31 504
[42] Russ H, Neiger M and Lang J E 1999 IEEE Trans. PlasmaSci. 27 38
[43] Kruszelnicki J, Engeling K W, Foster J E, Xiong Z andKushner M J 2017 J. Phys. D: Appl. Phys. 50 025203
[44] Van Laer K and Bogaerts A 2016 Plasma Sources Sci.Technol. 25 015002
32
Plasma Sources Sci. Technol. 26 (2017) 063001 Topical Review

[45] Van Laer K and Bogaerts A 2017 Plasma Process. Polym. 14e1600109
[46] Georgieva V et al 2017 Plasma Process Polym. 14 e1600185[47] Janssen G M 2000 PhD Thesis Eindhoven University of
Technology, the Netherlands[48] Jimenez-Diaz M, Carbone E A D, van Dijk J and
van der Mullen J J A M 2012 J. Phys. D: Appl. Phys. 45335204
[49] Rahimi S, Jimenez-Diaz M, Hubner S, Kemaneci E H,van der Mullen J J A M and van Dijk J 2014 J. Phys. D:Appl. Phys. 47 125204
[50] Kabouzi Y, Graves D B, Castanos-Martınez E and Moisan M2007 Phys. Rev. E 75 016402
[51] Chen G, Georgieva V, Godfroid T, Snyders R andDelplancke-Ogletree M-P 2016 Appl. Cat. B: Environm.190 115
[52] Richard F, Cormier J M, Pellerin S and Chapelle J 1996J. Appl. Phys. 79 2245
[53] Fridman A et al 1999 Prog. Energy Combust. Sci. 25 211[54] Pellerin S, Richard F, Chapelle J, Cormier J M and Musiol K
2000 J. Phys. D: Appl. Phys. 33 2407[55] Mutaf-Yardimci O, Saveliev A V, Fridman A A and
Kennedy L A 2000 J. Appl. Phys. 87 1632[56] Kuznetsova I V, Kalashnikov N Y, Gutsol A F,
Fridman A A and Kennedy L A 2002 J. Appl. Phys. 92 4231[57] Pellerin S, Cormier J-M, Richard F, Musiol K and Chapelle J
1999 J. Phys. D: Appl. Phys. 32 891[58] Gutsol A F and Gangoli S P 2017 IEEE Trans. Plasma Sci. at
press (https://doi.org/10.1109/TPS.2017.2653841)[59] Kolev S and Bogaerts A 2015 Plasma Sources Sci. Technol.
24 015025[60] Kolev S and Bogaerts A 2015 Plasma Sources Sci. Technol.
24 065023[61] Kolev S, Sun S R, Trenchev G, Wang W, Wang H X and
Bogaerts A 2017 Plasma Process Polym. 14 e1600110[62] Sun S R, Kolev S, Wang H X and Bogaerts A 2017 Plasma
Sources Sci. Technol. 26 015003[63] Trenchev G, Kolev S and Bogaerts A 2016 Plasma Sources
Sci. Technol. 25 035014[64] Sun S R, Wang H X, Mei D H, Tu X and Bogaerts A 2017
J. CO2 Util. 17 220[65] Wang W, Berthelot A, Kolev S, Tu X and Bogaerts A 2016
Plasma Sources Sci. Technol. 25 065012[66] Indarto A, Choi J-W, Lee H and Song H K 2005 J. Natural
Gas Chem. 14 13[67] Indarto A, Coowanitwong N, Choi J-W, Lee H and Song H K
2008 Fuel Process. Technol. 89 214[68] Cenian A, Chernukho A, Borodin V and Sliwinski G 1994
Contrib. Plasma Phys. 34 25[69] Cenian A, Chernukho A and Borodin V 1995 Contrib.
Plasma Phys. 35 273[70] Hokazono H and Fujimoto H 1987 J. Appl. Phys. 62 1585[71] Gordiets B F, Osipov A I, Stupochenko E V and Shelepin L A
1973 Sov. Phys. - Usp. 15 759[72] Kustova E and Nagnibeda E 2006 Chem. Phys. 321 293[73] Rusanov V D, Fridman A A and Sholin G V 1981 Sov. Phys.
- Usp. 24 447[74] Aerts R, Martens T and Bogaerts A 2012 J. Phys. Chem. C
116 23257[75] Kozák T and Bogaerts A 2014 Plasma Sources Sci. Technol.
23 045004[76] Kozák T and Bogaerts A 2015 Plasma Sources Sci. Technol.
24 015024[77] Ponduri S, Becker M M, Welzel S, van de Sanden M C M,
Loffhagen D and Engeln R 2016 J. Appl. Phys. 119 093301[78] Pietanza L D, Colonna G, D’Ammando G, Laricchiuta A and
Capitelli M 2015 Plasma Sources Sci. Technol. 24 042002[79] Pietanza L D, Colonna G, D’Ammando G, Laricchiuta A and
Capitelli M 2016 Chem. Phys. 468 44
[80] Pietanza L D, Colonna G, D’Ammando G, Laricchiuta A andCapitelli M 2016 Phys. Plasmas 23 013515
[81] Pietanza L D, Colonna G, Laporta V, Celiberto R,D’Ammando G, Laricchiuta A and Capitelli M 2016 J. Phys.Chem. A 120 2614
[82] Pietanza L D, Colonna G, D’Ammando G and Capitelli M2016 Plasma Phys. Contr. Fusion 59 014035
[83] Capitelli M, Colonna G, D’Ammando G, Hassouni K,Laricchiuta A and Pietanza L D 2017 Plasma ProcessPolym. 14 e1600109
[84] Koelman P, Heijkers S, Tadayon Mousavi S, Graef W,Mihailova D, Kozák T, Bogaerts A and van Dijk J 2017Plasma Process. Polym. 14 e1600155
[85] Berthelot A and Bogaerts A 2016 Plasma Sources Sci.Technol. 25 045022
[86] Chen J-L, Wang H-X and Sun S-R 2016 Chin. Phys. Lett. 10108201
[87] de la Fuenta J F, Moreno S H, Stankiewicz A I andStefanidis G D 2016 Reaction Chem. Eng. 1 540–54
[88] Berthelot A and Bogaerts A J. Phys. Chem. C 1218236–51
[89] Moss M, Yanallah K, Allen R and Pontiga F 2017 PlasmaSources Sci. Technol. 26 035009
[90] Yang Y 2003 Plasma Chem. Plasma Process. 23 327[91] De Bie C, Verheyde B, Martens T, van Dijk J,
Paulussen S and Bogaerts A 2011 Plasma Process. Polym.8 1033
[92] Luche J, Aubry O, Khacef A and Cormier J M 2009 Chem.Eng. J. 149 35
[93] Zhou L M, Xue B, Kogelschatz U and Eliasson B 1998Energ. Fuel. 12 1191
[94] Machrafi H, Cavadias S and Amouroux J 2011 J. Phys.: Conf.Ser. 275 012016
[95] Goujard V, Tatibouet J M and Batiot-Dupeyrat C 2011Plasma Chem. Plasma Process. 31 315
[96] Wang J G, Liu C J and Eliasson B 2004 Energ. Fuel. 18148
[97] Istadi I and Amin N A S 2007 Chem. Eng. Sci. 62 6568[98] Kraus M, Egli W, Haffner K, Eliasson B, Kogelschatz U and
Wokaun A 2002 Phys. Chem. Chem. Phys. 4 668[99] Liu C J, Li Y, Zhang Y P, Wang Y, Zou J, Eliasson B and
Xue B 2001 Chem. Lett. 12 1304[100] De Bie C, Martens T, van Dijk J, Paulussen S,
Verheyde B and Bogaerts A 2011 Plasma Sources Sci.Technol. 20 024008
[101] Snoeckx R, Aerts R, Tu X and Bogaerts A 2013 J. Phys.Chem. C 117 4957
[102] Snoeckx R, Zeng Y X, Tu X and Bogaerts A 2015 RSC Adv.5 29799
[103] Janeco A, Pinhão N R and Guerra V 2015 J. Phys. Chem. C119 109
[104] De Bie C, van Dijk J and Bogaerts A 2015 J. Phys. Chem. C119 22331
[105] Zhou L M, Xue B, Kogelschatz U and Eliasson B 1998Plasma Chem. Plasma Process. 18 375
[106] Nair S A, Nozaki T and Okazaki K 2007 Chem. Eng. J.132 85
[107] Goujard V, Nozaki T, Yuzawa S, Ağiral A and Okazaki K2011 J. Phys. D: Appl. Phys. 44 274011
[108] Agiral A, Nozaki T, Nakase M, Yuzawa S, Okazaki K andGardeniers J G E 2011 Chem. Eng. J. 167 560
[109] Zhou J, Xu Y, Zhou X, Gong J, Yin Y, Zheng H and Guo H2011 ChemSusChem. 4 1095
[110] Matin N S and Whitehead J C 2007 28th ICPIG (Prague,Czech Republic, July 15–20, 2007) p 983
[111] Snoeckx R, Ozkan O, Reniers F and Bogaerts A 2017ChemSusChem. 10 409
[112] De Bie C, van Dijk J and Bogaerts A 2016 J. Phys. Chem. C120 25210
33
Plasma Sources Sci. Technol. 26 (2017) 063001 Topical Review
[113] Heijkers S, Snoeckx R, Kozák T, Silva T, Godfroid T,Britun N, Snyders R and Bogaerts A 2015 J. Phys. Chem. C119 12815
[114] Snoeckx R, Heijkers S, Van Wesenbeeck K, Lenaerts S andBogaerts A 2016 Energy Environm. Sci. 9 999
[115] Legrand J, Diamy A, Hrach R and Hrachova V 1997 Vacuum48 671
[116] Majumdar A, Behnke J F, Hippler R, Matyash K andSchneider R 2005 J. Phys. Chem. A 109 9371
[117] Pintassiglio C D, Jaoul C, Loureiro J, Belmonte T andCzerwiec T 2007 J. Phys. D: Appl. Phys. 403620
[118] Jauberteau J L, Jauberteau I, Cinelli M J and Aubreton J 2002New J. Phys. 4 1
[119] Savinov S Y, Lee H, Keun H and Na B 2003 Plasma Chem.Plasma Process. 23 159
[120] Snoeckx R, Setareh M, Aerts R, Simon P, Maghari A andBogaerts A 2013 Int. J. Hydrogen Energy 38 16098
[121] Fridman A 2008 Plasma Chemistry (Cambridge: CambridgeUniversity Press)
[122] Bogaerts A, Wang W, Berthelot A and Guerra V 2016Plasma Sources Sci. Technol. 25 055016
[123] Britun N, Godfroid T and Snyders R 2012 Plasma SourcesSci. Technol. 21 035007
[124] Tu X, Gallon H J and Whitehead J C 2011 Electrical andoptical diagnostics of atmospheric pressure argon gliding arcplasma jet 30th Int. Conf. on Phenomena in Ionized Gases(Belfast, UK, 28 August–2 September 2011)
[125] Bogaerts A, De Bie C, Snoeckx R and Kozák T PlasmaProcess Polym. (https://doi.org/10.1002/ppap.201600070)
[126] Grofulovic M, Alves L L and Guerra V 2016 J. Phys. D:Appl. Phys. 49 395207
[127] Phelps Database, (www.lxcat.net), (Accessed: 1 December 2015)[128] Lowke J J, Phelps A V and Irwin B W 1973 J. Appl. Phys.
44 4664[129] Hake R D Jr and Phelps A V 1967 Phys. Rev. 158 70[130] Cosby P C and Helm H 1993 Dissociation rates of diatomic
molecules Report AD-A266 464, WL-TR-93-2004[131] Itikawa Y 2002 J. Phys. Chem. R31 749[132] Brehmer F, Welzel S, van de Sanden M C M and Engeln R
2014 J. Appl. Phys. 116 123303[133] Polak L S and Slovetsky D I 1976 Int. J. Radiat. Phys. Chem.
8 257
[134] Mahammadunnisa S, Reddy E L, Ray D,Subrahmanyam C and Whitehead J C 2013 Int. J. Greenh.Gas Control 16 361
[135] Patil B S, Wang Q, Hessel V and Lang J 2015 Catal. Today256 49
[136] Scarduelli G, Guella G, Ascenzi D and Tosi P 2011 PlasmaProcess. Polym. 8 25
[137] Kim H H, Ogata A and Song Y-H 2011 IEEE Trans. PlasmaSci. 39 2220
[138] Kim H H and Ogata A 2012 Int. J. Environ. Sci. Technol.6 43
[139] Tu X, Gallon H J and Whitehead J C 2011 IEEE Trans.Plasma Sci. 39 2172
[140] Boisse-Laporte C, Granier A, Dervisevic E, Leprince P andMarec J 1987 J. Phys. D: Appl. Phys. 20 197
[141] Korolev Y, Frants O, Landl N, Bolotov A andNekhoroshev V 2014 Plasma Sources Sci. Technol. 23054016
[142] Bo Z, Yan J, Li X, Chi Y and Cen K 2008 Int. J. Hydrog.Energy 33 5545
[143] Rusu I and Cormier J M 2003 Chem. Eng. J. 91 23[144] Ouni F, Khacef A and Cormier J M 2006 Chem. Eng.
Technol. 29 604[145] Aerts R, Snoeckx R and Bogaerts A 2014 Plasma Process.
Polym. 11 985[146] Pellerin S, Martinie O, Cormier J M, Chapelle J and
Lefaucheux P 1999 High Temp. Mater. Process. 3 167[147] Zhu J, Sun Z, Li Z, Ehn A, Alden M, Salewski M,
Leipold F and Kusano Y 2014 J. Phys. D: Appl. Phys. 47295203
[148] Mitsugi F, Furukawa J, Ohshima T, Kawasaki H,Kawasaki T, Aoqui S and Stryczewska H D 2013 Eur. Phys.J. Appl. Phys. 61 24308
[149] Smestad G P and Steinfeld A 2012 Ind. Eng. Chem. Res. 5111828
[150] Roy S C, Varghese O K, Paulose M and Grimes C A 2010ACS Nano 4 1259
[151] Scheffe J R and Steinfeld A 2014 Mater. Today 17 341[152] McDaniel A H, Miller E C, Arifin D, Ambrosini A,
Coker E N, O’Hayre R, Chueh W C and Tong J 2013Energy Environ. Sci. 6 2424
[153] Furler P, Scheffe J R and Steinfeld A 2012 Energy Environ.Sci. 5 6098
34
Plasma Sources Sci. Technol. 26 (2017) 063001 Topical Review