coal gasification: at the crossroads. economic outlook
TRANSCRIPT

ISSN 0040-6015, Thermal Engineering, 2021, Vol. 68, No. 5, pp. 347–360. © Pleiades Publishing, Inc., 2021.Russian Text © The Author(s), 2021, published in Teploenergetika.
STEAM BOILERS, POWER-PLANT FUELS, BURNER UNITS,AND BOILER AUXILIARY EQUIPMENT
Coal Gasification: At the Crossroads. Economic OutlookS. P. Filippova, * and A. V. Keikoa
a Energy Research Institute, Russian Academy of Sciences, Moscow, 117186 Russia*e-mail: [email protected]
Received September 16, 2020; revised September 25, 2020; accepted October 21, 2020
Abstract—Economic aspects of implementing coal gasification technology are considered. Many objectivecauses hindering the comparison of economic characteristics of the considered coal gasification technologiesare outlined. The energy and economic efficiencies of producing synthesis gas (syngas) from coal are esti-mated. The factors having the most pronounced effect on the efficiency, such as gasifier type, specific oxygenconsumption, and initial fuel cost, are found. According to the calculations, the cost of produced syngas istwo to three times higher than the price of natural gas for consumers. Therefore, the use of syngas and hydro-gen produced from it for the centralized generation of power and heat will not be economically feasible in theforeseeable future. Integrated gasification combined cycle (IGCC) units are still not competitive with con-ventional coal-fired power plants, basically due to high specific capital expenditures, which are responsiblefor more than 2/3 of the price of delivered electricity. The issues of economic competition for hydrogen pro-duction from coal using alternative production processes are discussed in detail. It is demonstrated thathydrogen produced from cheap local coals (in Russia, these are coals from large coal deposits in Siberia andthe Far East) can win the competition with hydrogen from natural gas. Nevertheless, activities should be con-tinued to improve coal gasification processes and associated technologies, first of all, oxygen productiontechnologies, to cut down capital and operating expenditures. Further development of coal chemical technol-ogies involves high risks associated with the new global climate policy aimed at a drastic decrease in CO2emissions and the replacement of fossil fuels in the global fuel and energy balance by renewable energysources. State support for the development of new coal technologies and for coal chemistry science is neces-sary to retain the domestic coal industry.
Keywords: coal gasification, gasifier, integrated gasification combined-cycle unit, coal, syngas, hydrogen,energy efficiency, syngas/hydrogen production costDOI: 10.1134/S0040601521050049
The ever-growing process of the global economy’sdecarbonization can have a detrimental effect on thecoal industry [1]. Its survival requires finding newcoal applications by manufacturing products withhigh added value. Coal gasification is among the keytechnologies for solving this problem. As demon-strated in [2], coal gasification technologies havealready reached a fully matured engineering status.Various designs of gasifiers and associated equipmentare available in the market. They are suitable for coal-based production of almost an entire range of productsconventionally obtained from oil and natural gas. Butthese products must be competitive in the market.Therefore, an urgent task is to assess the economicefficiency of coal gasification technologies for the pro-duction of gas for various needs. The obtained resultsshould determine the targets for further scientific-and-technological policy in this field.
Since there is no mass market for coal gasificationplants, including IGCC plants, no statistical data ontheir economic performance are available. That is whyinformation on such characteristics can be obtained by
analyzing the implemented projects, feasibility studiesof new projects, and results of numerical investigationson the basis of dedicated mathematical models.Unfortunately, the comparability of the data thusobtained is often unsatisfactory.
Many objective causes exist that hinder the com-parison of the economic performance of the devel-oped technologies of coal gasification and their imple-mented applications. First of all, this is process differ-ences as to the list of equipment items and theirperformance and characteristics. “Design” factors,such as mix and length of the required utilities (inter-connection wiring, water supply system, access roads,etc.) and climatic and geographical differences amongthe plant construction sites, can hardly be compara-ble. The structure of the declared total capital invest-ments may also differ considerably. They may includeonly the costs for the plant proper (for the main andauxiliary equipment, its installation and commission-ing, construction work), but they can be much wider(“total costs” for the project) to embrace the costs ofland management, land lease, engineering surveys,
347

348 FILIPPOV, KEIKO
Fig. 1. Schematic process diagram of syngas production from coal.
Air
Coal
Water
Electricity
Oxygen
Heat
Solid wastes
Steam
Slag
Steam
generation
Coal
preparation
Oxygen
production
Syngas
cooling
Syngas
Syngas
Coal
gasification
Slag
processing
Syngas
cleaning
Liquid
waste
treatment
Industrial
effluents
licensing, construction of external utilities, etc. Theexpenditures sometimes include the cost of borrowedcapital and, on the contrary, do not include govern-ment subsidies for the implementation of pilot proj-ects. Finally, it should be borne in mind that pilotplants are usually much more expensive than commer-cially produced ones.
The formation of the unit cost of technology in dif-ferent projects depends heavily on “country” factors,including differences among countries in the cost ofcapital; national currency rates; inflation rates; thelevel and forms of state support for demonstrationprojects; the availability and level of development ofthe scientific, process, and production base; etc. Forexample, the freezing of the FutureGen program inthe United States in 2008 suspended more than 30 coalgasification projects. Recently, investors have referredto uncertainties in the climate policies of states as oneof the main causes for the cancellation of coal proj-ects. The difference in inf lation rates hinders thecomparison of projects implemented or estimated indifferent years.
COAL GASIFICATION ECONOMICS
The economics of syngas production from coal iswell illustrated in [3]. This is a feasibility study for theconstruction of a plant for gasification of coal from theKarakan-Western coal strip mine prepared by specialistof the Technische Universitat Bergakademie Freiberg,Germany, in 2017. Raw Karakan Grade D coal (candlecoal) with a moisture content of approximately 15%,
ash content on dry basis of 9%, sulfur content on drybasis of 0.39%, and a lower heating value of 23 MJ/kgwas to be gasified. The coal heating value on a dry ash-free basis (Qdaf) is 31 MJ/kg [4]. Grade D coal is char-acterized by a low production cost which is less than$0.6/GJ in 2017 prices [5]. The obtained syngas was tobe used for manufacturing chemical products. Thecoal gasification plant capacity is 1800 t/day of coal.A process f low diagram of syngas production fromcoal is presented in Fig. 1.
The project [3] considers two technologies of oxy-gen coal gasification:
1. The GSP-process: high-temperature entrainedflow gasification of pulverized coal (first option);industrial applications are available;
2. The COORVED innovative technology combin-ing dense bed gasification and fluidized bed gasifica-tion; this technology is under development (secondoption).
An appropriate pilot plant is in operation inFreiberg [3]. The main advantages of a COORVEDmultizone gasifier over a GSP entrained flow gasifierare as follows:
1. No coal pulverization,2. Simpler systems for coal injection into the gas-
ifier and ash removal from it,3. Less oxygen consumption, and4. Simpler automation of main processes.Both technologies call for gasification at a pressure
of approximately 4 MPa; the expected carbon conver-sion efficiency is 99.8%.
THERMAL ENGINEERING Vol. 68 No. 5 2021

COAL GASIFICATION: AT THE CROSSROADS. ECONOMIC OUTLOOK 349
Table 1 presents the performance characteristics ofthe above-mentioned options of syngas productionfrom the Karakan coal calculated on the basis of thedata from [3, 4]. It is evident from Table 1 that thechoice of gasification technology has a considerableeffect on the project economics. According to [2], theenergy efficiency of a technology can be characterizedby the coal thermochemical conversion efficiency,which is the ratio of the energy of produced product tothe energy of the gasifier feedstock (coal):
where is the specific syngas yield, kg(of gas)/kg (of
coal); and are the (lower) heating
value of the gas and the coal, respectively, MJ/kg.
The coal thermochemical conversion efficiency asto the yield of the CO + H2 mixture is 74.6% for the
first option and 72.6% for the second option. For gen-erator gas, it is higher and attains 75.6 and 81.1%,respectively. The differences are explained by the dif-ferent composition of the produced gas. The H2/CO
molar ratio is approximately 0.34 in the first optionand 0.79 in the second option. In addition, the pro-duced gas in the second option has a high methanecontent of approximately 1.6 vol %.
Syngas production involves high power consump-tion to produce oxygen and cover other need of theplant itself. These needs estimated for the two optionsrequire 0.72 and 0.57 kWh/kg of dry ash-free coal,respectively (with a specific energy consumption for
oxygen production of 1.2 kWh/m3 of O2 and normal
conditions). The oxygen unit accounts for more than90% of the total power consumption. The energy effi-ciency of a coal gasification plant producing a mixtureof CO and H2 and designed considering its needs for
purchased power is 66.3% in the first option and66.0% in the second option.
Since the considered options differ appreciably inthe specific power consumption, it would be feasibleto determine the total energy efficiency of gas produc-tion from coal (η). The characteristic takes intoaccount the energy consumption for generation of thepurchased power (provided that all steam needs arecovered by the heat recovery within the plant) and isdetermined as
where e is the specific power consumption of the unit,referring to the energy of the gasified coal, MJ/MJ,
and is the efficiency of purchased power genera-
tion.
If we assume that the purchased electricity is gen-erated at a coal-fired power plant with an efficiency of40%, then the total energy efficiency of producing aCO + H2 mixture from coal will be 53.9% in the first
option and 56.2% in the second option, i.e., the sec-
( ) ( )=η LHV LHV ,t g g cg
gg( )LHV g ( )LHV c
( )= −η η 1 η ,t рe
ηр
THERMAL ENGINEERING Vol. 68 No. 5 2021
ond option turns out to be more advantageous fromthe energy standpoint.
It follows from Table 1 that the considered optionsdiffer noticeably in the economic performance. Thecost of equipment as per unit weight of the daily gas-ified coal is $56/(t/day) in the first option and$35/(t/day) in the second option. As to the equipmentcost structure, the oxygen unit accounts for the cost’smajor share amounting to 50% in the first option and69% in the second option. At the same time, the expen-ditures for the gasifier proper is relatively low compris-ing only 8% and 14%, respectively.
The cost of syngas production is $8.4/GJ in thefirst option and $6.3/GJ in the second option (in2017 prices). In the structure of the syngas cost, thecapital expenditures can be as high as 35–44% and theoperating costs as high as 39–41% for both options.The coal cost in the syngas cost is 18–23% or approx-imately $1.5/GJ. This means that coal is supplied forconversion at a price approximately two times higherthan the cost of its production.
The produced syngas cost turns out to be 2.4–3.2 times higher than the price of natural gas for Russianconsumers, which was approximately $2.6/GJ in 2017.Hence, it follows that syngas production from coal isnot yet economically attractive for the conditions ofRussia if the syngas is used as a fuel for the generationof electricity and heat. Under these conditions, reduc-ing the cost of coal supplied as a feedstock for conver-sion to the level of its production cost will be unhelpfulbecause of the relatively low percentage of the coalcosts in the syngas production cost. The economics ofcombining coal gasification with a combined-cycleunit will be discussed below.
A different situation is observed if the syngas isaimed at the production of chemicals. This is explainedby the fact that the production of syngas from coal or apetroleum feedstock is also an expensive and energy-intensive process. However, in this case, we have toreduce their CAPEX and OPEX components to attainthe competitiveness of coal chemical technologies. Thisrequires continuing work to improve coal gasificationtechnologies and associated processes. First of all,attention should be given to the development of newoxygen-production technologies.
The cost of equipment can be reduced, firstly, by itsfurther improvement and, secondly, by replication.The practice demonstrates a huge potential fordecreasing the cost of equipment by the commercial-ization of new developments. An example of this canbe a PWR gasifier by Pratt & Whitney Rocketdyne, Inc.(United States) in the 2000s. This is one of few newdevelopments of gasifier designs in this century. Appli-cation of rocket technologies and materials enabledthe designers of the PWR generator to reduce the sizeof the entrained flow gasifier by 90% and its unit costby almost 50% while maintaining the coefficient ofthermochemical coal conversion at a level of 85% [6].

350
THERMAL ENGINEERING Vol. 68 No. 5 2021
FILIPPOV, KEIKO
Table 1. Performance indicators of the Karakan coal gasification with syngas production
* Including power consumption for oxygen production and other needs of the plant itself. ** Using power generated at a coal-fired TPP with an efficiency of 40%
Indicator Gasifier
GSP COORVED
Gasifier coal capacity, t/day 1800 1800
Oxygen demand, m3/kg of dry ash-free coal (at normal conditions) 0.542 0.434
Steam demand, kg/kg of dry ash-free coal 0.01 0.516
Н2+СО yield, m3/kg of dry ash-free coal (at normal conditions) 1.95 2.04
Composition of dry generator gas, vol %:
H2 23.1 38.0
CO 68.1 47.9
CO2 7.6 11.6
CH4 0 1.57
N2 1.0 0.83
H2S 0.02 0.02
other 0.18 0.08
Total 100.0 100.0
H2/CO ratio in syngas, mol/mol 0.339 0.793
Syngas heating value, MJ/m3 (at normal conditions) 11.1 10.7
Coal thermochemical conversion efficiency, %, in terms of:
CO+H2 74.6 72.6
generator gas 75.6 81.1
Power consumption rate for production of oxygen and other own needs of the
plant, kW h/kg of dry ash-free coal
0.72 0.57
Plant energy efficiency*, %, in terms of:
CO+H2 66.3 66.0
generator gas 67.2 74.5
Total energy efficiency of syngas production**, %, in terms of:
CO+H2 53.9 56.2
generator gas 55.0 64.7
Cost of equipment per unit weight of gasified coal, thousand $/(t/day) 56 35
Equipment cost structure, %:
Coal grinding system 17.6 0.0
Gasifier coal injection system 10.0 4.9
Gasifier 8.3 14.0
Gasifier slag/ash removal system 4.2 2.4
Air separation unit 50.1 68.7
Primary gas cleaning system 4.6 7.0
Waste water treatment system 5.2 3.0
Total 100.0 100.0
Syngas production cost, $/GJ 8.4 6.3
Syngas production cost structure, %
CAPEX 43.5 35.3
OPEX 38.6 41.4
coal cost 17.9 23.3
Total 100.0 100.0

COAL GASIFICATION: AT THE CROSSROADS. ECONOMIC OUTLOOK 351
An oil giant, ExxonMobil, undertook to scale andcommercialize the technology with the support of theUS Department of Energy. However, after the devel-opment company was sold to the defense holdingGenCorp, Inc. (now Aerojet Rocketdyne Holdings,Inc.) in 2013, this development decayed and was soldto GTI (Gas Technology Institute, United States) in2015. In 2017, the PWR design under the brand R-Gasattained the stage of large-scale demonstration per-formed together by GTI and the Chinese partner,Yangquan Coal Industry Group, at the Shanxi CoalChemical Plant, China. The R-Gas gasifier isexpected to decrease the cost of produced syngas andchemical products on its basis by 15–30% [7].
PRODUCTION OF HYDROGEN FROM COAL
The gasification plants discussed in this paper maybe intended for the production of hydrogen as the finalproduct of coal conversion. This requires oxygen (orsteam-oxygen) blow, and the process scheme shouldinclude the steam reforming of CO to hydrogen.
This is a catalytic process usually run at a pressureof 2–3 MPa in two stages:
1. High-temperature stage (at 350–450°C) oniron-chromium catalysts;
2. Low-temperature stage (at approximately 200–250°C) on copper-containing catalysts.
The residual content of CO in the syngas can be0.2–0.6 vol %. The CO conversion reaction is exo-thermic. The reaction heat is quite high amounting to
41.1 kJ/mol (under normal conditions) or 184 MJ/m3
of CO (under normal conditions). This is approxi-mately 14.5% of the CO heating value. The conversionprocess requires quite a lot of steam comprising
0.8 kg/m3 of CO under the stoichiometric and nor-mal conditions. Steam can be generated from ther-mal resources of the plant itself. Gas at the CO con-verter outlet is heavily ballasted with CO2 (40–45%),
which must be removed to produce commercial-grade hydrogen.
The technologies of CO conversion to hydrogenand treatment of the produced hydrogen to removeCO2 have been well mastered in the industry. How-
ever, their application makes the plant’s process sys-tem much more intricate due to connection to it addi-tional reactor- and heat-exchange equipment operat-ing under high pressure with a corrosive medium. Theoperating expenses increase because of the use of addi-tional consumables (catalysts, sorbents, etc.) andenergy. All this increases the cost of the plant properand the cost of the final product, i.e., commercial-grade hydrogen.
The cost estimate for hydrogen production fromcoal has been prepared on the basis of the data inTable 1. The CO to H2 conversion efficiency is
+ = +2 2 2CO H O CO H .
THERMAL ENGINEERING Vol. 68 No. 5 2021
assumed to be 99%, and that of the CO2 capture effi-
ciency is 95%. The calculation results are presented inTable 2. The specific yield of commercial-grade
hydrogen is approximately 2.1–2.2 m3/kg of dry ash-free coal (under normal conditions). The content of H2
in the commercial-grade hydrogen is approximately94%. The efficiency of coal-to-commercial-gradehydrogen thermochemical conversion is estimated tobe 67.1% for the first option and 74.4% for the secondoption. Considering the power consumption for theoxygen production and other needs of the plant, theplant’s energy efficiency drops to 58.3% for the firstoption and to 67.2% for the second option. The calcu-lated total energy efficiency of the commercial-gradehydrogen production with account taken of the effi-ciency of power generation at an external coal-firedTPP (equal to 40%) will be, respectively, 45.2 and56.4% (if all the demands of the plant for steam arecovered due to recovery of the plant’s own heat).
High demand of hydrogen-from-coal productionunits for electricity and the presence of large amountsof waste heat and combustible gases in various ele-ments of the process circuit allow us to raise the issueof integrating them with power installations. The effi-ciency of such integration can be quite high.
The cost of hydrogen production from coal can beestimated on the basis of experimental data obtainedin China [8]. Approximately 130 coal gasificationplants for hydrogen production are in operation glob-ally, more than 80% of which are in China. Therefore,the Chinese data on the economics of commercialhydrogen production from coal can be considered themost reliable. Hydrogen produced from coal turns outto be the cheapest in China, where its price is approx-imately $9.2/GJ of H2 (Table 3). Hydrogen produced
by steam methane reforming (SMR) is 1.6 times moreexpensive with a price of approximately $15/GJ of H2.
This difference is largely due to the low cost of the coalmined in the country and a high price of imported nat-ural gas. And this is in spite of the fact that the capitalexpenditures for plants for producing hydrogen fromcoal (approximately $1400/kW H2) are approximately
two times greater than those for plants for producinghydrogen from natural gas ($500–900/kW H2) [8].
Under the conditions of Russia, there is good reasonto believe that the cost of hydrogen production fromcheap Siberian and Far Eastern coals, first of all browncoals, using low-priced Chinese gasifiers may be quitecomparable to the cost of hydrogen production fromcoal in China. Chinese gasifiers have to be used sinceRussian enterprises have not yet made equipmentrequired for this purpose.
In China, the hydrogen produced by water elec-trolysis using network power has the highest price($44/GJ H2). And this is in spite of fact that most
power in China is generated at coal-fired power plants.At the same time, hydrogen production using electric-ity from renewable power sources (RPS) turns out to

352
THERMAL ENGINEERING Vol. 68 No. 5 2021
FILIPPOV, KEIKO
Table 2. Efficiency of hydrogen production from Karakan coal
* Including power consumption for oxygen production and other needs of the plant itself. ** Using power generated at a coal-fired TPP with an efficiency of 40%
IndicatorGasifier
GSP COORVED
Coal gasification capacity, t/day 1800 1800
Oxygen demand, m3/kg of dry ash-free coal (at normal conditions) 0.542 0.434
Steam demand, kg/kg of dry ash-free coal 1.18 1.43
Commercial-grade hydrogen yield, m3/kg of dry ash-free coal (at normal conditions) 2.06 2.17
Commercial-grade hydrogen composition, vol %
H2 94.16 93.53
CO 0.71 0.52
CO2 3.90 3.23
CH4 0.00 1.72
N2 and other gases 1.23 1.00
Total 100.0 100.0
Commercial-grade hydrogen heating value, MJ/m3 (at normal conditions) 10.3 10.8
Power consumption rate for production of oxygen and other own needs of the plant, kW h/kg
of dry ash-free coal
0.75 0.60
Efficiency of coal thermochemical conversion to commercial-grade hydrogen, % 67.1 74.4
Plant energy efficiency*, % 58.5 67.5
Total energy efficiency of commercial-grade hydrogen production**, % 45.6 57.2
Commercial-grade hydrogen purity, % 94.1 93.5
СО2 emission, kg СО2/GJ Н2 164 137
Including:
hydrogen production 144 121
generation of purchased power 20 16
Table 3. Cost of hydrogen production by various method for the conditions of China (2018)
Indicator Coal Natural gasPower from
coal-fired TPP RES
Hydrogen production without CO2 capture
Hydrogen production cost, $/GJ H2 9.2 15.0 44.2 24.2
Hydrogen cost structure, %
CAPEX 46 17 17 35
OPEX 36 11 2 3
coal/natural gas/power 18 72 81 62
CO2 emission, kg/GJ H2 170 80 270 0
Hydrogen production with CO2 capture
Hydrogen production cost, $/GJ H2 12.5 19.2 56.7 –
Hydrogen cost structure, %
CAPEX 35 26 27 –
OPEX 51 17 10 –
coal/natural gas/power 14 57 63 –
CO2 emission, kg/GJ H2 17 8 27 –

COAL GASIFICATION: AT THE CROSSROADS. ECONOMIC OUTLOOK 353
Table 4. Hydrogen production costs using natural gas in different regions of the world, $/GJ H2 (2018) [8]
Indicator United States European Union Russia China Middle East
Hydrogen production without CO2 capture
Hydrogen production cost, $/GJ H2 8.3 14.2 9.2 15.0 7.5
Hydrogen cost structure, %
CAPEX 30 18 27 17 33
OPEX 20 12 18 11 22
natural gas 50 70 55 72 45
Hydrogen production with CO2 capture
Hydrogen production cost, $/GJ H2 12.5 18.3 13.3 19.2 11.7
Hydrogen cost structure, %
CAPEX 40 27 38 26 43
OPEX 27 18 25 17 28
natural gas 33 55 37 57 29
be nearly two times cheaper ($24/GJ H2) [8]. This
performance has been provided by cheap local equip-ment, its low-cost operation, and application of high-potential resources of solar and wind energy.
It should be noted that water electrolysis yieldshigh-purity (>99.5%) hydrogen. The purity of com-mercial-grade hydrogen from coal is much lower,approximately 90–95%. For many large hydrogenconsumers (direct reduction of iron, methanol synthe-sis, etc.), this is quire acceptable. High-temperatureoxygen-blown coal gasifiers can produce hydrogen upto 97% pure [9]. However, many applications requirehigher purity hydrogen (ammonia synthesis, many cat-alytic process in oil refining and petrochemical indus-tries, fuel cells on the basis of proton-exchange mem-branes, etc.). Hydrogen purification involves addi-tional expenditures increasing the hydrogen price. Thepurification expenditures depend on the requiredhydrogen purity and the purification technology.
The cost of hydrogen production from coal inChina is comparable with the hydrogen productioncost using natural gas in many countries of the world,including Russia (Table 4). The exception is the low-price gas countries, in particular, the Middle Easterncountries and the United States. In China, hydrogenproduced from coal is used basically for the synthesisof ammonia, a product which is in great demand onthe domestic market. China is the world’s largest con-sumer of nitrogen fertilizers, the demand for which isestimated at 46 million t per year. In China, ammoniafrom coal is competitive with ammonia from naturalgas and imported ammonia.
Hydrogen production from coal has considerableaccompanying CO2 emissions of approximately 170 kg
CO2/GJ H2, which is two times greater than the emis-
sion in hydrogen production using natural gas (see
THERMAL ENGINEERING Vol. 68 No. 5 2021
Table 3). However, this is 1.6 times less than the CO2
emissions in the production of hydrogen by water elec-trolysis using electricity generated at coal-fired powerplants.
According to [8], the provision of units for hydrogenproduction from natural gas with 90% CO2 capture sys-
tems increases CAPEX by 50%, fuel consumption by10%, and doubles OPEX. This is due to the specifics ofthe very technology of steam reforming of natural gas tohydrogen. It calls for the use of approximately one-thirdof consumed natural gas for heating of the conversionreactor. To do this, natural gas is burned in air at atmo-spheric pressure. Because of this, the CO2 concentra-
tion in flue gases is relatively low (less than 15%), whichsharply increases the cost of CO2 capture.
In unit for hydrogen production from coal, CO2 is
captured from the high-pressure gas mixture after theCO conversion reactor. It has a quite high CO2 content
of approximately 40–45%. Therefore, an increase inthe capital costs for CO2 capture is small amounting to
approximately 5%. The fuel cost rises by approxi-mately the same value. OPEX will increase consider-ably. Nevertheless, even with CO2 capture, the hydro-
gen from coal is cheaper in China than hydrogen fromnatural gas having costs $12.5 and 19.2/GJ H2, respec-
tively (see Table 3). Moreover, even under these con-ditions, the Chinese “coal” hydrogen is quite compet-itive with hydrogen from natural gas in most regions ofthe world (see Table 4). This means that Chinese highvalue-added chemical products made with high con-sumption of hydrogen will still be competitive in theworld even after the introduction of global limits onCO2 emissions.
The current hydrogen costs given in Tables 3 and 4agree quite well with the data from other sources. Inparticular, the monograph [10] contains the following

354 FILIPPOV, KEIKO
costs of hydrogen production by various methods (forthe conditions of 2018), $/GJ H2:
1. Coal gasification: 11.2 without CO2 capture and
13.6 with CO2 capture;
2. Steam reforming of natural gas: 17.3 without CO2
capture and 18.9 with CO2 capture;
3. Water electrolysis using electricity from nuclearpower plants (34.6), solar power plants (SPP) (48.2),wind power plants (WPP) (49.1).
The current hydrogen production cost is estimatedin report [11] as follows:
1. Coal gasification with CO2 capture: $15/GJ H2 at a
coal cost of $1.5/GJ and $16.7/GJ H2 at a coal cost of
$3.8/GJ;
2. Steam reforming of natural gas with CO2 capture:
$10.8/GJ H2 at a natural gas cost of $3.2/GJ and
$18.3/GJ H2 at a natural gas cost of $8.4/GJ.
The predicted costs of producing hydrogen fromcoal and natural gas will likely remain nearly the samefor a long time. The effect of engineering progress onthem will be compensated for by an increase in thecost of coal and natural gas.
The presented data confirm the conclusion alreadymade that hydrogen can be produced with competitiveeconomic indicators from cheap coal. Therefore, coalgasification technologies have certain prospects forlarge-scale application. This is promoted by the con-siderable and steadily growing demand for hydrogen.Between 1975 and 2018, the global hydrogen con-sumption increased by more than 4.6 times and nowcomprises 115 million t or 13.8 million TJ per year [8].At same time, around 70 million t of hydrogen is usedin “pure” form (mostly for oil refining and productionof ammonia) and a further 45 million t is used in amixture with various gases (for the production ofmethanol, direct reduction of metals, etc.).
Hydrogen is currently produced basically from nat-ural gas (76%) and coal (23%). Electrolysis technolo-gies account for slightly more than 1% of total hydro-gen production with less than 0.1% coming from waterelectrolysis, and the rest is created as a by-product ofalkali electrolysis in the production of chlorine andcaustic soda [8]. Hydrogen production consumesapproximately 6% of natural gas and 2% of coal pro-duced in the world. “Coal” hydrogen production isconcentrated mainly in China.
Progress in the development of fuel cells can con-siderably extend the scope of hydrogen application and,finally, give rise to the “hydrogen” power industry [12].First of all, this pertains to “portable” and “mobile”power sources where hydrogen can be used to supplypower to various low-power portable devices, self-con-tained robots, vehicles, etc. [13], competing with elec-tricity accumulators. However, sufficiently pure hydro-gen is needed to do this. Hydrogen from coal does not
comply with this condition. Hence, it should be addi-tionally treated primarily to remove CO.
According to the forecast in [14], by the year 2050,the global hydrogen consumption can increase six times,up to 696 million t per year (83.5 million TJ/year), if astrict climate scenario is carried out where global warm-ing is limited to 1.5°C (Table 5). In this case, hydrogencan meet up to 24% of the world’s final energy need. Anincrease in the demand for hydrogen is expected tooccur mainly due to its consumption for transportationand in the power industry. In the latter case, hydrogenis to be used to cover a peak demand that is essentialwith a large share of RESs in the structure of generatingcapacities. In this case, hydrogen will be produced bywater electrolysis using RES power with its service beingan intermediate energy storage. This scenario wouldrequire massive investment up to $11 trillion in produc-tion, storage, and transport infrastructure. The theoret-ical global hydrogen demand by 2050 is estimated to be1370 million t/year (164 million TJ/year) or 49% ofglobal final energy demand. This estimation assumesthe replacement of fossil fuels used for transportation,in industry, for power generation, and in housing andutility services where it is feasible from the processstandpoint.
According to [15], the global demand for purehydrogen is estimated to be approximately 280 million tby 2050 and 520 million t by 2070 vs. 75 million t in2019. The following hydrogen consumption structureis assumed, %:
It is assumed that approximately 40% of hydrogenwill be produced from fossil fuels with CO2 capture
and 60% will be by water electrolysis; 95% percent ofhydrogen will be delivered to consumers in a pure formvia dedicated hydrogen piping (comprising new pipe-lines and revamped gas networks). The remaining 5%of hydrogen will be supplied to consumers in a mixturewith natural gas and biomethane.
When assessing the prospects for producing hydro-gen from coal, account should be taken of the antici-pated considerable progress in hydrogen productiontechnologies using power from renewable energysources. This pertains to both electrolysers and solar-and wind-power plants. RESs-based hydrogen pro-duction has an important advantage: it can be per-
Road transport 30
Production of aviation kerosene together with СО2 20
Synthesis of ammonia followed by its use as a fuel in
sea transport 10
Chemical industry and metallurgy industries 15
Peak power generation 15
Building heating and hot water supply 5
Others 5
Total 100
THERMAL ENGINEERING Vol. 68 No. 5 2021

COAL GASIFICATION: AT THE CROSSROADS. ECONOMIC OUTLOOK 355
Table 5. Potential global demand for hydrogen by 2050, million t of H2/year [8, 14]
Indicator Current consumption Demand with strong climate policy Theoretical demand
Total: 115 696 1370Including:
industry 115 123 301
transport 0 301 524
power 0 219 439
buildings heating 0 53 106
Percentage in global final energy needs, % 3 24 49
formed with acceptable performance indicators rightat consumers. This is explained, firstly, by the avail-ability everywhere of solar and wind energy and, sec-ondly, by the economic efficiency of low-power elec-trolysers. As a result, the costs for creating a hydrogentransport infrastructure are reduced. On the otherhand, hydrogen from electrolysis is initially pure and,therefore, ready for use everywhere, including in typePEM (proton-exchange membrane) low-temperaturefuel cells.
According to the forecast in [16], the cost of RES-based water electrolysis hydrogen could drop from thecurrent $50/GJ to $17–25/GJ by 2030. Achieving thisgoal requires a reduction in the electrolyser capex bymore than half, down to $400/kW. This would requirea breakthrough in engineering improvement of elec-trolysers and the deployment of 70 GW of electrolysercapacity. Continued technological advancement inthe production of electrolysers and the creation ofSPPs and WPPs by the middle of the century maydecrease the cost of hydrogen from renewables to$8.3/GJ ($1.0/kg H2). This is comparable with the cur-
rent cost of hydrogen from coal or natural gas. At thesame time, it is noted in [16] that the technologies forhydrogen production from coal or natural gas do notoffer so many opportunities for technical improve-ment. The economic advantages of producing hydro-gen from natural fuels in comparison with water elec-trolysis are also revealed when considering the full lifecycle of the applicable technologies [17].
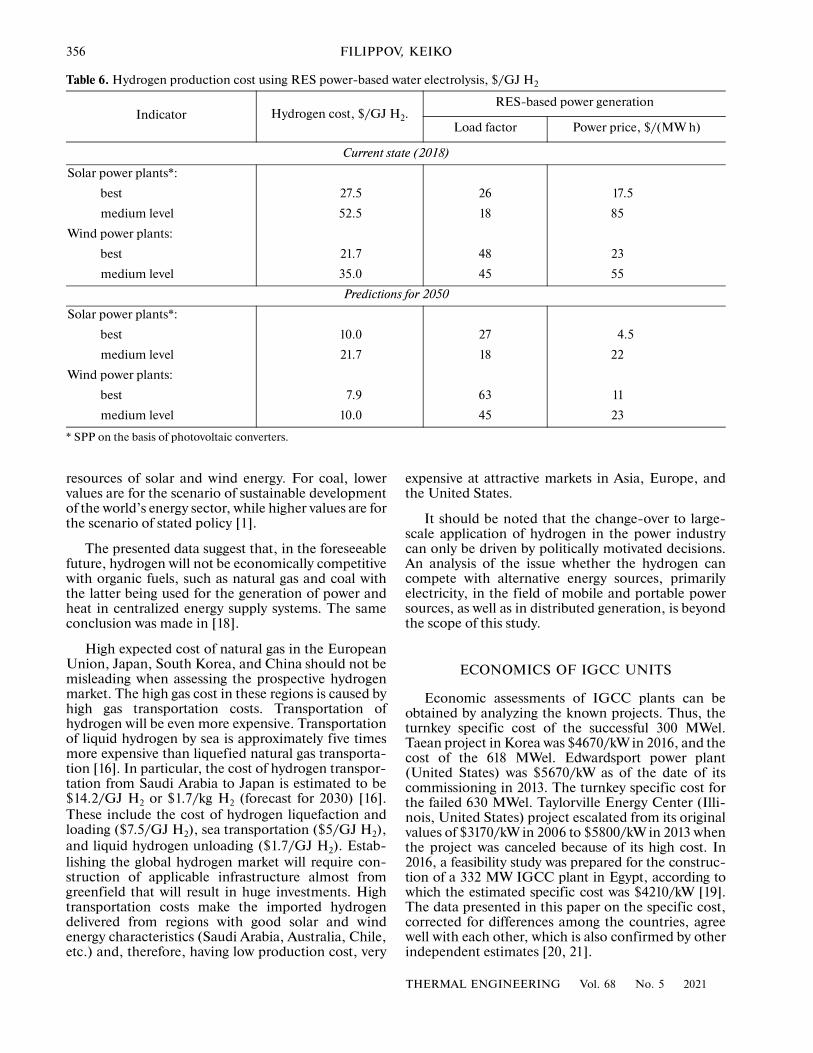
The forecast in [11] demonstrates that the cost ofrenewable electrolysis hydrogen will decrease byapproximately three times by 2050 with reference to2018: down to $10–22/ GJ H2 when using SPP power
or $8–10/GJ H2 when using WPP power (Table 6).
But this forecast is based on conditions that can hardlybe met, including
1. Fourfold decrease in the specific cost of electroly-sers (from $840/kW in 2018 to $200/kW by 2050);
2. Fourfold decrease in the SPP power cost;
3. Twofold decrease in the WPP power cost.
Lower hydrogen costs are for the best SPPs andWPPs generating electricity using high-potential
THERMAL ENGINEERING Vol. 68 No. 5 2021
resources of solar and wind energy. This will yield thefollowing by 2050:
1. High load factor (LF) of 27% for SPPs and 63%for WPPs;
2. Low cost of generated electricity amounting to$4.5/(MW h) for SPPs and $11/(MW h) for WPPs.
It should be noted that the average load factor inRussia in 2019, according to Rosstat, was 13.5% forSPPs and 17.8% for WPP, i.e., it was several times less.
Thus, a certain consensus on the predicted costestimates of hydrogen production has been achieved.It is advisable to compare these estimates with the pre-dicted cost of natural gas and coal [1]. The predictedcost estimates of hydrogen production and conven-tional fuels by 2040, $/GJ, are presented below:
The lower costs of local hydrogen production arefor the production of hydrogen from cheap coal andnatural gas as well as for the use of high-quality
Local hydrogen production using the following:
coal 12.5–20.0
natural gas 12.0–19.0
power from SPPs 12.0–25.0
power from WPPs 10.0–22.0
Hydrogen import (data for destination port and 2030
[16]) from
Chile to the United States 23.0
Saudi Arabia to Germany 28.0
Saudi Arabia to Japan 31.0
Australia to Japan 28.0
Natural gas price in
the United States 3.2–4.2
the European Union 7.1–8.4
Japan 8.2–9.7
China 8.2–9.3
Coal price in
the United States 2.1–2.3
the European Union 2.5–3.3
Japan 2.8–3.7
356 FILIPPOV, KEIKO
Table 6. Hydrogen production cost using RES power-based water electrolysis, $/GJ H2
* SPP on the basis of photovoltaic converters.
Indicator Hydrogen cost, $/GJ H2.RES-based power generation
Load factor Power price, $/(MW h)
Current state (2018)
Solar power plants*:
best 27.5 26 17.5
medium level 52.5 18 85
Wind power plants:
best 21.7 48 23
medium level 35.0 45 55
Predictions for 2050
Solar power plants*:
best 10.0 27 4.5
medium level 21.7 18 22
Wind power plants:
best 7.9 63 11
medium level 10.0 45 23
resources of solar and wind energy. For coal, lowervalues are for the scenario of sustainable developmentof the world’s energy sector, while higher values are forthe scenario of stated policy [1].
The presented data suggest that, in the foreseeablefuture, hydrogen will not be economically competitivewith organic fuels, such as natural gas and coal withthe latter being used for the generation of power andheat in centralized energy supply systems. The sameconclusion was made in [18].
High expected cost of natural gas in the EuropeanUnion, Japan, South Korea, and China should not bemisleading when assessing the prospective hydrogenmarket. The high gas cost in these regions is caused byhigh gas transportation costs. Transportation ofhydrogen will be even more expensive. Transportationof liquid hydrogen by sea is approximately five timesmore expensive than liquefied natural gas transporta-tion [16]. In particular, the cost of hydrogen transpor-tation from Saudi Arabia to Japan is estimated to be$14.2/GJ H2 or $1.7/kg H2 (forecast for 2030) [16].
These include the cost of hydrogen liquefaction andloading ($7.5/GJ H2), sea transportation ($5/GJ H2),
and liquid hydrogen unloading ($1.7/GJ H2). Estab-
lishing the global hydrogen market will require con-struction of applicable infrastructure almost fromgreenfield that will result in huge investments. Hightransportation costs make the imported hydrogendelivered from regions with good solar and windenergy characteristics (Saudi Arabia, Australia, Chile,etc.) and, therefore, having low production cost, very
expensive at attractive markets in Asia, Europe, andthe United States.
It should be noted that the change-over to large-scale application of hydrogen in the power industrycan only be driven by politically motivated decisions.An analysis of the issue whether the hydrogen cancompete with alternative energy sources, primarilyelectricity, in the field of mobile and portable powersources, as well as in distributed generation, is beyondthe scope of this study.
ECONOMICS OF IGCC UNITS
Economic assessments of IGCC plants can beobtained by analyzing the known projects. Thus, theturnkey specific cost of the successful 300 MWel.Taean project in Korea was $4670/kW in 2016, and thecost of the 618 MWel. Edwardsport power plant(United States) was $5670/kW as of the date of itscommissioning in 2013. The turnkey specific cost forthe failed 630 MWel. Taylorville Energy Center (Illi-nois, United States) project escalated from its originalvalues of $3170/kW in 2006 to $5800/kW in 2013 whenthe project was canceled because of its high cost. In2016, a feasibility study was prepared for the construc-tion of a 332 MW IGCC plant in Egypt, according towhich the estimated specific cost was $4210/kW [19].The data presented in this paper on the specific cost,corrected for differences among the countries, agreewell with each other, which is also confirmed by otherindependent estimates [20, 21].
THERMAL ENGINEERING Vol. 68 No. 5 2021

COAL GASIFICATION: AT THE CROSSROADS. ECONOMIC OUTLOOK 357
The structure of capital expenditures for an IGCCplant depends heavily on the employed gasificationtechnology. Thus, for the Puertollano plant it is as fol-lows, % [22]:
For an IGCC plant on the basis of the Shell gas-ifier, it is somewhat different, % [21]:
According to the above-presented figures, the coalgasification package accounts for approximately onefourth of the total capital cost for an IGCC plant.
The above-presented data on IGCC plant can becompared with average capital investments in compet-ing units estimated by the US EIA in 2019 [23].
Based on the data from [24, 25], Table 7 was pre-pared where performance indicators of the IGCCplant and competing technologies are presented. TheIGCC plant is based on a ConocoPhillips (E-Gas®)gasifier, which is a two-stage gasifier with liquid slagremoval where coal-water slurry is gasified at hightemperatures (1370°С; 3.7 MPa) in an oxygen flow(95% purity). The IGCC plant produces 690 MW ofgross power and 600 MW of rated (net) power. Theauxiliary power consumption is 90 MW (15%). TheIGCC plant includes an F-class gas turbine modifiedfor operation on syngas. A coal-fired steam-turbineunit (STU) for 600/600°С/26.2 MPa steam conditionsis equipped with low-emission burners and a flue gastreatment system to remove sulfur and nitrogen oxides.Table 7 presents two gas-fired CCU with F-class andH-class gas turbines, respectively. The first CCU with anet output of 702 MWel consists of two F-class gas tur-
Air separation unit 12
Gasifier with auxiliary equipment 26
Syngas cleaning and conditioning 8
Combined-cycle unit 54
Fuel facilities and fuel treatment station 7
Air separation unit 14
Gasifier with auxiliary equipment 22
Syngas cleaning and conditioning 18
Water treatment and waste treatment 3
Combined-cycle unit 16
Electrical equipment 6
Automatic control system 2
Construction 12
A coal-fired ultra-supercritical STU, $/kW:
without СО2 capture 3661
with 90% СО2 capture 5851
gas-fired combined-cycle unit with 90% СО2
capture
2470
THERMAL ENGINEERING Vol. 68 No. 5 2021
bines with an output of 242 MW each and one 246 MWsteam turbine. Hence, the installed capacity of thisCCU is 730 MW with an auxiliary power consumptionof 28 MW (3.84%). The second CCU has an output of429 MW and is a monoblock installation consisting ofone steam turbine and one gas turbine. Both CCUs areprovided with low-emission combustors. Table 7 alsoincludes two simple-cycle GTUs used to cover peakloads. One medium power (100 MW) GTU is based onan E-class gas turbine, and one large (237 MW) GTUuses an F-class gas turbine.
The levelized cost of electricity has been calculatedunder the following conditions: the discount rate is5%, the cost of borrowed capital at the constructionstage is 5%, the cost of coal is $1.8/GJ, and the cost ofnatural gas is $3/GJ. In the structure of capital expen-ditures, a percentage of other expenditures, includingthose for connecting the project to external utilities,amounts to approximately 16.7% for all consideredunits. Economic estimates are given in 2016 prices.
It follows from Table 7 that, with the accepted con-ditions, the IGCC plant will not be competitive withalternative engineering solutions in terms of the level-ized cost of electricity. The cost of electricity deliveredby the IGCC plant turns out to be higher than thepower from a coal-fired steam turbine unit by a factorof 1.3, from a natural-gas fired CCU by a factor of 2.9,and from a simple cycle GTU by a factor of 1.6–3.0.The main cause of such a high price is great capitalexpenditures for the IGCC plant. The percentage ofinvestment component in the levelized cost of elec-tricity from an IGCC plant is 66%, while that for gas-fired CCUs is approximately 38–43%.
The presented conclusions are confirmed by otherstudies, for example [26, 27] as well as by the results ofoperation of existing IGCC plants. Thus, the opera-tion of the IGCC plant at the Edwardsport powerplant turned out to be unprofitable by 2018. It had anextremely poor 40% capacity factor during its first55 months of operations, far below the 79% capacityfactor projected, and the all-in cost of power from theplant averaged $145/(MW h) [28]. Our estimationsdemonstrate that, even with the projected capacityfactor, this plant would generate electricity at a cost ofapproximately $102/(MWh) that is greater than thecost of power from a coal-fired STU or a gas-firedCCU by a factor of 1.3 or 2.7, respectively. The costof electricity generation by these installations is esti-mated in [15] as $76.4 and $38.1/(MW h), respectively.
Coal gasification at the Great Plains GasificationPlant in the United States turned out to be unprofit-able [29]. Failing economics caused the Australianauthorities to stall the ambitious Arckaringa coal gas-ification project, which included a liquid product unitand an IGCC plant [30]. In addition, projects for theconstruction of new coal-fired steam-turbine unitswere also rejected. This resulted from the absence oftheir demand in windy periods (when electricity is

358 FILIPPOV, KEIKO
Table 7. Performance indicators of an IGCC plant and competing technologies
IndicatorIGCC
plantSTU
CCU GTU
F-class H-class E-class F-class
Fuel type Coal Coal Gas Gas Gas Gas
Net electrical output, MW 600 650 702 429 100 237
Net efficiency (based on LHV), % 40.7 40.2 56.9 59.6 37.5 38.3
Capital investment per unit power output, $/kW 4400 3636 978 1104 1101 678
Capital expenditures structure, %
construction, materials, delivery 4.3 10.5 7.2 5.4 6.0 8.5
mechanical equipment, delivery, installation 45.9 42.0 47.2 45.3 45.7 44.4
electrical equipment, delivery, installation 9.4 6.0 6.4 6.4 11.0 11.1
design, construction management, commis-
sioning
14.8 16.5 14.4 18.3 13.0 11.7
fees, profits, incidental expenses 8.9 8.3 8.1 7.9 7.6 7.6
other expenses including connection to exter-
nal grids
16.7 16.7 16.7 16.7 16.7 16.7
Total 100.0 100.0 100.0 100.0 100.0 100.0
Operating expenditures:
fixed, $/(kw year) 62.25 42.1 11.0 10.0 17.5 6.8
variable, $/(mw h) 7.22 4.6 3.5 2.0 3.5 10.7
Capacity utilization time, h/year 5000 5000 5000 5000 3000 3000
Duration, years
construction 5 5 4 4 2 2
operation 30 30 30 30 20 20
Levelized cost of electricity, $/(MW h) 115.2 88.4 39.8 39.1 70.9 61.5
Levelized electricity cost structure, %
investment component 66.5 66.1 37.5 43.1 45.9 32.5
fixed OPEX 12.5 10.1 5.7 5.3 8.4 3.9
variable OPEX 7.2 5.6 9.1 5.3 5.1 17.8
Fuel component 13.8 18.2 47.7 46.3 40.6 45.8
Total 100.0 100.0 100.0 100.0 100.0 100.0
generated mainly at wind power plants) and the highcost of generated electricity in still-air periods (due tothe low average annual load of the plant and a greatinvestment component in the cost of electricity).
The fate of the 582 MWel IGCC plant at the Kem-per power facility, Mississippi, United States, wasunfortunate. In 2017, the gasification unit with a Kel-log Brown & Root (KBR) TRIG gasifier was testedand decommissioned prior to being put into operationwhen it was clarified that it would have to be upgraded.The Kemper power facility was converted to naturalgas. The IGCC plants were converted to natural gasbefore their commissioning in the Caledonia CleanEnergy and Don Valley projects, Cash Creek IGCCproject in the United States, and Good Spring Plantproject in Canada. The financial insolvency causedthe closure of the Sulcis project in Italy and another sixprojects in other countries. Sixteen projects with
IGCC plants were terminated at the design stage. Howmany more projects were rejected at the feasibility studyis still unknown. Information about them is rarelydivulged. The main causes for the termination of IGCCplant projects were their low economic efficiency ofcoal gasification, uncertainty in the climate policy, andinsufficient government support.
A SWOT-analysis of IGCC plants (Table 8)demonstrate that these plants have considerableadvantages and great potential for their large-scaleapplication. However, their introduction will be hin-dered by high risks associated with the new global cli-mate policy aimed at a drastic decrease in CO2 emis-
sions and the replacement of fossil fuels in the globalfuel and energy balance by renewable energy sources.Poorer state support for the development of new coaltechnologies and for coal chemistry science plays anegative role.
THERMAL ENGINEERING Vol. 68 No. 5 2021

COAL GASIFICATION: AT THE CROSSROADS. ECONOMIC OUTLOOK 359
Table 8. SWOT-analysis of the IGCC technology
Strengths Weaknesses
Huge coal resources on the planet
Low price of coal
Coal availability and good storage ability
Technical maturity of all components of the technology
Low sulfur and nitrogen oxides emission
High degree of CO2 recovery
Cheaper CO2 capture
Intricate process scheme
Low availability
Poor maneuverability
Additional energy losses at gasification stage
High CAPEX
High price of generated power
Opportunities Threats
Diversification of electricity generation by fuel types with
improvement of the energy security of the country and regions
Integration with production of chemical product and creation of
polygeneration facilities
Decreasing the production cost by combining production facili-
ties
Extension of fields with economically efficient use of coal
Support for the development of coal industry and preservation
of jobs
Uncertainty of the current climate policy
Introduction of strict limits on CO2 emissions
Establishment of high charges for CO2 emissions
Poor economic competitiveness with alternative technologies
State energy policy to extend application of renewable energy
sources
Poorer state support for the development of new coal technolo-
gies and for coal chemistry science
Adaptation of IGCC plants to the new conditionsof power industry development requires their furtherimprovement, including developing new thermody-namic cycles and process schemes. In particular,compressorless CCUs offering effective CO2 capture
directly in the unit cycle [31, 32] can be noted. Workson new cycles and schemes do not usually attractcommercial interest and, therefore, require govern-ment support.
CONCLUSIONS
(1) The conversion of coal to syngas and hydrogento be used for generation of electric and thermalenergy will not be economically attractive for the con-ditions of Russia in the foreseeable future. The cost ofthe produced syngas turns out to be 2–3 times higherthan the price of natural gas for consumers.
(2) IGCC plants also cannot compete with coal-fired power plants. The power generated by the IGCCplant is 1.3 or 2.9 times more expensive than the powerdelivered by a coal-fired STU or a natural gas-firedCCU, respectively. The main cause of such a high costis great capital expenditures for the IGCC plant. Thepercentage of the investment component in the cost ofpower delivered by an IGCC plant exceeds 66% vs.38–43% for a natural gas-fired CCU.
(3) The production of syngas from cheap Siberianand Far Eastern coals for further production of hydro-gen and some other chemical products on its basis maybe economically attractive. In this case, it is importantto reduce the demand of gasification technology for
THERMAL ENGINEERING Vol. 68 No. 5 2021
oxygen and the consumption of electricity for its pro-duction.
(4) The target of the development of coal chemicaltechnologies is to reduce the unit CAPEX and OPEX.This requires continuing the improvement of coal gas-ification technologies and associated processes. Indoing so, special attention should be given to thedevelopment of new oxygen-production technologies.
(5) For the largest coal producer, which is Russia,it will be expedient to enhance state support for thedevelopment of new coal technologies and coal chem-istry science. It is not improbable that a demand fornew coal technologies will arise in the future, andRussian science should be ready to propose them, andthe industry should be able to apply them.
REFERENCES
1. World Energy Outlook 2019 (International EnergyAgency, Vienna, 2019).
2. S. P. Filippov and A. V. Keiko, “Coal gasification: Atthe Crossroads. Technological factors,” Therm. Eng.68 (3), 209–220 (2021).
3. Assessment of Technical and Economic Potential of DeepProcessing of Coal of “Karakanskii-Zapadnyi” OpenCast Mining Site (Technische Univ. BergakademieFreiberg, Inst. für Energieverfahrenstechnik und Che-mieingenieurwesen, Freiberg, Germany, 2017) [in Rus-sian]. http://www.karakan-invest.ru/investor/perspec-tive/Otchet-FGA.pdf. Accessed March 21, 2020.
4. Characteristics of Coal Mined at Karakanskii-Zapad-nyi Open-Pit. http://www.karakan-invest.ru/en/buyer/features/. Accessed March 30, 2020.

360 FILIPPOV, KEIKO
5. “Karakan’s unique coal,” Nedra TEK Sib., No. 2, 10–12 (2017).
6. S. Fusselman, “Compact gasification development andtest status,” in Proc. Gasification Technologies CouncilAnnual Conf., San Francisco, Cal., Oct. 9–18, 2011(Gasification Technologies Council, 2011).
7. A. Duckett, “GTI will demo R-GAS gasification inChina,” Chem. Eng., June 27 (2017). https://www.thechemicalengineer.com/news/gti-will-demo-r-gas-gasification-in-china-1/. Accessed February 20, 2020.
8. The Future of Hydrogen. Seizing Today’s Opportunities(International Energy Agency, Vienna, 2019).
9. M. El-Shafie, S. Kambara, and Y. Hayakawa, “Hydro-gen production technologies overview,” J. Power Ener-gy Eng. 7 (1), 107–154 (2019). https://doi.org/10.4236/jpee.2019.71007
10. M. Kayfeci, A. Kecebas, and M. Bayat, “Hydrogen pro-duction,” in Solar Hydrogen Production: Processes, Sys-tems, and Technologies, Ed. by F. Calise, M. D. D’Acca-dia, M. Santarelli, A. Lanzini, and D. Ferrero (Elsevier,London, 2019), pp. 45–83.
11. Hydrogen: A Renewable Energy Perspective (Interna-tional Renewable Energy Agency, Abu Dhabi, 2019).
12. O. S. Popel’, A. B. Tarasenko, and S. P. Filippov, “Fuelcell based power-generating installations: State of theart and future prospects,” Therm. Eng. 65, 859–874(2018). https://doi.org/10.1134/S0040601518120078
13. S. Filippov, “New technological revolution and energyrequirements,” Foresight STI Governance 12 (4), 20–33 (2018). https://doi.org/10.17323/2500-2597.2018.4.20.33
14. Hydrogen Economy Outlook: Key messages (BloombergNEF, 2020). https://data.bloomberglp.com/professional/sites/24/BNEF-Hydrogen-Economy-Outlook-Key-Mes-sages-30-Mar-2020.pdf. Accessed July 14, 2020.
15. Energy Technology Perspectives (International EnergyAgency, 2020).
16. Path to Hydrogen Competitiveness: A Cost Perspective (Hy-drogen Council, 2020). https://hydrogencouncil.com/wp-content/uploads/2020/01/Path-to-Hydrogen-Com-petitiveness_Full-Study-1.pdf. Accessed August 15, 2020.
17. M. Khzouz, E. I. Gkanas, J. Shao, F. Sher, D. Beh-erskyi, A. El-Kharouf, and M. Al Qubeissi, “Life cyclecosting analysis: Tools and applications for determininghydrogen production cost for fuel cell vehicle technol-ogy,” Energies 15, 3783 (2020). https://doi.org/10.3390/en13153783
18. J. Eichman, A. Townsend, and M. Melaina, EconomicAssessment of Hydrogen Technologies Participating inCalifornia Electricity Markets, Technical ReportNREL/TP5400-65856 (National Renewable EnergyLaboratory, 2016).
19. D. A. Ali, M. A. Gadalla, O. Y. Abdelaziz, andF. H. Ashour, “Modelling of coal-biomass blends gas-ification and power plant revamp alternatives in Egypt’snatural gas sector,” Chem. Eng. Trans. 52, 49–54(2016). https://doi.org/10.3303/CET1652009
20. Engineering-Economic Evaluations of Advanced FossilFuel Power Plants, EPRI Report No. 3002016284(Electric Power Research Inst., 2019).
21. Cost and Performance Baseline for Fossil Energy PlantsVolume 1B: Bituminous Coal (IGCC) to Electricity,NETL Report No. DOE/NETL-2015/1727 (NationalEnergy Technology Laboratory, 2015).
22. G. Aranda, A. Van der Drift, and R. Smit, The Economyof Large Scale Biomass to Substitute Natural Gas (bioSNG)Plants, ECN Report No. ECN-E-14-008 (ECN, 2014).
23. Capital Cost Study. Capital Cost and Performance Char-acteristic Estimates for Utility Scale Electric Power Gen-erating Technologies, Report of Sargent & Lundy to USEIA, Rev. 1 (U.S. Department of Energy, Washington,DC, 2020).
24. Updated Capital Cost Estimates for Utility Scale Electric-ity Generating Plants (U.S. Energy Information Admin-istration, 2013).
25. Updated Capital Cost Estimates for Utility Scale Electric-ity Generating Plants (U.S. Energy Information Admin-istration, 2016).
26. Levelized Cost and Levelized Avoided Cost of New Gener-ation Resources in the Annual Energy Outlook 2020 (U.S.Energy Information Administration, 2020).
27. H.-T. Oh, W.-S. Lee, Y. Ju, and Ch.-H. Lee, “Perfor-mance evaluation and carbon assessment of IGCCpower plant with coal quality,” Energy 188, 116063(2019). https://doi.org/10.1016/j.energy.2019.116063
28. “Duke hit hard by exorbitant O&M costs at Edward-sport IGCC facility,” Power, Sept. 27 (2018).
29. S. J. McKenzie, “Electric, basin electric at odds overrates, synfuels plant,” Minot Daily News, Feb. 4 (2020).
30. “Coal on the way out of South Australia,” New Daily,June 11 (2015).
31. A. S. Kosoi, Yu. A. Zeigarnik, O. S. Popel, M. V. Sink-evich, S. P. Filippov, and V. Ya. Shterenberg, “Theconceptual process arrangement of a steam–gas powerplant with fully capturing carbon dioxide from combus-tion products,” Therm. Eng. 65, 597–605 (2018). https://doi.org/10.1134/S0040601518090045
32. O. N. Favorskii, V. M. Batenin, and S. P. Filippov,“Energy development: Choice and implementation ofstrategic decisions,” Herald Russ. Acad. Sci. 90, 283–290 (2020). https://doi.org/10.1134/S1019331620030016
Translated by T. Krasnoshchekova
THERMAL ENGINEERING Vol. 68 No. 5 2021