coal solubilization by non-catalytic …web.anl.gov/pcs/acsfuel/preprint...
TRANSCRIPT
1
\
\
1
COAL SOLUBILIZATION BY NON-CATALYTIC TRANSFER HYDROGENATION WITH FORMATE
Soon Chuan Lim and Edwin N. Givens University of Kentucky, Center for Applied Energy Research
3572 Iron Works Pike, Lexington, KY 40511-8433
Keywords: Liquefaction, hydrothermal treatment, carbon monoxide, formate, water
Abstract Non-Catalytic transfer hydrogenation using formate as the hydrogenating agent sipnificantly
reduces the severity necessary for solubilizing coal. Moisture and mineral matter free solubilization of coal up to 94% in pyridine was observed for a Wyodak coal that was treated at 340 "C for 1 hr with CO and aqueous NaOH. Loss of oxygen from coal as CO, agrees with a forced balance based upon elemental and mass recoveries. A hydrogen consumption of 0.6 wt %, calculated from thk balance, agrees with hydrogen consumptions independently determined based upon CO conversion. The hydrogen to carbon ratio in the total water-insoluble product increased to 0.88 versus a corresponding value of 0.80 in the starting coal. The pyridine soluble and insoluble fractions had WC values of 0.97 and 0.59, respectively. Reaction in the absence of added salt produced a water-insoluble product that was 50% soluble in pyridine and had a WC value of 0.79.
Introduction CO-promoted hydrothermal treatment of low-rank coals has been found by several groups to be
quite effective for converting these coals to soluble products.' A group at Emon reported that hydrothermal treatment of a Wyoming subbituminous coal in the presence of CO at 345 OC for 6 hours produced a material that was largely soluble in THF and was more soluble than material produced by hydrothermal treatment in the absence of CO? Treating the coal under the same conditions in decalin failed to increase the solubility relative to that of the raw coal. Hydrothermal treatment substantially depolymerized the coal making it more reactive for producing distillate product in a hydrogen donor solvent?2 The hydrothermal product was enriched in hydrogen and had reduced oxygen content. The CO-aqueous system presumably promotes decarboxylation of oxygen-containing constituents and cleavage of ether and ester groups attached to aromatic ring systems. Under these reaction conditions, a Martin Lake, Texas lignite heated in "CO/D,O was shown to produce formate ion with most of the deuterium in the reacted DzO being transferred into the coal! The recovered CO, contained 60% lzCO, from the coal, presumably formed via decarboxylation, and 40% '3C0, from via the water- gas-shift reaction. Adding alkali metal salts to the CO/H,O mixture presumably increases the concentration of formate ion further enhancing the solubility of the product? In the work reported here, the reactivity of a Wyodak coal under hydrothermal conditions in the presence of CO and sodium hydroxide is discussed.
Experimental Wyodak coal from the Black Thunder mine in Wright, Wyoming, was ground to -200 mesh,
riffled and stored in tightly sealed containers. Ultimate analysis: carbon, 73.9%; hydrogen, 5.2% nitrogen, 1.3%; sulfur, 0.6%; oxygen, 19.0% (by difference). Ash content (dry basis) was 6.12 wt%. AU results are expressed as weight percent moisture and ash-free coal (maf).
In the experiments conducted in a 300 ml stirred autoclave, 50 g of as-received coal containing approximately 20% moisture were mixed with 4.2 g NaOH in 75 ml. of distilled and de-ionized water. The reactor was sealed, leak tested and pressurized with CO to 1000 psig. In experiments in the ahen= of base, only 40 ml of water was added. Heat-up time from ambient :o reaction time at 340 "Cwas approximately 3.5 hr. The reaction was allowed to proceed at this temperature for an additional hour. The reactor was cooled to ambient temperature within 1.5 hr. A gas sample was collected and analyzed by gas chromatography and the solid products were removed from the reactor, washed with distilled and de-ionized water and dried at 40 "C under vacuum. Soluble humic acids were recovered from the aqueous phase by precipitating the colloidal material with HCI (pH 1-2) followed by centrifugation and drying. The acidified aqueous layer was further extracted with ether. Product distniution and recovery of water-insoluble product, humic acids and ether solubles, on a maf basis, are shown in Table 1. A 5 g sample of the water-insoluble product was extracted with THF in a Soxhlet thimble for 18 hours. The Soxhlet extraction technique was exceptionally slow since colored material continued to exude from the thimble after a week of continuous extraction. A smaller sample (0.5 g) of product was placed in 200 mL of pyridine or THF and extracted using a sonication/vacuum filtration
695
technique at ambient temperature. Samples ultrasonicated in either solvent for 10 mh filtered rapidly within minutes under vacuum at ambient temperature. Material was collected after solvents were removed, dried overnight at 80 OC at 16 Wa and weighed to determine solubility in the solvent. A I
reliable pyridine solubilityvalue could not be obtained for the water-insoluble product from treating coal , in the absence of NaOH. Material that was ultrasonicated in pyridine clogged the filter paper within minutes. The same material also clogged the Soxhlet thimble filters which resulted in less material dissolving in pyridine than in THF (see Table 2). This underscores the different properties of the material generated when salt was present during the reaction. I1
Discussion The water-gas-shift reaction in the presence of NaOH is quite sensitive to temperatures between
250 and 340 "C with CO conversion increasing from ~ 1 0 % up to approximately 90%, respectively. At 300 "C in the presence of -0.3 M NaOH, the conditions under which many of the earlier runs were made, the shift reaction goes to the extent of about 20-25%. In the absence of NaOH, the CO conversion at 340 O C is only -40%. At 300 "C, very little H, is actually recovered, most of it being incorporated into the water-insoluble product. At 340 O C , about half of the H, that is formed is recovered. In every case, the amount of hydrocarbon gases formed in the reaction was quite small.
'
' The amount of humic acids and ether-extracted material (fulvic acids) in the aqueous phase was '
small, being 1.3% in the presence of NaOH. The highest yields of these products (-7%) were observed at 300 "C, either at low CO pressures or in the absence of CO. Solubility of the water-insoluble material indicates the degree to which reaction occurred. Previously, solubilities in THF and pyridine ' were determined using a Soxhlet apparatus. The materials generated at 340 "C could not be evaluated , in this manner since the extraction thimbles readily blinded. It was found that solubilities of the NaOH treated materials in these two solvents could be determined at ambient temperature using a sonication technique in which the extracted THF and pyridine solutions filtered quite readily without blinding the filter paper. Higher pyridine and THF solubilities were obtained using the ultrasonication technique compared to SoxNet extraction. For the reactions run with NaOH, pyridine and THF solubilities reached 94 and 78 wt 70 (maf product basis), respectively. The ultrasonication technique could not be ! used on the product produced in the absence of added NaOH since it readily blinded the filter paper when filtered. /
, Chemical compositions of water-insoluble product and the solvent-separated fractions from the NaOH treated coal are shown in Table 3. For the 82.3 wt % of water-insoluble product plus humic acids, the 8% ash content was too high relative to the 5.5% concentration in the starting coal. In the absence of NaOH the ash content was closer to the expected value. In both cases, there was a decrease in the oxygen content from 17.9% in the starting coal to 4.7% in the water-insoluble product for the NaOH-treated coal and 5.2% for the NaOH-free case. Approximately 75% of the oxygen was removed in both cases. The hydrogen-carbon ratio for the NaOH-treated coal increased to 0.88 versus a value of 0.80 for the starting coal. By contrast, the WC ratio of the product generated in the absence of base is essentially the same as that of the starting coal, indicating a loss of hydrogen in the reaction. The hydrogen concentration in the pyridine soluble fraction (0.97 WC) is higher than in the starting coal (0.80 WC), whereas the concentration in the insoluble fraction is much less (0.59 WC). Oxygen concentration is much higher in the insoluble fraction. Note that the oxygen values for the solvent separated fractions are higher than observed in the water-insoluble product. This suggests a possible reactivity upon exposure to air since no special precautions were followed in handling these samples. The concentrations of nitrogen and sulfur in the solvent separated products are similar to the total water-insoluble product suggesting enrichment of nitrogen in the pyridine insoluble product.
Mass and elemental balances were calculated for the 300 mL autoclave experiments. The balance for the experiment run in the presence of NaOH, as shown in Table 4, was calculated by correcting the ash concentration in the water-insoluble product, which includes the humic acids and ether-soluble product, to a level consistent with the ash in the starting coal and adjusting the remaining elements to account for this correction. Since the gas analysis showed that hydrocarbon gases were quite small (see Table 1) the other products are water, CO and CO,. Because very large concentrations of CO are present as a reactant and much of the CO, is formed as a result of the water-gas-shift reaction, the amount of these carbon oxides that are formed from carbon in the coal cannot be measured directly. The ratio of the additional oxygen and carbon needed to force the balance of these two elements in the product is greater than the 2 to 1 ratio in 0,. Therefore, in the product, of the 78% of the oxygen in the starting coal that was absent from the water-insoluble product, most was present as CO, (60% of the original oxygen) with the remaining 18% of the original oxygen being present as
696
water. Formation of CO, is consistent with the results of Horvath and Siskin? The hydrogen necessary to form the water was 0.42 wt % of ash-free coal, while the total hydrogen consumed in the reaction was -0.6 wt % of the coal. Using these assumptions, all of the starting material is accounted for in the products.
The elemental balance for the experiment made in the absence of NaOH (see Table 5) showed that more carbon and less hydrogen was recovered in the water-insoluble product than for the NaOH treated coal. In fact, the amount of hydrogen was less than in the starting coal. Forcing a carbon balance indicated that less oxygen could be removed as CO, and the amount of water necessary to balance the oxygen was much higher. Of the 75% of oxygen removed from the coal, 23% was removed as CO, and 52% as water. The net H, consumption of 1.0 wt % hydrogen, which would have been formed via the water-gas-shift reaction, accounted for 85% of the hydrogen incorporated into the water. The remaining hydrogen came from the coal accounting for the decrease in hydrogen in the water- insoluble product.
used by Ringen and co-workers! The heatingvalue of the treated coals were calculated using the equation developed by Boie and '
H,(caI/g) = 84OOC + 27765H + 15OON - 2500s - 26500
where H is the gross heating value and C, H, N, S and 0 are the normalized weight fractions of these elementssin the sample. Multiplication by the factor 1.8 converts the results to units of Btuflb.
with NaOH without NaOH Coal
Heating Value, Btuflb 16,400 16,000 12,900 maf
The heating values for both CO-treated coals were significantly higher than the starting coal.
Summary Reacting Wyodak coal with CO and H,O at 340 "C, both in the presence and absence of base,
produced materials having reduced oxygen contents. Oxygen removals in excess of 75% were obtained regardless of whether base was present. Addition of base gave a material which was highly soluble in both pyridine (95%) and THF (78%), whereas the solubility of the material produced in the absence of base was less. Water-insoluble materials produced in both cases had significantly higher heating values than the starting coal. Forced elemental balances based upon the absence of any significant hydrocarbons in the gaseous product provides insight into the probable reaction pathways for removal of oxygen. In the presence of base, a large part of the oxygen leaves as CO, while in the absence of base the water pathway is far more dominant. In both cases, the significant removal of oxygen can have a large economic impact on processing costs for low rank coals.
References
1.
2.
3.
4. 5. Ng, F. T. T.; Tsakiri, S. K. 1 9 9 3 , a 211. 6.
Lim, S. C.; Rathbone, R. E; Rubel, A. M.; Givens, E. N.; Derbyshire. F. J. Enerw and Fuels, 1994,& 294 Stunk, G. F.; Culross, C. C.; Reynolds, S. D. United States Patent No. 5,026,475, June 25; 1991. Vaughn, S. N.; Siskin, M.; Katritzky, k, Brons, G.; Reynolds, N.; Culross, C. C.; Neskora, D. R. United States Patent No. 5,151,173; Sept. 29, 1992. Horvath, I. T.; Siskin, M. Enerw Fuels 1991,A 933-934.
s. Ringen, J. Lanum and F.P. Miknis Fuel. 1979, 58- 69
697
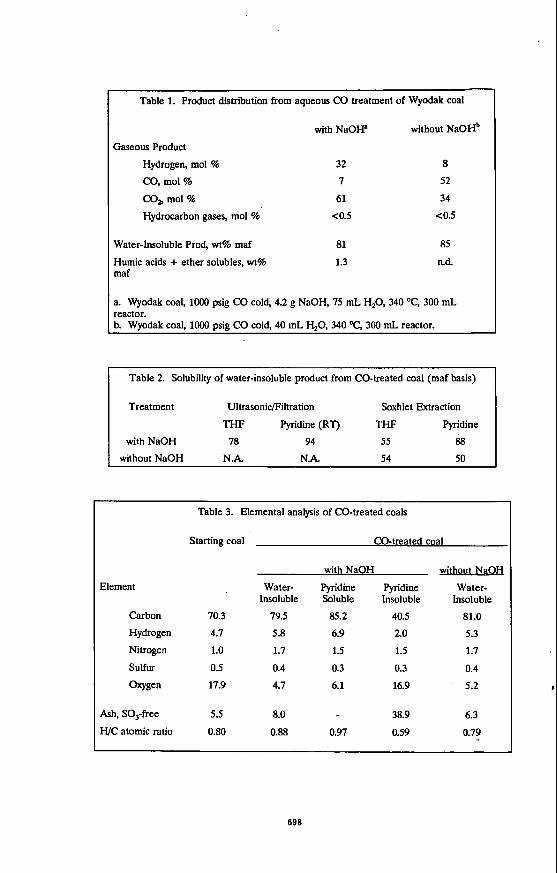
Table 1. Product distriiution from aqueous CO treatment of Wyodak coal 1 with NaOW without NaOHb
Gaseous Product
Hydrogen, mol % 32 8 0, mol % 7 52 CO, mol % 61 34 Hydrocarbon gases, mol % < 0.5 <0.5
n.d. 85 I Water-Insoluble Prod, wt% maf 81 Humic acids + ether solubles, wt% 1.3 maf
a. Wyodak coal, loo0 psig CO cold, 4.2 g NaOH, 75 mL H,O, 340 "C, 300 mL reactor. b. Wyodak coal, loo0 psig CO cold, 40 mL H,O, 340 "C, 300 mL reactor.
Table 2. Solubility of water-insoluble product from CO-treated coal (maf basis)
Treatment Ultrasonic/Filtration Soxhlet Extraction
THF Pyridine (RT) THF Pyridine
with NaOH 78 94 55 68 without NaOH N.A. N.k 54 50
~~~ ~
Table 3. Elemental analysis of CO-treated coals
Starting coal CO-treated coal
with NaOH
Element Water- Pyridine Pyridine Insoluble Soluble Insoluble
Carbon 70.3 79.5 85.2 40.5 Hydrogen 4.7 5.8 6.9 2.0 Nitrogen 1.0 1.7 1.5 1.5 Sulfur 0.5 0.4 0.3 0.3
oxygen 17.9 4.7 6.1 16.9
without NaOH
Water- Insoluble
81.0 5.3 1.7 0.4
5.2
Ash, SO,-free 5.5 8.0 38.9 6.3 H/C atomic ratio 0.80 0.88 0.97 0.59 0.7?
698
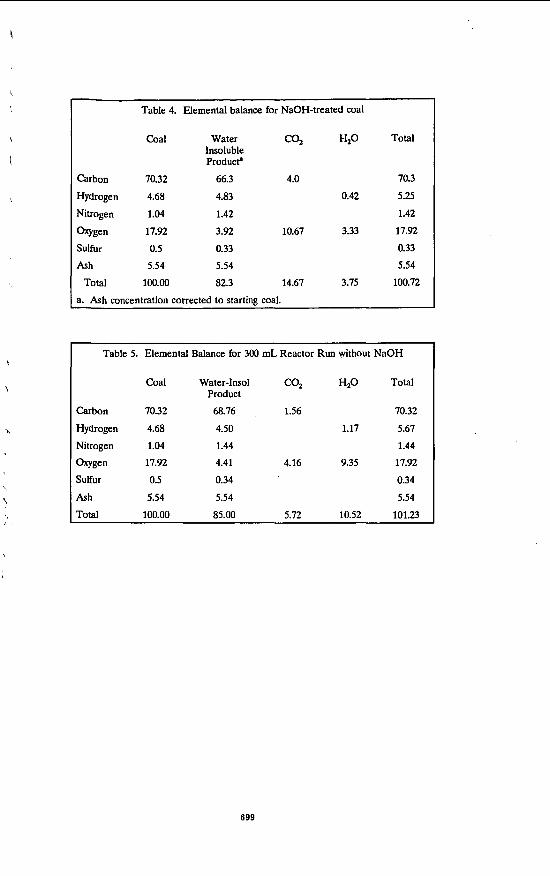
Table 4. Elemental balance for NaOH-treated coal
coal
Carbon 70.32
Hydrogen 4.68
Nitrogen 1.04
W g e n 17.92
Sulfur 0.5
Ash 5.54
Total 100.00
Water Insoluble ProducP
66.3
4.83
1.42
3.92
0.33
5.54
82.3
H P Total
4.0 70.3
0.42 5.2s
1.42
10.67 3.33 17.92
0.33
5.54
14.67 3.75 100.72
a. Ash concentration corrected to starting coal.
Table 5. Elemental Balance for 300 mL Reactor Run without NaOH
Coal Water-Insol COZ HZO Total
Carbon 70.32 68.76 , 1.56 70.32
Hydrogen 4.68 4.50 1.17 5.67
Product
Nitrogen 1.04 1.44 1.44
oxygen 17.92 4.41 4.16 9.35 17.92
Sulfur 0.5 0.34 0.34
Ash 5.54 5.54 5.54
Total 100.00 85.00 5.72 10.52 101.23
699
STEAM PRETREATMENT FOR COAL LIQUEFACTION
0. Ivanenko, R.A. Graff, V. Balogh-Nair, C. Brathwaite Departments of Chemical Engineering and Chemistry
The City College of New York, New York, NY, 10031
Keywords: Coal, Liquefaction, Pretreatment
INTRODUCTION Development of commercially viable and environmentally sound processes for coal liquefaction remains a formidable challenge. Although advances in coal liquefaction technology in recent years have led to the production of liquids of improved quality, this improvement has been achieved mainly by increased consumption of expensive catalyst. Catalyst and capital equipment costs are major factors in the high price of the coalderived liquids.
One way to improve the economics of direct liquefaction is to modify the coal feed before solubiliition. A variety of physical and chemical methcds of coal treatment prior to low severity liquefaction have been found to significantly improve yield and quality of the product, making it superior to those obtained at high severity conditions. Many studies have shown that treatments such as alkylation, acylation, partial oxidation and alkali hydrolysis weaken and rupture the cross-linked bonds and result in a partially depolymerized coal. Although all of these methods of enhancing coal reactivity somewhat improve liquefaction yield, none has yet been employed as a process step in liquefaction. Chemical treatment methods remain in the laboratory mainly because they employ expensive and sometimes hazardous reagents.
The work described here is based on the use of steam as a pretreatment agent in noncatalytic coaldonor solvent liquefaction. Advantages of this approach are that steam is among the cheapest of reagents and does not incorporate undesired chemical residues into the coal structure.
Studies have already demonstrated the effectiveness of exposing Illinois No.6 coal to subcritical steam in the temperature range 320-360°C at 50 atm as a pretreatment for room temperature pyridine extraction and for flash pyrolysis (Graff and Brandes, 1987). It was observed that the pyridine extraction yield from steam treated coal gradually increases and reaches a maximum at a pretreatment temperature of 340-350°C. At temperatures above 370°C the effect is extinguished. Yield of liquids in coal pyrolysis was more than doubled and the total volatiles yield was increased by about 20%. When steam treated coal was exposed to ambient air, both pyrolysis and extraction yields were reduced to the level of raw coal. Analysis of pyrolysis liquids from pretreated Illinois No.6 coal showed a decrease in molecular weight with a simultaneous increase in oxygen content compared to raw coal (Graff et al., 1988). Based on the results of analyses performed on raw and steam pretreated coal (Brandes et al., 1989) it was concluded that during steam pretreatment new hydroxyl groups are introduced. As a result, the covalent cross-links in coal are greatly reduced yielding a partially depolymerized coal, potentially, an improved feedstock for liquefaction processes.
With this success of steam pretreatment in pyrolysis, it was logical to test its application to direct liquefaction. Previous attempts by others to obtain an improvement in liquefaction yield by this method had, however, failed. As noted above, pyrolysis studies showed that heating coal above 360°C could destroy the effect of pretreatment. It was, therefore, reasoned that the heating of pretreated coal to liquefaction temperatures must be done rapidly to minimize deleterious retrogressive reactions. A tubing bomb or stirred autoclave (employed in the conventional way) would not be adequate to carry out liquefaction under rapid heating conditions. One way to achieve high heating rates is to use a method in which a slurry of pretreated coal is injected into a hot liquefaction reaction vessel (Whitehurst ef al. 1976). A system of this type, with some modifications, was designed, assembled, tested and used for the liquefaction tests. Furthermore, as it is known that the benefits of pretreatment are observed only if exposure of steam treated coal to air is rigorously avoided, it is necessary to conduct all operations with pretreated coal under an inert atmosphere. To satisfy this requirement, a nitrogen tilled glove bag is used for sample workup and the oxygen concentration of the bag monitored by mass-spectrometer. To verify successful pretreatment, the pyridine extraction yield is determined for each steam treated coal sample.
In this work liquefaction tests of raw and steam pretreated Illinois No. 6 coal were made to determine the pretreatment effect on yield of liquids and on quality of product. These tests were conducted using the slurry injection autoclave described above pressurized with hydrogen and using tetralin as the donor solvent. The effect of exposure of treated coal to air and the role
700
1
\
\
of coal s l q heating rate were examined at three different conditions of liquefaction severity.
EXPERIMENTAL METHODS coal Sample. Pretreatment and liquefaction experiments were conducted with Illiois No.6 coal from the Pennsylvania State University Sample Bank @ECS-2) ground under nitrogen to pass 200 mesh using a gas impact pulverizer (Trost). Ground coal was riffled, placed in a glass jars, flushed with inert gas, sealed, and stored under refrigeration.
Skam Prek&nent. Steam pretreatment was conducted in a continuous flow of steam using the procedure described by Graff and Brandes (1987) and Graff et al. (1988, pp 3-5). The coal was reacted with 50 atm steam at 340°C for 15 minutes (optimum pretreatment conditions for Illinois No.6 coal).
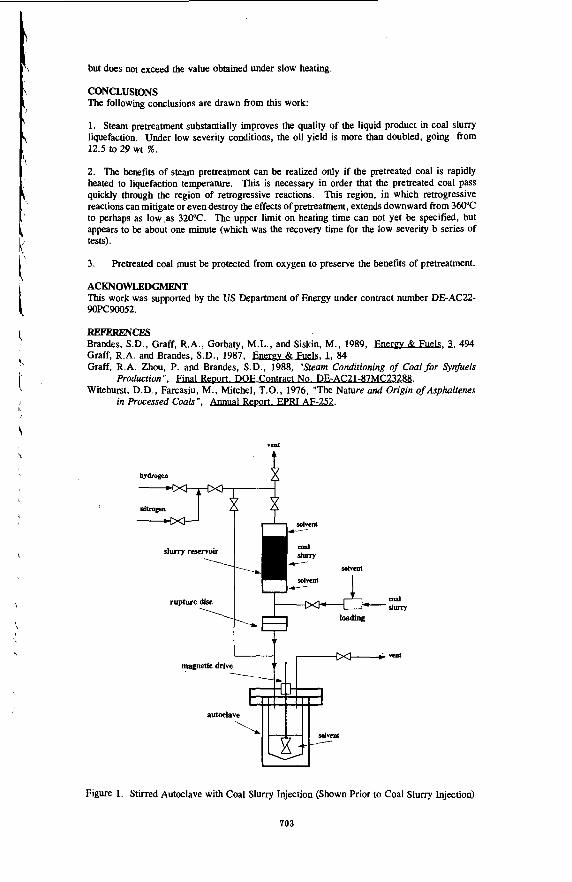
Liquefaction. Liquefaction experiments were conducted with raw coal, steam mated coal and steam treated coal exposed to air under conditions of both rapid and slow heating, using tetralin as a hydrogen donor solvent. The liquefaction apparatus (Figure 1) consists of a 300 ml stirred autoclave (Autoclave Engineers EZE-Seal, model #P419) and coal slurry injection system (loading reservoir and 1000 psia rupture disc assembly which separates the reservoir from the autoclave). Nitrogen and hydrogen are supplied from high pressure cylinders.
Rapid heating liquefaction is conducted as follows:
Sixty grams of deoxygenated tetralin are placed into the reaction vessel and the autoclave is sealed. After the system is leak tested with nitrogen at 2000 psia with the bypass line valve open, the reactor is flushed with hydrogen at atmospheric pressure and then heated using an electric furnace and keeping the bypass line valve closed. While the reactor is heated, slurry is prepared in a nitrogen filled glove bag from the pretreated coal and the solvent. The slurry is made of 1/3 part of coal and 2/3 parts of solvent using about 20 grams of coal. When the autoclave has been preheated to operating temperature, two syringes are filled, one with about 40 ml of slurry and one with 20 ml o f solvent. The syringes are attached to the loading line, the loading valve is opened, and the slurry reservoir is sequentially filled with 10 ml of solvent, coal slurry (full contents of the syringe), and, finally, 10 ml of solvent. The loading valve is then sealed and hydrogen at the desired pressure is applied. This causes the rupture disc to burst, injecting slurry into the reactor and pressurizing the system. The valve above the reservoir is then closed. The reaction temperature is maintained with f5"C accuracy. The run duration is measured from coal injection. Then the heater is turned off, removed from the autoclave and the run is terminated.
In slow heating liquefaction tests the same procedure is employed except that slurry is injected when the autoclave is at room temperature. The reaction mixture is then heated to operating temperature. The reaction time count starts when the desired operating temperature is reached.
After the liquefaction run is completed and the reactor cooled down, coal conversion is determined using Soxhlet extraction as described by Joseph (1991). The liquid product is classified as hexane solubles (oils + gases), toluene solubles (asphaltenes), and THF solubles (preasphaltenes). In later runs, after cool down, vent gas from the autoclave is analyzed continuously sampling the gas vented from the autoclave directly into a mass spectrometer (Extranuclear Laboratories, Inc.; Model C50). The total gas yield, including volatiles loss during pretreatment (8 wt% at the conditions used), is determined and then subtracted from the value of hexane solubles (oil + gas) to obtain the yield of oils alone.
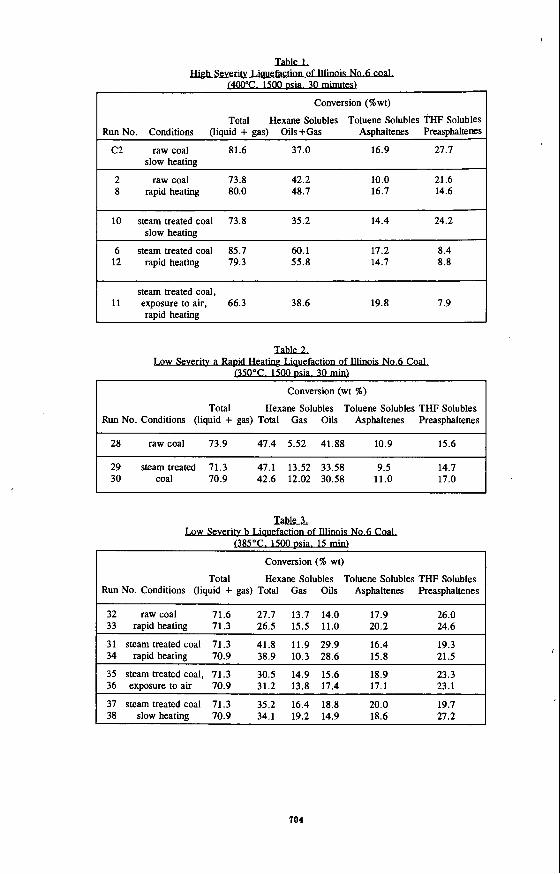
RESULTS AND DISCUSSION Liquefaction runs were conducted with Illinois No. 6 coal at three sets of conditions:
High severity: 4WC, 1500 psia, 30 minutes, Low severity a: 350°C. 1500 psia, 30 minutes, and Low severity b: 385°C. 1500 psia, 15 minutes.
The results are shown in Tables 1 , 2, and 3, classified according to the liquefaction conditions employed. All yields are based on the moisture and ash free (ma0 raw coal charge.
High &verity Liquefaction. First, raw coal was examined under slow (run C2) and rapid (runs 2 and 8) heating liquefaction conditions. Then, a series of tests with steam treated coal were conducted: runs 6 and 12 were carried out under rapid heating conditions. The importance of preventing the exposure of pretreated coal to oxygen (run 11) and the importance of rapid heating (run 10) for the liquefaction were also demonstrated. Results are shown in Table 1.
701
The total yield of liquid product from raw coal obtained at rapid heating conditions appears to be slightly lower than at slow heating due to the longer overall reaction time in a slow heating run. The yield of oils, however, is increased and preasphaltene yield is decreased. No improvement in the yields was observed when steam pretreated coal was subjected to the liquefaction under slow heating. Compared to raw coal, a lower total yield as well as a lower yield of each fraction were obtained. In rapid heating liquefaction, however, the yield of hexane solubles are substantially increased while asphaltenes are reduced. When steam treated coal is deliberately exposed to ambient air for one hour before slurrying with deoxygenated tetralin, the pretreatment effect deteriorated. The oil yield decreased even below the value for raw coal with rapid heating. Total yield also decreased. Asphaltene yield is higher and preasphaltenes yield is lower when an exposure to air is prevented.
Low Seventy Liquefaction a. Raw and steam pretreated coal were tested under rapid heating conditions at reduced severity (low severity liquefaction a). In addition to liquid product characterization, the amount of gas formed in the process was also determined. Liquefaction yields are shown in Table 2.
The results obtained under these reduced severity conditions show no improvement in the liquefaction yields between raw and steam pretreated coal. (That the pretreatments were successful was confirmed by the increased pyridine extraction yields.) Steam pretreatment did, however, increase gas yield at the expense of oils.
A possible explanation for the lack of improvement in yields after steam pretreatment may be found in the temperature history in the autoclave. The coal slurry (made of raw or steam treated coal) was injected into the autoclave preheated to 350°C. In all cases the injection caused the temperature to drop below 300°C. This was followed by a recovery to 350°C in about 1.5 minutes. Consequently, the sample had passed through a region below 360'C where retrogressive reactions occur, resulting in low yield of the liquid product and in a higher yield of gas. Perhaps, the chosen reaction temperature itself, 350"C, is where retrogressive reactions occur.
Low Seventy Liquefaction b. To keep the reaction temperature higher after slurry injection and during the reaction, the low severity liquefaction temperature was increased to 385°C (which is above the upper limit of pretreatment), the reaction time reduced to 15 minutes, and the pressure was left unchanged at 1500 psia. The procedure was also slightly modified: the autoclave was initially preheated to 400°C. After the temperature drop caused by the slurry injection, the temperature was raised to 385°C. The results are shown in Table 3. In all rapid heating liquefaction experiments the reaction temperature nzver dropped below 320°C.
Low severity liquefaction b tests show a strong improvement in the quality of product resulting from steam pretreatment under rapid heating conditions (runs no. 31 and 34 compared to runs no. 32 and 33). The yields of hexane solubles were increased with a slight reduction in the total gas make. Remarkably, the oil yields are doubled while preasphaltenes are reduced. This improvement in the liquid quality occurred together with an increase in the total yield of liquids.
Exposure of steam treated coal to air (runs no. 35 and 36) resulted in a drop in the yield of hexane solubles and oils almost to the level of raw coal. The total yield of liquids also decreased. In slow heating liquefaction (runs no. 37 and 38), the total yield of liquids has dropped compared to rapid heating, but is still higher than raw coal under rapid heating. Of the three liquid fractions, only hexane solubles are distinctly affected by heating rate. Under slow heating conditions the highest total gas make was observed, the total yield of hexane solubles and oils alone have intermediate value between raw and steam treated coal under rapid heating. The higher total yield under slow heating liquefaction may result from a longer reaction time (it takes up to 30 minutes to preheat autoclave to 385°C). since the liquefaction process starts before the reactor temperature reaches 385"C, even under low pressure.
SummariZmg these results, the behavior of Illinois No.6 coal in low severity b liquefaction follows the same trends as high severity. The best results, highest total yield and yield of hexane solubles, are obtained from steam pretreated coal under rapid heating conditions. Moreover, the improvement in the hexane solubles is achieved as a result of an increase in the yield of oils and a decrease in gas yield (at least at low severity). The liquefaction yields (total yield and hexane solubles) obtained from steam treated coal under slow heating conditions have intermediate values between raw and steam treated coal under rapid heating. When steam treated coal is deliberately exposed to air, the total yield drops to the level of raw coal (rapid heating), the yield of hexane solubles is slightly higher than from raw coal under rapid heating
702
but does not exceed the value obtained under slow heating.
CONCLUSIONS The following conclusions are drawn from this work:
1. Steam pretreatment substantially improves the quality of the liquid product in coal sluw liquefaction, Under low severity conditions, the oil yield is more than doubled, going from 12.5 to 29 wt I.
2. The benefits of steam pretreatment can be realized only if the pretreated coal is rapidly heated to liquefaction temperature. This is necessary in order that the pretreated coal pass quickly through the region of retrogressive reactions. This region, in which retrogressive reactions can mitigate or even destroy the effects of pretreatment, extends downward from 360°C to perhaps as low .as 320°C. The upper limit on heating time can not yet be specified, but appears to be about one minute (which was the recovery time for the low severity b series of tests).
3.
ACKNOWLEDGMENT This work was supported by the US Department of Energy under contract number DE-AC22- 90PC90052.
REFERENCES Brandes, S.D., Graff, R.A., Gorbaty, M.L., and Siskin, M., 1989, Faagy & Fuels, 3, 494 Graff, R.A. and Brandes, S.D., 1987, l&tgy & Fuels, 1, 84 Graff, R.A. Zhou, P. and Brandes, S.D., 1988, "Steam Conditioning of Coal for sLnfuels
Witehurst, D.D., Farcasiu, M., Mitchel, T.O., 1976, "The Nature and Origin of Asphaltenes
Pretreated coal must be protected from oxygen to preserve the benefits of pretreatment.
Production ", r. - -
in Processed Coals", v.
\
\
vent
Figure 1. Stirred Autoclave with Coal Slurry Injection (Shown Prior to Coal Slurry Injection)
703
TahleL
w c . 15- Conversion (%wt)
Total Hexane Solubles Toluene Solubles THF Solubles Run No. Conditions (liquid + gas) Oils+Gas Asphaltenes Preasphaltems
C2 raw coal 81.6 37.0 16.9 27.7 slow heatine
~~~~ ~ ~~
2 raw coal 73.8 42.2 10.0 21.6 8 rapid heating 80.0 48.7 16.7 14.6
10 steam treated coal 73.8 35.2 14.4 24.2 slow heatine
6 steam treated coal 85.7 60.1 17.2 8.4 12 rapid heating 79.3 55.8 14.7 8.8
steam treated coal, 11 exposure to air, 66.3 38.6 19.8 7.9
raDid heating
Lgw S e v V Ia lk2 . . . . .
u50°c. 1500 Conversion (wt %)
Total Hexane Solubles Toluene Solubles THF Solubles Run No. Conditions (liquid + gas) Total Gas Oils Asphaltenes Preasphaltenes
28 raw coal 73.9 47.4 5.52 41.88 10.9 15.6 I 29 steam treated 71.3 47.1 13.52 33.58 9.5 30 coal 70.9 42.6 12.02 30.58 11.0
14.7 17.0 I .
Low S e v y No.6 W TalzlLL
085OC. 1500 I z s k X J u
. .
Conversion (% wt)
Total Hexane Solubles Toluene Solubles THF Solubles Run No. Conditions (liquid + gas) Total Gas Oils Asphaltenes Preasphaltenes
32 raw coal 71.6 27.7 13.7 14.0 17.9 26.0 33 rapid heating 71.3 26.5 15.5 11.0 20.2 24.6
31 steam treated coal 71.3 41.8 11.9 29.9 16.4 19.3 34 rapid heating 70.9 38.9 10.3 28.6 15.8 21.5
~
35 steam treated coal, 71.3 30.5 14.9 15.6 18.9 23.3 36 exposure to air 70.9 31.2 13.8 17.4 17.1 23.1
37 steam treated coal 71.3 35.2 16.4 18.8 20.0 19.7 38 slow heating 70.9 34.1 19.2 14.9 18.6 27.2
104
'\
EFFECT OF HYDROTREATING CONDITIONS ON HYDROCRACKING OF A COAL DERIVED LIQlJlD
X. Zhan, H.S. bo, and J. A Guin Department of Chemical Engineering Auburn University, AL 36849-5127
Keywords: Coal Liquid, Hydrotreating, Hydrocracking
ABSTRACT
Several coal derived liquids produced using different hydrotreating severities were hydrocracked to naphtha over a presulfided commercial hydrocracking catalyst. The feeds had similar boiling range and molecular type distribution but different nitrogen content. Feed nitrogen content had a significant effect on the hydrocracking activity, activity maintenance, and selectivity. Rapid deactivation was observed for feeds with nitrogen content higher than 50 ppm. For the feed with 50 ppm N, the gas oil (+205"C) conversion to naphtha decreased observably in the initial 4 hours. An initial catalytic activity study indicated that first order kinetics can be used to describe the gas oil conversion to naphtha. The initial hydrocracking rate ofgas oil was approximately inversely proportional to the feed nitrogen content. Related model compound studies showed that the hydrocracking of cumene and hexadecane was very dependent on feed N content.
INTRODUCTION
Since it has been expected that total petroleum products demand will rise greatly before the end of this century, refiners are increasing the proportion of heavier, poorer quality crude or syncrude in their feedstocks. These feeds include less valuable petroleum stocks such as residua, and hels derived fiom coal, shale, and tar sands. However, liquids derived from direct coal liquefitction sti l l have low hydrogen to carbon ratio, high polyaromatic concentrations, and high sulfur and nitrogen concmtrations. Upgrading of these liquids is required before they can be blended into refinery feeds. The primary upgradiig process usually involves the hydrotreating of either the entire coal liquid or individual fractions obtained by distillation.
Although hydrogen content can be increased and heteroatoms reduced significantly in the hydrotreating process, the hydrotreated coal liquid still has ah@ boiling point because only minimal hydrocracking occurs in the hydrotreater. Further downstream treatment in the form of hydrocracking is necessary before fuels of high quality can be obtained. The hydrocracking process is required because coal liquids generally have a high content of polycyclic aromatic compounds, which are relatively unreactive in catalytic cracking.
Hydrocracking is a flexible refining process that allows conversion of feedstocks ranging fiom naphtha to residua into more valuable, loww boiliig products. Hydrocracking catalysts are dual functional, consisting of hydrogenation metals on an acidic cracking base. There have been commercial hydrocracking processes using zeolite-based catalysts for converting petroleum distillates and residues.' The research on hydrocracking coal liquids is still very limited. In this work, we studied the activity and activity maintenance of a commercial hydrocracking catalyst using coal liquids with merent hydrotreating conditions. The objective was to examine how hydrotreating conditions affect hydrocracking reactions. We also performed some model compound hydrocracking experiments to study the effect of N on hydrocracking rates.
EXPERIMENTAL
Model Compound Experiments. Reactions were performed in tubing bomb microreactors (TBMRs) charged with 1000 psig ambient hydrogen pressure. Two solutions were used : (1) 5g of hexane solution containing 2 wt?? cumene, (2) 6g of pure hexadecane. Different nitrogen contents were obtained using pyridine. Experiments were performed at 350°C for cumene reactions and at 400°C for hexadecane reactions ; both for 20 min using 0.lg ofa commercial NiMo/zeolite catalyst (Akzo KC2600, MOO, < 25%, NiO ]-lo%, Al,O, 30- 70%. SiO, 20-50%).
Coal Liquid Experiments. The coal liquid hydrocracking experiments were carried out in both an upflow continuous reactor and TBMRs to study the deactivation behavior and
105
initial activity of the catalyst. The feed reactants were hydrotreated coal liquids prepared with different hydrotreating severities in a continuous reacto?. Four hydrotreated liquids with similar boiling range distribution and molecular type distribution but with different nitrogen contents, as summarized in Table 1, were prepared as hydrocracking feeds to investigate the effect of hydrotreating conditions on the hydrocracking reaction.
In the continuous reactor, liquid feed and hydrogen were mixed to produce a dispersive stream entering the bottom of the externally heated reactor tube. The catalyst ( 5 g) was crushed to 16-25 mesh, diluted with 1.0 mm glass beads (20 g), and then placed in the center of the reactor. The reactor was operated at 400°C and 9.7 MPa with a pressure drop across the reactor bed of about 0.1 m a . Prior to the start of a run the catalyst was presulfided using 5 wt% CS, in cyclohexane at a liquid flow rate of 0.05 ccm and hydrogen at 100 sccm.
The TBMR runs were performed at 400°C and 6.9 MPa cold H, pressure. For the deactivation m in TJ3m 4 g of liquid reactant was used with 1 g catalyst for 2 hours. The catalyst was recovered, washed in THF, and dried in air over night. This catalyst was then used for the next run with fresh feed and the same procedure was repeated for five times, so that the total time the catalyst exposed to the reaction environment was 10 hours. Prior to the first reaction, the catalyst was p r d d e d in the same type of TBMR using 0.5 g CS, for two hours at 400°C and 6.9 MPa cold H2 pressure. For the kinetic experiments, approximately 4 g of liquid reactant was charged to the TBMR with different loadings of catalyst ranging from 0.1 g to 1 g. The reaction time was from 20 to 120 min. The liquid product was collected and analyzed using GC simulated distillation according to ASTM test method D2887. While the detailed GC boi ig curve was obtained, for simplicity of discussion, the product boiling range distribution in this study was grouped into three cuts only: gas, naphtha (-205 "C), and gas oil (+205 'C). The gas make was obtained by difference using the weights of feed and liquid products. The percentage of gas make was defined as
w t . o f g a s e s a f t e r RXN - w t . o f I n i t i a l H2
w t . o f liquid f e e d
RESULTS AND DISCUSSION
Gas Make - (1)
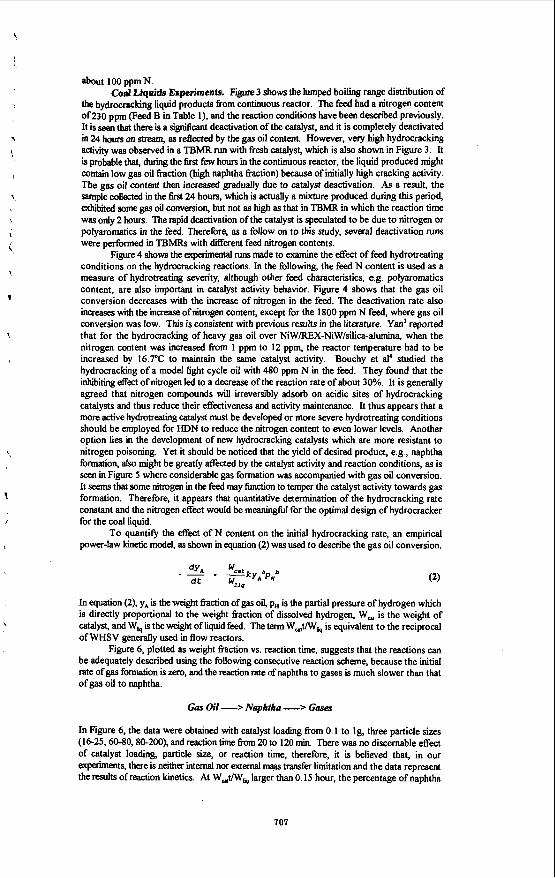
Model Compounds Experiments. The effect of feed nitrogen content on cumene and hexadecane conversion is shown in Figure 1. Cumene conversion without nitrogen was 96%. It is relatively easy to crack cumene into benzene and propylene due to the tertiary carbon of cumene which can form very stable tertiary carbonium ions on acid sites. The reactions of hexadecane, a straight-chain parat6n, showed about 51% conversion in the absence of nitrogen. In this reaction (0 ppm N), 5% gas, 4 1% naphtha, and 54% of gas oil were obtained and 82% of the hexadecane converted was in the naphtha fraction. KC2600 catalyst with hexadecane in the absence of nitrogen has very good selectivity for naphtha. Little conversion was observed above 100 ppm N in both reactions. These results show that the hydrocracking activity of KC2600 is completely poisoned by amounts of nitrogen around 100 ppm and nitrogen removal h m the high nitrogen containing feeds such as coal derived liquids is required prior to the hydrocracking process. The catalytic cracking and hydrogenation finctions of KC2600 (Niio/zeolite) can be examined by two reaction pathways of cumene hydrocracking.
1: 2:
cumene - benzene + propylene -. other products cumene - iso-propylcyclohexane - other products
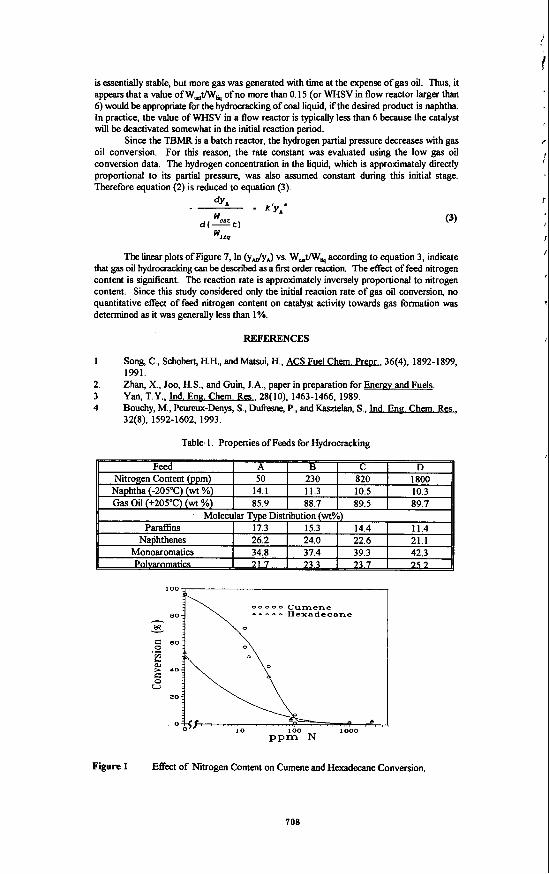
Pathway 1 is cumene cracking to benzene (B) and propylene (PP) by acid sites mainly on the zeolite. In pathway 2, cumene is hydrogenated to iso-propylcyclohexane (IPCH) by metal sites (Ni and Mo) followed by cracking to other compounds such as cyclohexane (CH), PP, etc. From these experiments, the concentrations of cumene, B, and IPCH from cumene reactions as a function of nitrogen content are shown in Figure 2. The concentration of B was about 0.7% at 0 ppm N and decreased to 0 at about 33 ppm N. IPCH was observed to appear at about 13 ppm N. Below 13 ppm, IPCH is probably cracked to form CH and PP. The IPCH concentration increased to a maximum around 33 ppm N and decreased to about 0 above 100 ppm N. These observations show the following. Below 10 ppm N, cracking reactions by acid sites are dominant. As nitrogen content increases from 10 ppm, however, acid sites are poisoned. On the other hand, metal sites have substantial activity in the range of 10-100 ppm N with IPCH being the main product identifled. This activity was also poisoned above 100 ppm N. It can be concluded that the acid function for reaction pathway 1 is severely poisoned around 33 ppm N, while the hydrogenation fbnction (Nil and Mo) still has some activity up to
706
i
1
\
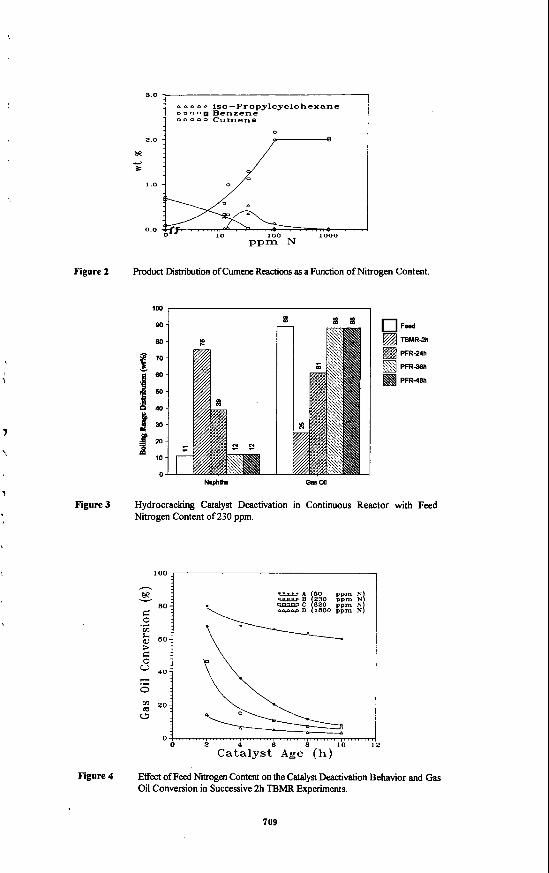
about 100 ppm N. Cod Liquids Experiments. Figure 3 shows the lumped b o h g range distribution of
the hydrocracking liquid products from continuous reactor. The feed had a nitrogen content Of 230 ppm (Feed B in Table I), and the reaction conditions have been described previously. It is seen that there is a significant deactivation of the catalyst, and it is completely deactivated in 24 hours on stream, as reflected by the gas oil content. However, very high hydrocracking activity was observed in a TBMR run with fresh catalyst, which is also shown in Figure 3. It is probable that, during the first few hours in the continuous reactor, the liquid produced might contain low gas oil fraction (high naphtha fraction) because of initially high cracking activity. The gas oil content then increased gradually due to catalyst deactivation. As a result, the sample collected in the first 24 hours, which is actually a mixture produced during this period, exhiiied some gas oil conversion, but not as high as that in TBh4R in which the reaction time was only 2 hours. The rapid deactivation of the catalyst is speculated to be due to nitrogen or polyaromatics in the feed. Therefore, as a follow on to this study, several deactivation funs were performed in TBMRs with different feed nitrogen contents.
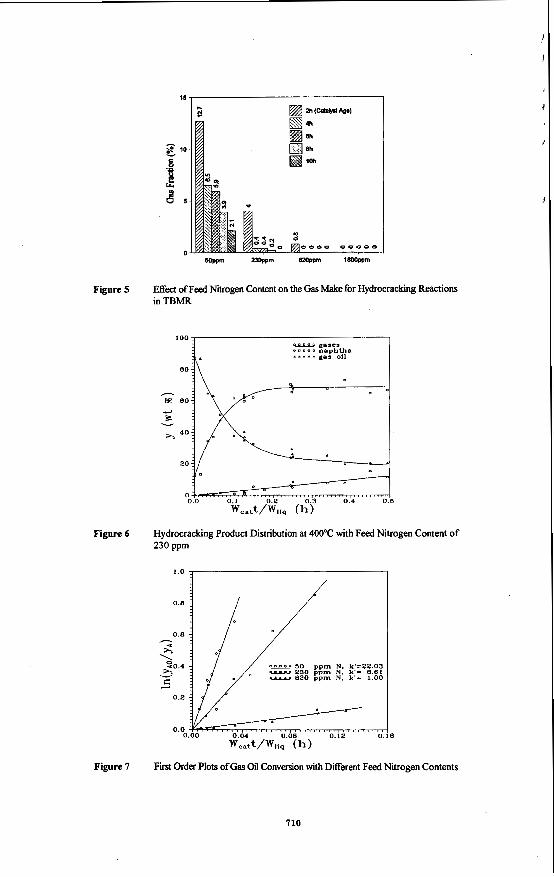
Figure 4 shows the experimental runs made to examine the effect of feed hydrotreating conditions on the hydrocracking reactions. In the following, the feed N content is used as a measure of hydrotreating severity, although other feed characteristics, e.g. polyaromatics content, are also important in catalyst activity behavior. Figure 4 shows that the gas oil conversion decreases with the increase of nitrogen in the feed. The deactivation rate also increases with the increase of nitrogen content, except for the 1800 ppm N feed, where gas oil conversion was low. This is consistent with previous results in the literature. Yan' reported that for the hydrocracking of heavy gas oil over NiW/REX-NiW/silica-alumina, when the nitrogen content was increased from 1 ppm to 12 ppm, the reactor temperature had to be increased by 16.7"C to maintain the same catalyst activity. Bouchy et al' studied the hydrocracking of a model light cycle oil with 480 ppm N in the feed. They found that the inhibiting effect of nitrogen led to a decrease of the reaction rate of about 30%. It is generally agreed that nitrogen compounds will irreversibly adsorb on acidic sites of hydrocracking catalysts and thus reduce their effectiveness and activity maintenance. It thus appears that a more d v e hydrotreating catalyst must be developed or more severe hydrotreating conditions should be employed for HDN to reduce the nitrogen content to even lower levels. Another option lies in the development of new hydrocracking catalysts which are more resistant to nitrogen poisoning. Yet it should be noticed that the yield of desired product, e.g., naphtha formation, also might be greatly affected by the catalyst activity and reaction conditions, as is seen in Figure 5 where considerable gas formation was accompanied with gas oil conversion. It seems that some nitrogen in the feed may function to temper the catalyst activity towards gas formation. Therefore, it appears that quantitative determination of the hydrocracking rate constant and the nitrogen effect would be meaningfid for the optimal design of hydrocracker for the coal liquid.
To quantify the effect of N content on the initial hydrocracking rate, an empirical power-law kinetic model as shown in equation (2) was used to describe the gas oil conversion.
In equation (Z), yA is the weight &action of gas oil, p,, is the partial pressure of hydrogen which is directly proportional to the weight fraction of dissolved hydrogen, W, is the weight of catalyst, and W6, is the weight of liquid feed. The term W,t/W, is equivalent to the reciprocal of WHSV generally used in flow reactors.
Figure 6, plotted as weight fraction vs. reaction time, suggests that the reactions can be adequately described using the following consecutive reaction scheme, because the initial rate of gas formation is zero, and the reaction rate of naphtha to gases is much slower than that of gas oil to naphtha.
Gas Oil --z Naphtha -> Gases
In Figure 6, the data were obtained with catalyst loading from 0.1 to lg, three particle sizes (16-25,60-80,80-200), and reaction time 6om 20 to 120 min. There was no discernable effect of catalyst loading, particle size, or reaction time, therefore, it is believed that, in our experhen& there is neither internal nor external n+s transfer limitation and the data represent the results of reaction kinetics. At W,t/Ww larger than 0.15 hour, the percentage of naphtha
107
is essentially stable, but more gas was generated with time at the expense of gas oil. Thus, it appears that a value of W,t/W, of no more than 0.15 (or WHSV in flow reactor larger than 6) would be. appropriate for the hydrocracking of coal liquid, ifthe desired product is naphtha. In practice, the value of WHSV in a flow reactor is typically less than 6 because the catalyst will be deactivated somewhat in the initial reaction period.
Since the TBMR is a batch reactor, the hydrogen partial pressure decreases with gas oil conversion. For this reason, the rate constant was evaluated using the low gas oil conversion data. The hydrogen concentration in the liquid, which is approximately directly proportional to its partial pressure, was also assumed constant during this initial stage. Therefore equation (2) is reduced to equation (3).
The linear plots of Figure 7, In (yJyJ vs. W,t/Wh according to equation 3, indicate that gas oil hydrocracking can be d e s c n i as a 6rst order reaction. The effect of feed nitrogen content is significant. The reaction rate is approximately inversely proportional to nitrogen content. Since this study considered only the initial reaction rate of gas oil conversion, no quantitative effect of feed nitrogen content on catalyst activity towards gas formation was determined as it was generally less than 1%.
REFERENCES
1
2. 3 4
Song, C., Schobert, H.H., andMatsui, H., ACS Fuel Chem. Preur., 36(4), 1892-1899, 1991. Zhan, X., Joo, H.S., and Guin, J.A., paper in preparation for Enere and Fuels. Yan, T.Y., Ind. Enn. Chem. Res., 28(10), 1463-1466, 1989. Bouchy, M., Peureux-Denys, S., JMksne, P., and Kasztelan, S., Ind. Enn. Chem. Res., 32(8), 1592-1602, 1993.
Table 1. Properties of Feeds for Hydrocracking
0 0 0 0 0 C u m e n e A H e x a d e c a n e
Figure 1 Effect of Nitrogen Content on Cumene and Hexadecane Conversion.
708
3.0 , I
W
80
70 1. w
-
l a 9 : 10
D
1
Fed TBMR-2h
PFR-24h
PFR3Bh
PFR4lUl
A a A iso-Propylcyclohexane D D 0 - Benzene o o o o o Cumene I
0.0
Figure 2 product Distribution of Cumene Reactions as a Function of Nitrogen Content.
100, I
Naphh OIU 00
Figure 3 Hydrocracking Catalyst Deactivation in Continuous Reactor with Feed Nitrogen Content of 230 ppm.
- loo I *\
2 4 6 B 10 12 Catalyst Age (h)
Figure 4 Effect of Feed Nitrogen Content on the Catdyst Deactivation Behavior and Gas Oil Conversion in Successive 2h TBMR Experiments.
709
a 0 0 0 0 0 0 0 L
Figure 5 Effect of Feed Nitrogen Content on the Gas Make for Hydrocracking Reactions in TBMR
BO k
5
Figure 6 Hydrocracking Product Distribution at 400°C with Feed Nitrogen Content of 230 ppm
%2.%w 50 ppm N . k'=22.03 ~ .-- 230 ppm N. k'- B.61
820 ppm N. k'= 1.00
Figure 7 First Order Plots of Gas Oil Conversion with Different Feed Nitrogen Contents
710
EFFECT OF IRON CATALYSTS ON HYDROGENATION PATHWAYS IN DIRECT COAL LIQUEFACTION
Richard K. Anderson, William J. Clements, Edwin N. Givens and Frank J. Derbyshire University of Kentucky, Center for Applied Energy Research
3572 Iron Works Pike, Lexington, KY 4051 1-8433
Keywords: caal liquefaction, iron catalyst, hydrogenation
Abstract The effect of a collnnerciany available, high surface area nanometer size iron oxide (SFIO) catalyst on
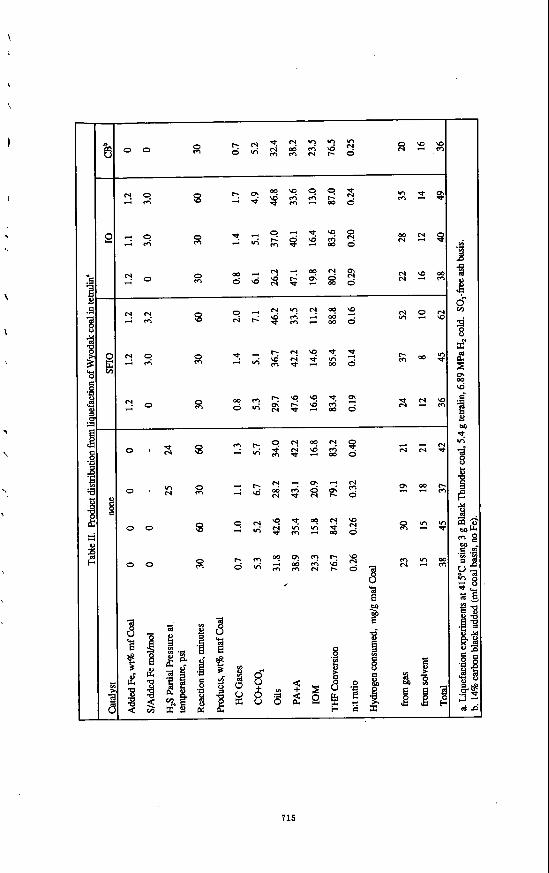
the pathway by which hydrogen is added to a subbituminous coal during direct lquefaction was studied under a variety of conditions. This unique iron oxide, prepared by pyrolyzing volatilized iron carbonyl to produce a finely divided product, is characterized as y-F%03 having a surface area of -300 m'/g and particle size of 1-3 nm. Liquefying Wyodak coal in tetralin (0.5 hrs, 415 "C, 2.3 tetralinldry coal, 6.89 Mpa & cold) containing 1.2 wt % Fe as SFIO resulted in an increase in o v d coal conversion (77 to 83%) with most of the increase in product being in formation of THF soluble-pentane insoluble product. Addhg an excess of sulfur to convext the iron to pyrrhotite funher increases conversion to 85% along with a decrease in the THF solublepentane insoluble fraction. The presence of catalyst increases the amount of hydrogen added to the product as dihydrogen (HJ relative to the amount from tetralin via the H-donor pathway. In the absence of *t, 60% was added as adding 1.2% Fe increased H2 addition to 67%; adding 3 mol Shnol Fe to 1.2% Fe further increased & addition to 82%.
Introduction Through the use of various types of catalysts, high yields of distillate fuels have been pmduced in pilot
plants firomlowerast subbituminous coal.'" The use of high surface area, small particle catalysts has been one area that has been extensively explored in an effort to maximize yields and reduce the cost of catalyst. Fe has been of particular interest as a dispersed catalyst because of its abundance, low cost and its environmental acceptability. Various approaches have been used for preparing disposable nanometer size Fe catalysts, among which are nirmmdm ' aerosols,"*a9 hydrothermal disproportionation of sulfides," and precipitation of sulfated oxyhydroxides." Highly dispersed iron particles, in various forms as oxides and oxyhydroxides, have been shown to retain their small size upon conversion to pyrrhotite under coal hydroliquefaction condition^."*^^'^
In OUT laboratory, a specially prepared Commercially available supexfine Fe oxide (SFTO) was found to have high activity for coal conversion and excellent selectivity for producing distillate product." In the study reponed hae, the activity of this catalyst for conversion of a Wyodak coal in teualin was compared with a nnich Lower surface a m Fe oxide prepared from AiusNther spray roast processing of spent acid from steel pickling.I4 The effect of these catalysts on the pathways by which hydrogen (H) is added to the coal and its products was investigated.
Experimental Samples of the subbituminous coal and powdered iron oxides used at the Wilsonville Advanced Coal
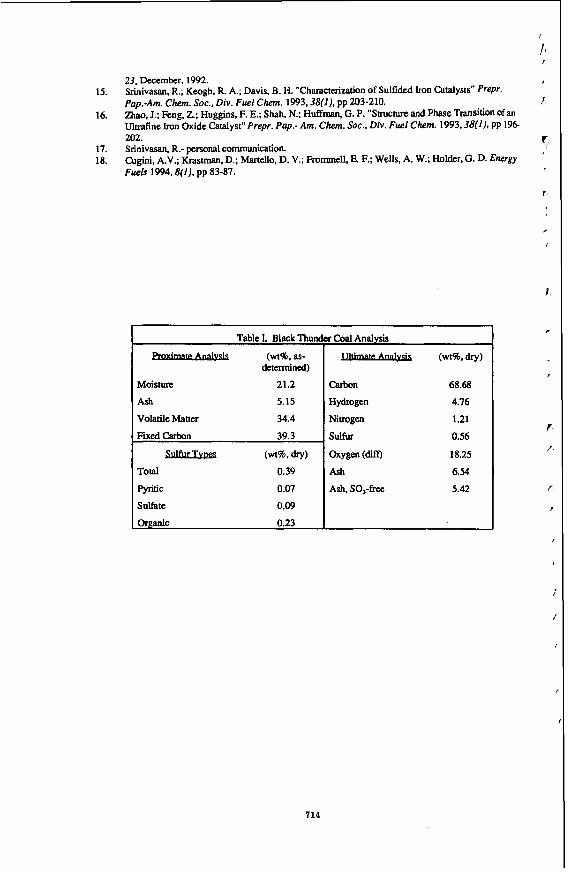
Liquefaction Facility in Run 263Jl4 were supplied by CONSOL, Inc. The Wyodak coal from the Black Thunder mine in Wright, Wyoming was ground to -200 mesh, M e d and stored under nitrogen at 4 "C. Proximate and ultimate analyses are presented in Table I. The average moisture content measured at the beginning of each run was 21.9 f 0.72 wt % of as-received coal.
Two iron oxide catalysts were used. One, a sample of SFIO provided by MACH I, Inc., King of P r U S k PA, contained 63 wt % Fe with a y-F%03 structure, average particle size of 1-3 nm, and nitrogen BET surface area of 300 t~?/g.'~ The second, from Bailey Engineers, Fairfield, AL, (IO) was 99% Fq03 with 0.35 wt % manganese oxide being the largest impurity. The material had a structure of a-FqO,, nitrogen BET surface area of 8.6 d/g , an average particle size of -140 nm, and bulk density 26 times greater than SFIO (1.37 vs. 0.052 ghl ) . Carbon black (CB) was purchased from UIC, Inc. and had a fixed carbon content of 93% with a nitrogen BET surface area of 90 m'/g.
~ u e f a c t b n eXperiments were conducted by adding 3 gratns of coal 5.4 grams of tea&, and catalyst to a 50 mL microautoclave. When used, dimethyl disulfide @MDS) was added at a ratio of 3.0 moles S per mole Fe. The reactor was sealed, pressurized with Hz to 6.89 MPa, and immersed in a fluidized sand bath set at the V@.%kd temperatun while continuously agitating at a rate of 400 cycles per minute. After the specified reaction period the microautoclave was rapidly cooled in a sand bath at room temperature. Gaseous products
711
were collected and analyzed by gas chromatography. Solid-liquid products were washed from the reactor using t e m h y b h a n 0 and extracted in a Soxhlet apparatus for 18 hours. The THF-insoluble -rial @OM), comprising unconverted macedak and mineral matter, was dried (80 "CIO.1 arm). A pentane insoluble- THF soluble hction (PA+A) was precipitated from the concentrated THF soluble fraction by adding pentane. The pentane soluble m a t e d (Oils) was analyzed with a Hewlett-Packard 5890 gas chromatograph fitted with a DB-5 column to determine the naphtbaleneteualin ratio. Product yields were calculated assuming complete lecovery of the inorganic mined matter plus catalyst, which was demonstrated independently. Fe in the catalyst precursor is presumed to convert to pyrrhotite @e&3) and report to the ash fraction. oils are cakulated by difference, which includes water produced during the reaction and any experimental mor. The net product yield equals the anmnt of maf coal in the feed and coal conversion equals 100 minus the yield of IOM. The average standard deviations for each product fraction were calculated: hydrocarbon gases, 0.1; CO+CO,, 0.4; IOM, 1.4; PA+A, 2.4; Oils, 2.8.
Discussion The dominant phase of the SFIO, as determined by X-ray absorption fine struchm (XAFS) analysis,
is F e 0 O H . W with bulk iron coordinated to six oxygen or hydroxyl groups along with a significant additional fraction of the iron located at the particle surfaces at sites with lower coordination.16 Extended heating at t e w >400 "c produces a-&09 Considerable particle p w t h occurs upon sulfiition in the presence of H,S and tetralin at 380 "C, with the formation of pyrrhotite having a particle size of several hundred nanometers." However, in the presence of coal, sulfiding produces a much smaller particle size pyrrhotite6 which has also been observed on Fe-impregnated carbon black'*
Appximately 95% of the Fe contained in the residue isolated from runs to which 1.2 wt % Fe was added as SFIO was present as the oxide, even though the amount of sulfur present in the coal (0.39%) was sufkient to convert -70% of the added Fe to pyrrhotite. However, pyrrhotite would only form when sulfur was added to the reaction mixture. In tuns to which a 3-fold excess of sulfur was added along with 1.2 wt % Fe, >95% of the Fe was converted to pyrrhotite within 7.5 min, indicating that when sulfur was present pyrrhotite formed rapidly and was present during almost a l l of the reaction period. Since particle size of the resulting pyrrhotite was previously reported to be related to the size of the original oxide, SFIO should provide pyrrhonte having a smaller size with correspondingly higher surface area than IO.
As seen in Table II, THF conversion increased when Fe oxides were added to the reaction mixture, while adding sulfur along with the Fe oxides further increased conversion. In the absence of sulfur at 30 minutes runtime, adding SFIO and IO resulted in conversions of 83.4 and 80.2%. respectively, relative to a conversion of 76.7% in the absence of added Fe oxides. The increase was greater for SFIO suggesting a mponse to the higher surface m a . Reactions in which sulfur was added follow the same pattern with SFIO giving higher conversion. At 30 min, addition of sulfur to SFIO and IO increased conversions to 85.4 and 83.6%. respectively, while at 60 min, conversions were 88.8 and 87.056, respectively.
oils yields responded quite differently to addition of Fe oxide in the absence of added sulfur. In both cases shown, they actually decreased somewhat, resulting in a buildup of PA+A. When SFIO and IO were present in the 30 min runs, Oils yields decreased to 29.7 and 26.2%. respectively, relative to a yield of 31.8% in the absence of added Fe. When sulfur was added, oil yields increased for both Fe oxides. After 30 min, yieMs upon addition of SFIO and IO were 36.7 and 37.0%. respectively, while after 60 min, yields were 46.2 and 46.8%. respectively, compared to 42.6% in the absence of added Fe. The suKkied catalyst is clearly better than the oxide for promoting Oils yield
Adding sulfur to the reaction at the same level as in the other experiments but in the absence of any added Fe oxide caused an increase in conversion from 76.7 to 79.1% and a decrease in Oils yield from 31.8 to 28.2%. At this level of sulfur addition, the calculated initial KS partial pressure in the reactor at reaction tempenuure was 25 peg. The effect on converSiOn and Oils yield was similar, though less effective than adding Fe oxides in the absence of added sulfur. Since the combined addition of sulfur and Fe oxides was superior to the addition of the Fe oxides alone, the direct conmbution from adding sulfur at this level (equivalent to - 1% q S in HJ is small relative to its effect on the chemistry of the Fe in the reaction.
Total H co&tion in these reactions was determid b m analysis of dihybgen (HJ in the gaseous product and the H remaining in the solvent. The latter was calculated from a determination of the change in ratio of naphthalene to tetmlin in the pentane soluble fraction. Total H consumption appeared not to increase upon addition of SFIO or IO in the absence of sulfur. Adding sulfur with the Fe oxide had littIe. effect on hydrogen consumption using IO, but a sigdicant effect on hydrogen consumption with SFIO. Total H cons-& based upon mafcoal, in the presence of SFIO in the 30 min runs increased from 36 mug in the
712
absence of sulfur to 45 mg/g when s u l h was added. The consumption of y from the gas phase nflected this iMeased a&ity. In the 30 min rum, reaction of mal in the absence of additives and in the presence of SFIO gave % consumptions of 23 and 24 mglg, respectively. Adding sulfur to the SFIO increased & consumption to 37 mug. Similar activity changes were observed for the 60 min runs.
The effect of adding 14% of a high surface m carbon (90 m*/g) on conversion, product yields and H consumption was negligible. Even though the available N2 BET surface area was more than double the slrrface a m &om adding SFIO at a 1.2% Fe level, the reaction did not change. Clearly, the catalytic effect of adding SFIO is not merely a response to added surface area.
Condusiona Conversion of Wyodak coal to THF soluble product increases in the presence of added Fe oxide,
ngardEess of the presence of sulfk. The highs surface area SFIO is mne active than IO for conversion. Both SFIO and IO increase Oils yields when sulfur is added but have little effect in its absence. Since addition of sulfur to coalin the absence of added Fe oxides had little effect on the reaction, the mechanism by which sulfur affects the reaction is p m d to be through suKiding the Fe. Total H consumption was affected only when both SFIO and sulfur were added to the reaction. The other cases showed little response. The contribution of tetralin to the amount of H consumed in the reaction appears to be mlatively constant for reaction times of 30 and 60 rnin suggesting the reaction pathway involving H-transfer from solvent to coal is important early in the reaction sequence. The effect of SFIO with sulfur, the catalyst that significantly improved H consumption, is to incrcaSe direct & addition to the product. The absence of any effect of adding high-surface area carbon indicates that surface area alone is not responsible for the improvement from adding the Fe-oxides.
Acknowledgement The authors gratefully acknowledge the support of the Department of Energy under contract DE
AC22-91PC91040. We also thank Frank Huggins for conmbuting Mtissbauer studies of the liquefaction residues and Z. Feng for her TEM work.
References 1 .
2.
3.
4.
5.
6.
7 .
8.
9.
10.
1 1 . 12.
13.
14.
Southern Electric International, Inc., Technical Progress Report, "Run 262 with Black Thunder Mine Subbituminous coal" Document No. DOEIPCl90033-22, September, 1992. Bauman, R. F.; Coless. L. A.: Davis, S . M.; Poole. M. C.; Wen, M. Y. Continuous Bench-Scale Slurry Catalyst Testing- Direct Coal Liquefaction of Rawhide Subbituminous Coal. Proceedings: Coal Liquefaction and Gas Conversion Contractors Review Conference. Pittsburgh, PA. Aug. 1995. p91. M a n , V. R.; Lee, L. K.; Stalzer, R. H.; Johanson, E. S.; Comolli, A. G.; Catalytic Multi-stage Liquefaction of Coal at HTI- Bench-scale Studies in Cod Waste Plastics Copmessing Roceedings: Coal Liquefaction and Gas Conversion Contractors Review Conference. Pittsburgh, PA. Aug. 1995, p75. Wilcoxon, J. P.; Sylwester, A.; Nigrey, P.; Martino, A.; Quintana, C.; Baughman, R. I. Proceedings, Eighth Annual Inter. Pittsburgh Coal COI$ 1991.703. Darab. J. G.; Fulton, J. L.; Lmehan, J. C. Prepr. Pap.- Am. Chem. SOC.. Div. Fuel Chem. 1993, 38(1), 21. An&, M.; Charcosset, H.; Chiche, P.; Davignon, L.; Djega-Mariadassou, G.; Joly, J. P.; Pregennain, S.; Fuel 1983,62,69. Andres, M.; Charcosset, H.; Chiche, P.; Djega-Mariadassou, G.; Joly, J-P.; Pregermain, S. Preparation of catalysts 111 (Eds. G. Poncelet and P. Grange), Elsevier: Amsterdam, 1983, pp 675- 682. Dadyburjor, D. B.; Stiller, A. H.; Sthespring, C. D.; Zondlo, J. W.; Wann, J.; Sharma, R. K.; Tm, D.; Aganval, S.; Chadha, A. Prepr. Pap.- Am. Chem. SOC., Div. Fuel Chem. 1994,39(4), 1088. Rice, G. W.; Fiato, R. A.; Soled, S . L. 05/26/87. Iron carbide-based catalyst produced in the presence of laser radiation. U. S . Patent 4668647. Dadyburjor, D. B.; Stewart, W. R.; Stiller, A. H.; Stinespring, C. D.; Wann, J. P.; Zondlo, J. W. Energy Fuels 1994,8(1), 19. F'radhan, V. R.; Tierney, J. W.; Wender, I. Energy and Fuels 1991.5.497-507. Djega-Mariadassou, G.; Besson, M.; Brodzki, D.; Charcosset, H.; Huu, T. V.; Varloud, J. Fuel Processing Tech. 1986.12, pp 143-145. Quarterly Technical Progress Report, Advanced Direct Liquefaction Concepts for PETC Generic Units, July 1994 through September 1994, DOEIPCB1040-48. Southern Elecaic International, Inc., Technical Progress Report, "Run 263 with Black Thunder h e Subbituminous Coal and Dispersed Molybdenum Catalysts'' Document No. DOEIPCl90033-
713
I
11 I
23. December. 1992. Srinivasan, R.; Keogh, R. A.; Davis, B. H. "Characterization of Sulfided Iron clltalysu" Prepr.
Zhao, J.; Feng, Z; Huggins, F. E.; Shah, N.; Huffman, G. P. "Structure and Phase Transition of an Ulaafine Iron Oxide Catalyst" Prepr. Pap.- Am. Chem. SOC., Div. Fuel Chem. 1993.38(1), pp 196- 202.
Cugini, A.V.; Krastman. D.; Martello, D. V.; Fromtnell, E. F.; Wells, A. W.; Holder,G. D. Energy
15.
16. Pap.-Am. Chem. Soc., Div. Fuel Chem. 1993,38(1), pp 203-210. fl
TI 17. Srinivasan, R.- personal communication. 18.
'
Fuels 1994.8(1), pp 83-87.
~ ~ ~~
Table I. Black Thun
(wt46. as- determined)
Moisture 21.2
Ash 5.15
Volatile Matter 34.4
Find Carbon 39.3
sklhuba (wt%b, dry) Total 0.39
pyritic 0.07 Sulfate 0.09
organic 0.23
z Coal Analysis
lnbmA&& (wt%dry)
Carbon 68.68
Hydrogen 4.76
Nitrogen 1.21
Sulfur 0.56
Oxygen (diff) 18.25
Ash 6.54
Ash, SO&C 5.42 r ,
714
. 4 N
2
4
R B
715
I
THE EFFECT OF 3 PARTIAL PRESSURE AND TEMPERATURE ON CATALYTIC HYDROGENATION WITH MoS, CATALYSTS
A. V. Cugini, K. S. Rothenberger, M. V. Ciocco, G. A. Veloski, and D. V. Martello U.S. Department ofEnergy, PETC
Pittsburgh, PA 15236
Keywords: Coal Liquefaction, Catalytic Hydrogenation, Molybdenum Catalysts.
INTRODUCTION
Molybdenum-based catalysts have been used extensively for catalytic hydrogenation[ 1-31, The type of catalyst, either supported or unsupported, and the preparation and activation procedures can impact catalytic behavior for hydrogenation and coal conversion reactions. This study compared the catalytic hydrogenation and coal conversion observed with preactivated forms of supported and unsupported catalysts. The objective was to utilize model compounds to compare the catalytic hydrogenation activity of these two types of catalysts. The effect of catalyst type, supported or unsupported, on catalytic hydrogenation with and without coal present was studied over a range of pressures, 1.4 MPa (200 psig) - 11.0 h4Pa (1600 psig) %. The results indicated that catalytic hydrogenation activity was observed at partial pressures as low as 4.8 MPa (700 psig) with both catalyst types.
EXPERIMENTAL
Materials. ACS grade I-methylnaphthalene from Fisher Scientific Company, found to be 99% pure by gas chromatography, was used without further purification. Blind Canyon coal, @ECS-6) from the U.S. Department ofEnergy's Coal Sample Program, was used in these studies. The Blind Canyon coal was a low pyrite bituminous coal with 6.3% ash and 3.7% moisture. A unique, high surface area, molybdenum catalyst was prepared at the U.S. Department of Energy's Pittsburgh Energy Technology Center (PETC). The catalyst consisted of the recovered solid from a semi-batch 1 -L stirred autoclave reaction of ammonium heptamolybdate, Lydrogen sulfide, and Panasol (a mixture of alkylated naphthalenes) under 17.2 MPa (2500 psi) hydrogen at 700 "K [2-4]. The catalyst contained 50% C, 30% Mo, and 20% S by weight, and possessed a BET surface area of approximately 260 m2/g. Supported molybdenumlnickel catalysts, AKZO AO-60 obtained from HTI, Inc. and Shell-324, were also used. Other catalysts tested included two prepared by impregnating carbon black with Mo or Fe No-C-1 and Fe-C-1, respectively), sulfated F%03[5], and carbon black (BET surface area of 490 m2/g) obtained from Columbian Chemicals Co.
Reactions. Reactions were conducted in a stainless steel batch microautoclave reactor system constructed at PETC. The cylindrical reactor portion has a volume of 43 mL, and the total internal volume, including all tubing and connections, is 60 mL. The reactor was mounted on a rocker arm, which extends into an electrically heated sand bath. In typical experiments, the reactor was charged with various combinations of solvent, coal, catalyst, a suffir source, and then was pressurized with hydrogen. Unless otherwise stated, a full charge consisted of 6.6 g solvent, 3.3 g coal, 0.1 g catalyst, 0.1 g elemental sub, and 6.9 h4Pa (1000 psi) ambient temperature hydrogen gas. The reactor was then attached to the rocker arm (180 cycles I minute) and plunged into a preheated sand bath, where it was heated up to 700 "K in 2 to 4 minutes. It was held at temperature in the sand bath for 30 minutes, removed and allowed to air cool, typically in less than 5 minutes, to room temperature. The reactor was vented and the gas collected for analysis.
Sample Work up Procedure and Coal Conversion Calculation. During work up, the reactor (including tubing) was cleaned and Msed with tetrahydrohran (THF). The material collected was combined and filtered through a 0.45 micron filter under nitrogen gas pressure, yielding the "THF solubles" and "THF insolubles." Coal conversion was calculated based on the mass of MAF coal from the measured mass of THF insolubles adjusted for catalyst and coal mineral matter[6].
Gas and Pressure Analyses. At the completion of each run, product gases were collected and analyzed at PETC by a previously published method [7]. The product gaseous mixture composed mainly of &, C,-C, CO,, and &S, was c ~ ~ e c t e d for non-ideal behavior usiig an equation of state, and the amount of 3 consumed was then calculated.
Solvent Hydrogenation Analysis. Low-Voltage, High-Resolution Mass Spectrometry (LVHRMS) data were used to calculate solvent hydrogenation. LVHRMS data were obtained on a Kratos MS-50 high-resolution mass spectrometer interfaced to a personal-computer-based data system developed at PETC. Further details on the LVHRMS technique and data reduction routines are provided in references 8 and 9.
716
RESULTS AND DISCUSSION
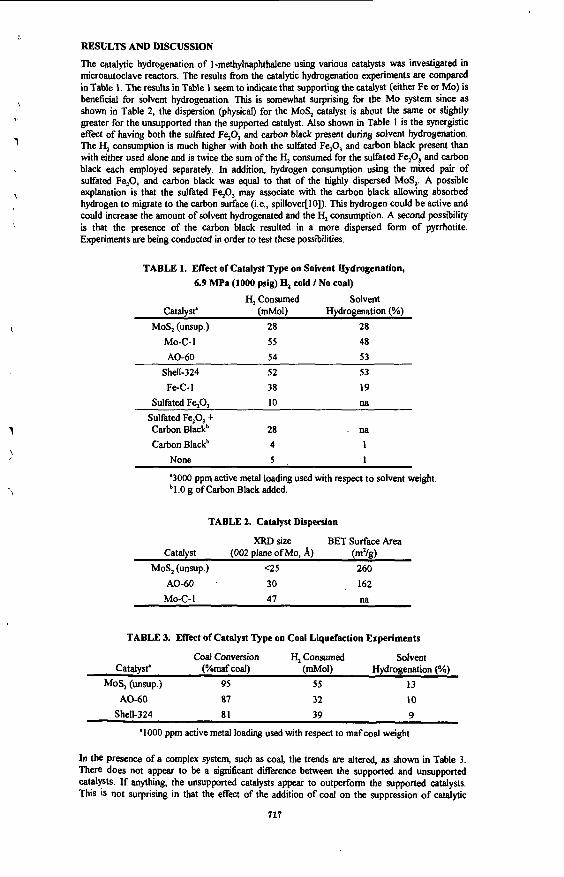
The catalytic hydrogenation of 1-methylnaphthalene using various catalysts was investipted in microautoclave reactors. The results from the catalytic hydrogenation experiments are compared in Table 1, The results in Table 1 seem to indicate that supporting the catalyst (either Fe 01 Mo) is beneficial for solvent hydrogenation. This is somewhat surprising for the MO system Since as shown in Table 2, the dispersion (physical) for the MoS, catalyst is about the m e or slightly greater for the unsupported than the supported catalyst. Also shown in Table 1 is the synergistic e f f d of having both the sulfated F%O, and carbon black present during solvent hydrogenation. The H, consumption is much higher with both the sulfated F40, and carbon black present than with either used alone and is twice the sum of the 5 consumed for the sulfated F%03 and carbon black each employed separately, In addition, hydrogen consumption using the mixed pak of sulfated F40, and carbon black was equal to that of the highly dispersed MoS,. A possible explanation is that the sulfated F40, may associate with the carbon black allowing absorbed hydrogen to migrate to the carbon surface (i.e,, spillover[lO]). This hydrogen could be active and could increase the amount of solvent hydrogenated and the consumption. A second possibility is that the presence of the carbon black resulted in a more dispersed form of pyrrhotite. Experiments are being conducted in order to test these possibilities.
TABLE 1. Effect of Catalyst Type on Solvent Hydrogenation, 6.9 MF'a (1000 psig) E, cold I No coal)
H, Consumed Solvent Catalyst' (mM01) Hydrogenation (YO)
MoS, (unsup.) 28 28 Mo-C-I 5s 48 AO-60 54 53
1
\
Shell-324 52 53 Fe-C-I 38 19
Sulfated F40, 10 na Sulfated F40, +
Carbon Blackb 4 1 Carbon Blackb 28 . M
None 5 1
-\
'3000 ppm active metal loading used with respect to solvent weight. bl .O g of Carbon Black added.
TABLE 2. Catalyst Dispersion
XRD size BET Surface Area Catalyst (002 plane of Mo, A) (m'43)
MoS, (unsup.) <25 260 AO-60 30 162 Mo-C-I 41 na
TABLE 3. Effect of Catalyst Type on Coal Liquefaction Experiments
Coal Conversion 4 Consumed Solvent Catalyst' (%maf coal) ( m o l ) Hydrogenation (%)
MoS, (unsup.) 95 55 13 A0-60 87 32 10
Shell-324 81 39 9
'1000 ppm active metal loadiig used with respect to mafcoal weight.
In the presence of a complex system, such as coal, the trends are altered, as shown in Table 3. There does not appear to be a significant difference between the supported and unsupported catalysts. If anything, the unsupported catalysts appear to outperform the supported catalysts. This is not surprising in that the effect of the addition of coal on the suppression of catalytic
117
d / hydrogenation activity of both the unsupported and supported catalysts has been previously
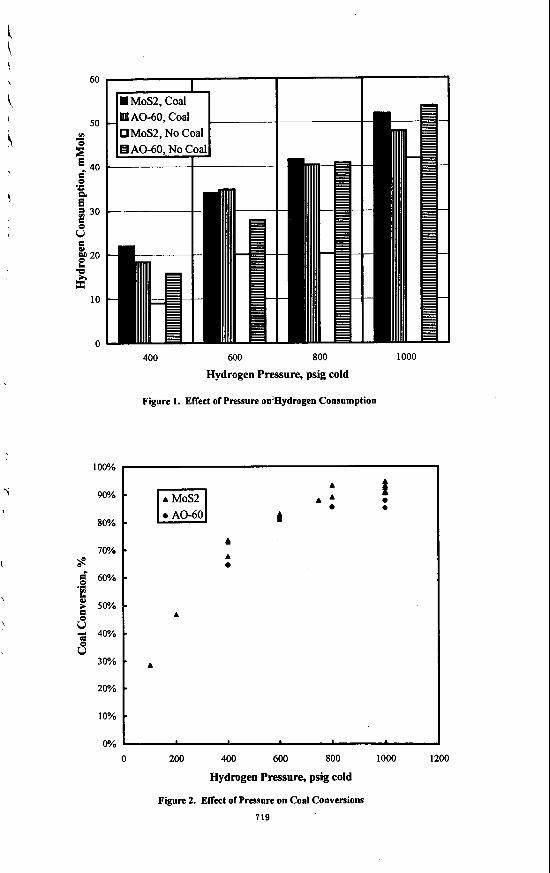
reported [11,12]. The unsupported MoS, and supported AO-60 catalysts are compared with respect to the effect of 5 pressure on 5 consumption and coal conversion in Figures 1 and 2 respectively. Figure 1 shows that the 3 consumption for the MoS, with no coal present was lower than that of the supported catalyst at all the pressures tested. However, as shown in Figures 1 and 2, the 11, consumptions and coal conversions, with coal present, are similar for both I
catalysts.
SUMMARY 1 The focus of this study was to compare the catalytic hydrogenation observed with supported and unsupported catalysts. In the tests with the 2-ring aromatic solvent (I-methylnaphthalene), the supported catalysts showed superior catalytic hydrogenation performance. Even the case where the support and catalyst precursor were added separately (Sulfated Fq0, + Carbon Black), the hydrogen consumption was greater than the unsupported catalyst alone. However, the performance of supported and unsupported catalysts in hydrogenation and conversion were comparable when coal was added to the system. Also, at an initial 3 pressure of 6.9 MPa (1000 psig) cold with coal present, the I-& consumptions and coal conversions are slightly higher for the unsupported catalyst experiments.
DISCLAIMER
Reference in this report to any specific commercial product, process, or service is to facilitate understanding and does not necessarily imply its endorsement or favoring by the United States Department of Energy.
BIBLIOGRAPHY
1. Derbyshire, F. J., Catalvsis in Coal Liquefaction: New Directions for Research, E A CWO8 June (1988).
i
2. Cugini, A. V., Krastman, D., Lett, R. G., and Balsone, V. D., CuruIysis To&y, 19(3), pp. 395-408 (1994).
3. Cugini, A. V., Martello, D. V., Baltrus, J. P., and Holder, G. D., Proceedings of rhe 17Ih Inremationul Conference on Coal Utilirarion and Sluny Technologies, Clearwater, FL, April 28-May 1, (1992).
4. Cugini, A. V., Ph. D. Dissertufion, University ofPittsburgh (1993).
5 . Pradhan, V. R., Hemck, D. E., Tierney, J. W., and Wender, I., "Finely Dispersed Iron, Iron-Molybdenum, and Sulfated Iron Oxides as Catalysts for Coprocessing Reactions,'' Energy mtdhels , 5(5), pp. 712-720 (1091).
6. Ciocco, M. V., Cugini, A. V., Rothenberger K. S., Veloski, G. A,, and Schroeder, K. T., "Effect of Pressure on First Stage Coal Liquefaction with Dispersed Catalysts," Proceedings of the Eleventh Annual International Pittsburgh Coal Conference, Pittsburgh,
7. Hackett, J. P. and Gibbon, G. A In Automated Stream Analvsis for Process Control, Manka, D. P., ed., Academic Press, pp. 95-117, (1982).
8. Schmidt, C. E., Sprecher, R. F., and Batts, B. D., Anal Chem.. 59, pp. 2027-2033, (1987).
9. Schmidt, C. E. and Sprecher, R. F., In Novel Techniaues in Fossil Fuel Mass Soectrometrv. ASTM STP 1019, Ashe, T. R. and Wood, K. V., eds., American Society for Testing and Materials: Philadelphia, PA, pp. 116-132, (1989).
10. Boudart, M. and Djega-Mariadassou, G., In Kinetics of Heterogeneous Catalytic Reactions, Princeton University Press, Princeton, NJ, pp, 205-206, (1982).
11. Rothenberger, K. S., Cugini, A. V., Schroeder, K. T., Veloski, G. A,, Ciocco, M. V., "The Effect of Coal Addition on Solvent Hydrogenation and Coal Conversion in a Model Alkylnaphthalene Solvent," Proceedings; ACS Div. of Fuel Chem., 39(1), (1994).
12. Ciocco, M. V., Cughi, A. V., Rothenberger K. S., Veloski, G. A,, and Schroeder, K. T., "The Effect of Hydrogen Pressure on First-Stage Coal Liquefaction with Dispersed and Supported Catalysts; the Role of Catalyst in Hydrogen Transfer," Presented at the American Institute of Chemical Engineers, 1995 Annual Meeting, November 12-17, (1995).
PA, pp, 500-505, (1994).
718
! i 60
\\ 50 I
\
00 AO-60, Coal UMoS2, No Coal
IH AO-60, No (
10
0 400
100%
90%
80%
70%
60%
50%
40%
30%
20%
10%
0%
600 800 1000
Hydrogen Pressure, psig cold
Figure 1. ENect of Pressure on-ydrogen Consumption
A
A A i
I e
4
A
A
A
0 200 400 600 800 1000 1200
Hydrogen Pressure, psig cold
Figure 2. E l k t of Pressure on Coal Convenions
719
COMPONENTS OF OIL DERIVED FROM LIQUEFACTION OF HYDROCARBON-RICH MICROALGAE
Seiichi INOUE, Shigeki S4WAYAMA and Tomoko OGI National Institute for Resources and Environment, 16-3 Onogawa, Tsukuba, Ibaraki 305, Japan
Keywords: Botryococcus braunii, liquefaction, components
ABSTRACT Botryococcus brounii is a colonial green microalga that produces and accumulates oily
hydrocarbons called botryococcenes(C30-36). Liquefaction was applied to B. braunii for recovery of hydrocarbons. The liquefied oil was obtained with yield of 64% at 300°C. The oil was fractionated into three fractions by silica gel column chromatography and analyzed to determine its composition. The yields of three fractions were 5% of low molecular weight hydrocarbons, formed by degradation of botryococcenes, 27.2% of botryococcenes and 22.2% of polar substances, produced from organic materials other than hydrocarbons through liquefaction. Further analysis using GC-MS identified some components of the oil. Main components of low molecular hydrocarbons and polar substances were C 17-22 hydrocarbons and C14-20 fatty acids, respectively.
INTRODUCTION The use of biomass for energy is largely motivated from the standpoint of global
environmental issues. Biomass-derived fuels would reduce greenhouse gas concentrations to the extent that they could replace fossil fuels currently being used. Botryococcus brcrunii is a unique colonial green microalga that produces and accumulates oily hydrocarbons, called botryococcenes (C30-36). with a dry weight range of 17-86%.' These hydrocarbons can be upgraded to transport fuels by hydrocracking2 or catalytic cracking3 after being recovered from the algal cells.
On a laboratory scale, the hydrocarbons of algal cells are separated by extraction with organic solvent after their freeze-drying and sonicating. However, this method is not suitable for large scale separations due to the high cost. Therefore, an effective method is needed for separating hydrocarbons from algal cells. We have proposed a new method for separating hydrocarbons from algal cells by directliquefaction. Applying this process to E.braunii, a greater amount of oil than that obtained from B.braunii was achieved with yields of 57-64% at 300°C compared to our previous work.4 Liquefaction could be an effective method for converting the algal cells of B.braunii into oil.
The analysis of the oil is important for providing preliminary information about the conversion of organic materials and for the recovery of hydrocarbons produced from the algal cells. In this paper, we analyzed the components of the liquefied oil and determined the suitable reaction conditions needed for the recovery of b'otryococcenes from B.braunii.
EXPERIMENTAL A l g d strain and butryococcenes extraction
The Berkeley strain of B.braunii was used for the liquefaction. This strain produces mainly C34H58.5 The algal cells of Kbraunii were filtered using a 20 p n nylon mesh and then freeze-dried. The algal cells (943 g) were ultrasonically extracted with 50 ml of hexane for 30 min. The extract was chromatographed on a silica gel column with hexane as the eluent i n order to obtain Botryococcenes (36% of dry cell weight). Liquefaction
Liquefaction of B.braunii was performed in a 300 ml autoclave at 200, 300 or 340"C, with or without Na2C03 as the catalyst. Liquefied oil was extracted from the reaction mixture with CH2C12. Details of the liquefaction procedure were reported in a previous study.4 Frtictionation
The liquefied oil was separated into three fractions. The procedure for fractionation is provided in Fig. I . The liquefied oil was chromatographed on a silica gel column with 200 ml hexane and 200 ml diethylether. The first 100 ml of the hexane eluate gave FI. The next 100 ml of the hexane eluate was F2, and the 200 ml of the diethylether eluate was F3. Analysis
The mean molecular weight of the respective fractions was measured using the I17 Molecular Weight Apparatus (Corona, Japan). Elemental composition of the respective fractions was analyzed using a 2400 CHN Elemental Analyzer (Perkin-Elmer, USA). The GC analysis was carried out using a capillary column (DB-I, 30 m x 0.25 mm, Hewlett-Packard, USA). The initial oven temperature was held at I W C for I O min, then heated to 220°C at 3 'C min-I. The temperatures of the injector and FID were 220°C and 240"C, respectively. The GC- MS (DB-I, 30 m x 0.25 mm, Hewlett-Packard, USA) analysis was carried out under the same condition.
It gave an oil as hexane extracts (50% of dry cell weight).
RESULTS AND DISCUSSION The properties of FI, F2 and F3 and of botryococcenes extracted from the algal cells are
shown in Table 1. The mean molecular weight of FT was i n the range of 438-572, and that of
720
botryococcenes in the algal cells was 472. The elemental composition of F2 was in good agreement with that of botryococcenes. In addition, the GC retention time of F2 coincided well with the retention time of the botryococcenes. From these results, F2 was identified as the botryococcenes. Elemental analysis showed that FI was hydrocarbons and the mean molecular weight of F1 was in the range of 197-281. These results suggest that FI is some kind of degraded product of the botryococcenes. F3 contained oxygenated compounds. Since F3 contained oxygen compounds, they may be produced from organic materials except for the hydrocarbons through liquefaction. From these results, we could confirm that FI, F2 and F3 were low molecular weight hydrocarbons, botryococcenes and polar substances, respectively.
Figure 2 shows the yield of each fraction of the liquefied oil and hexane extracts from the algal cells. The recovery (75%) of the botryococcenes in the liquefied oil was obtained when the liquefaction was carried out at 300°C in the presence of a catalyst (5% sodium carbonate). The yields of the three fractions based on an organic basis were 5% low molecular weight hydrocarbons, 27.2% botryococcenes, and 22.2% polar substances.
The recovery of the botryococcenes was improved with the use of a catalyst at the reaction temperatures of 200 and 300°C (Fig. 2). The quantitative difference in the recovery of the botryococcenes between 200°C and 300°C with a catalyst was very small, but recovery at 340°C decreased. The reaction temperature of 200°C is a preferable reaction temperature from the standpoint of energy use. The liquefaction process can be used for recovery of the botryococcenes as well as the conversion of the algal cells into oil. The total recovery of the fractions (FI, F2 and F3) was in the range of 70-88 wt% for the liquefied oils. The liquefied oil of E. brcrunii had a small amount (1%) of nitrogen. but the fractions (FI, F2 and F3) from the silica gel column contained no nitrogen. The loss is most likely due to the strong adsorption of highly polar components in the liquefied oil onto the silica gel.
Further analysis using GC-MS identified some components of the liquefied oil obtained at 300'C with a catalyst. Table 2 shows the main components of low molecular hydrocarbons and polar substances. The main components of low molecular hydrocarbons were C17-22 hydrocarbons. It is thought that these compounds were formed by degradation of botryococcenes in the algal cells. On the other hand, the main components of the polar substances were C14-20 fatty acids. Except for these compounds, many compounds were identified. From the standpoint of the reaction mechanism during the liquefaction of B.bruunii, it is very interesting that a methoxyl compound was identified. Ether compounds were found in some strains of B.braunii.6.7 The methoxyl compound may be produced during the liquefaction. Phenol and pyrrolidine compounds, which are absent in the cell, were also identified. They are formed by the degradation and combination of the constituents, such as proteins, in the algal cell.
CONCLUSION The oil derived from the liquefaction of B.brcrunii consisted of three fractions: low
molecular hydrocarbons, botryococcenes and polar substances. From an analysis using GC-MS of the oil obtained at 300'C with a catalyst, the main components of the low molecular hydrocarbons and polar substances were C17-22 hydrocarbons and C14-20 fatty acids, respectively. The recovery of botryococcenes was 75%. The recovery of the botryococcenes was improved using a catalyst at reaction temperatures of 200 and 300°C.
REFERENCES 1. T.G. Tornabene, Microorganisms as hydrocarbon producers Experienriu 38.43-46 (1982). 2. L.W. Hillen, G . Pollard, L.V. Wake and N. White, Hydrocracking of oils of Borryococcus
bruunii to transport fuels. Eiofechnol. Bioeng. XXIV, 193-205 (1982). 3. H. Kitazato, S. Asaoka and H. Iwamoto, Catalytic cracking of hydrocarbons from
microalgae. Sekiyu Gukkuishi 32( I), 28-34 (1989). 4. Y. Dote, S. Sawayama, S. Inoue, T. Minowa and S. Yokoyama. Recovery of liquid fuel
from hydrocarbon-rich microalgae by thermochemical liquefaction. Fuel 73, 1855- 1857 ( 1994)
5 . I. R. Maxell, A. G . Douglas, G. Eglinton, and A. McCormick, The botryococcenes- hydrocarbons of novel structum from the alga Botryococcus braunii, Kiitzing. Phorochernisfry 7,2157-2171 (1968).
6. P. Metzger and E. Casadevall, Botryococcoid ethers, ether lipids from Eorryococcus braunii. Phoruchernisrry 30. 1439 (1991).
7. P. Metzger and E. Casadevall, Ether lipids from Borryococcus bruunii and their biosynthesis. Pharochemisrry 31,2341 (1992).
721
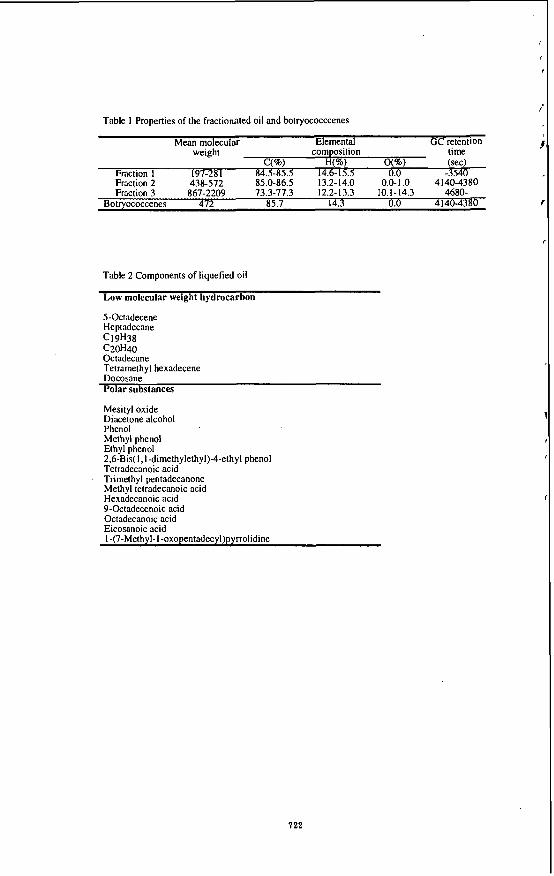
Table I Properties of the fractionated oil and botryococccenes
Mean molecular Elemental GC retention weight composition time
C(%) H(%) O(%) (sed Fraction I 197-281 84.5-85.5 14.6-15.5 0.0 -3540 Fraction 2 438-572 85.0-86.5 13.2-14.0 0.0-1.0 4140-4380 Fraction 3 867-2209 73.3-77.3 12.2-13.3 10.1-14.3 4680-
Botryococcenes 472 85.7 14.3 0.0 4140-4380
Table 2 Components of liquefied oil
Low molecular weight hydrocarbon
5-Octadecene Heptadecane Cl9H38 C20H40 Octadecane Tetramethyl hexadecene Docosane Polar substances
Mesityl oxide Diacetone alcohol Phenol Methyl phenol Ethyl phenol 2,6-Bis( I , 1 -dimethylethyl)-4-ethyl phenol Tetradecanoic acid
' Trimethyl pentadecanone Methyl tetradecanoic acid Hexadecanoic acid 9-Octadecenoic acid Octadecanoic acid Eicosanoic acid 1 -(7-Methyl- I -oxopentadecyl)pyrrolidine
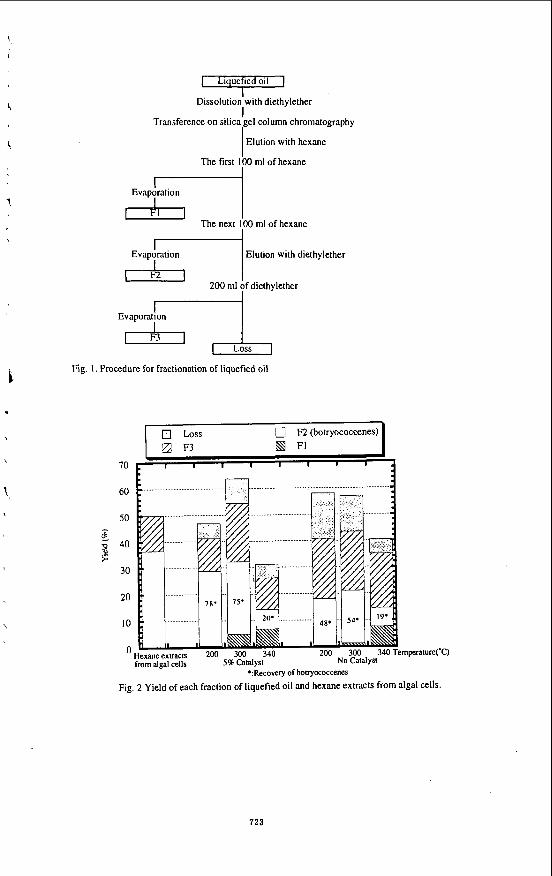
Dissolution with diethylether
Transference on silica gel column chromatography I
Elution with hexane
The first 100 ml of hexane
Elution with diethylether
200 ml of diethylether I
I Evaporation
L
[7 Loss 0 F2 (botryococcenes) a F3 8 FI
< I I I I I I I I
*:Recovew of bowococcenes
Fig. 2 Yield of each fraction of liquefied oil and hexane extracts from algal cells.
723
DEMETALLATION OF WASTE OIL WITH COAL
Edward C. Orr, Lian Shao, Edward M. Eyrhg Department of Chemistry, University of Utah, Salt Lake City, UT 841 12
KEYWORDS: Demdation, Waste Oils, Coprocessing
INTRODUCTION
The breakdown of coal into liquid fuels has been researched extensively in order to improve upon the economics of the process. To produce liquid fuels from hydrogen deficient coal, hydrogen must be added. Weisz noted that for the most hydrogen deficient coals, it would be necessary to add 8 % by weight hydrogen to produce quality hydrocarbons.' One way to decrease the cost of coal liquefaction would be to minimize the need for expensive hydrogen. By coprocessing coal with heavy petroleum resids, the resid may act as a hydrogen donor for the coal diminishing the need for additional costly hydrogen gas.' In coprocessing resids with coal it has also been shown that some of the nickel and vanadium that are naturally abundant in the resid reside in the coal char and ash after coprocessing.'
More recently, it has been shown that coprocessing waste materials (plastics, rubbers, and waste lubricants) with coal can decrease the cost of coal liquefaction.' In addition, coprocessing of coal with waste materials has also been shown to enhance coal conversion to liquids.' The addition of waste materials to coal liquefaction reactions also means the addition of heavy metals. Waste rubber tires contain zinc6 and waste lubricants can contain a variety of heavy metals such as iron, manganese, and found in waste automotive oil will reside in coal char and ash after copr~cessing.~ Demetallation of the trace heavy metals in waste automotive oils was not found to be dependent upon the rank of coal. Out of six different coals used in the demetallation experiments, Illinois #6 coal showed the best demetallation effect. The Illinois #6 has a high content of inorganic matter which has been suggested to have influence on the degree of demetallation. The present paper reports &her experiments carried out with Illinois #6 and demineralized Illinois #6 in order to determine the effect of the inorganic portion of the coal on demetallation of waste automotive oil. The extent of the demetallation of the produced oil is reported. X-ray photoelectron spectroscopy (XPS) was used to analyze the surface of the coals before and after demineralization.
EXPERIMENTAL
Illinois #6 was obtained from the Pennyslvania State Coal Sample Bank. The Illinois #6 was used as received (-60 mesh). At all times the coal was stored under a nitrogen atmosphere. The waste automotive oil was obtained from Interline Resources Inc. (Salt Lake City, Utah). The waste automotive oil was stored under ambient conditions and used as received. Demineralization of the Illinois #6 coal was carried out by mixing 500 mL of 6 N HCI with 20 g of Illinois #6 at approximately 45 OC for 1 hour. The coal was then filtered. The filtered coal was then mixed with 250 mL of concentrated HF at ambient conditions for 1 hour. The coal was again filtered. The coal was then treated with 250 mL of 12 N HCI at 45 "C for 1 hour. The coal was then filtered and washed with deionized water until no chloride was precipitated by addition of silver nitrate. The demineralized coal and the untreated coal were dried at 100 "C under vacuum for 2 hours. The dried demineralized and dried untreated coal were then mixed with waste automotive oil in a 1: 1 ratio determined by weight. Samples were placed in stainless steel tubing reactors which have volumes of 27 cm3. Tubing reactors were sealed and then purged with nitrogen gas and finally pressurized to 1000 psig (cold) of hydrogen. Tubing reactors were placed in a f l u i d 4 sandbath and shaken vertically at a rate of 160 rpm. The temperature ofthe sandbath was maintained at 430 OC for 1 hour. M e r liquefaction the tubing reactor was removed from the sandbath and cooled at room temperature for 5 minutes and h a U y quenched in cold water. The sample was scraped out of the tubing reactor and placed in a Soxhlet extraction thimble. The internal surfaces of the
Recent results indicate trace heavy metals
724
1, tubing reactor were washed with tetrahydrohan (THF). The THF wash was then placed in the before mentioned extraction thimble. The material was then extracted with THF using a Soxhlet extractor for 48 hours. The nonsoluble portion was dried and weighed in order to calculate the total conversion on a dry ash free. The THF soluble portion was run through a rotary evaporator to remove the THF. The THF soluble portion was then dried under vacuum at 430 "C for 2 hours. The THF soluble portion was extracted with cyclohexane. The portion that is insoluble in cyclohexane is referred to as asphaltenes. The cyclohexane was removed from the cyclohexane soluble portion with a rotary evaporator. The residue was then dried under vacuum at 100 "C for 2 hours. The cyclohexane soluble portion is referred to as oil. The ICP analyses were completed by Data Chem Laboratories, Salt Lake City, UT. The X P S results were obtained from a FISONS ESCALAB 22%-XL using a six channel detection system. Samples were mounted upon double sided 3M tape. on top of a metallic sample holder. Charging effects were countered by using an electron flood gun.
RESULTS
Proximate and ultimate analyses of the untreated Illiinois #6 coal are given in Table 1 .' The Illinois #6 coal is a high volatile C bituminous coal. Table 2 shows a comparison of ICP analyses of untreated coal and demineralized coal. There is a sigmficaat ditrerence in the amount of inorganic matter present in the untreated coal and the demineralized coal. Table 2 shows a substantial decrease in naturally abundant metals such as aluminum, calcium, iron, and sodium for the demineralized coal. This indicates that the demineralization process was effeaive in removing a substantial fraction of the inorganic constituents.
X P S analysis of the untreated and the demineralized Illinois #6 coal indicates a decrease in inorganic matter at the surface of the demineralized coal. The XPS analysis of the untreated Illinois #6 coal detected sodium, aluminum, silicon, sulfur, and calcium. XPS analysis of the demineralized coal detected only sulfur and calcium. This indicates that some of the inorganics on the surface of the coal were effectively removed by the demineralization process. From the ICP result, iron makes up over 2 % by weight of the total Illinois #6 coal. Detection of the iron by XPS was not achieved. Past investigators have also reported that detection of iron on the surface of coal is diffic~lt.~. '~ We assume that most of the iron present resides in the bulk coal structure and not upon the coal surface.
The waste automotive oil was analyzed by ICP to determine the type of trace heavy metals present. The results are shown in Table 3. The phosphorous and zinc are present due to an antiwear lubricant, zinc dialkyldithiophosphate, added to the motor oil."
Table 4 shows the liquefaction conversion data for reacting untreated Illinois #6 and demineralized Illinois #6. The untreated Illinois #6 showed better total conversion than the dermneralized coal probably because of the decrease in iron in the demineralized coal. Decreasing the iron content decreases the pyrrhotite formation. Pyrrhotites are known to act as coal Liquefaction catalysts.'*
The last two columns of Table 3 shows the ICP analysis of the product oils or the cyclohexane soluble portion of the coal and waste automotive oil reactions. The product oil from both the untreated and the demineralized coal are free. of al l the elements detected in the untreated waste automotive oil except for some sodium detected in the oil sample from the demineralized coal
Demineralization of the Illinois #6 decreased the inorganic portion of the coal substantially. The iron content was decreased from 2.3 % t o 1.5 %yet the presence of 1 % iron or more would still be sufficient enough for catalytic sulfide will function as a catalyst aiding in dissolution of the coal forming gas, oil, asphaltenes, and char. In coprocessing experiments conducted with resids, Miller et al. concluded that new char formation was responsible for demetallation.'' In past studies completed in this laboratory, trace heavy metals initially in the automotive oil were found to be more abundant in
The remaining iron in the form of iron
725
asphaltenes.’ The asphaltenes are precursors to char. Retrogressive reactions allow asphaltenes, laden with heavy metals, to form char which may then trap or embed the heavy metals. Therefor, iron sulfide enhances formation of asphaltenes and indirectly char which traps heavy metals, Thus the iron inherent in the coal may aid in demetallation of the waste automotive oil.
CONCLUSION
Demineralized Illinois #6 coal showed no detectable difference for demetallation of waste automotive oil in coprocessing reactions when compared to untreated Illinois #6 coal. The inorganic portion of the coal, except the iron, seems to have little efFeet upon the demetallation characteristics of the coal.
ACKNOWLEDGMENTS
We gratemy acknowledge the donation of waste automotive crankcase oil by Professor Larry L. Anderson (Department of Chemical and Fuels Engineering, University of Utah, Salt Lake City, UT) and Interline Resources Inc., (Salt Lake City, UT). Financial support by the U.S. Department of Energy, Fossil Energy Division, through the Consortium for Fossil Fuel Liquefaction Sciences, Contract No. UKRF-4-21033-86-24, is also gratefully acknowledged.
REFERENCES
1 2 3 4 5
6
7
8 9 IO
11
12
13
14
Weisq P.B., Chemtech, 1982, 12, 114. Shen, J.; Curtis, C.W., Prepr. Pap. Am. Chem. SOC. Div. Fuel Chem., 1995,40 (3), 622. Cugini,A.V.;Lett,R.G.,Energy&Fuels, 1989,3, 120. Gray, D.; Tomlinson, G., Prepr. Pap. Am. Chem. SOC. Div. Fuel Chem., 1995,40 (I), 20. Orr, E.C.; Tuntawiroon, W.; Ding, W.B.; Bolat, E.; Rumpel, S.; Eyring, E.M.; Anderson, L.L., Prepr. Pap. Am. Chem. SOC. Div. Fuel Chem., 1995,40 (I), 44. Orr, E.C.; Tuntawiroon, W.; Anderson, L.L.; Eying, E.M., Prepr. Pap. Am. Chem. SOC. Div. Fuel Chem., 1994, 39 (4), 1065. Orr, E.C.; Shi, Y.; Liang, J.; Ding, W.; Anderson, L.L.; Eyring, E.M., Prepr. Pap. Am. Chem. SOC. Div. Fuel Chem, 1995,40 (3), 633. Pennyslvania State Coal Sample Bank Weitzacker, C.L.; Gardella, Jr., J.A , Anal. Chem., 1992,64,1068. Kelemen, S.R.; Gorbaty, M.L.; George, G.N.; Kwiatek, P.J., Energy & Fuels, 1991, 5, 720. Tamer, A.R., Technical Report on DOE Contract No. DE-FC22-93PC93053, Period: May 1, 1994-0ctober31, 1994, pp. 150. Pradhan, V.R.; Hu, J.; Tierney, J.W.; Wender, I., Prepr. Pap. Am. Chem. SOC. Div. Fuel Chem., 1993,38 (I), 8. Sommerfeld, D. A. ; Tuntawiroon, W.; Anderson, L.L, Eyring, E.M., Prepr. Pap. Am. Chem. SOC. Div. Fuel Chem., 1993,38 (I) , 21 1. Miller, T. J. ; Panvelker, S.V.; Wender, I.; Tierney, J. W., Fuel Processing Technology, 1989, 23,23.
726
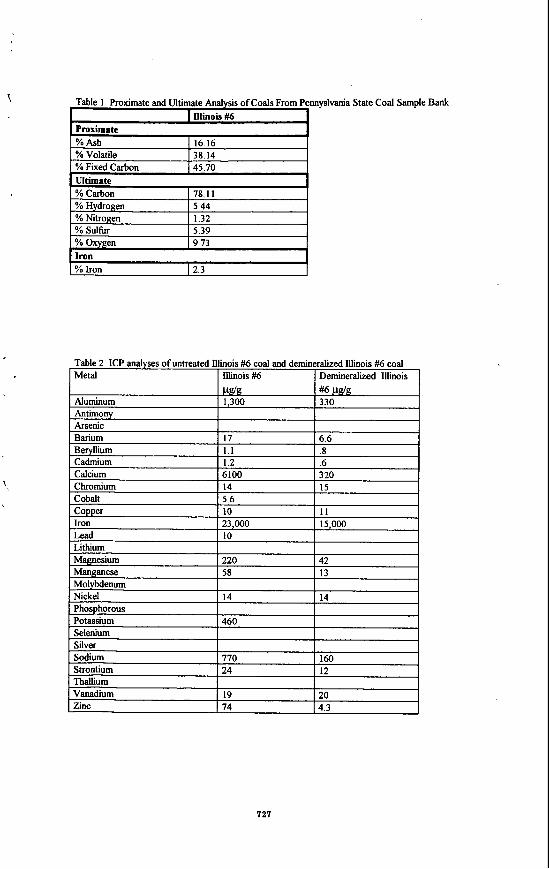
Table 1 Proximate and Ultimate Analysis of Coals From Penny I nlinois #6
% Ash % Volatile % Fixed Carhon
16.16 38.14 45 70
Ultimate % Carbon 178.11 1 % H dro en %Nitro en % Sulfur
9.73 Iron YO Iron 12.3 I
State coal Sample
727
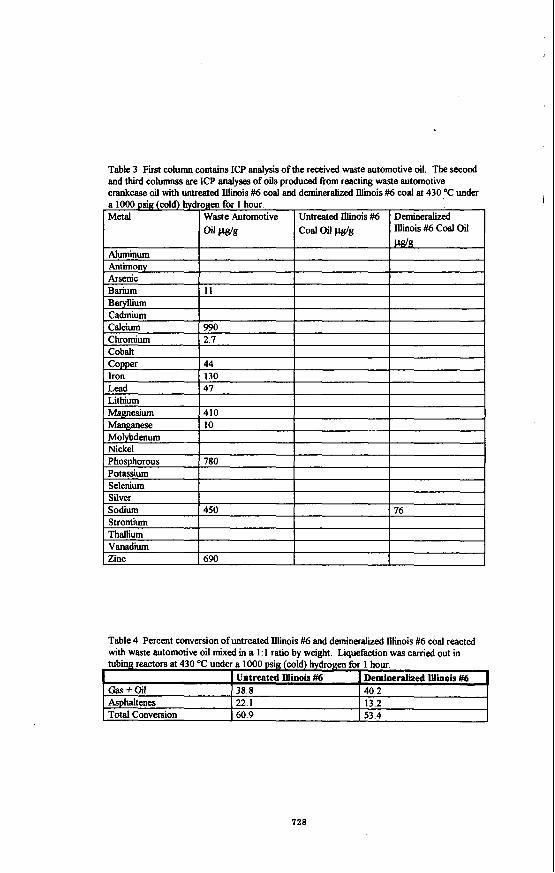
Table 3 First column contains ICP analysis of the received waste automotive oil. The second and third columnss are ICP analyses of oils produd fiom reacting waste automotive crankcase oil with untreated Illinois #6 coal and demineralized Illinois #6 coal at 430 ,'C under a 1000 psig (cold) hydrogen for 1 hour. Metal Waste Automotive Untreated Illinois #6 Demineralized
coal oil pg/g Illinois #6 Coal oil
*+oil Asphaltenes Total Conversion
Antimon
B Uium Cadmium Calcium chromium Cobalt
Lead Lithium
esium
Untreated IUinois #6 38.8 40.2 22.1 13.2 60.9 53.4
Demineralized Illinois #6
Pho horous Potassium Selenium Silver sodium Strontium
Vanadium I zinc
11
I I 990 L" I I
I
44 I I 1 130 I I 47
I I 410 10
780
450 76
690
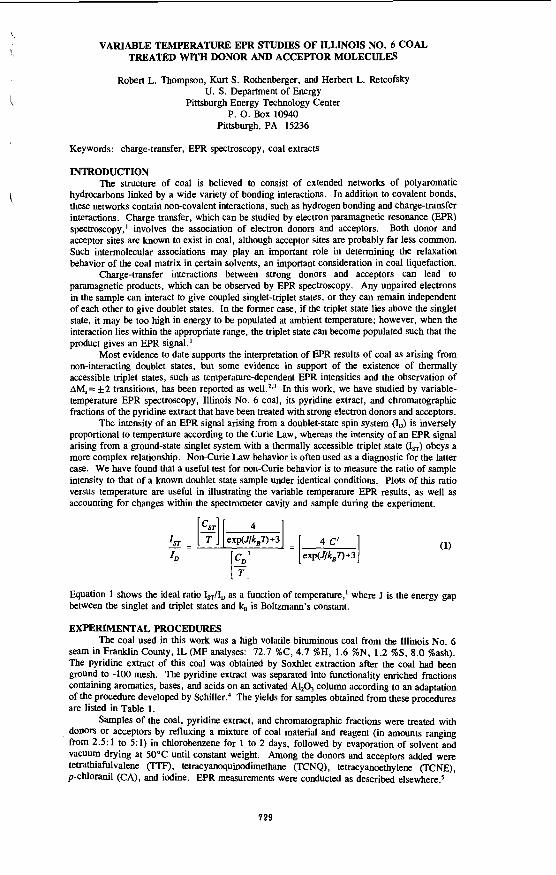
VARIABLE TEMPERATURE EPR STUDIES OF ILLINOIS NO. 6 COAL TREATED WITH DONOR AND ACCEPTOR MOLECULES
Robert L. Thompson, Kurt S. Rothenberger, and Herbert L. RetcofskY U. S. Department of Energy
Pittsburgh Energy Technology Center P. 0. Box 10940
Pittsburgh, PA 15236
Keywords: charge-transfer, EPR spectroscopy, coal extracw
INTRODUCTION The structure of coal is believed to consist of extended networks of polyaromatic
hydrocarbons linked by a wide variety of bonding interactions. In addition to covalent bonds, these networks contain non-covalent interactions, such as hydrogen bonding and charge-transfer interactions. Charge transfer, which can be studied by electron paramagnetic resonance (EPR) spectroscopy,l involves the association of electron donors and acceptors. Both donor and acceptor sites are known to exist in coal, although acceptor sites are probably far less common. Such intermolecular associations may play an important role in determining the relaxation behavior of the coal matrix in certain solvents, an important consideration in coal liquefaction.
Charge-transfer interactions between strong donors and acceptors can lead to paramagnetic products, which can be observed by EPR spectroscopy. Any unpaired electrons in the sample can interact to give coupled singlet-triplet states, or they can remain independent of each other to give doublet states. In the former case, if the triplet state lies above the singlet state, it may be too high in energy to be populated at ambient temperature; however, when the interaction lies within the appropriate range, the triplet state can become populated such that the product gives an EPR signal.’
Most evidence to date supports the interpretation of EPR results of coal as arising from non-interacting doublet states, but some evidence in support of the existence of thermally accessible triplet states, such as temperature-dependent EPR intensities and the observation of AM,= *2 transitions, has been reported as W ~ I I . ~ , ~ In this work, we have studied by variable- temperature EPR spectroscopy, Illinois No. 6 coal, its pyridine extract, and chromatographic fractions of the pyridine extract that have been treated with strong electron donors and acceptors.
The intensity of an EPR signal arising from a doublet-state spin system (ID) is inversely proportional to temperature according to the Curie Law, whereas the intensity of an EPR signal arising from a ground-state singlet system with a thermally accessible triplet state (I,) obeys a more complex relationship. Non-Curie Law behavior is often used as a diagnostic for the latter case. We have found that a useful test for non-Curie behavior is to measure the ratio of sample intensity to that of a known doublet state sample under identical conditions. Plots of this ratio versus temperature are useful in illustrating the variable temperature EPR results, as well as accounting for changes within the spectrometer cavity and sample during the experiment.
(1) = [ exp(JlkB0+3 4c1 I - 1, = [“I1 T exp(JlkB0+3 ]
I D [?I Equation 1 shows the ideal ratio IJI, as a function of temperature,’ where J is the energy gap between the singlet and triplet states and
EXPERIhlENTAL PROCEDURES The coal used in this work was a high-volatile bituminous coal from the Illinois No. 6
seam in Franklin County, IL (MF analyses: 72.7 %C, 4.7 %H, 1.6 %N, 1.2 %S, 8.0 %ash). The pyridine extract of this coal was obtained by Soxhlet extraction after the coal had been ground to -100 mesh. The pyridine extract was separated into functionality enriched fractions containing aromatics, bases, and acids on an activated A1,03 column according to an adaptation of the procedure developed by Schiller! The yields for samples obtained from these procedures are listed in Table 1.
Samples of the coal, pyridine extract, and chromatographic fractions were treated with donors or acceptors by refluxing a mixture of coal material and reagent (in amounts ranging from 2.5:l to 5:l) in chlorobenzene for 1 to 2 days, followed by evaporation of solvent and vacuum drying at 50°C until constant weight. Among the donors and acceptors added were tetrathiafulvalene (‘ITF), tetracyanoquinodirnethane (TCNQ), tetracyanwthylene (TCNE), p-chloranil (CA), and iodine. EPR measurements were conducted as described elsewhere.’
is Boltzmann’s constant.
729
RESULTS AND DISCUSSION i I The treated coal and pyridine extract samples were studied by variable temperature EPR
spectroscopy. Their EPR intensities were measured over a temperature range from -171°C to 23OC, then adjusted by dividing by the EPR intensities of DPPH obtained at identical temperature^.^ DPPH is a well-studied, stable, non-interacting doublet-state free radical that obeys the Curie Law over a wide temperature range.6 This method accounts for any experimental errors due to changes in sample or cavity characteristics with temperature?
In every case, the EPR intensities of the coal, extract, and extract fractions increased
a new spin for every molecule of reagent added. Neither was the magnitude of increase a function of the donor or acceptor strength of the added reagent; the acceptor with the largest electron a f f i t y did not always give the largest intensity increase.
Only the addition of TTF, a strong donor, resulted in any discernable change in the shape of the EPR spectrum. It gave rise to a another feature at lower field to the original broad, featureless, firstderivative lineshapes of the coal and extract; all other reagents failed to alter the original lineshape. A more defitive spectrum was obtained from the CH,CI, extract taken from the TTF-pyridine extract sample. The hyperfine stIucture shown in Figure 1 is strikingly similar to that in the EPR spectrum of (TTF)JBF+.' In Figure 1, both spectra are centered at a field corresponding to g = 2. This spectrum is assigned to the radical cation of TTF; its detection in the extract sample implies that there are acceptor sites in the coal capable of completely removing an electron from TTF.
Variable temperature EPR studies were made of all of the treated coal samples, the results of which are shown in Figure 2. The straight, horizontal plots of ~amp,c/IDPPH as a function of temperature imply that all of the coal samples obey the Curie Law at least as strictly as does DPPH, establishing them as consisting predominantly of doublet-state spins. The temperature range covered was sufficiently wide to have observed any thermally accessible triplet spins, if such had existed. Because the Curie Law was so strictly observed, the newly induced spins must either be doublet state spins or have interactions so weak that they are indistinguishable from doublet state spins.
Similar EPR results were obtained for the pyridine extract samples, shown in Figure 3, and are again indicative of adherence to the Curie Law for all samples. It is significant that coal extracts have a lower spin concentration than the whole coal; thus, were a small portion of thermally accessible triplet spins present in the treated coal, but obscured by a larger portion of native doublet spins, we would expect to observe them more readily in the extract. Because we do not see any deviation from Curie Law even in the extract samples, it is clear that thermally accessible triplet spins play no important role in the EPR behavior of whole coal.
Studies supporting the deviations from Curie Law in coal sample^^^^ have relied upon the mathematical deconvolution of EPR spectra, which is by nature artificial and rests on the questionable assumption that the heshapes of coal Signals are hrentzian. These studies also observe forbidden AM,= *2 transitions for certain coals. We have observed similar EPR signals in many of our samples under similar spectrometer conditions, but evidence does not support the assignment of these signals to Ahl,=L-2 transitions. The EPR spectra of Illinois No, 6 coal at a field corresponding to g = 4 are shown in Figure 4. These signals resonate at the appropriate field, but are extremely weak and their intensities do not vary with temperature. In fact, in some cases the observed signal was larger at -171°C than at 23°C. in contradiction to assignment to a thermally accessible triplet state. The location of these signals suggests that they are due to iron-bearing impurities such as kaolinite, which has been shown to possess a variety of low field signals from Fe(II1) substituting in the lattice for AI(II1) and Si(Iv.9
The only non-Curie Law behavior we have observed was associated with certain minor sub-fractions from coal extract. The fractions obtained from the pyridine extract displayed weak EPR signals similar in shape to that of the coal and extract. Variable temperature EPR results for the acidic fraction revealed that it obeys the Curie Law, but the results for the aromatic and basic fractions show some slight deviation. As seen in Figure 5 , their EPR intensity ratios are no longer horizontal, but slanted lines. This behavior is indicative of the presence of thermally accessible triplet spins. These fractions represent a minuscule portion of the whole coal and are likely overshadowed by the preponderance of doublet state spins,
The yields of individual fractions from the chromatographic separation were small. With this limited amount of sample, the donors and acceptors added to the fractions were limited to TTF and TCNE only. The EPR results for these treated fractions were surprising in that the aromatic sample obeyed Curie Law after treatment with TTF or TCNE, whereas the untreated aromatic fraction deviated from Curie Law. The acidic samples obeyed the Curie Law both before and after treatment with TTF or TCNE. The intensities of the treated basic samples deviated as strongly after treatment as before, particularly TTF-base, which had a curved rather than linear relationship to temperature, as shown in Figure 6.
The samples treated with TCNQ and TCNE were also studied by IR spectroscopy to monitor changes in the stretching frequency of the nitrile group, which has a frequency located in a region of the spectrum that is relatively free of absorptions for most coals. Larsen and co- workers" have shown the location of the stretching frequency for coals treated with these two electron acceptors to be very sensitive to the amount of electron density accepted. The nitrile
J
upon treatment with the donor or acceptor, although the increase was not commensurate with i
i I
730
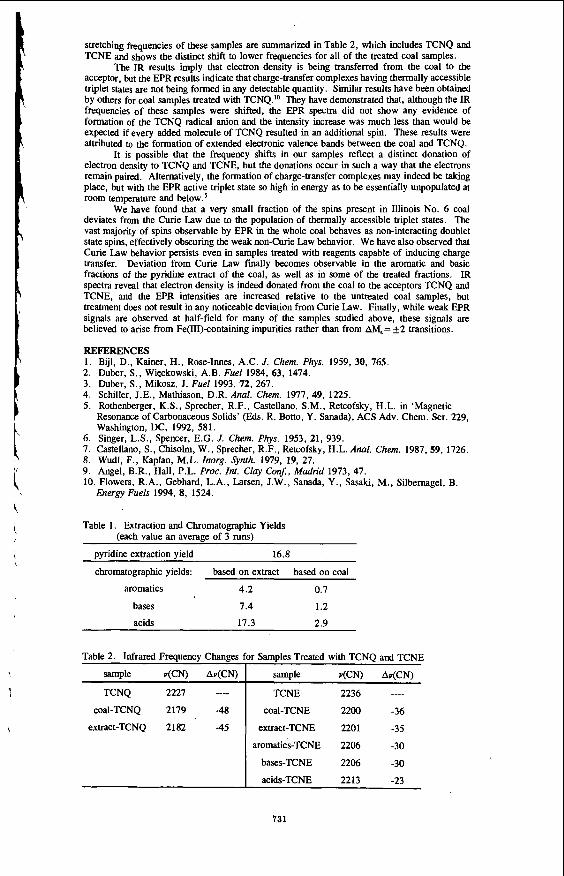
stretching frequencies of these samples are summrmd ’ in Table 2, which includes TCNQ and TCNE and shows the distinct shift to lower frequencies for all of the treated coal samples.
The IR results imply that electron density is being transferred from the coal to the acceptor, but the EPR results indicate that chargetransfer complexes having thermally accessible triplet states are not being formed in any detectable quantity. Similar results have been obtained by others for coal samples treated with TCNQ.’O They have demonstrated that, although the IR frequencies of these samples were shifted, the EPR spectra did not show any evidence of formation of the TCNQ radical anion and the intensity increase was much less than would be expected if every added molecule of TCNQ resulted in an additional spin. These results were attributed to the formation of extended electronic valence bands between the coal and TCNQ.
It is possible that the frequency shifts in our samples reflect a distinct donation of electron density to TCNQ and TCNE, but the donations occur in such a way that the electrons remain paired. Alternatively, the formation of charge-transfer complexes may indeed be taking place, but with the EPR active triplet state so high in energy as to be essentially unpopulated at room temperature and below.’
We have found that a very small fraction of the spins present in Illinois No. 6 coal deviates from the Curie Law due to the population of thermally accessible triplet states. The vast majority of spins observable by EPR in the whole coal behaves as non-interacting doublet state spins, effectively obscuring the weak non-Curie Law behavior. We have also observed that Curie Law behavior persists even in samples treated with reagents capable of inducing charge transfer. Deviation from Curie Law finally becomes observable in the aromatic and basic fractions of the pyridine extract of the coal, as well as in some of the treated fractions. IR spectra reveal that electron density is indeed donated from the coal to the acceptors TCNQ and TCNE, and the EPR intensities are increased relative to the untreated coal samples, but treahnent does not result in any noticeable deviation from Curie Law. Finally, while weak EPR signals are observed at half-field for many of the samples studied above, these signals are believed to arise from Fe(III)containing impurities rather than from A N = *2 transitions.
REFERENCES 1. Bijl, D., Kainer, H., Rose-Innes, A.C. J. Chem. Phys. 1959, 30, 765. 2. Duber, S. , Wieckowski, A.B. Fuel 1984, 63, 1474. 3. Duber, S. , Mikosz, J. Fuel 1993, 72, 267. 4. Schiller, J.E., Mathiason, D.R. Anal. Chem. 1977, 49, 1225. 5. Rothenberger, K.S., Sprecher, R.F., Castellano, S.M., Retcofsky, H.L. in ‘Magnetic
Resonance of Carbonaceous Solids’ (Eds. R. Botto, Y. Sanada), ACS Adv. Chem. Ser. 229, Washington, DC, 1992, 581.
6. Singer, L.S., Spencer, E.G. J . Chem. Phys. 1953, 21, 939. 7. Castellano, S., Chisolm, W., Sprecher, R.F., Retcofsky, H.L. Anal. Chem. 1987,59, 1726. 8. Wudl, F., Kaplan, M.L. Inorg. Synth. 1979, 19, 27. 9. Angel, B.R., Hall, P.L. Proc. Int. C l q Conf., Madrid 1973, 47. 10. Flowers, R.A., Gebhard, L.A., Larsen, J.W., Sanada, Y., Sasaki, M., Silbemagel, B.
Energy Fuels 1994, 8, 1524.
sample v(CN) Av(CN)
TCNQ 2227 ---- coal-TCNQ 2179 -48
extract-TCNQ 2182 -45
Table 1. Extraction and Chromatographic Yields (each value an average of 3 NIB)
pyridine extraction yield 16.8
chromatographic yields: based on extract based on coal
aromatics 4.2 0.7
bases 7.4 1.2
acids 17.3 2.9
sample v(CN) Av(CN)
TCNE 2236 ---- coal-TCNE 2200 -36
extract-TCNE 2201 -35
aromatics-TCNE 2206 -30
bms-TCNE 2206 -30
acids-TCNE 2213 -27
731
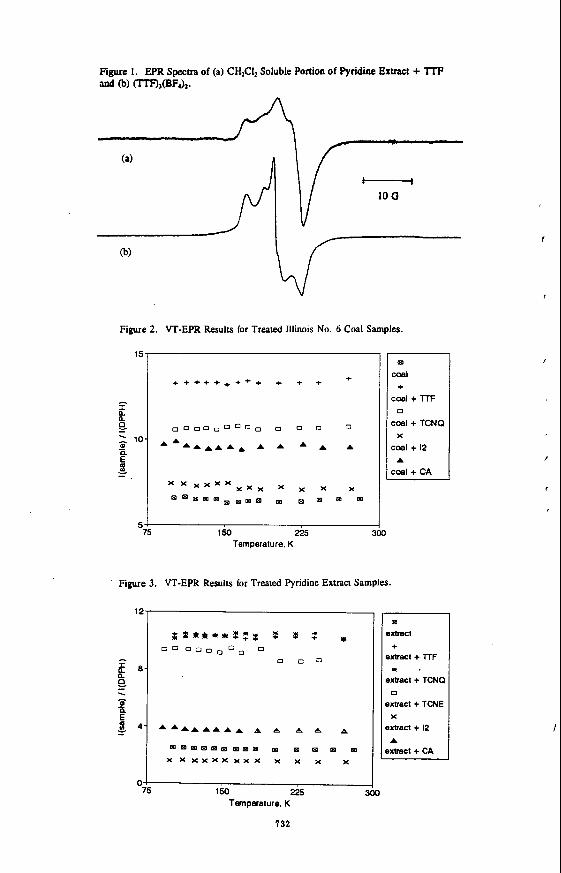
Figure 1. EPR Spectra of (a) CH2CI, Soluble Portion of Pyridine Extract + TIT and (3) m ( B F , X .
Figure 2. VT-EPR Results for Treated Illinois No. 6 Coal Samples.
I + + + + + + + + + + + + +
Figure 3. VT-EPR Results for Treated Pyridine Extract Samples.
0 0 0
0 75 150 225 :
Tmpetature. K
732
pD
coal
coal + l-rF
coal + TCNQ
coal + 12
coal + CA
+
0
X
A
m extract +
extract + l l F
extract + TCNa
extract + TCNE
extract + 12
emct + CA
) * . 0
X
A
r
I
I
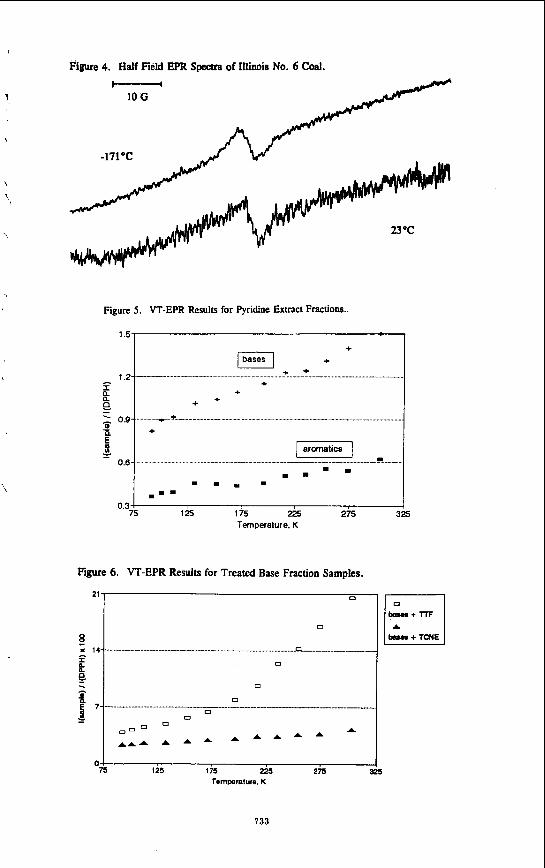
I
Figure 4. Half Field EPR Spectra of Illinois No. 6 Coal.
t.2,
t
+ (bases1 +
+ ____ z ...
,
10 G
23 "C
\ 0 - =
0.3 I 75 125 1 75 225 275
Temperature. K
Figure 6. VT-EPR Results for Treated Base Fraction Samples.
0
. - 0
0
0 ........................
0 0
125 175 Zi5 2js 3 Temperature, K
3i5
0
A bau3 + TCNE
733
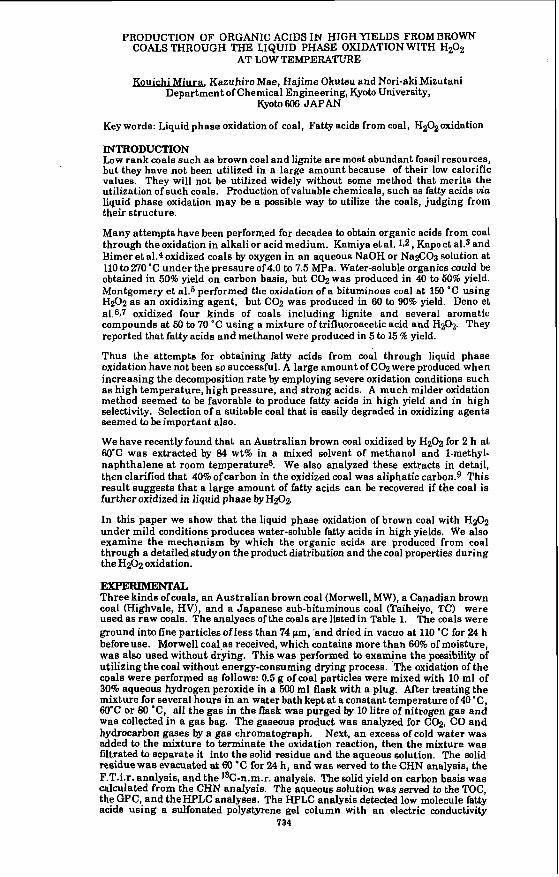
PRODUCTION OF ORGANIC ACIDS IN HIGH YIELDS FROM B R O W COALS THROUGH THE LIQUID PHASE OXIDATION WITH H202
AT LOW TEMPERATURE
K- Kazuhiro Mae, Hajime Okutsu and Nori-aki Mizutani Department of Chemical Engineering, Kyoto University,
Kyoto 606 JAPAN
Keywords: Liquid phase oxidation of coal, Fatty acids from coal, H202 oxidation
INTRODUCTION Low rank coals such as brown coal and lignite are most abundant fossil resources, but they have not been utilized in a large amount because of their low calorific values. They will not be utilized widely without some method that merits the utilization of such coals. Production ofvaluable chemicals, such as fatty acids via liquid phase oxidation may be a possible way to utilize the coals, judging from their structure.
Many attempts have been performed for decades to obtain organic acids from coal through the oxidation in alkali or acid medium. Kamiya et al. 12, Kapo et al.3 and Bimer et al.4 oxidized coals by oxygen in an aqueous NaOH or Na2C03 solution at 110 to 270 'C under the pressure of4.0 to 7.5 MPa. Water-soluble organics could be obtained in 50% yield on carbon basis, but C02 was produced in 40 to 50% yield. Montgomery et al.5 performed the oxidation of a bituminous coal at 150 "C using Hz02 as an oxidizing agent, but COz was produced in 60 to 90% yield. Deno et al.6,' oxidized four kinds of coals including lignite and several aromatic compounds at 50 to 70 "C using a mixture of trifluoroacetic acid and H202. They reported that fatty acids and methanol were produced in 5 to 15 % yield.
Thus the attempts for obtaining fatty acids from coal through liquid phase oxidation have not been so successful. A large amount of C02 were produced when increasing the decomposition rate by employing severe oxidation conditions such as high temperature, high pressure, and strong acids. A much milder oxidation method seemed to be favorable to produce fatty acids in high yield and in high selectivity. Selection of a suitable coal that is easily degraded in oxidizing agents seemed to be important also.
We have recentlyfound that an Australian brown coal oxidized by H202 for 2 h a t 60'C was extracted by 84 wt% in a mixed solvent of methanol and l-methyl- naphthalene at room temperatures. We also analyzed these extracts in detail, then clarified that 40% ofcarbon in the oxidized coal was aliphatic carbon.9 This result suggests that a large amount of fatty acids can be recovered if the coal is further oxidized in liquid phase byH202.
In this paper we show that the liquid phase oxidation of brown coal with H202 under mild conditions produces water-soluble fatty acids in high yields. We also examine the mechanism by which the organic acids are produced from coal through a detailed study on the product distribution and the coal properties during the H202 oxidation.
EXPERIMENTAL Three kinds ofcoals, an Australian brown coal (Morwell, MW), a Canadian brown coal (Highvale, HV), and a Japanese sub-bituminous coal (Taiheiyo, TC) were used as raw coals. The analyses of the coals are listed in Table 1. The coals were ground into fine particles of less than 74 pm, and dried in vacuo at 110 'C for .24 h beforeuse. Morwell coal as received, which contains more than 60% of moisture, was also used without drying. This was performed to examine the possibility of utilizing the coal without energy-consuming drying process. The oxidation of the coals were performed as follows: 0.5 g of coal particles were mixed with 10 ml of 30% aqueous hydrogen peroxide in a 500 ml flask with a plug. After treating the mixture for several hours in an water bath kept at a constant temperature of 4O'C, 60°C or 80 'C, all the gas in the flask was purged by 10 litre of nitrogen gas and w a s collected in a gas bag. The gaseous product was analyzed for C02, CO and hydrocarbon gases by a gas chromatograph. Next, an excess of cold water was added to the mixture to terminate the oxidation reaction, then the mixture was filtrated to separate it into the solid residue and the aqueous solution. The solid residue was evacuated at 60 'C for 24 h, and was served to the CHN analysis, the F.T.i.r. analysis, and the 13C-n.m.r. analysis. The solid yield on carbon basis was calculated from the CHN analysis. The aqueous solution was served to the TOC, the GPC, and theHPLC analyses. The HPLC analysis detected low molecule fatty acids using a sulfonated polystyrene gel column with an electric conductivity
734
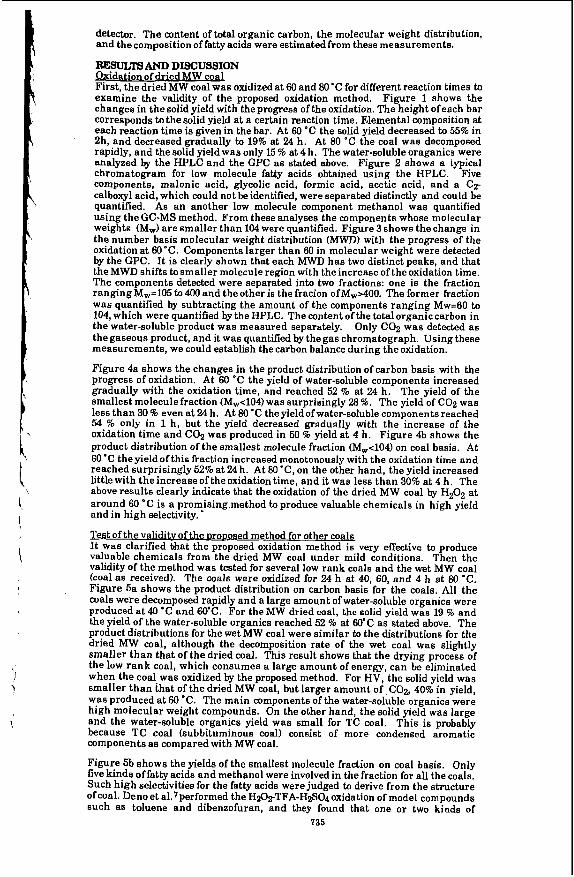
detector. The content of total organic carbon, the molecular weight distribution, and the composition of fatty acids were estimated from these measurements.
RESULTS AND DISCUSSION Oxidation of dried MW coal First, the dried MW coal was oxidized at 60 and 80 'C for different reaction times to examine the validity of the proposed oxidation method. Figure 1 shows the changes in the solid yield with the progress of the oxidation. The height of each bar corresponds to the solid yield at a certain reaction time. Elemental composition a t each reaction time is given in the bar. At 60 'C the solid yield decreased to 55% in 2h, and decreased gradually to 19% at 24 h. At 80 'C the coal was decomposed rapidly, and the solid yield was only 15 % at 4 h. The water-soluble oraganics were analyzed by the HPLC and the GPC as stated above. Figure 2 shows a typical chromatogram for low molecule fatty acids obtained using the HPLC. Five components, malonic acid, glycolic acid, formic acid, acetic acid, and a C z calboxyl acid, which could not be identified, were separated distinctly and could be quantified. As an another low molecule component methanol was quantified using the GC-MS method. From these analyses the components whose molecular weights (M,) are smaller than 104were quantified. Figure 3 shows the change in the number basis molecular weight distribution (MWD) with the progress of the oxidation at 60'C. Components larger than 60 in molecular weight were detected by the GPC. It is clearly shown that each MWD has two distinct peaks, and that the MWD shifts to smaller molecule region with the increase of the oxidation time. The components detected were separated into two fractions: one is the fraction ranging Mw=105 to 400 and the other is the fracion ofMw>400. The former fraction was quantified by subtracting the amount of the components ranging Mw=60 to 104, which were quantified by the HPLC. The content of the total organic carbon in the water-soluble product was measured separately. Only COz was detected as the gaseous product, and it was quantified by the gas chromatograph. Using these measurements, we could establish the carbon balance during the oxidation.
Figure 4a shows the changes in the product distribution of carbon basis with the progress of oxidation. At 60 'C the yield of water-soluble components increased gradually with the oxidation time, and reached 52 % at 24 h. The yield of the smallest molecule fraction (Mw<104) was surprisingly 28 %. The yield of COz was less than 30 % even at 24 h. At 80 'C the yield of water-soluble components reached 54 % only in 1 h, but the yield decreased gradually with the increase of the oxidation time and COz was produced in 50 % yield at 4 h. Figure 4b shows the product distribution of the smallest molecule fraction (Mw<104) on coal basis. At 60 "C the yield of this fraction increased monotonously with the oxidation time and reached surprisingly 52% at 24 h. At 80 'C, on the other hand, the yield increased littlewith the increase of the oxidation time, and it was less than 30% at 4 h . The above results clearly indicate that the oxidation of the dried MW coal by HzOz at around 60 "C is a promking method to produce valuable chemicals in high yield and in high selectivity.
Test of the validitv of the DroDosed method for other coals It was clarified that the proposed oxidation method is very effective to produce valuable chemicals from the dried MW coal under mild conditions. Then the validity of the method was tested for several low rank coals and the wet MW coal (coal as received). The coals were oxidized for 24 h at 40, 60, and 4 h at 80 'C. Figure 5a shows the product distribution on carbon basis for the coals. All the coals were decomposed rapidly and a large amount of water-soluble organics were produced at 40 'C and 60.C. For the MW dried coal, the solid yield was 19 % and the yield of the water-soluble organics reached 52 % at 60°C as stated above. The product distributions for the wet MW coal were similar to the distributions for the dried MW coal, although the decomposition rate of the wet coal was slightly smaller than that of the dried coal. This result shows that the drying process of the low rank coal, which consumes a large amount of energy, can be eliminated when the coal was oxidized by the proposed method. For HV, the solid yield was smaller than that of the dried MW coal, but larger amount of ,COz, 40% in yield, was produced at 60 'C. The main components of the water-soluble organics were high molecular weight compounds. On the other hand, the solid yield was large and the water-soluble organics yield was small for TC coal. This is probably because TC coal (subbituminous coal) consist of more condensed aromatic components as compared with MW coal.
Figure 5b shows the yields of the smallest molecule fraction on coal basis. Only five kinds of fatty acids and methanol were involved in the fraction for all the coals. Such high selectivitiesfor the fatty acids were judged to derive from the structure of coal. Den0 et al.7performed the HDrTFA-Hfi04 oxidation of model compounds such as toluene and dibenzofuran, and they found that one or two kinds of
735
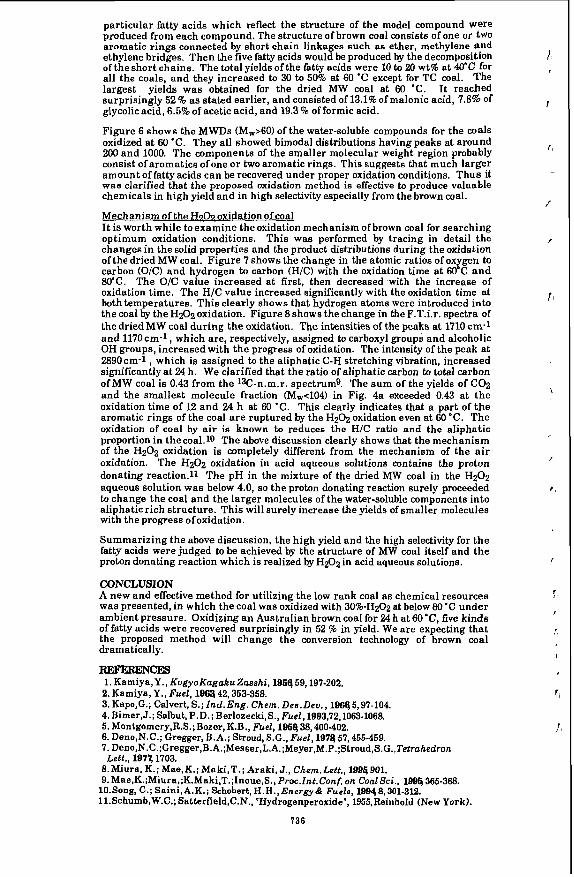
particular fatty acids which reflect the structure of the model compound were produced from each compound. The structure of brown coal consists of one or two aromatic rings connected by short chain linkages such as ether, methylene and ethylene bridges. Then the five fatty acids would be produced by the decomposition of the short chains. The total yields ofthe fatty acids were 10 to 20 wt% at 40°C for all the coals, and they increased to 30 to 50% at 60 'C except for TC coal. The largest It reached surprisingly 52 % as stated earlier, and consisted of 13.1% of malonic acid, 7.8% of glycolic acid, 6.5% of acetic acid, and 19.3 % of formic acid.
Figure 6 shows the MWDs (Mw>60) of the water-soluble compounds for the coals oxidized at 60 'C. They all showed bimodal distributions having peaks at around 200 and 1000. The components of the smaller molecular weight region probably consist of aromatics ofone or two aromatic rings. This suggests that much larger amount of fatty acids can be recovered under proper oxidation conditions. Thus it was clarified that the proposed oxidation method is effective to produce valuable chemicals in high yield and in high selectivity especially from the brown coal.
Mechanism of the HaOa oxidation of coal It is worth while toexamine the oxidation mechanism ofbrown coal for searching optimum oxidation conditions. This was performed by tracing in detail the changes in the solid properties and the product distributions during the oxidation of the dried MW coal. Figure 7 shows the change in the atomic ratios of oxygen to carbon (O/C) and hydrogen to carbon (H/C) with the oxidation time at 60°C and 80.C. The O/C value increased at first, then decreased with the increase of oxidation time. The H/C value increased significantly with the oxidation time at both temperatures. This clearly shows that hydrogen atoms were introduced into the coal by the H2Oz oxidation. Figure 8 shows the change in the F.T.i.r. spectra of the driedMW coal during the oxidation. The intensities of the peaks at 1710 cm-1 and 1 1 7 0 ~ m - ~ , which are, respectively, assigned to carboxyl groups and alcoholic OH groups, increased with the progress of oxidation. The intensity of the peak at 2890cm-1 , which is assigned to the aliphatic C-H stretching vibration, increased significantiyat 24 h. We clarified that the ratio of aliphatic carbon to total carbon of MW coal is 0.43 from the 13C-n.m.r. spectrumg. The sum of the yields of C02 and the smallest molecule fraction (Mw<104) in Fig. 4a exceeded 0.43 at the oxidation time of 12 and 24 h at 60 'C. This clearly indicates that a part of the aromatic rings of the coal are ruptured by the H202 oxidation even at 60 'C. The oxidation of coal by a i r is known to reduces the H/C ratio and the aliphatic proportion in thecoal.10 The above discussion clearly shows that the mechanism of the H202 oxidation is completely different from the mechanism of the air oxidation. The H202 oxidation in acid aqueous solutions contains the proton donating reaction.11 The pH in the mixture of the dried MW coal in the H202 aqueous solution was below 4.0, so the proton donating reaction surely proceeded to change the coal and the larger molecules of the water-soluble components into aliphatic rich structure. This will surely increase the yields of smaller molecules with the progress of oxidation.
Summarizing the above discussion, the high yield and the high selectivity for the fatty acids were judged to be achieved by the structure of MW coal itself and the proton donating reaction which is realized by H202 in acid aqueous solutions.
CONCLUSION A new and effective method for utilizing the low rank coal as chemical resources was presented, in which the coal was oxidized with 30%-H202 at below 8O'C under ambient pressure. Oxidizing an Australian brown coal for 24 h at 60 'C, five kinds of fatty acids were recovered surprisingly in 52 % in yield. We are expecting that the proposed method will change the conversion technology of brown coal dramatically.
REFERENCES 1. Kamiya,Y., KogyoKagakuZasshi, 1 9 4 59,197-202. 2. Kamiya, Y . , Fuel, 1969 42,353-358. 3. Kapo,G.; Calvert, S.; Ind.Eng. Chem. Des.Deu., 19w5,97-104. 4. Bimer,J.; Salbut, P.D.; Berlozecki,S., Fuel, 1993,72,1063-1068. 5. Montgomery,R.S.;Bozer, K.B., Fuel, 1964 38,400-402. 6. Den0,N.C.; Gregger, B. A. ; Stroud, S.G., Fuel, 1974 57,455469. 7. Deno,N.C.;Gregger,B.A.;Messer,L.A.;Meyer,M.P.;Stroud,S.G.,Tetrahedron
8. Miura, K.; Mae,K.; Maki,T.; Araki, J., Chem. Lett., 1996 DOL 9. Mae,K.;Miura,;K.Maki,T.;Inoue,S., Proclnt . Conf. on Coal Sci., 1996 365-368.
lO.Song, C.; Saini,A.K.; Schobert, H.H., Energy& Fuels, 1994 8,301-312. ll.Schumb,W.C.; Satterfield,C.N., "Hydrogenperoxide", 1955,Reinhold (New York).
yields was obtained for the dried MW coal at 60 'C.
Lett., 1971: 1703.
736
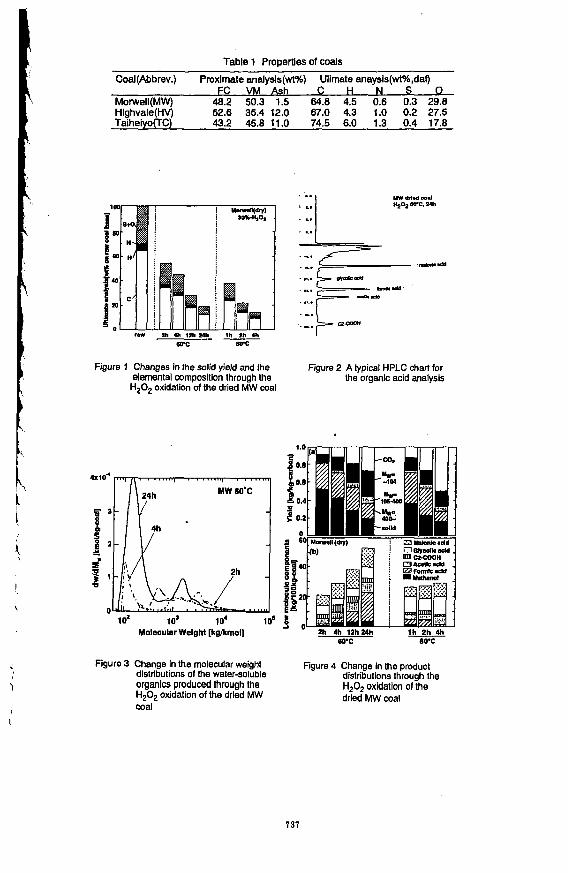
Figure 1 Changes in !he solid yield and the elemental composltion through the H202 oxidation of the dried MW coal
k I i I
\
i J
1
-
lo2 1 os 10' 1 os Molecular Welghi [kgkmol]
Figure 2 A typical HPLC char! for the organic acid analysis
Figure 3 Change in the molecular weight distributions of the water-soluble organics produced through the H202 oxidation of the dried MW coal
Figure 4 Change in the product distributions through the H202 oxidation of the dried MW coal
737
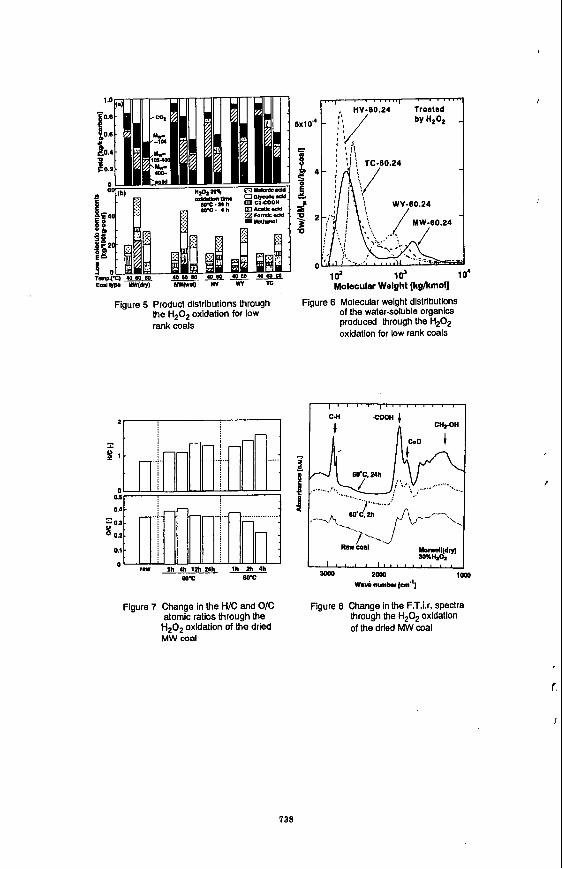
Id Id 1 0' Molecular Welght [kgkmol]
Figure 5 Product distributions through Figure 6 Molecular weight distributions of the water-soluble organics produced through the H20, oxidation for low rank coals
the H,O, oxidation for low rank coals
T $ 1
0 as a4
= OJ 8 02
0.1
I I " " 1 " " " " ' I
Figure 7 Change in the H/C and O/C atomic ratios through the H,O, oxidation of the dried MW coal
Figure 8 Change in the F.T.i.r. spectra through the H,O, oxidation of the dried MW coal
I
'\
PYROLYSIS OF SIMPLE COAL MODEL COMPOUNDS CONTAINING AROMATIC CARBOXYLIC ACIDS: DOES DECARBOXYLATION LEAD TQ CRQSS-LINWNG?*
Phillip F. Britt, and A.C. Buchanan, III Chemical and Analytical Sciences Division, Oak Ridge National Laboratory
P.O. Box 2008, MS-6197, Oak Ridge, 'knnessee 37831-6197
Keywords: Pyrolysis, Decarboxylation, Cross-Linking, Model Compounds.
Introduction
In recent years, it has been proposed that oxygen functional groups, prevalent in low rank coals, are major actors in retrograde reactions which inhibit their efficient thermochemical processing. In the pyrolysis and liquefaction of low-rank coals, low temperature cross-linking reactions have been correlated with the loss of carboxyl groups and the evolution of CO, and H,O [1,2]. Pretreatments such as methylation, demineralization, or ion-exchange of the inorganic cations reduce cross-linking and CO, evolution in pyrolysis, while the exchange of Na+, K+, Ca++, and Ba++ into demineralized coal increases cross-linking and CO, evolution in pyrolysis and liquefaction [3,4]. These results suggest, in part, that decarboxylation pathways in coal may play an important role in the cross-linking of the coal polymer. However, the reaction pathways associated with the decarboxylation and cross-linking events in low rank coal are currently unknown. Furthermore, it is not known whether the reaction pathway that leads to decarboxylation also leads to cross-linking. Radical recombination or addition reactions have been suggested as being involved in retrograde reactions. However, the involvement of radical pathways in thermal decarboxylation reactions has recently been brought into question by the observation that decarboxylation of benzoic acid derivatives under coal liquefaction conditions yielded only small amounts of aryl-aryl coupling products [5]. Therefore, to gain a better understanding of the role decarboxylation plays in cross-linking reactions in low rank coals, we have studied the pyrolysis of several bibenzyls containing aromatic carboxylic acids. The structures currently under investigation are 1,2-(3,3'dicarboxyphenyl)ethane (1) and 1,2-(4,4'dicarboxyphenyI)ehe (2). These compounds are capable of forming reactive free-radical intermediates at ca. 400°C through homolysis of the weak bibenzylic bonds. This provides a constant source of free-radicals to potentially assist in the decarboxylation reaction.
Experimental 1,2-(3,3'-dicarboxyphenyl)ethane (1). Into a 1 L ovendried flask, containing a magnetic
stirbar, equipped with an ovendried addition funnel and kept under positive argon pressure, was placed 3-bromobenzyl bromidc (13.0 g, 5.22 x 10" moles) and dry THF (500 mL). The solution was cooled to -78°C. and the addition funnel was charged with 2.5 M n-butyllithium in hexane (54 mL, 1.35 x 10' moles). The n-butyllithium was added dropwise over a period of 20 min and the solution was stirred for 30 min at -78°C. Carbon dioxide, produced from warming dry ice and passing it through two separate drying tubes of CaSO, and CaSO,/CaCI,, was bubbled into the solution for 1.5 h. The reaction was warmed to room temperature and quenched with saturated aqueous NaHC03 (100 mL). The solution was transferred to a separatory funnel and diluted with H,O (700 mL) and EbO (700 mL). The aqueous layer was collected and acidified with concentated H,SO, to precipitate 1. The white precipitate was collected by vacuum filtration and air dried giving 6.884 g (98 %, GC purity 97 %). Further purification by 4 recrystallizations from isopropyl alcohol and drying over P,O, in a vacuum desicator yielded the product in 99.9 % purity by GC analysis.
1,1,2,2-tetradeutero-l,2-(3,3'-dicarboxyphenyl)ethane (1-d,) was synthesized by the procedure described above for the synthesis of 1 using 3-bromobenzyl bromide-d, which was synthesized as desiribed below. The deuterium content of the product was 97 % d4 by GC-MS analysis.
3-bromobenzyl bromide-d, Into a 1L oven-dried 2-neck flask, containing a magnetic stirbar, equipped with a reflux condenser and an addition funnel, was placed LiAID, (Aldrich 98 % deuterium content, 5.00 g, 0.12 moles) and dry EbO (300 mL). The solution was stirred and
* This research was sponsored by the Division of Chemical Sciences, Office of Basic Energy Sciences, W.S. Department of Energy under contract DE-AC05-%%OR21400 with Lockheed Martin Energy Systems, Inc.
739
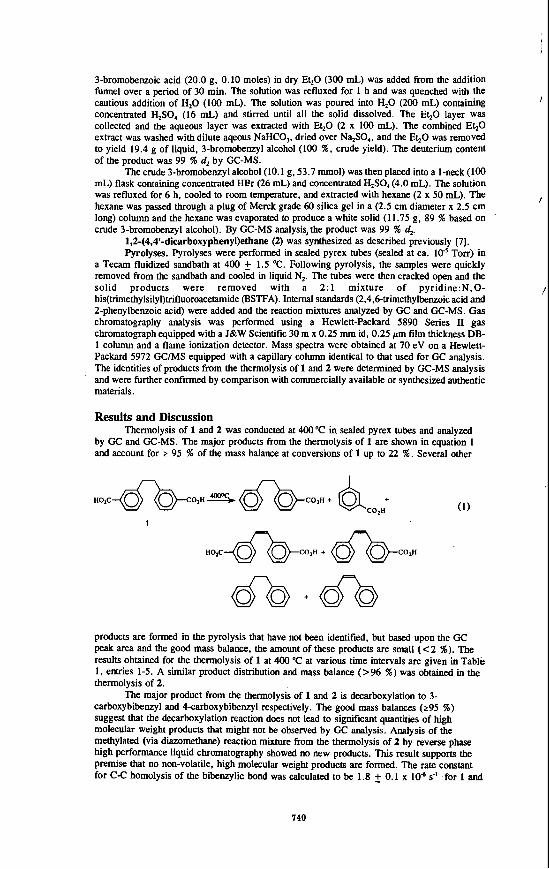
3-bromobenzoic acid (20.0 g, 0.10 moles) in dry EbO (300 mL) was added from the addition funnel over a period of 30 min. The solution was refluxed for 1 h and was quenched with the cautious addition of H,O (100 mL). The solution was poured into H,O (200 mL) contain& concentrated H,SO, (16 mL) and stirred until all the solid dissolved. The EbO layer was collected and the aqueous layer was extracted with EbO (2 x 100 mL). The combined Et&) extract was washed with dilute aqeous NaHC03, dried over NqSO,, and the EbO was removed to yield 19.4 g of liquid, 3-bromobenzyl alcohol (100 %, crude yield). The deuterium content of the product was 99 % d2 by GC-MS.
The crude 3-bromobenzyl alcohol (10.1 g. 53.7 mmol) was then placed into a 1-neck (100 mL) flask containing concentrated HEr (26 mL) and concentrated H2S0, (4.0 mL). The solution was refluxed for 6 h, cooled to room temperature, and extracted with hexane (2 x 50 mL). The hexane was passed through a plug of Merck grade 60 silica gel in a (2.5 cm diameter x 2.5 cm long) column and the hexane was evaporated to produce a white solid (11.75 g, 89 % based on crude 3-bromobenzyl alcohol). By GC-MS analysis,the product was 99 % d2
1,2-(4,4'-dicarboxyphenyl)ethme (2) was synthesized as described previously [7]. Pyrolyses. Pyrolyses were performed in sealed Pyrex tubes (sealed at ca. lo5 Torr) in
a Tecam fluidized sandbath at 400 2 1.5 "C. Following pyrolysis, the samples were quickly removed from the sandbath and cooled in liquid N,. The tubes were then cracked open and the solid products were removed with a 2 : l mixture of pyridine:N,O- bis(trimethylsily1)mfluoroace~de (BSTFA). Intemal standards (2,4,6-trimethylbenzoic acid and 2-phenylbenzoic acid) were added and the reaction mixtures analyzed by GC and GC-MS. Gas chromatography analysis was performed using a Hewlett-Packard 5890 Series Il gas chromatograph equipped with a J&W Scientific 30 m x 0.25 mm id, 0.25 pm film thickness DB- 1 column and a flame ionization detector. Mass spectra were obtained at 70 eV on a Hewlett- Packard 5972 GC/MS equipped with a capillary column identical to that used for GC analysis. The identities of products from the thermolysis of 1 and 2 were determined by GC-MS analysis and were further confinned by comparison with commercially available or synthesized authentic materials.
Results and Discussion Thermolysis of 1 and 2 was conducted at 400 "C in sealed Pyrex tubes and analyzed
by GC and GC-MS. The major products from the thermolysis of 1 are shown in equation 1 and account for 2 95 % of the mass balance at conversions of 1 up to 22 %. Several other
1 m A
products are formed in the pyrolysis that have not been identified, but based upon the GC peak area and the good mass balance, the amount of these products are small ( < 2 9%). The results obtained for the thermolysis of 1 at 400 "C at various time intervals are given in Table 1, entries 1-5. A similar product distribution and mass balance (>96 %) was obtained in the thermolysis of 2.
carboxybibenzyl and 4carboxybibenzyl respectively. The good mass balances (295 %) suggest that the decarboxylation reaction does not lead to significant quantities of high molecular weight products that might not be observed by GC analysis. Analysis of the methylated (via dimmethane) reaction mixture fiom the thermolysis of 2 by reverse phase high performance liquid chromatography showed no new products. This result supports the premise that no non-volatile. high molecular weight products are formed. The rate constant for C C homolysis of the bibenzylic bond was calculated to be 1.8 f 0.1 x 10⁶ s-' ,for 1 and
The major product from the thermolysis of 1 and 2 is decarboxylation to 3-
I
I
I
740
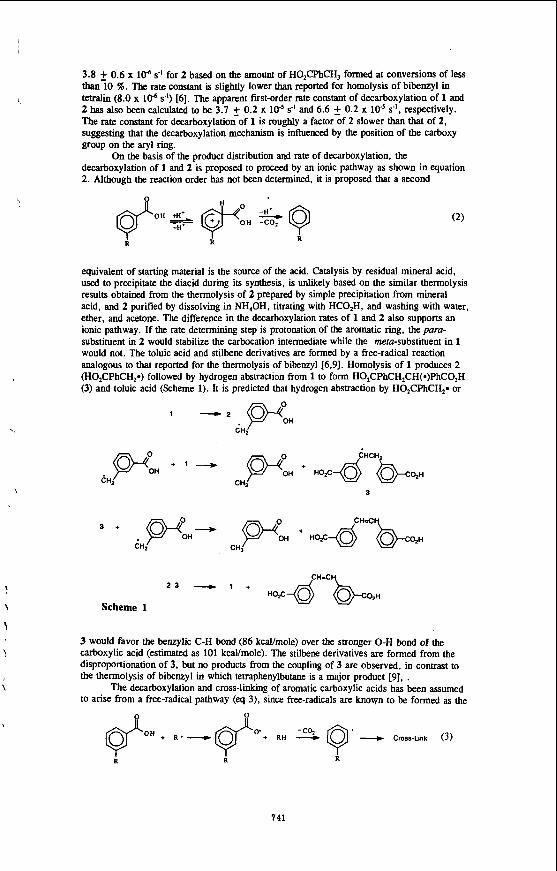
3.8 f 0.6 x 10⁶ s-' for 2 based on the amount of H0,CF'hCH3 formed at conversions of less than 10 X . The rate constant is slightly lower than reported for homolysis of bibenzyl in tetralin (8.0 x 10⁶ SI) [6]. The apparent first-order rate constant of decarboxylation of 1 and 2 has also been calculated to be 3.7 0.2 x lo5 s-', respectively. The rate constant for decarboxylation of 1 is roughly a factor of 2 slower than that of 2, suggesting that the decarboxylation mechanism is influenced by the position of the carboxy group on the aryl ring.
On the basis of the product distribution and rate of decarboxylation. the decarboxylation of 1 and 2 is proposed to proceed by an ionic pathway as shown in equation 2. Although the reaction order has not been determined, it is proposed that a second
0.2 x lo-' s-l and 6.6
\
equivalent of starting material is the source of the acid. Catalysis by residual mineral acid, used to precipitate the diacid during its synthesis, is unlikely based on the similar thermolysis results obtained from the thermolysis of 2 prepared by simple precipitation from mineral acid, and 2 purified by dissolving in NH,OH, titrating with HCO,H, and washing with water, ether, and acetone. The difference in the decarboxylation rates of 1 and 2 also supports an ionic pathway. If the rate determining step is protonation of the aromatic ring, thepara- substituent in 2 would stabilize the carbocation intermediate while the mefa-substituent in 1 would not. The toluic acid and stilbene derivatives are formed by a free-radical reaction analogous to that reported for the thermolysis of bibenzyl [6,9]. Homolysis of 1 produces 2 (HO,CPhCH,*) followed by hydrogen abstraction from 1 to form HO,CPhCH,CH(*)PhCO,H (3) and toluic acid (Scheme 1). It is predicted that hydrogen abstraction by HO,CPhCH,* or
3
3 would favor the benzylic C-H bond (86 kcal/mole) over the stronger 0-H bond of the carboxylic acid (estimated as 101 kcallmole). The stilbene derivatives are formed from the disproportionation of 3, but no products from the coupling of 3 are observed, in contrast to the thermolysis of bibenzyl in which tetraphenylbutane is a major product [9], .
to arise from a free-radical pathway (eq 3), since free-radicals are knoyn to be formed as the The decarboxylation and cross-linking of aromatic carboxylic acids has been assumed
741
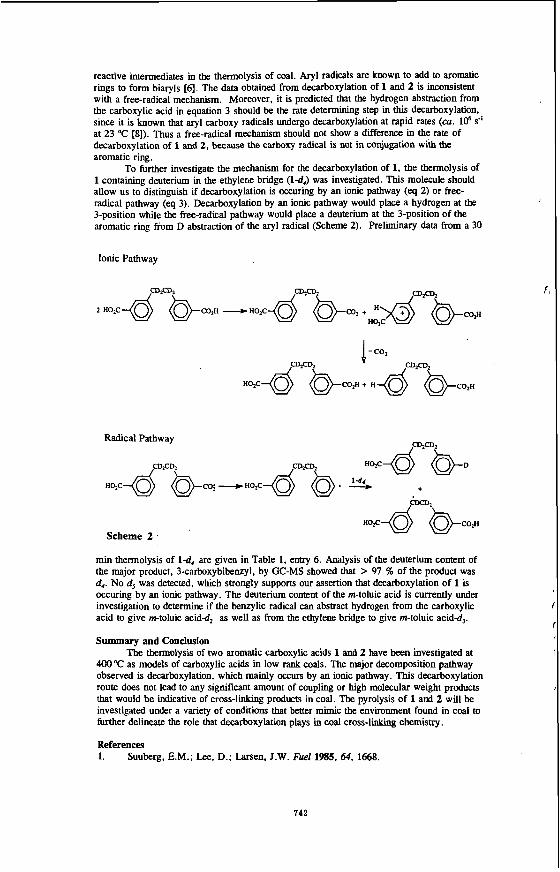
reactive intermediates in the thermolysis of coal. Aryl radicals are known to add to aromatic rings to form biaryls [6], The data obtained from decarboxylation of 1 and 2 is inconsistent with a free-radical mechanism. Moreover, it is predicted that the hydrogen abstraction from the carboxylic acid in equation 3 should be the rate determining step in this decarboxylation, since it is known that aryl carboxy radicals undergo decarboxylation at rapid rates (cu. lo6 s.' at 23 "C [8]). Thus a free-radical mechanism should not show a difference in the rate of decarboxylation of 1 and 2, because the carboxy radical is not in conjugation with the aromatic ring.
1 containing deuterium in the ethy1ehe bridge (14,) was investigated. This molecule should allow us to distinguish if decarboxylation is occuring by an ionic pathway (eq 2) or free- radical pathway (eq 3). Decarboxylation by an ionic pathway would place a hydrogen at the 3-position while the free-radical pathway would place a deuterium at the 3-position of the aromatic ring fiom D abstraction of the aryl radical (Scheme 2). Preliminary data from a 30
To further investigate the mechanism for the decarboxylation of 1, the thermolysis of
Ionic Pathway
I -co.
Radical Pathway .Qml
Scheme 2 .
min thermolysis of 14, are given in Table 1, entry 6. Analysis of the deuterium content of the major product, 3-carboxybibenzy1, by GC-MS showed that > 97 % of the product was d,. No d5 was detected, which strongly supports our assertion that decarboxylation of 1 is occuring by an ionic pathway. The deuterium content of the m-toluic acid is currently under investigation to determine if the benzylic radical can abstract hydrogen from the carboxylic acid to give m-toluic acidd, as well as from the ethylene bridge to give m-toluic acidd,.
Summary and Conclusion The thermolysis of two aromatic carboxylic acids 1 and 2 have been investigated at
400 "C as models of carboxylic acids in low rank coals. The major decomposition pathway observed is decarboxylation, which mainly occurs by an ionic pathway. This decarboxylation route does not lead to any significant amount of coupling or high molecular weight products that would be indicative of cross-linking products in coal. The pyrolysis of 1 and 2 will be investigated under a variety of conditions that better mimic the environment found in coal to further d e l i t e the role that decarboxylation plays in coal c r o s s - l i chemistry.
References 1. Suuberg, EM.; Lee, D.; m e n , J.W. Fuel 1985, 64, 1668.
742
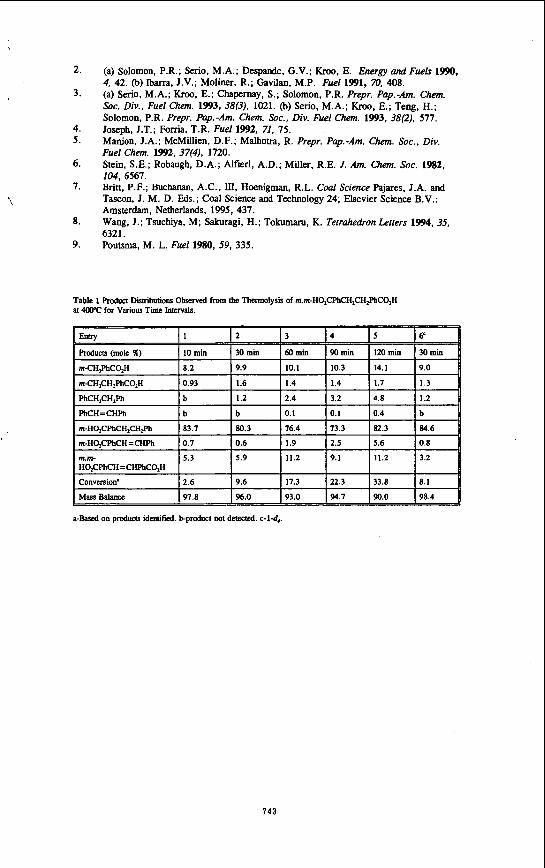
i
Mass B a l m
I
97.8 %.O 93.0 94.7 90.0 98.4
2.
3.
4. 5.
6.
7.
8.
9.
(a) Solomon, P.R.; Serio, M.A.; Despande, G.V.; Kroo, E. Energy and Fuels 1990, 4, 42. @) Ibarra, J.V.; Moliner, R.; Gavilan, M.P. Fuel 1991, 70, 408. (a) Serio, M.A.; Kroo, E.; Chapemay, S . ; Solomon, P.R. Prepr. Pup.-Am. Chem. SOC. Div., Fuel Chem. 1993, 38(3), 1021. @) Serio, M.A.; Kroo, E.; Teng, H.; Solomon, P.R. Prepr. Pap.-Am. Chem. Soc.. Div. Fuel Chem. 1993, 38(2), 577. Joseph, J.T.; Forria, T.R. Fuel 1992, 71, 75. Manion, J.A. ; McMillien, D.F. ; Malhotra, R. Prepr. Pap.-&. Chem. SOC., Div. Fuel Chem. 1992, 37(4), 1120. Stein, S.E.; Robaugh, D.A.; Alfieri, A.D.; Miller, R.E. J. Am. Chem. SOC. 1982, 104, 6561. Britt, P.F.; Buchanan, A.C., III, Hoenigman, R.L. Coal Science Pajares, J.A. and Tascon, J. M. D. Eds.; Coal Science and Technology 24; Elsevier Science B.V.: Amsterdam, Netherlands, 1995, 437. Wang, J.; Tsuchiya, M; Sakuragi, H.; Tokumaru, K. Tetruhedron Leners 1994, 35, 6321. Poutsma, M. L. Fuel 1980, 59, 335.
Table 1 Product Distributions Observed from the Thmolysis of m,rn-HOlCPhCH2CHlF’hCOlH at 400°C for Various Timc Intervals.
m.m- 5.3 5.9 11.2 9.1 11.2 3.2 H0,CPhCH =CHPhCOIH
Conversion’ 2.6 9.6 17.3 22.3 33.8 8.1
743
RELIABLE CHEMICAL DETERMINATION OF OXYGEN-CONTAINING FUCTIONALITIES IN COAL AND COAL PRODUCI'S.
CARBOXYLICACIDAND PHENOLIC HYDROXYL FUNCTIONALITIES
Tetsuo Aidq Yukinari Tsutsumi, and Teiji Yoshinaga Department of Industrial Chemistry
Faculty of Engineering, Kinki University at Kyusyu I 1-6 Kayanomori, lizuka, Fukuoka 820. JAPAN
Keywords: Coal, chemical determination, oxygen-containing fuctionality
INTRODUCI'ION Coal contains various chemical functionalities. Particularly, the oxygen-containing functionalities are considered to play an important role to controle its physical and chemical properties. Recent developement of sophisticated instrumentaion such as FT-ir, '3C-CP-MAS-NMR, XPS, etc.. for the direct non-destructive chacterization of a solid coal has made i t possible to provide quite reliable information about such hetero-atom-fuctionalites as sulfur-( I), nitrogen-(2) and oxygen- containing fuctionalities. However there still seems to be a problem concerning the selectivity between delicate functiomalities, Le., a carboxylic, phenolic and alcoholic hydroxyl functionalities. About 40 years ago, Blom et a1.(3) developed chemical determination methods for various ogygen-containing functionalities in coal and coal products, which have often been used in the literatue with some minor modifications. In the course of our studies concerning the solvent swelling of coal, we have learned that this classical method may involve serious experimenntal errors based on the accessibility, particuraly the determination of the carboxylic acid functionality in coals, which used to be carried out in an aqueous solution by using calcium acetate. In general, the coal does not swell very much in a water, furthermore the coals exibit significant steric requirments for the penetrant molecules(4), and its extent of swelling widely varied depending upon the coal rank(5). Usually, a higher rank coal like a bituminous coal exhibits serious penetration restriction. Thus, if one wants to use a chemical reaction o n coals, in order to obtain reasonable accessibility of chemical reagent to the functionality in solid coals it is critical to pay maximum attention to the arrangement of the reaction conditions, Le., reagents and solvents. Based on our experimental results of coal swelling, we have developed a quite reliable chemical determination method for carboxylic acid and phenolic hydroxyl fuctionalities in coal and coal products. The principle of this method is described as follows: Chemical reactions using various borohydrides were adopted for the determination of these functionalities as shown below, which have very different reactivities and give us a stoichiometric amount of hydrogen gas for each functionality in a pyridine solvent. Thus, we can discriminate each functionalities based upon the difference of thier reactivities to the borohydrides:
R-OH+MBH4 - R-OM+ BH3 + HZ
(R = Aryl, Alkyl, -CO-, H, etc. ; M = Li. Na, K, n-BudN etc.)
EXPERIMENTAL The chemical reagents were commercial products(A1drich's gold label grade) which were used without further purifications. Pyridine was dried over calcium hydride and distilled before use. Coals from the Ames Coal Library were ground, seized, dried at I IOOC under vacuum overnight, and stored under a dry nitrogen atmosphere. The pyridine extractions of coals were carried out by using excess amount of pyridine under an ultrasonic irradiation. In order to remove trace amounts of pyridine in the pyridine-extract it was washed by THF/Hz0(30vol%) solution saturated by COz then dried at 1 IOOC overnight, and stored under a dry nitrogen atmosphere. Vol6metric measurements of hydrogen gas evolved through the reactions were carried out by using a gas-buret under hydrogen atmosphere at ZSOC. A typical procedure was as follows: Pyridine-extract(0. Ig) was throughly groung by using an agate mortar in a dry-box, and placed into a 30ml reaction vessel. Dry pyridine(5ml) was added and the mixture stirred for 30- 60minutes prior to start the reaction with excess amount of pyridindtetra-n-butylammonium borohydride solution. The volume of hydrogen gas generated from the reaction mixture was measured by a gas-buret.
RESULTS AND DISCUSSION 1. Reactivities of various borohydrides toward hydroxyl fuctionalities In order to evaluate the chemical reactivity of borohydrides, I-naphthol was chosen as a standard model compound of a phenolic hydroxyl functionality. In Figure 1, the effects of the counter cations of borohydrides are demonstrated. This Figure shows the rate of completion of the reaction vs. reaction time in minute, which were calculated from the volume of the hydrogen gas evolved. Very interestingly, a lithium borohydride reacted very rapidely(comp1eted within 5 minutes under these reaction conditions), compared to the others which were finaly complete only after a prolonged reaction time. Among the experimental data shown in this Figure, it is also quite interesting to note that tetra-n-butylammmonium borohydride reacted with I-naphthol slowly and stoichiometrically, since the affinity of these types of tetra-alkyl ammmounium compunds for the macromolecular network structure of coals had been well-known to be quite high, Le., Liotta Methylation(6). There will be a good chance to distinguish kinetically between a phenolic hydroxyl functionality and more stronger hydroxyl functionalities like a carboxylic acid in a solid coal.
744
2. Reactions of lithium borohydride with various hydroxyl model compounds The reactivities of various hydroxyl fuctionalities toward lithium borohydride were examined by using model compounds, such as a water, benzyl alcohol, I-naphthol, catechol and benzoic acid. Figure 2 summerizes the results. Very interestingly, the reactions with carboxylic acid(benzoic acid) and phenolic compounds( I - naphthol and catechol) proceeded significantly faster than those of others(benzy1 alcohol and water), which means that the amount of hydrogen gas evolution within 60 minutes under this reaction condition represents the amount of both carboxylic acid and phenolic hydroxyl functionaiities.
I
3. Reactions of tetra-n-butylammonium borohydride with various hydroxyl model compounds Figure 3 shows the results obtained from the experiments to examine the reactivities of various model compounds toward tetra-n-butylammonium borohydride. Compared to the previous experiments with lithium borohydride. the reaction rate of benzoic acid was significant. Most of the hydrogen gas evolution at the ininitial stage of the reaction is considered to come from the reaction with a carboxylic acid functionality. Even if i t was a mixture of those, we can obtain reasonable analytical values of the acid functionality by a treatment of an extraporation ofthe cun'e in the Figure.
4. Ouantitative determination of carboxylic acid and phenolic hydroxyl funclionalities in the mixture of various hydroxyl model compounds Coal is believed to contain various hydroxyl functionalities, such as a water, alcoholic, phenolic and carboxylic hydroxyl functionalities. Based on the results described above, we have tried to evaluatethe proposed method. "Metal hydride method" using a mixture of the model compound which was prepared with an equivalent amount of the functionalities. Figure 4 exhibits the hydrogen gas evolution from reaction mixtures for both the case of the lithium salt and tetra-n- butyl ammmonium salts. The data shown in this Figure seem to be consistent. The equilihliiim value of the reaction(hydrogen gas evolution) with lithium salt must represent the sum of carboxylic acid and phenolic hydroxyl functionalities, meanwhile in the case of tetra-n- butylammmonium salt the extraporated value must be the amount of carboxylic acid functionality. Obviously, the data shown in this Figure seems to be consistent.
5. Ouantitative determination of carboxylic acid and phenolic hydroxvl functionalitics in the pvridine-extract of coal In order to minimize the complications of the accessibility of the borohydride molecule to the active sites buried into the macromolecular network structure of coal and inorganic components in coal, we have started the quantitative determination of these funclionalities by using pyridine- extract which gives us a homogenenous reaction system. In Figure 5, a typical measurement is demonstrated, in which Illinois No.6 coal was used. Although the rate of the hydrogen evolution seems to be slow compared to those of the model compounds, the pattern was quite similar. l 'he calculated values of the contents of carboxylic acid and phenolic hydroxyl functionalities from the Figure 5 were 0.82 mmol/g amd 2.03 mmollg which corresponded to 8 unitsl660-carbon atom and 24 unitsl660-carbon atom. Although we have no reason to believe that the content of these functionalities in the pyridine-extract is exactly same as the raw coal, it is quite interesting that the content of phenolic hydroxyl functionality was almost equal to the number(25 unils/660-carbon atom) of phenolic hydroxyl functionality described in the Shinn Model(7) of Illinois No.6 coal. But there was 8 fold differences in the carboxylic acid functionality( I unit/ 660 carbon atom in Shim Model vs. 8 unitd660 carbon atom by present work). Table 1 summarizes the analytical data obtained by this new method for the pyridine-extracts of different rank of coals. The coal-rank dependency of each functionalities appearing in this Table seem to be unusual, based on our previous understanding. The carboxylic acid functionality( which had been believed to be so reactive that it would not survive metamorphism and be detectable in higher ranks of coal) seems to exist significantly in a wide range of coals. On the other hand, the phenolic hydroxyl functionality in coal is reasonably stable over the coal-rank range used in this study. The contradictions on these data revealed here are thought to prove very serious and important problems in reviewing our understanding of the physical and chemical properties of coals. Theaccumulation of the experimental data concerning the content of these functionalities in the raw coals is now underway in our laboratory. We are now developing the method for the delemination of an alcoholic hydroxyl functionality in coal.
CONCLUSION Based on the experimental results of solvent swelling of coal, a rehable chemical determination method both carboxylic acid and phenolic hydroxyl functionalities has been developed by using the reactions of borohydride salts in pyndine solvent. Advantages of this method are considered to be (a) better accessibility of chemical reagent into the macromolecular network of coal ( i n pyridine solvent), (b) quantitative and direct(one-step) reaction, and (c) accuracy and easiness(vo1umetric determination of hydrogen gas).
AKNOWLEDGEMENTS A part of this research was supported by the grant from the Nihon Shigaku Shinkoh Zaidan through The Institute of Environmental Science of Kinki University during 1990-1992.
745
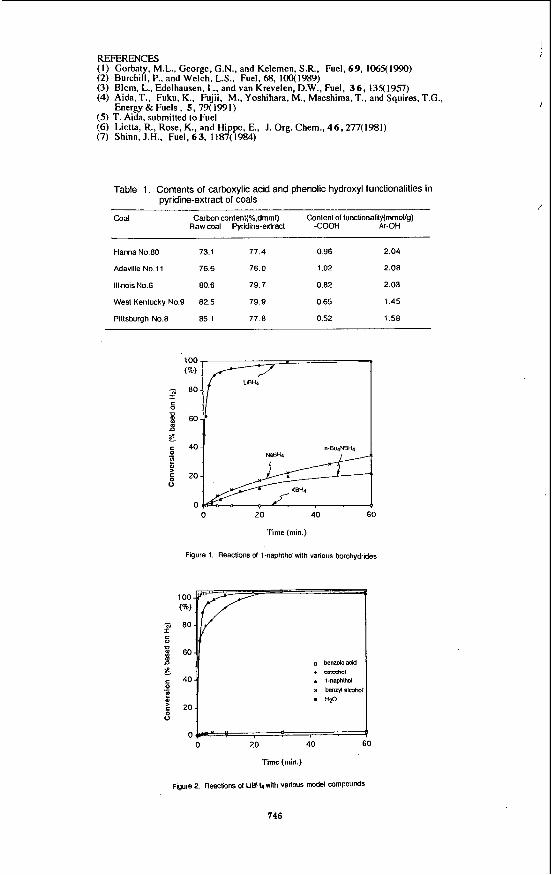
REFERENCES (1) Gorbaty, M.L.. George, G.N., and Kelemen, S.R., Fuel, 69, 1065(1990) (2) Burchill, P., and Welch, L.S., Fuel, 68, lOO(1989) (3) Blom, L., Edelhausen, L., and van Krevelen, D.W., Fuel, 3 6 , 13x1957) (4) Aida, T., Fuku, K., Fujii, M., Yoshihara, M., Maeshima, T., and Squires, T.G.,
(5) T. Aida, submitted to Fuel (6) Liotta, R., Rose, K., and Hippo, E., J. Org. Chem., 46,277(1981) (7) Shinn, J.H., Fuel, 63, 1187(1984)
Energy & Fuels, 5 ,79( 1991)
(40)
- 80- r" c 0
3 6 0 - '
ae c 4 0 -
m 9
-
Table 1, Contents of carboxylic acid and phenolic hydroxyl functionalities in pyridine-extract of coals
i
coal Carbon contenl(%.dmml) Content of lunctionaiity(mmoilg) Raw coal Fyridina-extract COOH Ar-OH
Hanna No.80 73.1 77.4 0.96 2.04
Adaville No 1 1 76.6 76.0 1.02 2.08
Illinois No.6 80.6 19.7 0.82 2.03
West Kentucky No.9 82.5 79.9 0.65 1.45
Pittsburgh No.8 85.1 77.8 0.52 1.58
0 20 40 60
Time (inin.)
Figure 2. Reactions of UBH4with varlws model COmpOUndS
746
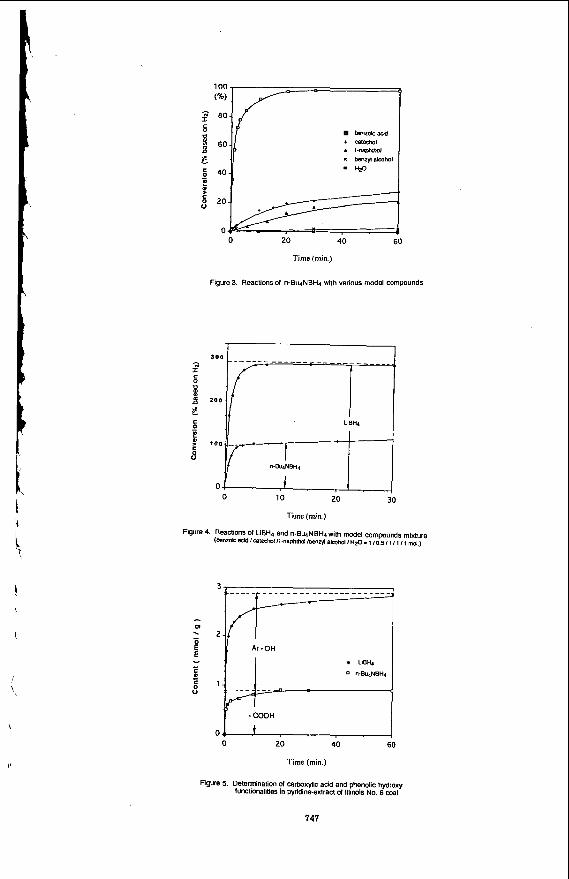
100
p 80 c
b e n Z O h a d d
60
E
!! P s 20
40 -
0 0 20 40 60
Time (min.)
t n-&4NBH4
Figure 3. Reactions 01 n-EulNBH4 with various model compounds
LIBH~ C - s C
8
- c E 8
I Ar . OH UBH4
0 20 40 60
Time (min.)
Figure 5. Determination d carboxylic acid and phenolic hydroxy lunctionalities in pyridine-extract d Illinois No. 6 coal
741
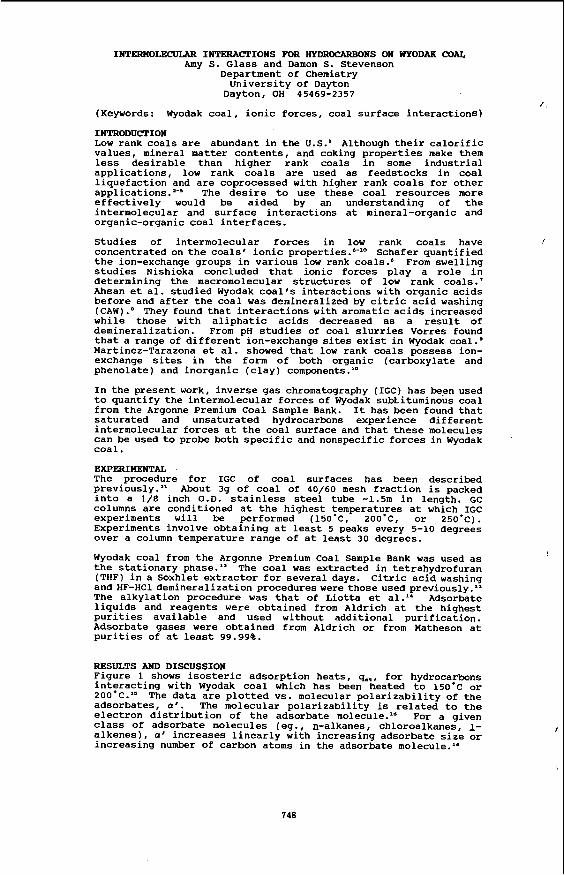
INTERMOLECULAR INTERACTIONS FOR HYDROCARBONS ON WYODAX COAL Amy S. Glass and Damon S. Stevenson
Department of Chemistry University of Dayton
Dayton, OH 45469-2357
(Keywords: Wyodak coal, ionic forces, coal surface interactions)
INTRODUCTION Low rank coals are abundant in the U.S.' Although their calorific values, mineral matter contents, and coking properties make them less desirable than higher rank coals in some industrial applications, low rank coals are used as feedstocks in coal liquefaction and are coprocessed with higher rank coals for other applications. z-s The desire to use these coal resources more effectively would be aided by an understanding of the intermolecular and surface interactions at mineral-organic and organic-organic coal interfaces.
Studies of intermolecular forces in low rank coals have I
concentrated on the coals' ionic Schafer quantified the ion-exchange groups in various low rank coals.' From swelling studies Nishioka concluded that ionic forces play a role in determining the macromolecular structures of low rank coals.' Ahsan et al. studied Wyodak coal's interactions with organic acids before and after the coal was demineralized by citric acid washing (CAW) .' They found that interactions with aromatic acids increased while those with aliphatic acids decreased as a result of demineralization. From pH studies of coal slurries Vorres found that a range of different ion-exchange sites exist in Wyodak coal.' Martinez-Tarazona et al. showed that low rank coals possess ion- exchange sites in the form of both organic (carboxylate and phenolate) and inorganic (clay) components."
In the present work, inverse gas chromatography (IGC) has be-en used to quantify the intermolecular forces of Wyodak subkituminous coal from the Argonne Premium Coal Sample Bank. It has been found that saturated and unsaturated hydrocarbons experience different intermolecular forces at the coal surface and that these molecules can be used to probe both specific and nonspecific forces in Wyodak coal.
EXPWIHENTAL The procedure for IGC of coal surfaces has been described previously." About 39 of coal of 40/60 mesh fraction is packed into a 1/8 inch O.D. stainless steel tube -1.5m in length. GC columns are conditioned at the highest temperatures at which IGC experiments will be performed (150'C, 200*C, or 250'C). Experiments involve obtaining at least 5 peaks every 5-10 degrees over a column temperature range of at least 30 degrees.
Wyodak coal from the Argonne Premium Coal Sample Bank was used as the stationary phase." The coal was extracted in tetrahydrofuran (THF) in a Soxhlet extractor for several days. Citric acid washing and HF-HCldemineralization procedures were those used previously.'' The alkylation procedure was that of Liotta et al." Adsorbate liquids and reagents were obtained from Aldrich at the highest purities available and used without additional purification. Adsorbate gases were obtained from Aldrich or from Matheson at purities of at least 99.99%.
RESULTS AND DISCUSSION Figure 1 shows isosteric adsorption heats, qmt, for hydrocarbons interacting with Wyodak coal which has been heated to 150'C or 2OO.C." The data are plotted vs. molecular polarizability of the adsorbates, a ' . The molecular polarizability is related to the electron distribution of the adsorbate molecule.'6 For a given class of adsorbate molecules (eg., n-alkanes, chloroalkanes, 1- alkenes), a' increases linearly with increasing adsorbate size or increasing number of carbon atoms in the adsorbate molecule.'6
I
748
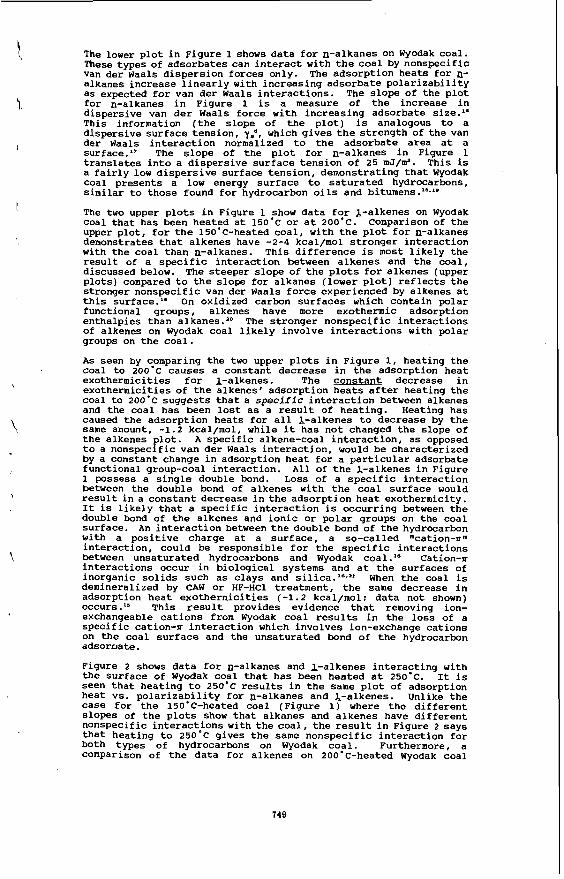
I
The lower plot in Figure 1 shows data for n-alkanes on Wyodak coal. These types of adsorbates can interact with the coal by nonspecific Van der Waals dispersion forces only. The adsorption heats for n- alkanes increase linearly with increasing adsorbate polarizability as expected for van der Waals interactions. The slope of the plot for n-alkanes in Figure 1 is a measure of the increase in dispersive van der Waals force with increasing adsorbate size." This information (the slope of the plot) is analogous to a dispersive surface tension, y.", which gives the strength of the van der Waals interaction normalized to the adsorbate area at a s~rface.~' The slope of the plot for n-alkanes in Figure 1 translates into a dispersive surface tension of 25 mJ/m'. This is a fairly low dispersive surface tension, demonstrating that Wyodak coal presents a low energy surface to saturated hydrocarbons, similar to those found for hydrocarbon oils and bitumen^."*'^
The two upper plots in Figure 1 show data for 1-alkenes on Wyodak coal that has been heated at 150'C or at 200'C. Comparison of the upper plot, for the 150'C-heated coal, with the plot for n-alkanes demonstrates that alkenes have -2-4 kcal/mol stronger interaction with the coal than n-alkanes. This difference is most likely the result of a specific interaction between alkenes and the coal, discussed below. The steeper slope of the plots for alkenes (upper plots) compared to the slope for alkanes (lower plot) reflects the stronger nonspecific van der Waals force experienced by alkenes at this surface." On oxidized carbon surfaces which contain polar functional groups, alkenes have more exothermic adsorption enthalpies than alkanes.'O The stronger nonspecific interactions of alkenes on wyodak coal likely involve interactions with polar groups on the coal.
As seen by comparing the two upper plots in Figure 1, heating the coal to 200'c causes a constant decrease in the adsorption heat exothermicities for 1-alkenes. The constant decrease in exothermicities of the alkenes' adsorption heats after heating the coal to 200'C suggests that a specific interaction between alkenes and the coal has been lost as a result of heating. Heating has caused the adsorption heats for all 1-alkenes to decrease by the same amount, -1.2 kcal/mol, while it has not changed the slope of the alkenes plot. A specific alkene-coal interaction, as opposed to a nonspecific van der Waals interaction, would be characterized by a constant change in adsorption heat for a particular adsorbate functional group-coal interaction. All of the 1-alkenes in Figure 1 possess a single double bond. L o s s of a specific interaction between the double bond of alkenes with the coal surface would result in a constant decrease in the adsorption heat exothermicity. It is likely that a specific interaction is occurring between the double bond of the alkenes and ionic or polar groups on the coal surface. An interaction between the double bond of the hydrocarbon with a positive charge at a surface, a so-called "cation-rr" interaction, could be responsible for the specific interactions between unsaturated hydrocarbons and Wyodak coal." Cation-n interactions occur in biological systems and at the surfaces of inorganic solids such as clays and silica.'6*" When the coal is demineralized by CAW or HF-HC1 treatment, the same decrease in adsorption heat exothermicities (-1.2 kcaljmol; data not shown)
This result provides evidence that removing ion- exchangeable cations from Wyodak coal results in the loss of a specific cation-rr interaction which involves ion-exchange cations on the coal surface and the unsaturated bond of the hydrocarbon ddsoruate.
Figure 2 shows data for n-alkanes and A-alkenes interacting with the surface of Wyodak coal that has been heated at 250.12. It is seen that heating to 250'C results in the same plot of adsorption heat vs. polarizability for n-alkanes and a-alkenes. Unlike the case for the 150'C-heated coal (Figure 1) where the different slopes of the plots show that alkanes and alkenes have different nonspecific interactions with the coal, the result in Figure 2 says that heating to 250'C gives the same nonspecific interaction for both types of hydrocarbons on Wyodak coal. Furthermore, a comparison of the data for alkenes on 2OO'C-heated Wyodak coal
749
(Figure 1) with data for alkenes on 25O'C-heated Wyodak coal (Figure 2) shows that the adsorption heats for alkenes are similar on these two heated coals. These two heated coals have lost their specific interactions with the coal; therefore, this result says that the nonspecific component of the adsorption heat for alkenes is similar for 200'C-heated and 25O'C-heated coals. On the other hand, the nonspecific component of the adsorption heat for alkanes has increased in exothermicity as a result of heating the coal to 250'C. The same result (same plot for alkanes and alkenes) is obtained by extracting or alkyating the coal (results not shown)." The slope of the plot in Figure 2 corresponds to a dispersive surface tension of -50 mJ/m'. This value is similar to dispersive surface tensions found for flat carbonaceous surfaces.2a It was shown previously that extracting Illinois No. 6 coal or heating to 250'C gave a dispersive surface tension of -50 mJ/m' for that Coal as well.'' These treatments cause changes in the concentration and/or polarizabilities of atoms at the coal surface."*" changes in bulk coal properties have been reported to result from these treatments and it is possible that changes in the bulk are reflected as changes in the coal's dispersive surface tension:"
CONCLUSION In conclusion, IGC data show that three types of forces are experienced by hydrocarbons at the Wyodak coal surface: a nonspecific force experienced by n-alkanes, a nonspecific force experienced by 1-alkenes, and a specific force experienced by 1- alkenes. The nonspecific force felt by n-alkanes gives a dispersive surface tension of -25 mJ/m' for this coal. The nonspecific force felt by 1-alkenes is stronger and likely involves interactions with polar groups at the coal surface. The specific interaction between alkenes and Wyodak coal is most likely due to an interaction of the unsaturated bond with ionic groups at the coal surface; i.e., a cation-n interaction. Heating the coal to 250.12 increases the interactions with palkanes so that both types of hydrocarbons, alkanes and alkenes, have the same nonspecific interaction with the 250'~-heated coal. The nonspecific interaction with the 25O'C-heated coal gives a dispersive surface tension of -50 -/ma.
REFERENCES 1. Van Krevelen, D. W. Coal, 3rd. ed.; Elsevier: New york, 1993; Chapter 1. 2. Van Krevelen, D. W. Coal, 3rd. ed.; Elsevier: New york, 1993; Chapter 24. 3. Neavel, R. C. In Coal Structure, ACS Adv. Chem. Series No. 192; Gorbaty, M. L.; Ouchi, K., Eds.; ACS: Washington, DC, 1981; Chapter 1. 4. Neavel, R. C. In Coal Science, vol. 1; Gorbaty, M. L.; Larsen, J. W.; Wender, I., Eds.; Academic: New York, 1982; pp. 1- 19. 5. Berkowitz, N. An Introduction to Coal Technology; Academic: New York, 1979; Chapter 13. 6. Schafer, H. N. S. Fuel 1970, 49, 271-280. 7. Nishioka, M. Fuel 1993, 72, 1725-1731. 8. Ahsan, T.; Wu, J. H.; Arnett, E. M. Fuel 1994, 73, 417-422. 9. Vorres, K. S. Prepr. Pap.-&. Chem. SOC. Div. Fuel chem.
10. Martinez-Tarazona, M. R.; Martinez-Alonso, A.; Tascon, J. M. D. Fuel 1990, 69, 362-367. 11. Glass, A. S.; Larsen, J. W . Energy Fuels 1993, 7, 994-1000. 12. Vorres, K. S. Energy Fuels 1990, 4, 420-426. 13. Silbernagel, B. G.; Gebhard, L. A.; Flowers, R. A.; Larsen, J. W. Energy Fuels 1991, 5, 561-568. 14. Liotta, R.; Rose, X.; Hippo, E. J. Org. Chem. 1981, 46, 277- 283. 15. Glass, A. S . ; Stevenson, D. S. Energy Fuels, submitted. 16. Kiselev, A. V.; Yashin, Y. I. Gas-Adsorption Chromatography; Plenum: New York, 1969: Chapter 2. 17. Doris, G. M.; Gray, D. G. J. Coll. Int. Sci. 1980, 77, 352- 362.
1993, 38, 1045-1057.
18. Zisman, W. A. In Contact Angle, Wettability, and Adhesion,
750
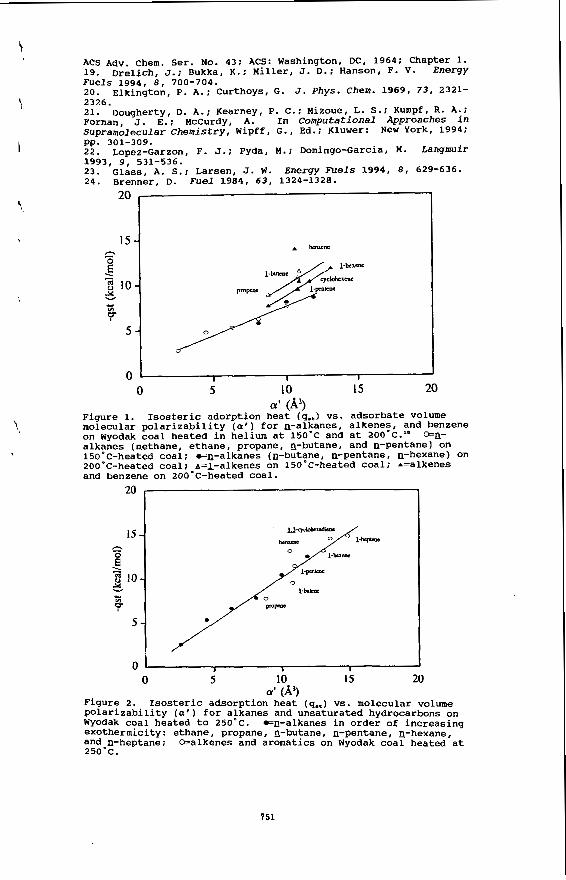
20
15 - h - 0 E
?
2; z 10- .y, c)
5 -
0
20
15 c 0 E =: a 10 c 7 Y In
5
A tOlu"0
*/ l-bcx-
C y C b h e X W
I I I
7-
0 5 10 15 20 a' (A')
Figure 2. Isosteric adsorption heat (qat) vs. molecular volume polarizability (a') for alkanes and unsaturated hydrocarbons on Wyodak coal heated to 250'C. exothermicity: ethane, propane, n-butane, n-pentane, 8-hexane, and n-heptane; 250'C.
en-alkanes in order o f increasing
&alkenes and aromatics on Wyodak coal heated at
751
CHEMICAL STRUCTURE OF COAL TAR DURING DEVOLATJLIZATION
-IFletcherl, M. Wattl, S. Baiz, M. S. Solum2, andR. J. Pugmire3
IDepartment of Chemical Engineering Brigham Young University, Provo, Utah 84602 Departments of Chemistry2 and Chenrical and Fuels EngineeringJ, University of Utah, Salt
Lake City, Utah 841 12
Keywords: coal, pyrolysis, l3C NMR
Introduction
Enormous progress has been made in coal pyrolysis research during the last two decades. Models of coal devolatilization have progressed kom simple rate expressions based on total mass release'. to empirical relationships based on the elemental composition of the parent coal3 to models that attempt to describe the macromolecular network of the In the last several years, advancements in chemical analysis techniques have allowed quantitative investigations of the chemical structure of both coal and its pyrolysis products, including the nature of the resulting char. A prominent research goal is to accurately predict the rates, yields, and products of devolatilization from measurements of the parent coal structure. The prediction of nitrogen species evolved during devolatilization is of current interest. These goals necessitate modeling the reaction processes on the molecular scale, with activation energies that relate to chemical bond breaking rather than to the mass of products released from the coal. Solid-state 13C NMR spectroscopy has proven particularly useful in obtaining average values of chemical structure features of coal and char, while liquid phase lH NMR spectroscopy has been used to determhe some of the chemical features of coal tar?- 'O Pyridine extract residues from coal and partially- pyrolyzed coal chars have also been analyzed by solid-state 13C NMR spectroscopy, and the extracts have been analyzed by *H NMR spectroscopy."
Several current devolatilization models use some kind of network approach to describe the parent coal structure and subsequent devolarilization behavior!-6 Coal is modeled as an array of aromatic clusters connected by labile bridges. Kinetic expressions are postulated for the rate of bridge scission, and statistical representations are used to determine the number of clusters liberated from the coal matrix as a function of the number of bridges cleaved. The vapor pressure of liberated clusters are calculated and used to determine yields of tar versus metaplast. Crosslinking reactions eventually connect the remaining metaplast to the char matrix. Such models require knowledge of the average size of the aromatic clusters in the coal, the number of attachments (bridges and side chains) per cluster, the ratio of bridges to side chains, and the average size of the bridges or side chains. Several reviews of these models have been published.lZ. l3 All three of these models use the solid-state 13C NMR data to some extent to guide selection of coal-dependent input parameters to describe the coal matrix. One model demonstrated success in using the solid-state *3C NMR data directly as the only coal-dependent structural input parameters? One of the common assumptions in these models is that the aromatic clusters are not broken during the pyrolysis process, and hence the bridge breaking rate largely controls the devolatilization rate. Therefore, the average number of aromatic carbons per cluster in the coal is equal to that in the char and in the tar.
In a recent paper, Niksa14 postulated that nitrogen evolution during pyrolysis could be modeled assuming that the mass of nitrogen per aromatic cluster in the coal tar was equal to that in the parent coal. A theoretical analysis was performed using tar data reported in the literature to determine the validity of Niksa's assumption. Elemental analyses of tar samples were reported by Freihaut, et l6 and by Chen.17 It has been shown that the carbon aromaticity of the pristine tar (as estimated from IH NMR spectroscopy) is similar to that of the parent coal for both lignites and bituminous coals 8 , Assuming that the number of aromatic carbons per cluster in the tar is equal to that in the coal, the mass of nitrogen per cluster M L , . can be. calculated as follows:
where XN = wt% N in coal (daf), xc = w t l C in coal (daf), MWc = molecular weight of carbon, CCI = # of aromatic carbon per cluster, fa. - carbon aromaticity, and MWcl = molecular weight per aromatic cluster. Results of this analysis are shown in Fig. 1, indicating that the mass of nitrogen per cluster in the tars do not equal the mass of nitrogen per cluster in the parent coal. The results shown in Fig. 1 are pieced together from data reported in several experiments, which may have caused errors. It may also be possible that (a) the number of aromatic clusters in the tar does not equal that in the coal, or that (b) the carbon aromaticity of the tar does not equal that of the coal. This paper describes experiments and analyses of one set of coal tars and chars. This is the first time that this high resolution 13C NMR spectroscopy techniquw has been applied to coal tars, and data regarding the number of aromatic carbons per cluster and carbon aromaticities in coal tars are presented.
152
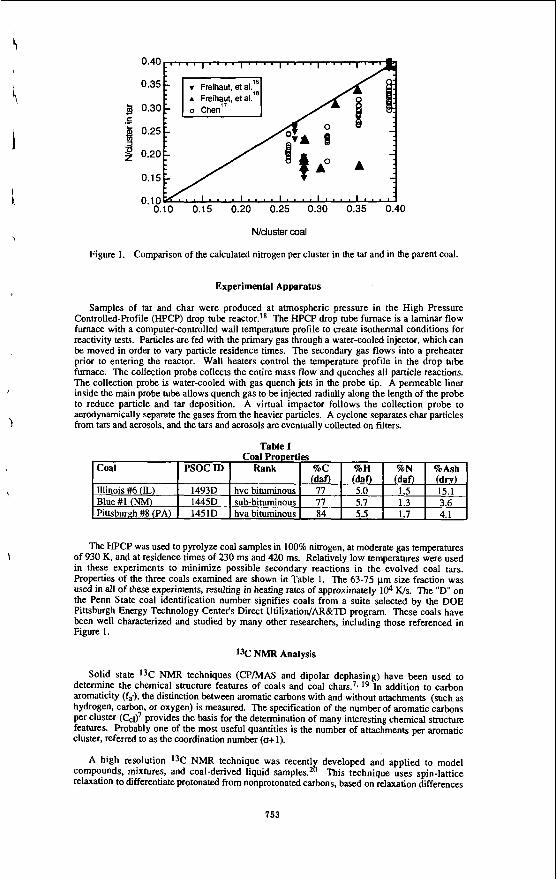
\
Coal
Illinois ##6 (IL) Blue #1 (NM) Pittsburnh#S(PA)
2 0.20
PSOCID Rank %C %H %N %Ash rdaf) ( dan I dan ( dry)
14931) hvc bituminous 77 5.0 1.5 15.1 1445D subbituminous 77 5.7 1.3 3.6 1451D hvabituminous 84 5.5 1.7 4.1
0.10 0.15 0.20 0.25 0.30 0.35 0.40
Nduster mal
Figure 1. Comparison of the calculated nitrogen per cluster in the tar and in the parent coal.
The HPCP was used to pyrolyze coal samples in 100% nitrogen, at moderate gas temperatures of 930 K, and at residence times of 230 ms and 420 ms. Relatively low temperatures were used in these experiments to minimize possible secondary reactions in the evolved coal tars. Properties of the three coals examined are shown in Table 1. The 63-75 pm size fraction was used in all of these experiments, resulting in heating rates of approximately 104 IUS. The "D" on the Penn State coal identification number signifies coals from a suite selected by the DOE Pittsburgh Energy Technology Center's Direct UtilizatiodARBrTD program. These coals have been well characterized and studied by many other researchers, including those referenced in Figure 1.
1% NMR Analysis
Solid state 13C NMR techniques (CP/MAS and dipolar dephasing) have been used to determine the chemical s!mcture features of coals and coal chars?. l9 In addition to carbon aromaticity (fa*), the distinction between aromatic carbons with and without attachments (such as hydrogen, carbon, or oxygen) is measured. The specification of the number of aromatic carbons per cluster (Ccd7 provides the basis for the determination of many interesting chemical smcture features. Probably one of the most useful quantities is the number of attachments per aromatic cluster, referred to as the coordination number (o+l).
A high resolution l3C NMR technique was recent1 developed and applied to model compounds, mixtures, and coal-derived liquid samples.2g This technique uses spin-lattice relaxation to differentiate protonated from nonprotonated carbons, based on relaxation differences
753
arising from direct CH dipolar interactions. Average aromatic ring sizes and other lattice parameters are estimated using the procedures used for solid-state 13C NMR?. l9
Tar samples were dissolved in deuterated methylene chloride (CD2Cl2) and then filtered. A significant amount of residue was obtained for each tar. This tar residue was subsequently analyzed using the CPNAS and dipolar dephasing solid-state I3C NMR technique in the same fashion as that used for coal char.
Results and Discussion
Tars collected at 230 ms were analyzed using the 13C NMR spin-lattice relaxation technique; data are presented in Tables 2 and 3. Data for char collected at 420 ms are also presented in Table 2. Analysis of the dissolved tar from the Illinois #6 coal is in progress. As seen in Table 3, 12 to 42% of the tar sample collected was deposited on the filter as residue. Also, lower amounts of tar were collected for the lower rank Illinois #6 and Blue #1 coals than for the hva bituminous Pia #8 coal. The tar yields seem somewhat lower than reported in the literature, indicating that some tar may have deposited in the sampling apparatus. Other investi ators have corrected their measured yields for estimated deposition in the sampling apparatus 7; t h s correction will be. performed for these data in the future.
F '
Table 2
aPercenlage carbon (error): fa = total s$-hyhridized carbon (f3); fa, = aromatic carbon (H); fac = carbonyl, 6 > 165 ppm (e): faH = aromatic with proton attachment (23); faN = nonprotonated aromatic (23); fap = phenolic or phenolic ether, S = 150-165 ppm (k2); fas = alkylated aromatic S = 135-150 ppm(f3); faB =aromatic bridgehead (24); fat = aliphatic carbon (22): fatH = CH or CH2 (L?); fd* = CH3 or nonpmtonated (52); falo = bonded to oxygen, 6 = 50-90 ppm (22).
Table 3
bXt, = fraction of bridgehead carbons. Ccl = aromatic carbons per cluster, a+l = toral mhrnents per cluster. Po = fraction of attachments that are. bridges. BL. = bridges and loops per cluster, S.L. =side chains per cluster, V = total volatiles yield, Tar = tar collected on fdters (not corrected for tar deposited in the sampling apparatus), tar resid. = fraction of collected tar that did not dissolve in CD2CI2.
It is interesting to compare the NMR data for the tar, tar residue, and char with that of the coal. The carbon aromaticity fa* of the dissolved tar is similar to that of the parent coal, while that of the tar residue is generally higher (and close to that of the char). Perhaps the most interesting result is that the average cluster size of the dissolved tar is 7 to 8 aromatic carbons, which is much lower than the values of 12-18 found in the coal, tar residue, or char. Previous data on coals and
754
chars2’ also found that the number of aromatic carbons per cluster in coals and char’s (ranging from lignite to Iv bituminous coals) ranged from 10 to 18. The fact that the aromatic carbons per cluster in the tar residue is higher in the dissolved tar suggests a wide dishbution of species with varying molecular weights in the tar.
The number of aromatic carbons per cluster in the tar residue is very similar to that found in the coal and char. The number of attachments per cluster in the dissolved tar is also significantly smaller than in the coal, while o+l in the tar residue is only slightly less than in the coal. The small number of attachments per cluster in the tars is also reflected in the values of bridges and loops per cluster (B.L.) and side chains per cluster (S.C.).
The average values of chemical smcture features for the composite tar can be determined from combining the values for the dissolved tar and tar residue, according to the respective weight fraction of tar residue. This would raise the number of aromatic carbons per cluster in the tar to 8 and 9 for the two coals, which is still more than 35% lower than in the parent coal. It has been shown with repeated data sets that the number of aromatic carbons per cluster in the char does not increase substantially during devolatilization.s-lo~ 21 The fact that in the tar is lower than in the coal, coupled with the fact that in the char remains constant at the same value as the coal, can only be explained by ring breakage and not bridge breaking. It is known that bond energies in aromatic rings are large, but it is suggested that the heteroatoms (largely oxygen and sulfur) in the clusters weaken the stability of the clusters. This is an interesting development, and suggests that the current view of devolatilization, as explained by current devolatilization models, may be in error.
References
1. Anthony, D. B., J. B. Howard, H. C. Hottel and H. P. Meissner 15th Symposium (International) on Combustion; The Combustion Institute, Pittsburgh, PA: 1974; pp 1303- 1317.
2. Kobayashi, H., J. B. Howard and A. F. Sarofim 16th Symposium (International) on Combustion; The Combustion Institute, Pittsburgh, PA: 1976; 3p 41 1-425.
3. KO, G. H., D. M. Sanchez, W. A. Peters and J. B. Howard 22nd Symposium (International) on Combustion; The Combustion Institute, Pittsburgh, PA: 1988; pp 115-124.
4. Solomon, P. R., D. G. Hamblen, R. M. Carangelo, M. A. Serio and G. V. Deshpande Energy and Fuels 1988,2,405-422.
5. Niksa, S. Energy and Fuels 1991,5,673-683. 6. Fletcher, T. H., A. R. Kerstein, R. J. Pugmire and D. M. Grant Energy and Fuels 1992,6,
414. 7. Solum, M. S., R. J. Pugmire and D. M. Grant Energy and Fuels 1989,3, 187. 8. Fletcher, T. H., M. S. Solum, D. M. Grant, S. Critchfield and R. J. Pugmire 23rd Symposium
(International) on Combustion; The Combustion Institute, Pittsburgh, PA: 1990; pp 1231. 9. Pugmire, R. J., M. S. Solum, D. M. Grant, S. Critchfield and T. H. Fletcher Fuel 1991,70,
414. 10. Fletcher, T. H., M. S. Solum, D. M. Grant and R. J. Pugmire Energy and Fuels 1992,6,643-
650. 11. Fletcher, T. H., S. Bai, R. J. Pugmire, M. S. Solum, S. Wood and D. M. Grant Energy and
Fuels 1993,7,734-742. 12. Solomon, P. R. and T. H. Fletcher The Combustion Institute, Pittsburgh, P A 1990, pp 463. 13. Smith, K. L., L. D. Smoot, T. H. Fletcher and R. J. Pugmire The Structure and Reaction
Processes of Coal; Plenum: New York, 1994. 14. Niksa, S . Energy and Fuels 1995,9,467-478. IS. Freihaut, J. D., W. M. Proscia and D. J. S e e r y Energy and Fuels 1989.3.692-703. 16. Freihaut, J. D., W. Proscia, N. Knight, A. Vranos, H. Kollick and K. Wicks “Combustion
Properties of Micronized Coal for High Intensity Combustion Applications,” Final Report for DOWETC ConIract DE-AC22-85PC80263,1989.
17. Chen, J. C. “Effect of Secondary Reactions on Product Distribution and Nitrogen Evolution from Rapid Coal Pyrolysis,” Stanford University, HTGL Report No. T-280,1991.
18. Monson, C. R. and G. K. Germane Energy and Fuels 1993,7,928-936. 19. Orendt, A. M., M. S. Solum, N. K. Sethi, R. J. Pugmire and D. M. Grant Advances in Coal
Spectroscopy; H. L. C. Meuzelaar, Ed.; Plenum Press: New York, 1992, pp 215-254. 20. Bai, S., R. J. Pugmire, C. L. Mayne and D. M. Grant Analytical Chemistry 1995,67,3433-
3440. 21. Fletcher, T. H. and D. R. Hardesty “Milestone Report for DOE’S Pittsburgh Energy
Technology Center,” contract FWP 0709, Sandia Report No. SAND92-8209, available NTIS, 1992.