coastal erosion planning & response act · coastal erosion planning & response act 4...
TRANSCRIPT

Coastal Erosion Planning & Response Act A Report to the 85th Texas Legislature
Texas General Land Office George P. Bush, Commissioner

Coastal Erosion Planning & Response Act ii 2016-2017 Report
TABLE OF CONTENTS LIST OF FIGURES ............................................................................................................................. iii
LIST OF ACRONYMS ......................................................................................................................... v
INTRODUCTION ............................................................................................................................... 1
ENACTING THE CEPRA PROGRAM ..................................................................................................... 3
CURRENT AND HISTORICAL FUNDING OF THE CEPRA PROGRAM ....................................................... 5
COASTAL PROJECTS IN THE CYCLE 9 BIENNIUM ................................................................................ 7
CONSTRUCTION PROJECTS .............................................................................................................. 8
CYCLE 9 NON-CONSTRUCTION PROJECTS ....................................................................................... 12
PREVIOUS PROJECTS COMPLETED IN THE CYCLE 9 BIENNIUM .......................................................... 18
CONSTRUCTION PROJECTS ............................................................................................................ 19
ECONOMIC AND NATURAL RESOURCE BENEFITS OF THE CEPRA PROGRAM ..................................... 26
LEGISLATION FROM THE 84th LEGISLATURE AFFECTING THE CEPRA PROGRAM ............................... 28
ASSESSMENT OF NEEDS .................................................................................................................. 28
WORKS CITED ................................................................................................................................ 29

Coastal Erosion Planning & Response Act iii 2016-2017 Report
Table of Figures
LIST OF FIGURES Figure 1. Texas Gulf Shoreline Change ..................................................................................................................... 2 Figure 2. CEPRA Project 1591 Magnolia Inlet Shoreline Protection and Marsh Restoration ..................... 3 Figure 3. CEPRA Project 1591 Magnolia Inlet Shoreline Protection and Marsh Restoration ..................... 4 Figure 4. CEPRA Project 1521 End of Seawall Nourishment ............................................................................... 4 Figure 5. CEPRA Cycle 9 Projects ................................................................................................................................ 7 Figure 6. Shamrock Island Shoreline .......................................................................................................................... 8 Figure 7. Bolivar Beach ................................................................................................................................................... 8 Figure 8. Mad Island NWR.............................................................................................................................................. 9 Figure 9. Shamrock Island ............................................................................................................................................. 9 Figure 10. Dellanera Park .............................................................................................................................................. 9 Figure 11. Seawall Dune Construction .................................................................................................................... 10 Figure 12. Rollover Bay Beach Nourishment .......................................................................................................... 10 Figure 13. Port Alto Beach ........................................................................................................................................... 10 Figure 14. Sundown (Chester’s Island) .................................................................................................................... 11 Figure 15. Treasure Island .......................................................................................................................................... 11 Figure 16. Moses Lake and Dollar Bay ..................................................................................................................... 11 Figure 17. Follet’s Island ............................................................................................................................................. 12 Figure 18. The Monitored Beaches of the BMMP .................................................................................................. 12 Figure 19. Galveston Island Permits ......................................................................................................................... 12 Figure 20. Galveston Island ........................................................................................................................................ 13 Figure 21. Causeway Rookery Island ....................................................................................................................... 13 Figure 22. Galveston Island Study ............................................................................................................................ 13 Figure 23. South Padre Island and Lower Laguna Madre................................................................................... 14 Figure 24. North Beach Corpus Christi.................................................................................................................... 14 Figure 25. Swan Lake .................................................................................................................................................... 15 Figure 25. CEPRA Cycles 6-8 Project Completed within the Cycle 9 Biennium ........................................... 18 Figure 26. McFaddin National Wildlife Refuge Shoreline ................................................................................... 19 Figure 27. Bird Island Cove ......................................................................................................................................... 19 Figure 28. Bird Island Cove ......................................................................................................................................... 19 Figure 29. End of Seawall ............................................................................................................................................ 20 Figure 30. Indian Point ................................................................................................................................................. 20 Figure 31. Indian Point ................................................................................................................................................. 20
Photo courtesy of The Nature Conservancy

Coastal Erosion Planning & Response Act iv 2016-2017 Report
Figure 32. Corpus Christi North Beach ................................................................................................................... 21 Figure 33. Surfside Beach ............................................................................................................................................ 21 Figure 34. Surfside Beach ............................................................................................................................................ 21 Figure 35. Bryan Beach ................................................................................................................................................. 22 Figure 36. Dickinson Bayou ........................................................................................................................................ 22 Figure 37. Dickinson Bayou ........................................................................................................................................ 22 Figure 38. Surfside Beach Revetment ...................................................................................................................... 23 Figure 39. Arturo Galvan ............................................................................................................................................. 23 Figure 40. Keith Lake Fish Pass ................................................................................................................................. 23 Figure 41. Oyster Lake ................................................................................................................................................. 24 Figure 42. Magnolia Inlet ............................................................................................................................................. 24 Figure 43. Virginia Point .............................................................................................................................................. 24 Figure 44. Rockport Beach .......................................................................................................................................... 25 Figure 45. Caplen Beach .............................................................................................................................................. 25 Figure 46. Galveston Seawall ...................................................................................................................................... 25

Coastal Erosion Planning & Response Act v 2016-2017 Report
LIST OF ACRONYMS BEG
The University of Texas Bureau of Economic Geology
BMMP Beach Monitoring and Maintenance Plan
BUDM Beneficial Use of Dredged Materials
CBBEP Coastal Bend Bays and Estuaries Program
CEPRA Coastal Erosion and Planning Response Act
CCAC Coastal Coordination and Advisory Committee
CELCP Coastal and Estuarine Land Conservation Program
ERP Erosion Response Plan
FEMA Federal Emergency Management Agency
GIWW Gulf Intracoastal Waterway
GLO General Land Office
NWR National Wildlife Refuge
OBA Texas Open Beaches Act
SPI South Padre Island
Coastal Erosion Planning & Response Act 1 2016-2017 Report
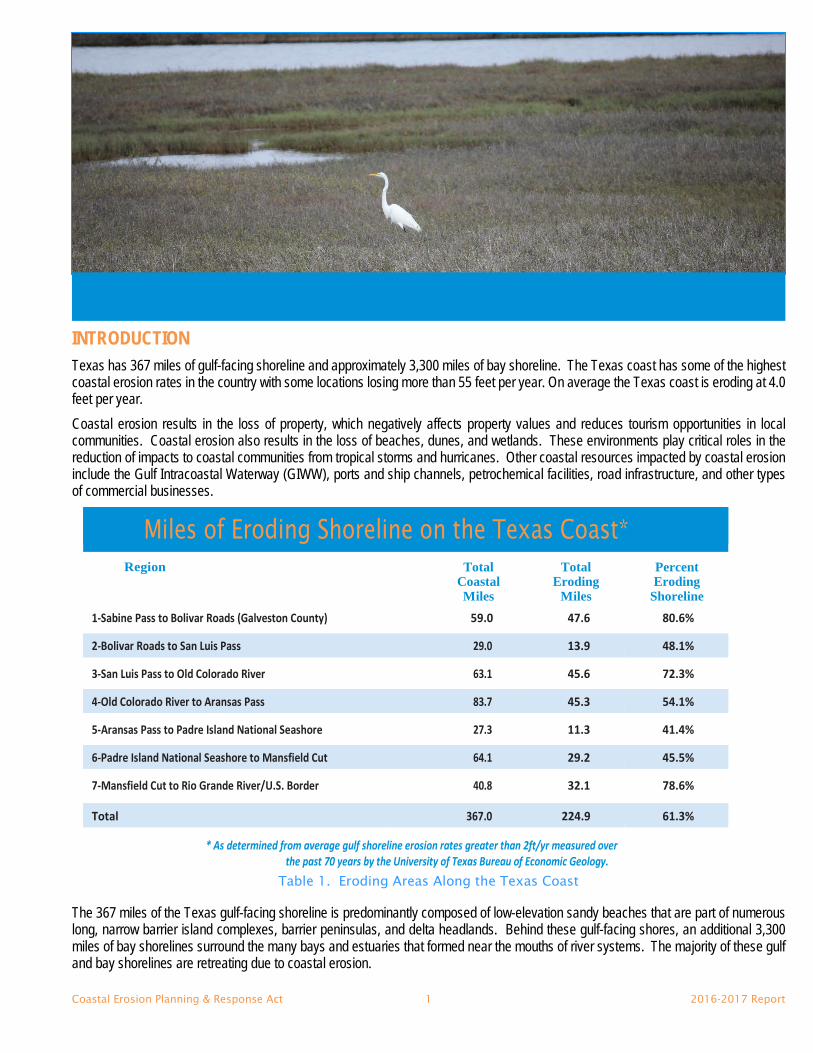
INTRODUCTION Texas has 367 miles of gulf-facing shoreline and approximately 3,300 miles of bay shoreline. The Texas coast has some of the highest coastal erosion rates in the country with some locations losing more than 55 feet per year. On average the Texas coast is eroding at 4.0 feet per year. Coastal erosion results in the loss of property, which negatively affects property values and reduces tourism opportunities in local communities. Coastal erosion also results in the loss of beaches, dunes, and wetlands. These environments play critical roles in the reduction of impacts to coastal communities from tropical storms and hurricanes. Other coastal resources impacted by coastal erosion include the Gulf Intracoastal Waterway (GIWW), ports and ship channels, petrochemical facilities, road infrastructure, and other types of commercial businesses.
Miles of Eroding Shoreline on the Texas Coast* Region
1-Sabine Pass to Bolivar Roads (Galveston County)
Total Coastal Miles
59.0
Total Eroding
Miles 47.6
Percent Eroding
Shoreline 80.6%
2-Bolivar Roads to San Luis Pass 29.0 13.9 48.1%
3-San Luis Pass to Old Colorado River 63.1 45.6 72.3%
4-Old Colorado River to Aransas Pass 83.7 45.3 54.1%
5-Aransas Pass to Padre Island National Seashore 27.3 11.3 41.4%
6-Padre Island National Seashore to Mansfield Cut 64.1 29.2 45.5%
7-Mansfield Cut to Rio Grande River/U.S. Border 40.8 32.1 78.6%
Total 367.0 224.9 61.3%
* As determined from average gulf shoreline erosion rates greater than 2ft/yr measured over the past 70 years by the University of Texas Bureau of Economic Geology.
Table 1. Eroding Areas Along the Texas Coast
The 367 miles of the Texas gulf-facing shoreline is predominantly composed of low-elevation sandy beaches that are part of numerous long, narrow barrier island complexes, barrier peninsulas, and delta headlands. Behind these gulf-facing shores, an additional 3,300 miles of bay shorelines surround the many bays and estuaries that formed near the mouths of river systems. The majority of these gulf and bay shorelines are retreating due to coastal erosion.

Coastal Erosion Planning & Response Act 2 2016-2017 Report
Texas Natural Resources Code §33.601 defines coastal erosion as: “The loss of land, marshes, wetlands, beaches, or other coastal features within the coastal zone because of the actions of wind, waves, tides, storm surges, subsidence, or other forces.” The GLO Rules for Management of the Beach/Dune System (31 TAC §15.2 [32]) define an eroding area as a portion of the shoreline that is experiencing a historical erosion rate of greater than two feet per year based on data published by the University of Texas Bureau of Economic Geology (BEG). Section 33.601(4) of the Natural Resources Code defines a coastal erosion area as: “A coastal area that is experiencing an historical erosion rate, according to the most recently published data of the BEG.” The Commissioner finds coastal erosion to be a threat to:
• Public health, safety or welfare; • Public beach use or access; • General recreation; • Traffic safety; • Public property or infrastructure; • Private, commercial, and residential property; • Fish or wildlife habitat; and • Any area of regional or national importance.”
Figure 1. Texas Gulf Shoreline Change Rates greater than two feet per year are shown in orange and red, and stable or accreting (gaining land) areas are shown in green. Data were compiled from historical erosion rates determined by the University of Texas Bureau of Economic Geology.

Coastal Erosion Planning & Response Act 3 2016-2017 Report
Figure 1 and Table 1 illustrate the distribution and extent of eroding areas of the Texas coast. Eighty percent of the Texas gulf shoreline is retreating with a coast-wide average rate of retreat of approximately four feet per year, with some extreme areas losing as much as 55 feet per year. Sixty-one percent of the Texas gulf shoreline is classified as eroding where the rate of shoreline retreat is greater than two feet per year. The areas experiencing the highest erosion rates in Texas are located along the upper Texas coast from Matagorda County northward, and on the lower Texas coast along South Padre Island in Willacy and Cameron counties. On average, 235 acres of land along the Texas Gulf Coast and the state’s bays, estuaries, and navigation channels are lost each year to erosion.
ENACTING THE CEPRA PROGRAM In order to combat coastal erosion and secure the future of natural resources and the economies of Texas’ coastal communities, the Coastal Erosion Planning and Response Act (CEPRA) was enacted on September 1, 1999, during the 76th Legislative Session. The General Land Office’s (GLOs) Coastal Resources Division administers the CEPRA program with a goal to reduce impacts to valuable coastal resources caused by coastal erosion. Since the inception of the CEPRA program in 1999, nine cycles have been administered. Each cycle consists of a two-year period and coincides with the Legislative biennium. Funding appropriated within the biennium must be encumbered and spent on projects within the biennium unless funding for a particular project is given “carryover” authority by the Legislature. Historically, “carryover” authority has been given to projects leading to or involving construction that are not anticipated to be completed within that biennium. The CEPRA program partners with other state, federal, and local governments, as well as non-profit organizations to develop and fund coastal erosion projects. According to Texas Natural Resources Code, §33.603(e), beach nourishment projects require at least 25 percent match funding while other coastal erosion response studies or projects require at least 40 percent match funding. In addition to meeting minimum match funding requirements, the CEPRA program consistently leverages additional support through other funding sources such as grants. During the Cycle 9 biennium, $14,271,940 of CEPRA funding was leveraged to obtain $11,462,267 in match funding for a total of $25,734,207 in project funds.
Figure 2. CEPRA Project 1591 Magnolia Inlet Shoreline Protection and Marsh Restoration Magnolia Inlet pre-construction(left) versus 1-year post-construction (right).

Coastal Erosion Planning & Response Act 4 2016-2017 Report
The CEPRA program administers a wide variety of coastal projects to reduce impacts from coastal erosion. These projects include alternative analyses studies to evaluate different erosion response methods, engineering design of preferred methods, beach and dune restoration; habitat restoration of coastal wetlands; shoreline protection using hard and soft techniques; scientific studies to collect data in support of the program; structure removal assistance and debris removal; and other projects that continue to promote sound coastal stewardship.
Figure 3. CEPRA Project 1591 Magnolia Inlet Shoreline Protection and Marsh Restoration Magnolia Inlet pre-construction (left) and post-construction (right). Received State of Texas Honors and “Texas Environmental Excellence Award” in 2016.
Figure 4. CEPRA Project 1521 End of Seawall Nourishment Pre-construction (left) and post-construction (right). Winner of the “Best Restored Beach” award from ASBPA 2015.

Coastal Erosion Planning & Response Act 5 2016-2017 Report
CURRENT AND HISTORICAL FUNDING OF THE CEPRA PROGRAM The 84th Legislature appropriated $22,500,000.00 to the GLO to administer coastal programs. This appropriation was used in part to fund Cycle 9 projects and studies under CEPRA. Cycle 9 covers the period from September 1, 2015 to August 31, 2017. The Coastal Projects in the Cycle 9 Biennium section describes the projects and studies that are currently in progress. The funding was also leveraged against $11,462,267 of matching funds from federal and other local sources.
Summary of CEPRA Funding Allocations by Cycle Funding Cycle
Projects Funded
CEPRA Funding
Partner Match
Federal Leverage
Other Leverage
Total Budget for Cycle
9 (FY16 - 17) 18 $14,271,940 $2,976,525 $8,485,741.86 $25,734,207
8 (FY14 - 15) 21 $14,026,070 $11,387,346 $15,962,631.00 $41,376,046
7 (FY12 - 13) 26 $15,256,290 $2,287,965 $39,684,330 $57,228,585
6 (FY10 - 11) 28 $5,463,806 $13,090,187 $55,824,351
$74,378,344
5 (FY08 - 09) 59 $17,822,687 $5,460,873 $12,866,313 $36,149,873
4 (FY06 - 07) 49 $7,300,000 $2,035,616 $6,466,752
$15,802,368
3 (FY04 - 05) 48 $7,320,000 $2,104,390 $12,862,988 $93,500 $22,380,878
2 (FY02 - 03) 63 $15,000,000 $5,732,233 $6,991,532
$27,723,765
1 (FY00 - 01) 43 $15,000,000 $6,316,995 $6,059,267 $595,680 $27,971,942
Table 2. Summary of CEPRA Funding Allocations by Cycle
Note: Cycle 9 appropriations were $22,467,920.00, Cycle 5, 6, 7 and 8 appropriations were $25M, $25.2M, and $22.5M respectively. These funds were provided to administer coastal programs which include, but are not limited to, projects under the CEPRA Program. Cycle 6 appropriations were reduced to comply with the mandatory legislative budget reduction. Additionally, GLO management decided to take further reductions and return additional funds to the Legislature in order to assist with the statewide budget deficit.

Coastal Erosion Planning & Response Act 6 2016-2017 Report
Table 3. CEPRA Funding vs. Total Budget by Cycle
Biennium State
Funding Source Matching Funds Completed
Number of Projects Requested
Number of Projects
Funding Requests
2000-2001 $15M General Revenue $12,971,942 42 63 $129,171,116 Cycle 1
& General Revenue Dedicated
Funds (CPF) 2002-2003 $15M General Revenue $12,723,765 53 64 $108,221,545
Cycle 2
& General Revenue Dedicated Funds (CPF)
2004-2005 $25M General Revenue Dedicated
Funds (CPF) $15,060,878 20 77 $36,498,859 Cycle 3
2006-2007 $15M General Revenue Dedicated
Funds (CPF) $8,502,368 49 81 $111,780,028 Cycle 4
2008-2009 $25M Sales Tax on $18,327,186 59 84 $58,057,437
Cycle 5
Sporting Goods (MOU with Parks and Wildlife)
2010-2011 $25.2M Sales Tax on Sporting Goods (MOU with Parks and Wildlife) $76,957,155 32 62 $78,876,876
Cycle 6
2012-2013 $22.5M Sales Tax on $41,972,295 26 43 $97,200,241 Cycle 7
Sporting Goods (MOU with
Parks and Wildlife) 2014-2015 $22.5M Sales Tax on $27,349,977 21 34 $41,376,047
Cycle 8
Sporting Goods (MOU with Parks and Wildlife)
2016-2017 $22.5M General Revenue $11,375,488 23 30 $12,760,140 Cycle 9
& General Revenue Dedicated
Funds (CPF)
Table 4. CEPRA Funding Appropriations for Each Biennium
$0
$10,000,000
$20,000,000
$30,000,000
$40,000,000
$50,000,000
$60,000,000
$70,000,000
$80,000,000
Cycle 9 Cycle 8 Cycle 7 Cycle 6 Cycle 5 Cycle 4 Cycle 3 Cycle 2 Cycle 1
CEPRA Total Budget
Comparison of CEPRA Funding to Total Budget by Cycle
CEPRA Funding Appropriations for Each Biennium

Coastal Erosion Planning & Response Act 7 2016-2017 Report
COASTAL PROJECTS IN THE CYCLE 9 BIENNIUM
This report contains CEPRA Cycle 9 projects and results of Cycle 7 through Cycle 8 projects that have been completed during the Cycle 9 biennium. Cycle 9 of the CEPRA Program approved 18 GLO- or Qualified Project Partner-led projects focused on beach nourishment; beach nourishment with Beneficial Use of Dredged Material (BUDM); Marsh and Wetland Restoration; Shoreline Protection; Alternatives Analysis, Permitting, Engineering and Design; and Studies (Figure 5). Highlights within this report include eroding areas, a calculated economic and natural resource benefit analysis that the CEPRA program provides for the state’s economy, and an estimated cost to fund needs during the next CEPRA cycle. These reporting requirements are in accordance with Texas Natural Resources Code §33.608.
Figure 5. CEPRA Cycle 9 Projects

Coastal Erosion Planning & Response Act 8 2016-2017 Report
Figure 6. Shamrock Island Shoreline Shamrock Island is an important bird rookery located just miles south of Port Aransas.
CONSTRUCTION PROJECTS Bolivar Beach Restoration Leveraging CIAP (1610) Partner(s): Galveston County Type: Beach Nourishment Budget: $5,785,741.86 Location: Galveston County CEPRA Share: $2,000,000.00 Project Description Beach nourishment project constructing up to 6,538 LN FT of beach area and up to 9,000 yd3 of dune restoration along the Gulf of Mexico and Caplen Beach, west of Rollover Pass on Bolivar Peninsula. The project was initiated in October of 2016.
Figure 7. Bolivar Beach Beach shoreline pre-construction.

Coastal Erosion Planning & Response Act 9 2016-2017 Report
Mad Island Wildlife Management Area Shoreline Protection (1612) Partner(s): Texas Parks and Wildlife Department Type: Shoreline Protection Budget: $1,000,000.00 Location: Matagorda County CEPRA Share: $500,000.00 Project Description Mad Island project will build approximately 3,010 LN FT of rock breakwater to protect approximately 197 acres of existing marsh and upland habitat that may be potentially lost under the current erosion rate. The project will potentially restore approximately 3.8 acres of intertidal wetlands. The project was initiated in October of 2016.
Figure 8. Mad Island NWR GIWW aerial pre-construction; Google Earth imagery.
Shamrock Island Protection and Habitat Enhancement Phase II (1614)Partner(s): The Nature Conservancy Type: Shoreline Protection Budget: $1,69,336.00 Location: Nueces County CEPRA Share: $500,000.00 Project Description The project provides for the placement of sediment fill for two breached areas on the island and three offshore rock breakwaters totaling an approximate 915 LN FT along the southwest side of the island. This will compliment on-going restoration work undertaken by the Nature Conservancy aimed at protecting the island’s eroding shorelines and providing enhanced habitat restoration for nesting birds and marine-dependent species. The project was initiated in July of 2016. Construction was completed in January of 2017.
Figure 9. Shamrock Island 2016 aerial imagery pre-construction versus 2017 aerial imagery post-construction.
Dellanera Park Beach Nourishment (1615)Partner(s): Galveston Park Board of Trustees Type: Beach Nourishment with BUDM Budget: $600,000.00 Location: Galveston County CEPRA Share: 450,000.00 Project Description The project proposes to nourish a section of beach that is located immediately west of the end of the Galveston Seawall, and continues west for 2,300 LN FT. This stretch of beach is some of the most erosion-prone experiencing averages of ~ 8ft/yr. The project is expected to widen the beach and provide increased storm protection.
Figure 10. Dellanera Park Beach nourishment placement area; Google Earth imagery.

Coastal Erosion Planning & Response Act 10 2016-2017 Report
Innovative Technology: Sustaining Dune Growth with Seabales (1618)Partner(s): Texas A&M University Galveston, Galveston Park Board of Trustees Type: Dune Construction/Study Budget: $239,461.00 Location: Nueces County CEPRA Share: $179,461.00 Project Description The project builds on a Cycle 8 completed study in which a prototype dune was constructed with a core of compacted seaweed bales which provides added dune durability and a nutrient source to the overlying flora as the seaweed interiors decompose. This Cycle 9 continuation offers an effective and sustainable way to rid coastlines of abundant seaweed landings which plague Texas’ coasts. The project will be conducted at an actively eroding area in front of 69th and Seawall in Galveston, Texas. This pioneering project will demonstrate the dunes efficacy at providing erosion control and a sediment source in front of a seawall. Half of the engineered dune will be emplaced on a newly nourished
beach allowing active monitoring of the dunes support in maintaining nourishment efforts. The project is anticipated to begin in summer of 2017.
Figure 11. Seawall Dune Construction Proto-type dune proposed location, 69th & Seawall, Galveston; Google Earth imagery.
GIWW-Rollover Bay Reach Beach Nourishment with BUDM FY2017 Event (1619)Partner(s): Galveston County Type: BUDM Placement Budget: $5,000,000.00 Location: Galveston County CEPRA Share: $225,000.00 Project Description The project will place an estimated 136,000 yd3 of dredged material from the GIWW onto the beach location adjacent to the orange line shown in the figure. The anticipated total length of placement will be roughly 3,000 FT. The BUDM placement area is 1,000 FT west of Rollover Pass on Caplen Beach. Placement is anticipated to occur during early 2017.
Figure 12. Rollover Bay Beach Nourishment Proposed beach nourishment location; Google Earth imagery.
Port Alto North Beach Shoreline Restoration Project (1624)Partner(s): Calhoun County Type: Beach Nourishment/Shoreline Restoration Budget: $250,000.00 Location: Port Alto Beach CEPRA Share: $187,500.00 Project Description The project will permit Beneficial Use of Dredged Material (BUDM) to allow adjacent dredged material to be placed along the eroding shorelines and breached marsh areas of Port Alto’s North Beach. BUDM fill placement is anticipated to be part of the project during this phase.
Figure 13. Port Alto Beach Proposed area of nourishment; Google Earth imagery.

Coastal Erosion Planning & Response Act 11 2016-2017 Report
Sundown Island (1625)Partner(s): Audubon Texas Type: Beach Nourishment/Shoreline Restoration Budget: $140,133.00 Location: Galveston County CEPRA Share: $125,000.00 Project Description The project will create a final engineering design template for beach nourishment using BUDM cycles to reestablish the original 100-acre island footprint. Two BUDM cycles will be placed strategically around the island to prevent further erosion before hard structures can be put in place. BUDM placement is anticipated to occur during 2016 and 2017.
Figure 14. Sundown (Chester’s Island) Sundown Island Google Earth imagery; 2011 versus 2013.
Treasure Island MUD Shoreline Protection (1626)Partner(s): The Treasure Island Municipal Utility District (MUD) Type: Engineering, Design, Permitting, & Beach Nourishment Budget: $1,000,000.00 Location: Brazoria County CEPRA Share: $600,000.00 Project Description The project will complete engineering, design, and permitting for the construction of a shoreline protection revetment to connect the existing stone revetment terminating near the extent of Gulf Beach Drive into the CR257 bridge abutment. Additionally, a dune would be constructed over to revetment or directly behind it to enhance dune habitat. A Beach Nourishment component has been added to this phase of the project.
Figure 15. Treasure Island Proposed revetment area; Google Earth imagery 2015.
Moses Lake Shoreline Protection Phase 3 and Dollar Bay Marsh Restoration (1627)Partner(s): Audubon Texas Type: Beach Nourishment/Shoreline Restoration Budget: $176,250.00 Location: Galveston County CEPRA Share: $101,250.00 Project Description Follow-up phased shoreline protection and marsh restoration project to the Moses Lake Shoreline Protection Phase 2 project. The project scope involves data collection, permitting and final engineering design. If constructed in a future funding biennium, the project would protect up to 4,000 LN FT of shoreline and adjacent habitat along the north shoreline of Moses Lake and restore an estimated 30 acres of degraded wetland habitat in Dollar Bay. The local project partner, Galveston Bay Foundation, is taking the project lead and is responsible for overall execution of the project.
Figure 16. Moses Lake and Dollar Bay Google Earth imagery; 2006 versus 2015.

Coastal Erosion Planning & Response Act 12 2016-2017 Report
CYCLE 9 NON-CONSTRUCTION PROJECTS Follet’s Island Feeder Beach Phase I (1583)Partner(s): Brazoria County Type: Permitting, Beach Nourishment Budget: $60,000.00 Location: Eastern End of Follet’s Island CEPRA Share: $45,000.00 Project Description The project will continue efforts to permit the proposed borrow site for nearshore beach nourishment. The funds will be used to continue a formal consultation with USFWS to analyze piping plover habitat.
Figure 17. Follet’s Island Google Earth imagery 2015.
Beach Monitoring and Maintenance Plan (1602) Partner(s): Internally-required CEPRA study Type: Study Location: Coast-wide CEPRA Share: $3,900,000.00 Project Description According to FEMA, a BMMP is a prerequisite for receiving funding under the Public Assistance (PA) program for the mitigation of damages to engineered beaches impacted by federally declared disasters. In order to meet FEMA requirements, the GLO completed the BMMP in June 2010. In accordance with FEMA requirements, pre- and post-storm surveys will be used to determine the eligible volume of sand. Survey data are now collected annually to measure sand loss/gain at each engineered beach. In addition, surveys are typically conducted prior to the corresponding hurricane season. This project will conduct surveys of 12 beaches during the Cycle 9 biennium.
Figure 18. The Monitored Beaches of the BMMP Texas coast; Google Earth imagery 2016.
Galveston Park Board USACE Permit Amendments (1616)Partner(s): Galveston Park Board of Trustees Type: Permitting, Beach Nourishment Budget: $140,133.00 Location: Galveston County CEPRA Share: $125,000.00 Project Description The project will amend the Galveston Park Board’s two USACE permits to incorporate potential sand source identified through the Upland Sand Source Assessment (CEPRA Project No. 1628).
Figure 19. Galveston Island Permits Google Earth imagery 2015.

Coastal Erosion Planning & Response Act 13 2016-2017 Report
Local Dredging Feasibility Study (1621) Partner(s): Galveston Park Board of Trustees Type: Study Budget: $200,000.00 Location: Galveston County CEPRA Share: $120,000.00 Project Description A feasibility study will be conducted to determine the viability of Galveston Park Board of Trustees and City of Galveston ownership, maintenance, and operation of a hydraulic dredge to enable ongoing beach nourishment.
Figure 20. Galveston Island Google Earth imagery 2015.
Causeway Rookery Island Habitat Protection (1623)Partner(s): Coastal Bend Bays and Estuaries Program (CBBEP); Coastal Management Program (CMP) Type: Engineering, Design, Shoreline Restoration Budget: $140,000.00 Location: Nueces County CEPRA Share: $84,000.00 Project Description The project will create a final engineering design template for shoreline restoration using breakwaters around the north and south end of the island. This project is co-funded by CMP.
Figure 21. Causeway Rookery Island Google Earth imagery 2014.
Upland Sand Source Assessment Feasibility Study (1628)Partner(s): Galveston Park Board of Trustees Type: Study Budget: $400,000.00 Location: Galveston County CEPRA Share: $240,000.00 Project Description A feasibility study will be conducted to determine viability and availability of potential upland sand sources located on Galveston Island that may be used for “truck hauled” coastal restoration projects.
Figure 22. Galveston Island Study Google Earth imagery 2015.

Coastal Erosion Planning & Response Act 14 2016-2017 Report
BEG Shoreline Update and Laguna Madre/SPI Lidar Acquisition (1631)Type: Internally-required CEPRA Study Budget: $400,191.00 Location: Coast-wide; South Padre Island/Laguna Madre Project Description This is a two-part study where the researchers at the Bureau of Economic Geology (BEG), will be updating shoreline change rates and determining beach/dune volume and elevation relationships along the Texas Gulf of Mexico and acquiring data for South Padre Island and the Lower Laguna Madre. The gulf shoreline update will be based on data acquired during an airborne lidar survey undertaken by the USACE. The SPI/Lower Laguna Madre lidar will be acquired separately by the researchers at the BEG. Principal purposes of these surveys will be to (a) update long- and short-term shoreline change rates for the Texas Gulf shoreline that were most recently updated in 2012; (b) compare current beach and dune volumes with those calculated for past Texas Gulf beach and dune lidar surveys in 2000, 2010, 2011, and 2012, (c) quantify beach and dune volume and elevation relationships, and (d) determine the feasibility of routine shallow bathymetric data collection under typical murky water conditions using an airborne lidar system.
Figure 23. South Padre Island and Lower Laguna Madre Proposed coverage for airborne lidar survey conducted by the BEG.
Economic and Natural Resource Benefit-Cost Study of CEPRA Projects (1632)Partner(s): Internally-required CEPRA study Type: Study Location: Coast-wide CEPRA Share: $220,872.00 Project Description The Texas Legislature requires the GLO to report the economic and natural resource benefits derived from CEPRA construction projects every biennium. As such, the GLO contracted Taylor Engineering, Inc. to perform the benefit-cost analyses for 15 selected Cycle 7-8 construction projects, which is a representative sampling of the CEPRA program. This study will be discussed in detail in the Economic and Natural Resources Benefit of the CEPRA Program section.
Figure 24. North Beach Corpus Christi Post-construction aerial imagery.

Coastal Erosion Planning & Response Act 15 2016-2017 Report
Swan Lake Marsh Restoration Phase I (1636) Partner(s): Natural Resource Damage Assessment (NRDA) Trustees Type: Engineering, Design, Permitting, Marsh Restoration Budget: $400,000.00 Location: Galveston County CEPRA Share: $200,000.00 Project Description Phase I of this project involves alternatives analysis, surveying, engineering, and design for marsh restoration at the Swan Lake Superfund site. A minimum of 40 acres of estuarine marsh will be restored.
Figure 25. Swan Lake Swan Lake with yellow polygons illustrating proposed restoration areas; Google Earth imagery 2012.
.
Photo courtesy of The Nature Conservancy

Coastal Erosion Planning & Response Act 16 2016-2017 Report
Project Number
Project Name County Project Type
CEPRA Allocation
Local Allocation
County CIAP/Corps Allocation
Total Project Cost
1583 Follet's Island Feeder Beach Phase 1 Galveston S $45,000.00
$45,000.00
1602 BMMP Cycle 9 Coast-wide BN $3,900,000.00
$3,900,000.00
1610 Bolivar Beach Restoration Leveraging
CIAP Galveston BN $2,000,000.00
County CIAP $3,785,742.00 $5,785,741.86
1612 Mad Island Wildlife Management Area
Shoreline Protection Matagorda SP $500,000.00 $500,000.00 $1,000,000.00
1614 Shamrock Island Protection and Habitat
Enhancement Phase II Nueces SP $1,069,336.00 $712,892.00 $1,782,228.00
1615 Dellanera Park Beach Nourishment Galveston BN $450,000.00
$450,000.00
1616 Galveston Park Board USACE Permit
Amendments Galveston P $150,000.00 $100,000.00
$250,000.00
1618 Innovative Technology: Sustaining Dune
Growth with Seabales Galveston SP $179,461.00 $60,000.00 $239,461.00
1619 GIWW-Rollover Bay Reach Beach
Nourishment with BUDM FY2017 Event Galveston BUDM $225,000.00 $75,000.00 Corps $4,700,000.00 $5,000,000.00
1621 Local Dredging Feasibility Study Galveston S $120,000.00 $80,000.00
$200,000.00
Totals $8,638,797.00 $1,527,892.00 $8,485,742.00 $14,752,430.86
CEPRA Cycle 9 Project Allocations

Coastal Erosion Planning & Response Act 17 2016-2017 Report
Project Number
Project Name County Project Type
CEPRA Allocation
Local Allocation
Texas Trustees/NRDA
Funds
Total Project Cost
1623 Causeway Rookery Island Habitat
Protection Nueces E&D $84,000.00 $56,000.00 $140,000.00
1624 Port Alto North Beach Shoreline
Restoration Project Calhoun P&BN $187,500.00 $62,500.00 $250,000.00
1625 Sundown Island Shoreline Erosion Protection and Habitat Restoration Matagorda E&D $125,000.00 $15,133.00 $140,133.00
1626 Treasure Island MUD Shoreline
Protection Galveston SP $600,000.00 $400,000.00 $1,000,000.00
1627 Moses Lake Shoreline Protection
Phase 3 and Dollar Bay Marsh Restoration
Galveston SP & MR $750,000.00 $390,000.00 $1,140,000.00
1628 Upland Sand Source Assessment
Feasibility Study Galveston S $240,000.00 $160,000.00 $400,000.00
1631 BEG Shoreline Change Update Coast-wide S $400,191.00
$400,191.00
1632 Economic and Natural Resource
Benefit-Cost Study of CEPRA Projects
Coast-wide S $220,872.00
$220,872.00
1636 Swan Lake Marsh Restoration
Phase I Galveston E&D $200,000.00 $200,000.00 $400,000.00
Totals
$2,807,563.00 $1,083,633.00 $200,000.00 $4,091,196.00
TOTAL CEPRA ALLOCATION
TOTAL LOCAL ALLOCATION
TOTAL EXTERNAL ALLOCATION
CYCLE 9 TOTAL PROJECT COST
$11,446,360.00 $2,611,525.00 $8,685,742.00 $22,743,627.00
Table 5. CEPRA Cycle 9 Project Allocations
CEPRA Cycle 9 Project Allocations Continued

Coastal Erosion Planning & Response Act 18 2016-2017 Report
PREVIOUS PROJECTS COMPLETED IN THE CYCLE 9 BIENNIUM This section will review previous CEPRA Projects from Cycles 6, 7, and 8 that were completed during the Cycle 9 biennium. Many of these projects were analyzed for the Economic and Natural Resources Benefit Study.
Figure 25. CEPRA Cycles 6-8 Project Completed within the Cycle 9 Biennium

Coastal Erosion Planning & Response Act 19 2016-2017 Report
CONSTRUCTION PROJECTS McFaddin NWR Beach Ridge Restoration (1516)Partner(s): Jefferson County Type: Beach Nourishment/Shoreline Protection Budget: $3,750,000.00 Location: Jefferson County CEPRA Share: $50,000.00 Project Description The project restored dunes and beach ridge elevations along approximately seven miles of shoreline to a height sufficient to retard the influx of Gulf water during most storm and high tide events. The restored dune/beach ridge is providing protection for approximately 30,000 acres of nationally significant wetlands within the McFaddin NWR from the increasing frequency of salt water inundation from the Gulf of Mexico.
Figure 26. McFaddin National Wildlife Refuge Shoreline Construction imagery.
Bird Island Cove Marsh Restoration (1520)Partner(s): Jefferson County Type: Shoreline Protection Budget: $3,750,000.00 Location: Jefferson County CEPRA Share: $50,000.00 Project Description The project supplied protection to approximately 114 acres of existing coastal wetlands through the construction of a breakwater protecting them from continued erosion and the restoration of approximately 70 acres of estuarine marsh complex (intertidal fringe marsh, salt flat marsh, sand flat and protected shallow water).
Figure 27. Bird Island Cove Post-construction imagery.
Figure 28. Bird Island Cove Post-construction aerial imagery.

Coastal Erosion Planning & Response Act 20 2016-2017 Report
End of Seawall Beach Nourishment (1521) Partner(s): Scenic Galveston Type: Beach Nourishment Budget: $3,575,000.00 Location: Galveston County CEPRA Share: $675,000.00 Project Description The project constructed approximately 10,000 LN FT of breakwaters parallel to the Virginia Point shoreline. Winner of the “Best Restored Beach Award” from ASBPA in 2015.
Figure 29. End of Seawall Post-construction aerial imagery.
Indian Point Shoreline Protection & Marsh Restoration (1527) Partner(s): Coastal Bend Bays and Estuaries Program (CBBEP) Type: Shoreline Protection Budget: $925,000.00 Location: Nueces County CEPRA Share: $525,000.00 Project Description Approximately 4,300 LN FT of breakwaters and a revetment were constructed along the peninsula’s south side to protect 2,500 FT of eroding shoreline.
Figure 30. Indian Point Post-construction aerial imagery
Figure 31. Indian Point Post-construction aerial imagery.

Coastal Erosion Planning & Response Act 21 2016-2017 Report
Corpus Christi North Beach Nourishment (1569) Partner(s): City of Corpus Christi Type: Beach Nourishment Budget: $2,613,000.00 Location: Nueces County CEPRA Share: $2,538,000.00 Project Description Corpus Christi North Beach is located in Nueces County just north of Corpus Christi proper within Corpus Christi Bay. The project re-nourished approximately 8,000 LN FT of beach.
Figure 32. Corpus Christi North Beach Post-construction imagery.
Village of Surfside BMMP (1570) Partner(s): CEPRA-Maintained Beach Type: Beach Nourishment Location: Brazoria County CEPRA Share: $1,700,000.00 Project Description Due to ongoing monitoring efforts in accordance with the BMMP during Cycle 8, Surfside Beach was selected to receive needed re-nourishment. The project provided approximately 2,000 LN FT of renourishment to the beach area. CEPRA Project No.1573 consisted of adding on to the current revetment landward of the beach nourishment.
Figure 33. Surfside Beach Construction imagery.
Figure 34. Surfside Beach Construction imagery.

Coastal Erosion Planning & Response Act 22 2016-2017 Report
Bryan Beach Nourishment (1571) Partner(s): Town of Quintana Type: Beach Nourishment Budget: $1,605,796.12 Location: Brazoria County CEPRA Share: $702,000.00 Project Description Bryan Beach is located in Brazoria County along the Gulf of Mexico shoreline to the west of the Freeport jetties. Due to ongoing monitoring efforts in accordance with the BMMP during Cycle 8, Bryan Beach was selected to receive needed re-nourishment. The project provided approximately 36,000 yds3 of beach nourishment along 1,900 LN FT of Bryan Beach.
Figure 35. Bryan Beach Post-construction aerial imagery.
Dickinson Bayou Wetland Restoration (1572)Partner(s): Texas Parks and Wildlife Department Type: Wetland Restoration; Shoreline Protection Budget: $1,511.86 Location: Galveston County CEPRA Share: $700,000.00 Project Description The project has restored, enhanced, and protected vital wetlands along Dickinson Bayou. The marsh restoration was constructed by dredging approximately 50,400 yd3 of bay bottom sediments from borrow areas and placing the sediments into two marsh cells, restoring approximately 17.5 acres. The project included construction of approximately 3,000 LN FT of earthen berms and 2,050 LN FT of living shoreline structures.
Figure 36. Dickinson Bayou Post-construction aerial imagery.
Figure 37. Dickinson Bayou Post-construction imagery.

Coastal Erosion Planning & Response Act 23 2016-2017 Report
Village of Surfside Beach Revetment Emergency Repair (1573) Partner(s): Village of Surfside Type: Shoreline Protection Budget: $721,298.00 Location: Galveston County CEPRA Share: $721,298.00 Project Description This project encompassed final design and construction of a revetment repair to provide protection to Beach Drive, utilities, and public infrastructure landward of Beach Drive against erosion and breaching. The revetment repair consisted of adding stone to stabilize the toe of the existing stone revetment; CEPRA Project No.1570 consisted of nourishing the beach seaward of the revetment.
Figure 38. Surfside Beach Revetment Construction imagery.
Arturo Galvan Coastal Park Living Shoreline (1576) Partner(s): City of Port Isabel Type: Shoreline Protection Budget: $787,515.00 Location: Cameron County CEPRA Share: $467,800.00 Project Description Approximately 2,000 FT of living shoreline was constructed at the Arturo Galvan Coastal Park adjacent to the Lower Laguna Madre within the City of Port Isabel. Additional work consisted of debris removal along the shoreline, shoreline earthwork grading, construction of approximately 1,885 LN FT of breakwaters, marsh vegetation, transplanting, and reseeding.
Figure 39. Arturo Galvan Post-construction imagery.
Keith Lake Fish Pass Baffle (1577) Partner(s): Jefferson County Type: Marsh Restoration Budget: $5,102,000.00 Location: Jefferson County CEPRA Share: $1,890,000.00 Project Description This project constructed a rock baffle to restore the hydrologic connectivity of the marsh system to pre-development conditions. The baffle reduced the cross section of the Keith Lake Fish Pass, greatly reducing the velocity of water and decreasing the salinity within Keith Lake.
Figure 40. Keith Lake Fish Pass Post-construction imagery.

Coastal Erosion Planning & Response Act 24 2016-2017 Report
Oyster Lake Habitat Protection (1588) Partner(s): Galveston Bay Foundation Type: Shoreline Protection Budget: $500,000.00 Location: Brazoria County CEPRA Share: $270,000.00 Project Description Approximately 5,000 LN FT of breakwaters were constructed to abate shoreline erosion in Oyster Lake. Oyster Lake is located south of West Bay and west of the Freeport jetties in Brazoria County. The Oyster Lake Shoreline Protection and Marsh Restoration Project received the USFWS' Southwest Region Annual "Partnership of the Year" Award for 2016.
Figure 41. Oyster Lake Post-construction imagery
Magnolia Inlet Marsh Restoration (1591) Partner(s): TAMU-AgriLife Research Type: Marsh Protection Budget: $259,064.00 Location: Calhoun County CEPRA Share: $99,064.00 Project Description This project removed a blocked inlet to restore tidal flow and stop erosion of 770 acres of interior wetlands and the adjacent shoreline. Portions of the removed inlet material was transported and used as 112 LN FT of living shoreline protection in Old Town Lake. State of Texas Honors and 2016 Texas Environmental Awards Winner.
Figure 42. Magnolia Inlet Construction imagery.
Virginia Point Wetland Protection and Restoration (1596) Partner(s): Scenic Galveston Type: Shoreline Protection Budget: $3,575,000.00 Location: Galveston County CEPRA Share: $675,000.00 Project Description The project constructed approximately 10,000 LN FT of breakwaters parallel to the Virginia Point shoreline.
Figure 43. Virginia Point Post-construction aerial imagery.

Coastal Erosion Planning & Response Act 25 2016-2017 Report
Rockport Beach BMMP (1603) Partner(s): Aransas County Navigation District Type: Beach Nourishment Budget: $429,500.00 Location: Aransas County CEPRA Share: $397,500.00 Project Description This project provided approximately 6,933 yd3 of beach nourishment along 4,700 LN FT of Rockport Beach in accordance with the BMMP.
Figure 44. Rockport Beach Post-construction imagery.
GIWW Rollover Bay Reach BUDM FY15 Event (1608)Partner(s): USACE, Galveston County Type: Beach Nourishment Budget: $5,795,020.00 Location: Galveston County CEPRA Share: $197,500.00 Project Description Beach nourishment project beneficially utilizing approximately 171,000 cubic yards of material dredged from the fall-winter 2014 U.S. Army Corps of Engineers maintenance dredging of the Gulf Intracoastal Waterway (GIWW) Rollover Bay Reach and placement along approximately 102,000 linear feet of Caplen Beach just west of Rollover Pass. Work was completed in mid-February 2015.
Figure 45. Caplen Beach Post-construction aerial imagery.
Galveston Seawall BUDM West of 61st to 103rd St (1609)Partner(s): USACE, Galveston County Type: Beach Nourishment Budget: $25,000,000.00 Location: Galveston County CEPRA Share: $2,000,000.00 Project Description Beach nourishment project beneficially utilizing approximately 750,000 cubic yards of material dredged from the U.S. Army Corps of Engineers maintenance dredging of the Galveston Ship Channel and placement along the seawall beginning at 61st Street and continuing westward to 103rd Street. Work was completed in November of 2015.
Figure 46. Galveston Seawall Post-construction; Google Earth imagery 2016.

Coastal Erosion Planning & Response Act 26 2016-2017 Report
ECONOMIC AND NATURAL RESOURCE BENEFITS OF THE CEPRA PROGRAM Texas’ coastal assets, including infrastructure, industry, public and private property, beaches, dunes, wetlands, marshes, and parks, provide significant economic value for the Texas citizenry. Natural and man-made activities, such as storms or cuts in barrier islands, and their subsequent consequences of erosion and increased damage to property and infrastructure adversely affect these coastal assets. The Texas Legislature requires the GLO to report the economic and natural resource benefits derived from CEPRA construction projects every biennium. As such, the GLO contracted Taylor Engineering, Inc. to perform the benefit-cost (B/C) analyses for fifteen Cycle 7-8 construction projects. The study reported that the state of Texas received $5.70 in economic and financial benefits for every dollar of state funding invested in these projects. This result is based on analysis of the following fifteen CEPRA Cycle 7–8 construction projects, which is a representative sampling of the CEPRA program:
• No. 1516 McFaddin NWR Beach Ridge Restoration (Cycle 7) • No. 1520 Bird Island Cove Marsh Restoration (Cycle 7) • No. 1521 End of Seawall Beach Nourishment (Cycle 7) • No. 1527 Indian Point Shoreline Protection & Marsh Restoration (Cycle 7) • No. 1569 Corpus Christi North Beach BMMP Maintenance Re-nourishment (Cycle 7), performed in accordance
with the GLO Beach Monitoring and Maintenance Plan • No. 1570 Village of Surfside Beach BMMP Maintenance Re-nourishment (Cycle 7), performed in accordance with
the GLO Beach Monitoring and Maintenance Plan • No. 1571 Quintana-Bryan Beach Nourishment (Cycle 7), a Hurricane Ike FEMA repair project • No. 1573 Village of Surfside Beach Revetment Emergency Repair (Cycle 7) • No. 1576 Arturo Galvan Coastal Park Living Shoreline Restoration (Cycle 8) • No. 1577 Keith Lake Fish Pass Baffle Shoreline Protection & Marsh Restoration (Cycle 8) • No. 1588 Oyster Lake Habitat Restoration (Cycle 8) • No. 1591 Magnolia Inlet Shoreline Protection & Marsh Restoration (Cycle 8) • No. 1603 Rockport Beach BMMP Maintenance Re-nourishment (Cycle 8), performed in accordance with the GLO
Beach Monitoring and Maintenance Plan • No. 1608 GIWW Rollover Bay Reach Beach Nourishment with Beneficial Use of Dredged Material (BUDM) Fiscal
Year 2015 Event (Cycle 8) • No. 1609 Galveston Seawall 61st to 103rd St. Beach Nourishment with BUDM (Cycle 8)
The project benefits analysis classifies and estimates economic and financial benefits associated with commercial and recreational fishing, tourism and ecotourism (wildlife viewing), beach recreation, out-of-state visitor spending, and non-Texas project funding while estimating impacts on improved water quality, carbon sequestration, and storm protection. The stream of economic benefits over time varied from project to project depending on a project’s durability. The period of analysis for the various projects varied from 1 to 25 years. The study’s purpose is to find empirical evidence for spending by visitors to Texas beaches from outside the state to predict those financial benefits to the state. This type of study investigates project contributions normally considered a cost when viewed from a national or world perspective as a financial benefit. Costs funded by non-Texas dollars represent a financial benefit because money flows into the Texas economy. The findings reported show this adjustment reflects the estimates of benefits and costs. The report served to estimate the cost effectiveness of the fifteen projects listed above via benefit to cost ratios and net benefits on an individual project basis, and as a group, or “portfolio.” By excluding spending by Texas residents, this study provides a conservative estimate of benefits for each individual project while highlighting the overall contribution that CEPRA construction projects bring to the state of Texas. Table 6 presents a summary of the assessed projects. The direct and positive net benefits (B/C ratios greater than one) from the fifteen evaluated projects combined indicate that these coastal erosion control projects yield high returns on investment for the state of Texas. Preserving Texas’ coastal assets prove a worthy public investment strategy for Texas taxpayers and citizens.

Coastal Erosion Planning & Response Act 27 2016-2017 Report
Project Number Project Name County Year1
Beginning of Project Year Beginning of 20163 Benefit-
to-Cost (B/C) Ratio4
Total Discounted
Cost2
Total Discounted
Benefits
Total Discounted
Cost3
Total Discounted
Benefits
1516 McFaddin NWR Beach Ridge Restoration Jefferson 2014 $415,859 $21,671,271 $442,557 $23,062,535 52.1
1520 Bird Island Cove Marsh Restoration Galveston 2014 $805,888 $2,180,413 $857,625 $2,320,392 2.7
1521 End of Seawall Beach Nourishment Galveston 2015 $1,475,049 $4,539,140 $1,521,661 $4,682,577 3.1
1527 Indian Point Shoreline
Protection & Marsh Restoration
San Patricio 2015 $899,001 $1,335,406 $927,409 $1,377,605 1.5
1569 Corpus Christi North
Beach BMMP Maintenance Re-
Nourishment Nueces 2016 $2,475,577 $10,408,114 $2,475,577 $10,408,114 4.2
1570 Village of Surfside Beach BMMP Re-
Nourishment Brazoria 2015 $2,244,323 $925,772 $2,315,244 $955,026 0.4
1573 Village of Surfside Beach Revetment Emergency Repair
1571 Quintana Bryan Beach Nourishment Brazoria 2016 $801,380 $1,585,708 $801,380 $1,585,708 2.0
1576 Arturo Galvan Coastal Park Living Shoreline
Restoration Cameron 2016 $623,658 $416,289 $643,366 $429,444 0.7
1577 Keith Lake Fish Pass
Baffle Shoreline Protection & Marsh
Restoration Jefferson 2015 $4,109,350 $41,459,640 $4,109,350 $41,459,640 10.1
1588 Oyster Lake Habitat Restoration Brazoria 2016 $487,947 $1,656,822 $487,947 $1,656,822 3.4
1591 Magnolia Inlet Shoreline
Protection & Marsh Restoration
Calhoun 2015 $113,361 $12,438,117 $116,943 $12,831,161 109.7
1603 Rockport Beach BMMP
Maintenance Re-Nourishment
Aransas 2016 $409,605 $1,835,436 $409,605 $1,835,436 4.5
1608 GIWW Rollover Bay
Reach Beach Nourishment with BUDM
FY 2015 Event Galveston 2015 $250,000 $47,612 $257,900 $49,117 0.2
1609 Galveston Seawall 61st
to 103rd St. Beach Nourishment with BUDM
Galveston 2016 $7,990,000 $29,020,938 $7,990,000 $29,020,938 3.6
Totals $23,356,564 $133,047,923 5.7 Table 6. CEPRA Cycles 6-8 Projects, Costs, and Benefits
Notes: 1Project Year represents the year benefits begin to accrue and may not represent the actual construction year. 2Texas portion only; dollar values reflect present worth equivalents at the beginning of the year of project construction. 2Dollar values reflect present worth equivalents at the beginning of 2016 with a 3.16% discount rate 3Total B/C Ratio represents the Total Discounted Benefits divided by the Total Discounted Cost of all fifteen projects combined (i.e., 113,047,923/23,356,563 = 5.7).
Benefits of CEPRA Program

Coastal Erosion Planning & Response Act 28 2016-2017 Report
Notably, the leveraging of federal participation played a substantial role for several projects. For example, the low Texas cost of the overwash protection berm at the McFaddin National Wildlife Refuge (NWR) reflects contributions from the U.S. Fish and Wildlife Service (USFWS) and Coastal Impact Assistance Program (CIAP), which covered 98.4% of the total project costs. As another example, the low Texas cost of the beach nourishment near Rollover Pass reflects the substantial cost savings from partnership with the U.S. Army Corps of Engineers (USACE) for the beneficial use of dredged material. This project placed beach fill at an effective unit cost of $1.67 per cubic yard (cy) of beach fill, far below typical industry costs. However, even with this low beach fill unit cost, the benefit-to-cost ratio is still low, mainly because of the project area’s relatively low property values and low visitation rates compared to more popular tourist destinations (e.g., Galveston Island and South Padre Island beaches). Furthermore, the benefit-to-cost ratio of this beach nourishment project does not include federal spending as a benefit, because federal spending would be the same with or without the project (because the federal dredging project would occur with or without the beach nourishment). Federal spending on CEPRA projects is also important from a Texas point of view because it reflects financial inflows to the state economy and lowers project costs to Texas. Several of the evaluated projects utilized these benefits. The McFaddin NWR Beach Ridge Restoration Project experienced federal spending benefits ($4,796,321 discounted present worth) from USFWS and CIAP funding as mentioned above. Similarly, Bird Island Cove Marsh Restoration experienced federal spending benefits ($1,399,405 discounted present worth) from funding by USFWS Texas Coastal Program and a USFWS National Coastal Wetlands Conservation Grant. Funding provided by the Federal Emergency Management Agency (FEMA) led to significant federal spending benefits for the End of Seawall Beach Nourishment ($4,255,032 discounted present worth) and Quintana-Bryan Beach Nourishment ($1,126,183 discounted present worth). As a final note, the annual discount rate of 3.16 percent represents an average of 20-year AAA corporate bond rates existing at the time of study initiation. The discount rate is used to convert values occurring at different points in time to comparable equivalent values (“discounted present worth”) at a common point in time, which in Table 6 is the beginning of 2016.
LEGISLATION FROM THE 84th LEGISLATURE AFFECTING THE CEPRA PROGRAM Sales Tax on Sporting Goods (MOU with Parks and Wildlife) On June 8th, 2015 Governor Abbot signed into law the passage of HB 158 which dedicates 94% of the Sporting Goods Sales Tax to be used only for state and local parks moving forward. Previously, 13% was allotted to the CEPRA Program from 2008 to 2014. CEPRA is seeking alternative funds that can be established as a permanent source for the success of the program.
ASSESSMENT OF NEEDS Each biennium, the CEPRA program receives new applications for funding for various types of projects along the Texas coast. However, due to limited funding many projects do not receive funding during the biennium. Table 7 includes projects that applied for but did not receive CEPRA funding during Cycle 9. These projects are then categorized by the CEPRA team as “alternates” and may receive funding if an approved project is canceled. The entire need that was unmet for the Cycle 9 biennium totaled $1,531,093.00.
Project Number
Project Name County Project Type Requested
CEPRA Award
1611 Key Allegro Revetment
Repair Aransas SP $264,000.00
1613 Adolph Thomae Park Shoreline Protection Cameron SP $660,000.00
1629
Upper TX Coast Comprehensive Baseline
Beach & Shoreface Mapping
Upper coast S $524,141.00
1630 Value of Galveston
Beaches Galveston S $82,952.00 Total Need $1,531,093.00
Table 7. Cycle 9 Projects Selected as Alternates
Alternate CEPRA Projects

Coastal Erosion Planning & Response Act 29 2016-2017 Report
WORKS CITED Paine, J. G., Caudle, T. L., and Andrews, J. L., 2014, Shoreline Movement Along the Texas Gulf Coast, 1930's to 2012, Final Report to the Texas General Land Office, Contract No., Bureau of Economic Geology, University of Texas at Austin, p. 59.
Roth, David M. Texas Hurricane History. World Wide Web: http://www.hpc.ncep.noaa.gov/research/txhur.pdf (accessed April 10, 2013). Hydrometeorological Prediction Center: Camp Springs, 2010.