coastal geoindicators: towards the establishment of a
TRANSCRIPT

Earth-Science Reviews 154 (2016) 183–190
Contents lists available at ScienceDirect
Earth-Science Reviews
j ourna l homepage: www.e lsev ie r .com/ locate /earsc i rev
Coastal geoindicators: Towards the establishment of a commonframework for sandy coastal environments
Mafalda Marques Carapuço a,⁎, Rui Taborda a, Tanya Mendes Silveira a, Norbert P. Psuty b,César Andrade a, Maria Conceição Freitas a
a Instituto Dom Luiz, Faculdade de Ciências da Universidade de Lisboa, Campo Grande, 1749-016 Lisbon, Portugalb Sandy Hook Cooperative Research Programs, New Jersey Agricultural Experiment Station, The State University of New Jersey, 74 Magruder Road, Highlands, NJ 07732, USA
⁎ Corresponding author.E-mail addresses: [email protected] (M.M. Carapu
(R. Taborda), [email protected] (T.M. Silveira), psuty@[email protected] (C. Andrade), [email protected] (M.C. Fre
http://dx.doi.org/10.1016/j.earscirev.2016.01.0020012-8252/© 2016 Elsevier B.V. All rights reserved.
a b s t r a c t
a r t i c l e i n f oArticle history:Received 25 May 2015Received in revised form 29 December 2015Accepted 6 January 2016Available online 14 January 2016
Geoindicators are used to describe reference situations andmeasure changes and trends in physical environmentover time. They provide a simplified form to communicate complex data and information, and constitute a facil-itator mechanism in the dialog among stakeholders. In this work, a review on the use of geoindicators in sandycoastal environments is performed. It was found that, despite the obvious advantages in reporting the state ofthe coast using geoindicators, their generalized adoption seems to be stalled and is limited to a fewmanagementsettings and particular projects. The existence of a myriad of coastal geoindicators, that frequently are poorly de-fined, is identified as themajor difficulty in their widespread use. The present work aims to contribute towardsthe establishment of a common framework for coastal geoindicators, focusing on sandy coastal environ-ments. The main objective of the compilation and definition of the indicators herein presented is to simplifyand clarify their designations, and objectively present the measurement and reporting criteria aiming at aconsensus-based approach. Sixteen coastal geoindicators are identified as relevant for the description ofthe state of beach, coastal dunes, and coastal barrier environments. This effort contributes to the adoptionof coastal geoindicators as an effective communication tool leading to a more standardized report on thestate of the coastal zone.
© 2016 Elsevier B.V. All rights reserved.
Keywords:Science communicationCoastal managementCoastal zoneBeachCoastal dunesCoastal barriers
Contents
1. Introduction . . . . . . . . . . . . . . . . . . . . . . . . . . . . . . . . . . . . . . . . . . . . . . . . . . . . . . . . . . . . . . 1832. Aim and scope . . . . . . . . . . . . . . . . . . . . . . . . . . . . . . . . . . . . . . . . . . . . . . . . . . . . . . . . . . . . . 1843. Definition and background . . . . . . . . . . . . . . . . . . . . . . . . . . . . . . . . . . . . . . . . . . . . . . . . . . . . . . . 1844. Identified gaps . . . . . . . . . . . . . . . . . . . . . . . . . . . . . . . . . . . . . . . . . . . . . . . . . . . . . . . . . . . . . 1855. Development of a common framework . . . . . . . . . . . . . . . . . . . . . . . . . . . . . . . . . . . . . . . . . . . . . . . . . 186
5.1. Indicator properties . . . . . . . . . . . . . . . . . . . . . . . . . . . . . . . . . . . . . . . . . . . . . . . . . . . . . . . 1865.2. The challenge . . . . . . . . . . . . . . . . . . . . . . . . . . . . . . . . . . . . . . . . . . . . . . . . . . . . . . . . . . 1865.3. The common framework . . . . . . . . . . . . . . . . . . . . . . . . . . . . . . . . . . . . . . . . . . . . . . . . . . . . . 187
6. Conclusions . . . . . . . . . . . . . . . . . . . . . . . . . . . . . . . . . . . . . . . . . . . . . . . . . . . . . . . . . . . . . . 188Acknowledgements . . . . . . . . . . . . . . . . . . . . . . . . . . . . . . . . . . . . . . . . . . . . . . . . . . . . . . . . . . . . . 189References . . . . . . . . . . . . . . . . . . . . . . . . . . . . . . . . . . . . . . . . . . . . . . . . . . . . . . . . . . . . . . . . . 189
ço), [email protected] (N.P. Psuty),itas).
1. Introduction
The coastal zone is a complex environment that encompasses sever-al geomorphological featureswith specific dynamics. Beaches, in partic-ular, are one of the most mutable environments where morphologicvariations can occur at a wide range of temporal and spatial scales.Often, human interference with such a complex and dynamic systemleads to negative impacts, and human manipulation is predicted to

184 M.M. Carapuço et al. / Earth-Science Reviews 154 (2016) 183–190
intensify over the next few decades (Brown et al., 2008). To cope withcoastal use-related conflicts, the integration of scientific knowledge isnowadays an ambition shared by researchers and managers (Carapuçoet al., 2014; van Koningsveld et al., 2005). To achieve this objective, sev-eral coastal monitoring programs aiming to deliver scientific data to themanagement process have been developed worldwide (e.g., Bradburyet al., 2002; Lynch et al., 2014; MESSINA, 2005; Psuty et al., 2012),with specific data acquisition and reporting methods, according totheir aims and scopes. Though valid for the specific environments andobjectives they were designed for, information derived from these pro-grams may not be suitable for use and comparison with other coastalareas. To improve data sharing and comparability, it is important to pro-mote procedures that enlarge the scope of applications of the acquireddata with minimal additional effort, and provide data and informationin a standardized form.
International organizations give guidelines on this matter and havestated that indicators constitute the most efficient way to assure theconsistency in methodologies and data collection, and to transmit in-herently complex information in a simplified and applicable form(e.g., NOAA, 2010; UNESCO, 2003, 2006). The use of indicators allowsthe establishment of reference situations and to define evolution trendsat local to global scales (EEA, 2012).
However, concerning the coastal zone, the development of coastalindicators is still in an emergent stage and lacks a widely accepted nor-malized framework to assist in choosing a set of coherent and consistentindicators.
2. Aim and scope
The aim of the present work is to perform a review on the use ofcoastal geoindicators to describe the physical state of the major geo-morphological features of the beach, coastal dune, and coastal barrierenvironments.
This study identifies the gaps that have hindered their widespreadadoption and makes a first contribution to the development of a com-mon framework on coastal geoindicators.
The environments herein considered are schematized in Fig. 1, andillustrated in Figs. 2 to 4. Their physical boundarieswere defined aimingto make them useful for different areas of expertise (e.g., coastal engi-neering, management, research), and are defined as follows:
܀ Beach is an accumulation of wave-reworked unconsolidatedsediment (usually sand and/or gravel) extending from the closuredepth to inland up to a physiographic change such as a dune field, seacliff, or structure or to the point where the permanent vegetation isestablished (Komar, 1983).
܀ Coastal dunes are hills or ridges of sanddeposited by thewind and/or wave action, or can be artificially deposited, and are often coveredwith beachgrass (NOAA, 1994).
܀ Coastal barriers are narrow low-lying strips of land consistingof beach and dunes extending parallel to the trend of the coast and
Fig. 1. Sandy coast environments andmorphological domains; underlined labels refer to coasta— shoreline based on the high water swash line; SMHW — shoreline based on the mean high w
separated from the mainland by a fresh, brackish, or salt water bodyor marsh (NOAA, 1994).
3. Definition and background
Historically, the term indicator has been used as a statement withthe ability to measure or describe variables; a parameter that indicatessome characteristic or metric. One of the commonly used definitionsof indicators is from UNESCO (2006, 11): “indicator is a quantitative/qualitative statement or measured/observed parameter that can beused to describe an existing situation and measure changes and trendsover time”. According to Cobb and Rixford (1998), indicators havebeen used “since the dawn of history, and the first reference of human'sself-conscious use of indicators dates back to the 1830s referring to thejudgment of social conditions using statistical indicators to improve publichealth and social conditions”. Cohn (1899) refers to the use of indicatorsassociated with the disciplines of chemistry and pharmacy. In the 20thcentury, indicators emerged in other areas: in the 1920s, economic indi-cators, such as the gross domestic product (GDP), the rate of inflation, orpublic sector borrowing and debt, were considered essential tools tomeasure the state of economies (Keating, 2001). More recently, in the1970s, indicators became a tool in the description of the state ofenvironment (SoE) and, in what concerns coastal indicators, the firstreference is even more recent with the definition of geoindicators byBerger (1996). A significant number of essays, reports, and projectsfocused on indicators in the scope of coastal zone management havesince been produced (e.g., Ciavola et al., 2011; Davidson et al., 2007;EPA, 2008; Marchand, 2010; Martí et al., 2007; NOAA, 2010; OECD,2003; SECRU, 2001; Sustain, 2012; UAB-GIM, 2002; UNEP, 2006;UNESCO, 2003, 2006; van Koningsveld et al., 2007).
Table 1 presents a chronological summary of the use of indicators todescribe the SoE focusing on the ones that describe the geomorpholog-ical state of the coastal environment.
Analysis of Table 1 leads to the conclusion that during its first years,SoE reporting focused on gathering and reporting as much knowledgeand information as possible. These early reports constituted valuablereference works; however, they were too complex and almost impene-trable to anyone searching for a quick synopsis of key issues and trends(Keating, 2001). The demand for critical environmental snapshotswas later overcome through the use of indicators and SoE reportingthat evolved from encyclopedic tomes to indicator-based reports,often grouped under specific issues (e.g., air and water quality).Concerning the state of the coast, geoindicators emerged in 1996 ashigh-resolution measures of short-term (b100 years) surface or near-surface changes in earth processes and phenomena that are significantfor environmental monitoring and assessment (Berger, 1996). Since2000, coastal indicators started to be developed and used as tools tosupport coastal management, aiming to promote the interaction be-tween coastal researchers andmanagers in application-oriented knowl-edge development. Projects EUROSION (UAB-GIM, 2002); CoastView
l geoindicators: CP— coastline position; SBCREST— shoreline based on the berm crest; SHWSL
ater line.

Fig. 2. Beach environment: São Pedro (Portugal, 38°41′37″N; 9°22′11″W).
185M.M. Carapuço et al. / Earth-Science Reviews 154 (2016) 183–190
(CoastView Team, 2002; Davidson et al., 2007; van Koningsveld et al.,2007; Jiménez et al., 2007), DEDUCE (Martí et al., 2007), CONSCIENCE(Marchand, 2010; Jiménez, 2010), MICORE (Ciavola, 2011; Ciavolaet al., 2011), SUSTAIN (Sustain, 2012) and PEGASO (Santoro et al.,2014) are examples of efforts to enhance the integration of the resultsof scientific research in the process of coastal decision-making throughthe use of coastal indicators. However, they are often project- or site-specific and their adoption is limited to a few management settings,with little or no transferability to other realities.
4. Identified gaps
The appraisal of coastal indicators-related literature reveals that amyriad of indicators have been used to report the state of the coastal
Fig. 3. Coastal dunes environment: Portstewart (N
environment. In this review, a large number of inconsistencies in thereporting process were found, including the use of different indicators'designations to report the same geomorphological feature, the use ofdifferent indicators' categories for the same purpose and paradoxes inwording. Moreover, even the meaning of the word “indicator” is notconsensual. These discrepancies make an all-inclusive analysis on thistopic an almost unfeasible task, especially when adopting a top-downapproach. For example, when making a review on coastal indicators, ifthe analysis were confined to the term of indicator, works that haveadopted other designations, such as “criteria” (e.g., CZMA, 1972),“index” (e.g., Bukata, 2005), “parameter” (e.g., Baptista et al., 2011),“proxy” (e.g., Farris and List, 2007), “standard” (e.g., CZMA, 1972), “var-iable” (e.g., Thieler and Hammar-Klose, 2000) and “vital sign” (e.g., NPS,2005; Stevens et al., 2005), are excluded. This exclusion includes, for
orthern Ireland, UK, 55°10′06″N; 6°45′13″W).

Fig. 4. Coastal barrier environment: Island Beach State Park (New Jersey, USA, 39°49′50″N; 74°5′18″W).
186 M.M. Carapuço et al. / Earth-Science Reviews 154 (2016) 183–190
example, works related to well-established and extremely valuablecoastal monitoring programs that rely upon an indicator-based ap-proach (e.g., NPS, 2005).
Concerning the categories of indicators, five designationswere iden-tified in literature: geoindicators (Berger, 1996, 1997; Bush and Young,2009; Carapuço et al., 2013), coastal state indicators (van Koningsveld,2003; Sutherland, 2010; van Rijn, 2010; Marchand, 2010), sciencecoastal state indicators (van Koningsveld, 2003; van Koningsveld et al.,2005; Giardino et al., 2014), issue-based coastal state indicators (vanKoningsveld, 2003; vanKoningsveld et al., 2005), and geomorphologicalindicators (Bernatchez et al., 2011).
Additionally, different indicators were found to refer to the sametarget-features. For example, the width of the beach is referenced tousing three different designations: beach width (Bush et al., 1999; vanKoningsveld, 2003; van Koningsveld et al., 2005; Bush and Young,2009; van Rijn, 2010; Marchand, 2010; Sutherland, 2010;), backshorewidth (Marchand, 2010; Sutherland, 2010), and berm width (van Rijn,2010).
Furthermore, whereas some indicators are supported by very de-tailedmeasurement criteria, others have criteria that are poorly defined.Without this information clearly stated, the usefulness of indicators isprejudiced and very limited.
This lack of specificity and consistency reflects the need for a nor-malized schema and calls for a standard approach in the state of thecoastal environment reporting through the use of indicators targetinguniversality, simplicity, and unambiguity.
5. Development of a common framework
This work constitutes a first step towards the development of acommon framework for the establishment of coastal geoindicatorsaiming a consensus based-approach. This effort is grounded in existingworks, and relies upon a compromise that aims to standardizeindicator concepts and designations. ”Geoindicator” is proposed asthemost suitable term to describe the category of coastal indicators be-cause it is the oldest and still in use term, proposed by the IUGS (Berger,1996).
5.1. Indicator properties
Indicators should share a set of fundamental characteristics in orderto provide a simplified form to communicate complex data and infor-mation among stakeholders.
In order to assure relevance of the indicators, they must embed thefollowing proprieties:
- Be specific: indicators should yield a clear representation of the sys-tem characteristic they are intended to reflect.
- Be measurable: indicators should be quantifiable.- Be achievable: indicators should rely upon implementation and col-lection methods that are feasible with available resources and intel-lectual capital.
- Be relevant: there must be a direct link between the indicator andthe key issue or target-question to be answered.
- Be time-bound: indicators should be responsive to changes in timeand provide timely information.
These characteristics are the basis for the designated SMART indica-tors (Specific, Measurable, Achievable, Relevant, Time-bound) that playan important role in result-based management strategies (MDF, 2005).Several organizations and authors acknowledge these properties as themost relevant in indicators' selection in order to assure that they arecomparable (e.g., CoastView Team, 2002; NOAA, 2010; OECD, 2003;Sutherland, 2010; UNESCO, 2006; van Rijn, 2010).
5.2. The challenge
The process of simplification in reporting the state of the coastalenvironment using indicators poses a real challenge because of thelocal and often site-specific nature of the coastal features. The adoptionof measurement criteria applicable worldwide and to different geomor-phological settings can, thus, be controversial (e.g., NRC, 1990). Howev-er, this constraint did not impede the establishment and generalizedadoption of terminology related with low-lying sandy coastal environ-ments that does not depend on the geographic location (e.g., USACE,2002; Bird, 2000; Komar, 1983). The wide acceptance of a universal
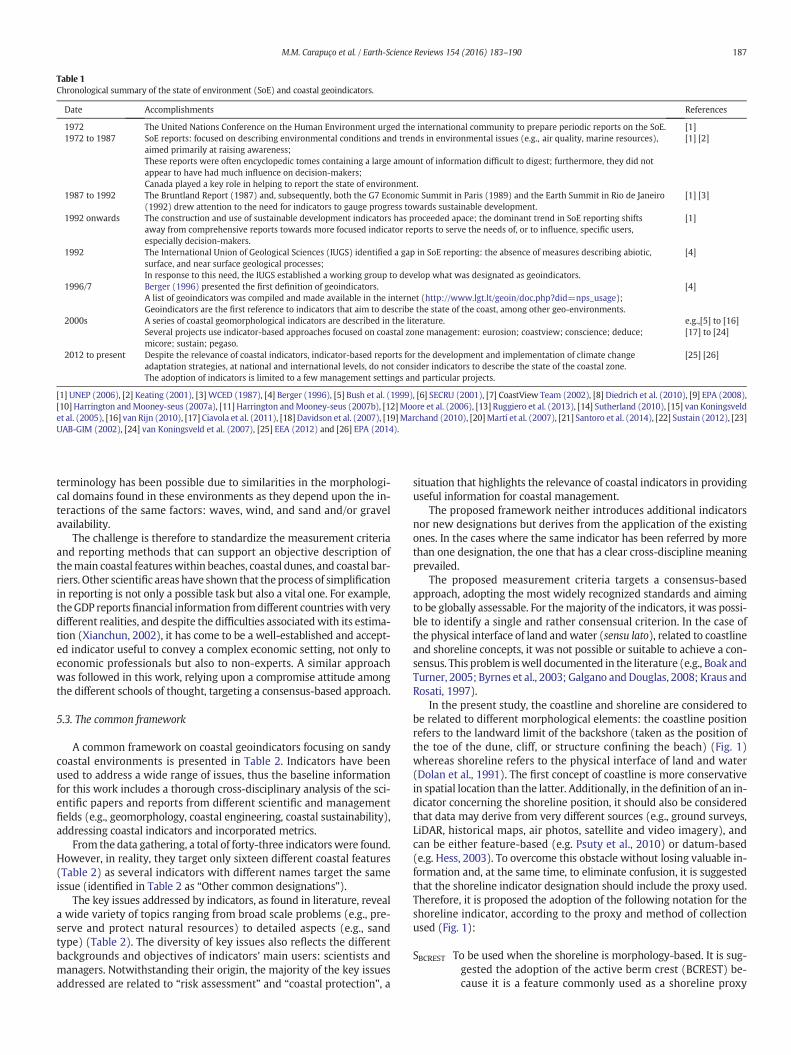
Table 1Chronological summary of the state of environment (SoE) and coastal geoindicators.
Date Accomplishments References
1972 The United Nations Conference on the Human Environment urged the international community to prepare periodic reports on the SoE. [1]1972 to 1987 SoE reports: focused on describing environmental conditions and trends in environmental issues (e.g., air quality, marine resources),
aimed primarily at raising awareness;These reports were often encyclopedic tomes containing a large amount of information difficult to digest; furthermore, they did notappear to have had much influence on decision-makers;Canada played a key role in helping to report the state of environment.
[1] [2]
1987 to 1992 The Bruntland Report (1987) and, subsequently, both the G7 Economic Summit in Paris (1989) and the Earth Summit in Rio de Janeiro(1992) drew attention to the need for indicators to gauge progress towards sustainable development.
[1] [3]
1992 onwards The construction and use of sustainable development indicators has proceeded apace; the dominant trend in SoE reporting shiftsaway from comprehensive reports towards more focused indicator reports to serve the needs of, or to influence, specific users,especially decision-makers.
[1]
1992 The International Union of Geological Sciences (IUGS) identified a gap in SoE reporting: the absence of measures describing abiotic,surface, and near surface geological processes;In response to this need, the IUGS established a working group to develop what was designated as geoindicators.
[4]
1996/7 Berger (1996) presented the first definition of geoindicators.A list of geoindicators was compiled and made available in the internet (http://www.lgt.lt/geoin/doc.php?did=nps_usage);Geoindicators are the first reference to indicators that aim to describe the state of the coast, among other geo-environments.
[4]
2000s A series of coastal geomorphological indicators are described in the literature.Several projects use indicator-based approaches focused on coastal zone management: eurosion; coastview; conscience; deduce;micore; sustain; pegaso.
e.g.,[5] to [16][17] to [24]
2012 to present Despite the relevance of coastal indicators, indicator-based reports for the development and implementation of climate changeadaptation strategies, at national and international levels, do not consider indicators to describe the state of the coastal zone.The adoption of indicators is limited to a few management settings and particular projects.
[25] [26]
[1] UNEP (2006), [2] Keating (2001), [3] WCED (1987), [4] Berger (1996), [5] Bush et al. (1999), [6] SECRU (2001), [7] CoastView Team (2002), [8] Diedrich et al. (2010), [9] EPA (2008),[10] Harrington andMooney-seus (2007a), [11] Harrington andMooney-seus (2007b), [12]Moore et al. (2006), [13] Ruggiero et al. (2013), [14] Sutherland (2010), [15] van Koningsveldet al. (2005), [16] van Rijn (2010), [17] Ciavola et al. (2011), [18] Davidson et al. (2007), [19]Marchand (2010), [20]Martí et al. (2007), [21] Santoro et al. (2014), [22] Sustain (2012), [23]UAB-GIM (2002), [24] van Koningsveld et al. (2007), [25] EEA (2012) and [26] EPA (2014).
187M.M. Carapuço et al. / Earth-Science Reviews 154 (2016) 183–190
terminology has been possible due to similarities in the morphologi-cal domains found in these environments as they depend upon the in-teractions of the same factors: waves, wind, and sand and/or gravelavailability.
The challenge is therefore to standardize the measurement criteriaand reporting methods that can support an objective description ofthemain coastal featureswithin beaches, coastal dunes, and coastal bar-riers. Other scientific areas have shown that theprocess of simplificationin reporting is not only a possible task but also a vital one. For example,theGDP reportsfinancial information fromdifferent countrieswith verydifferent realities, and despite the difficulties associatedwith its estima-tion (Xianchun, 2002), it has come to be a well-established and accept-ed indicator useful to convey a complex economic setting, not only toeconomic professionals but also to non-experts. A similar approachwas followed in this work, relying upon a compromise attitude amongthe different schools of thought, targeting a consensus-based approach.
5.3. The common framework
A common framework on coastal geoindicators focusing on sandycoastal environments is presented in Table 2. Indicators have beenused to address a wide range of issues, thus the baseline informationfor this work includes a thorough cross-disciplinary analysis of the sci-entific papers and reports from different scientific and managementfields (e.g., geomorphology, coastal engineering, coastal sustainability),addressing coastal indicators and incorporated metrics.
From the data gathering, a total of forty-three indicators were found.However, in reality, they target only sixteen different coastal features(Table 2) as several indicators with different names target the sameissue (identified in Table 2 as “Other common designations”).
The key issues addressed by indicators, as found in literature, reveala wide variety of topics ranging from broad scale problems (e.g., pre-serve and protect natural resources) to detailed aspects (e.g., sandtype) (Table 2). The diversity of key issues also reflects the differentbackgrounds and objectives of indicators' main users: scientists andmanagers. Notwithstanding their origin, the majority of the key issuesaddressed are related to “risk assessment” and “coastal protection”, a
situation that highlights the relevance of coastal indicators in providinguseful information for coastal management.
The proposed framework neither introduces additional indicatorsnor new designations but derives from the application of the existingones. In the cases where the same indicator has been referred by morethan one designation, the one that has a clear cross-discipline meaningprevailed.
The proposed measurement criteria targets a consensus-basedapproach, adopting the most widely recognized standards and aimingto be globally assessable. For themajority of the indicators, it was possi-ble to identify a single and rather consensual criterion. In the case ofthe physical interface of land andwater (sensu lato), related to coastlineand shoreline concepts, it was not possible or suitable to achieve a con-sensus. This problem iswell documented in the literature (e.g., Boak andTurner, 2005; Byrnes et al., 2003; Galgano andDouglas, 2008; Kraus andRosati, 1997).
In the present study, the coastline and shoreline are considered tobe related to different morphological elements: the coastline positionrefers to the landward limit of the backshore (taken as the position ofthe toe of the dune, cliff, or structure confining the beach) (Fig. 1)whereas shoreline refers to the physical interface of land and water(Dolan et al., 1991). The first concept of coastline is more conservativein spatial location than the latter. Additionally, in the definition of an in-dicator concerning the shoreline position, it should also be consideredthat data may derive from very different sources (e.g., ground surveys,LiDAR, historical maps, air photos, satellite and video imagery), andcan be either feature-based (e.g. Psuty et al., 2010) or datum-based(e.g. Hess, 2003). To overcome this obstacle without losing valuable in-formation and, at the same time, to eliminate confusion, it is suggestedthat the shoreline indicator designation should include the proxy used.Therefore, it is proposed the adoption of the following notation for theshoreline indicator, according to the proxy and method of collectionused (Fig. 1):
SBCREST To be used when the shoreline is morphology-based. It is sug-gested the adoption of the active berm crest (BCREST) be-cause it is a feature commonly used as a shoreline proxy

Table 2Common framework on coastal geoindicators for sandy coast environments (units: quantitative scale— length (L) and time (T); qualitative scale (Q)). Other common designations and keyissues as found in the literature.
Geoindicator Other common designations(as found in the literature)
Proposed measurement criteria Units Key issue (as found in the literature)
For sandy environments in general1. Shoreline position – SBCREST is defined as the most seaward-berm crest
SHWSL is defined as the high water swash lineSMHW is defined as the mean high water level
L Coastal erosion, sediment transport anddeposition, land use, sea level, climaterelated-issues [10]
Preserve and protect natural resources [11]
Beach evolution trend [12]
Beach erosion [13]
Coastal morphodynamic state [14]
2. Shoreline evolution Accretion [1]Coastal erosion[1]
Erosion rate [2]
Shoreline change [3]
Shoreline stability [3]
Shoreline position change over time L/T Risk assessment and management [2] [9] [12] [15]
Coastal protection [16]
Coastal flooding and erosion hazards [17]
To make available and promote sustainableenvironmental practices [18]
3. Coastline position Dune erosion point [4]
Dune foot location [4]
Dune foot position [4]
Dune location [5]
Length of dynamic coastline [1]
Momentary coastline [1] [6] [4]
Position of the dune foot [7]
Coastline is defined as the landward limit ofthe backshore (taken as the position of the toeof the dune, cliff or structure)
L Standard of protection [1] [6]
Perception of safety [1] [6]
Sustainable maintenance of safety [19]
Sustainable maintenance of dunes [19]
4. Coastline evolution Accretion [1]
Changes in coastal erosion [8]
Coastal erosion [1]
Erosion rate [2]
Presence of coastal erosion [8]
Coastline position change over time L/T Risk assessment and management [2] [14] [20]
Coastal protection [21]
5. Sediment size – Median grain size L Sand type [12]
6. Sediment composition – Dominant composition Q Sand type [12]
For beaches7. Beach elevation Beach height [5]
Berm level [4]Elevation [2]
Average elevation measured between thecoastline and shoreline positions
L Risk assessment and management [2] [14]
8. Beach volume Total beach volume [4]
Total profile volume [4]
Volume (per unit of length), measured abovemean sea level (MSL), and limited by thecoastline position
L3/L Beach resilience [12]
9. Beach width Backshore width [1] [6]
Berm width [1] [6]
Distance between the coastline andshoreline positions
L Standard of protection [1] [6]
Beach carrying capacity [12]
10. Beach slope Beachface slope [9]
Coastal slope [1] [6]
Slope between the shoreline position andMSL contour
– Flood and coastal erosion risk [1] [6]
Bathing hazard [11]
For coastal dunes11. Dune elevation Dune crest height [4]
Dune zone height [1] [6]
Maximum elevation of the foredune dune,relative to MSL
L Standard of protection [1] [6]
12. Dune volume Dune strength [1] [6] Volume (per unit of length) above theforedune toe elevation across dune width
L3/L
13. Dune width Dune zone width [1] [6] Distance between the seaward and landwardlimits as defined in a case by case basis.
L
For coastal barriers14. Barrier elevation – Maximum elevation, relative to MSL L Standard of protection for storm [1] [6]
15. Barrier volume Total barrier volume [1] [6] Volume above MSL L3/L16. Barrier width – Distance between the backbarrier and ocean
shorelinesL
[1] Sutherland (2010); [2] Bush et al. (1999); [3] NPS (2005); [4] van Rijn (2010); [5] van Koningsveld et al. (2005); [6] Marchand (2010); [7] van Koningsveld (2003); [8] UAB-GIM(2002); [9] Reis and Gama (2010), [10] Berger (1996), [11] Stevens et al. (2005), [12] Carapuço et al. (2013), [13] Ruggiero et al. (2013), [14] Carapuço (2015), [15] Bush and Young(2009), [16] Martí et al. (2007), [17] Bernatchez et al. (2011), [18] Sustain, (2012), [19] Giardino et al. (2014), [20] Santoro et al. (2014) and [21] NCR (1990).
188 M.M. Carapuço et al. / Earth-Science Reviews 154 (2016) 183–190
(Kraus and Rosati, 1997) that can be extracted from topo-graphical data.
SHWL To be used when the shoreline is imagery-based. It is sug-gested the adoption of the highwater swash line (HWSL), be-cause high water line is the most commonly-used shorelineindicator (Boak and Turner, 2005).
SMHW To be used when the shoreline is elevation-based. It issuggested the adoption of the mean high water (MWH)level because it matches a standard tidal datum (Hess, 2003).
The measurements expressed in Table 2 are relative to cross-shoreprofiles, and the units can be expressed in quantitative scale (length(L) and time (T)) and qualitative scale (Q).
6. Conclusions
The review on the application of indicators in the description of thestate of the coastal zone revealed several inconsistencies related withthe indicators' designations, categories, and measurement criteria. Theexistence of amyriad of indicators, frequently poorly defined, was iden-tified as a major cause that has hindered their generalized adoption.These shortcomings call for a standardized approach in coastal indica-tors' measurement and reporting, targeting simplicity and unambiguity.To address this issue, a common framework for the establishment ofcoastal geoindicators, for sandy coast environments, is presented. Six-teen indicators are identified as most relevant for beach, coastal dune,and coastal barrier environments. The use of the proposed framework

189M.M. Carapuço et al. / Earth-Science Reviews 154 (2016) 183–190
will support the objective characterization and comparison of present-state and evolutionary trends of sandy coastal environments. This effortaims to contribute to the widespread adoption of coastal indicators asan effective management and communication tool. Ultimately, it willcontribute to support decision-making using scientific information asthe rationale for a sustainable costal management.
Acknowledgements
Mafalda M. Carapuço and Tanya M. Silveira are supported by PhDgrants SFRH/BD/82223/2011 and SFRH/BD/72555/2010 funded bythePortuguese Fundação para a Ciência e Tecnologia— FCT and InstitutoDom Luiz — IDL (UID/GEO/50019/2013). This work is a contributionof the projects Beach to Canyon (PTDC/MAR/114674/2009) andSHORE (PTDC/MAR-EST/3485/2012) funded by FCT and “Criação eimplementação de um sistema de monitorização no Litoral abrangidopela área de jurisdição da Administração da Região Hidrográfica do Tejo”,National Environmental Agency (Agência Portuguesa do Ambiente, I.P./Administração da Região Hidrográfica do Tejo) funded by the QREN/POVT (Operação POVT-12-0233-FCOES-000034).
References
Baptista, P., Cunha, T., Bernardes, C., Gama, C., Ferreira, Ó., Dias, A., 2011. A precise and ef-ficient methodology to analyse the shoreline displacement rate. J. Coast. Res. 27 (2),223–232. http://dx.doi.org/10.2112/09-1187.1.
Berger, A.R., 1996. The geoindicator concept and its application: an introduction. In:Berger, A.R., Lams, W.J. (Eds.), Geoindicators: Assessing Rapid Environmental Chang-es in Earth Systems. A. A. Balkema, Rotterdam, pp. 1–14.
Berger, A.R., 1997. Assessing rapid environmental change using geoindicators. Environ.Geol. 32, 36–44. http://dx.doi.org/10.1007/s002540050191.
Bernatchez, P., Fraser, C., Lefaivre, D., Dugas, S., 2011. Integrating anthropogenic factors,geomorphological indicators and local knowledge in the analysis of coastal floodingand erosion hazards. Ocean Coast. Manag. 54, 621–632. http://dx.doi.org/10.1016/j.ocecoaman.2011.06.001.
Bird, E., 2000. Coastal Geomorphology: An Introduction. John Wiley & Sons, LTD,New York.
Boak, E.H., Turner, I.L., 2005. Shoreline definition and detection: a review. J. Coast. Res. 21(4), 688–703. http://dx.doi.org/10.2112/03-0071.1.
Bradbury, A.P., McFarland, S., Horne, J., Eastick, C., 2002. Development of a Strategic Coast-al Monitoring Programme for Southeast England. International Coastal EngineeringConference. ASCE, Cardiff (http://www.newforest.gov.uk/CHttpHandler.ashx?id=26468&p=0).
Brown, A.C., Nordstorm, K., McLachlan, A., Jackson, N.L., Sherman, D.J., 2008. Sandy Shoresof the Near Future. In: Polunin, N.V.C. (Ed.), Aquatic Ecosystems; Trends and GlobalProspects. Cambridge University Press, New York, pp. 263–280.
Bukata, R.P., 2005. Satellite Monitoring of Inland and Coastal Water Quality: Retrospec-tion, Introspection, Future Directions. Taylor & Francis/CRC Press, UK.
Bush, D.M., Young, R., 2009. Coastal Features and Processes. In: Young, R., Norby, L. (Eds.),Geological Monitoring. Geological Society of America, Colorado, pp. 47–67.
Bush, D.M., Neal,W., Young, R., Pilkey, O., 1999.Utilization of geoindicators for rapid assess-ment of coastal-hazard risk and mitigation. Ocean Coast. Manag. 42 (8), 647–670.http://dx.doi.org/10.1016/S0964-5691(99)00027-7.
Byrnes, M., Crowell, M., Fowler, C., 2003. Shoreline mapping and change analysis: techni-cal considerations and management implications. J. Coast. Res. SI 38 (216 pp.).
Carapuço,M.M., 2015. Coastal indicators. In: Kennish, M.J. (Ed.), Encyclopedia of Estuaries.Springer, New Jersey, p. 139.
Carapuço, M., Silveira, T.M., Taborda, R., Andrade, C., Freitas, M.C., Pinto, C., 2013. Develop-ment of a beach monitoring program: linking science and management — a casestudy from Portugal. Geo-Temas 14, 43–46.
Carapuço,M.M., Taborda, R., Andrade, C., Freitas, M.C., 2014. Improving coastal knowledgetransfer between researchers and managers: a two-way route. In: Cessa, M. (Ed.),Beaches: Erosion, Management Practices and Environmental Implications. Nova Sci-ence Publishers, New York, pp. 53–72.
Ciavola, P., 2011. Morphological impacts and coastal risks induced by extreme stormevents (MICORE) project. www.micore.eu.
Ciavola, P., Ferreira, Ó., Haerens, P., van Koningsveld, M., Armaroli, C., 2011. Storm impactsalong European coastlines. Part 2: lessons learned from the MICORE project. Environ.Sci. Pol. 14, 924–933.
Cobb, C.W., Rixford, C., 1998. Lessons Learned from the History of Social Indicators.Redefining progress, San Francisco.
Cohn, A., 1899. Indicators and Test-Papers; Their Source, Preparation, Application, andTest for Sensitiveness, Designed for the Use of Chemists, Pharmacists, and Students.J. Wiley & Sons, New York.
CZMA (Coastal Zone Management Act), 1972. National Coastal Zone Management Pro-gram. http://coast.noaa.gov/czm/media/CZMA_10_11_06.pdf.
Davidson, M.A., van Koningsveld, M., de Kruif, A., Rawson, J., Holman, R.A., Lamberti, A.,Medina, R., Kroon, A., Aarnikhof, S., 2007. The CoastView Project: developing video-
derived coastal state indicators in support of coastal zone management. Coast. Eng.54, 463–475. http://dx.doi.org/10.1016/j.coastaleng.2007.01.007.
Diedrich, A., Tintoré, J., Navinés, F., 2010. Balancing science and society through establish-ing indicators for integrated coastal zone management in the Balearic Islands. Mar.Policy 34 (4), 772–781. http://dx.doi.org/10.1016/j.marpol.2010.01.017.
Dolan, R., Fenster, M.S., Holme, S.J., 1991. Temporal analysis of shoreline recession and ac-cretion. J. Coast. Res. 7 (3), 723–744. http://dx.doi.org/10.4236/ojms.2015.51002.
EEA (European Environment Agency), 2012. Climate Change, Impacts and Vulnerabilityin Europe 2012: An Indicator-Based Report. EEA, Copenhagen.
EPA (United States Environmental Protection Agency), 2008. Indicator Development forEstuaries. EPA, Washington, DC.
EPA (United States Environmental Protection Agency), 2014. Climate Change Indicatorsin the United States. third ed. EPA, Washington, DC.
Farris, A.S., List, J.H., 2007. Shoreline change as a proxy for subaerial beach volume change.J. Coastal Res. 23 (3), 740–748. http://dx.doi.org/10.2112/05-0442.1.
Galgano, F.A., Douglas, B.C., 2008. Shoreline position prediction: methods and errors. En-viron. Geosci. 7 (1), 23–31. http://dx.doi.org/10.1046/j.1526-0984.2000.71006.x.
Giardino, A., Santinelli, G., Vuik, V., 2014. Coastal state indicators to assess themorpholog-ical development of the Holland coast due to natural and anthropogenic pressure fac-tors. Ocean Coast. Manag. 87, 93–101.
Harrington, J., Mooney-seus, M., 2007a. National Core Coastal Indicators Workshop. Re-port appendices. Coastal States Organization, National Oceanic and Atmospheric Ad-ministration, U.S., Environmental Protection Agency.
Harrington, J., Mooney-seus, M., 2007b. National Core Coastal Indicators. Workshop re-port. Coastal States Organization, National Oceanic and Atmospheric Administration,U.S., Environmental Protection Agency.
Hess, K., 2003. Tidal datums and tide coordination. J. Coast. Res. SI 38, 33–43 (ISSN 0749-0208).
Jiménez, J., 2010. Coastal state indicators at the CONSCIENCE case study sites in conceptsand science for coastal erosion management Project. In: Davidson, M. (Ed.), TheCoastView Project, Deliverables D1 & D2 (http://conscience-eu.net/documents/index.htm).
Jiménez, J., Osorio, A., Marino-Tapia, I., Davidson, M., Medina, R., Archetti, R., Ciavola, P.,Aarnikhof, S., 2007. Beach recreation planning using video-derived coastal state indi-cators. Coast. Eng. 54 (6–7), 507–521. http://dx.doi.org/10.3354/cr01068.
Keating, M., 2001. Review and Analysis of Best Practices in Public Reporting on Environ-mental Performance (40 pp.) A report to Executive Resource Group. Researchpaper #9 (Toronto. http://citeseerx.ist.psu.edu/viewdoc/download?doi=10.1.1.194.7105&rep=rep1&type=pdf).
Komar, P.D., 1983. Handbook of Coastal Processes and Erosion. CRC Press, Michigan.Kraus, N.C., Rosati, J.D., 1997. Interpretation of shoreline-position data for coastal engi-
neering analysis. Coastal Engineering Technical Note ADA591274. US Corps Army ofEngineers (http://acwc.sdp.sirsi.net/client/search/asset/1000192).
Lynch, T.P., Morello, E.B., Evans, K., Richardson, A.J., Rochester, W., Steinberg, C., Roughan,M., Thompson, P., Middleton, J., Feng, M., Sherrington, R., Brando, V., Tilbrook, B.,Ridgway, K., Allen, S., Doherty, P., Hill, K., Moltmann, T., 2014. IMOS National Refer-ence Stations: a continental-wide physical, chemical and biological coastal observingsystem. PLoS One 9 (12), e113652. http://dx.doi.org/10.1371/journal.pone.0113652.
Marchand, M., 2010. Concepts and Science for Coastal Erosion Management. Concise Re-port for Policy Makers. Deltares, Delft (32 pp. http://conscience-eu.net/documents/index.htm).
Martí, X., Lescrauwaet, A., Borg, M., Valls, M., 2007. Indicators Guideline: To Adopt AndIndicator-Based Approach To Evaluate Coastal Sustainable Development. DEDUCEconsortium. Government of Catalonia, Barcelona.
MDF, 2005. MDF Tool: Indicators. United Nations Development Group. (10 pp. http://www.toolkitsportdevelopment.org/html/resources/40/408CC56F-509A-40D8-BE46-D7EEB4261F97/10%20Indicators.pdf).
MESSINA (Managing European Shorelines and Sharing Information on nearshore Areas),2005i. A case study documenting the Dubai Coastal Zone Monitoring Programme —an international example. http://www.interreg-messina.org/documents/Component%202/MESSINA%20-%20Component%202%20-%20Case-Study%20-%20Dubai.pdf.
Moore, L.J., Ruggiero, P., List, J.H., 2006. Comparing mean high water and high water lineshorelines: should proxy-datum offsets be incorporated into shoreline change analy-sis? J. Coast. Res. 22 (4), 894–905. http://dx.doi.org/10.2112/04-0401.1.
NOAA (National Oceanic and Atmospheric Administration), 1994. Guidelines for BarrierBeach Management in Massachusetts. A Report of the Massachusetts Barrier BeachTask Force. NOAA, Charleston, SC.
NOAA (National Oceanic and Atmospheric Administration), 2010. Coastal Zone Manage-ment Act - Performance Measurement System: Contextual Indicators Manual. NOAA,Charleston, SC.
NPS (National Park Service), 2005. Mediterranean Coast Network — Vital Signs Monitor-ing Plan. Natural Resources Technical Report NPS/MEDN/NRTR. National Park Service,California.
NRC (National Research Council), 1990. Managing Coastal Erosion. National AcademyPress, Washington, DC.
OECD (Organization for Economic Cooperation and Development), 2003t. OECD Environ-mental Indicators - Development, Measurement and use. OCED, Paris.
Psuty, N.P., Duffy, M., Pace, J.F., Skidds, D.E., Silveira, T.M., 2010. Northeast Coastal andBarrier Network Geomorphological Monitoring Protocol: Part I—Ocean ShorelinePosition. Natural Resource Report NPS/NCBN/NRR —2010/185. Colorado, NationalPark Service.
Psuty, N.P., Silveira, T.M., Spahn, A.J., Skidds, D., 2012. Northeast Coastal and BarrierNetwork geomorphological monitoring protocol: Part II — Coastal topography. Natu-ral Resource Report NPS/NCBN/NRR—2012/591. Colorado, National Park Service.
Reis, A.H., Gama, C., 2010. Sand size versus beachface slope— an explanation based on theconstructal law. Geomorphology 114, 276–283.

190 M.M. Carapuço et al. / Earth-Science Reviews 154 (2016) 183–190
Ruggiero, P., Kratzmann, M.G., Himmelstoss, E.A., David, R., Johathan, A., Kaminsky, G.,2013. National Assessment of Shoreline Change — Historical Shoreline ChangeAlong the Pacific Northwest Coast. U.S. Geological Survey Open-File Report2012–1007 http://dx.doi.org/10.3133/ofr20121007.
Santoro, F., Lescrauwaet, A.K., Taylor, J., Breton, F. (Eds.), 2014. Integrated Regional Assess-ments in Support of ICZM in the Mediterranean and Black Sea Basins (PEGASOProject). IOC Technical Series 111. Intergovernmental Oceanographic Commissionof UNESCO, Paris.
SECRU (Scottish Executive Central Research Unit), 2001. Indicators to Monitor the Prog-ress of Integrated Coastal Zone Management: A Review If Worldwide Practice.SECRU, Edinburgh.
Stevens, S., Milstead, B., Albert, M., Entsminger, G., September 2005. Northeast Coastal andBarrier Network Vital Signs Monitoring Plan. Technical Report NPS/NER/NRTR–2005/025. Boston, National Park Service.
Sustain, 2012. The SUSTAIN Indicator Set. A Set of Easily Measurable Sustainability Indica-tors. Costal & Marine Union (UECC), Leiden (http://www.sustain-eu.net/what_are_we_doing/sustain_indicator_set.pdf).
Sutherland, J., 2010. Guidelines on beach monitoring for coastal erosion in concepts andscience for Coastal Erosion Management (Conscience) Project. Deliverable D15(http://conscience-eu.net/documents/index.htm).
Team, C.V., 2002. Initial Report on Video-derived Coastal State Indicators. In: Davidson, M.(Ed.), The CoastView Project, Deliverables D1 & D2 (http://conscience-eu.net/documents/index.htm).
Thieler, E.R., Hammar-Klose, E.S., 2000. National Assessment of Coastal Vulnerability toFuture Sea-Level Rise: Preliminary Results for the U.S. Gulf of Mexico Coast. U.S. Geo-logical Survey, Massachusetts.
UAB-GIM (Universitat Autonoma de Barcelona - Geographic Information ManagementNV), 2002f. Coastal Erosion Indicators Study. Coastal Erosion – Evaluation of theNeeds for Action. EUROSION project. UAB-GIM, Barcelona.
UNEP (United Nations Environment Programme), 2006. Environmental Indicators forNorth America. UNEP, Nairobi.
UNESCO (United Nations Educational, Scientific and Cultural Organization), 2003l. A Ref-erence Guide on the Use of Indicators for Integrated Coastal Management. IOCManuals and Guides, 45; ICAM Dossier 1. UNESCO, Paris.
UNESCO (United Nations Educational, Scientific and Cultural Organization), 2006l. AHandbook for Measuring the Progress and Outcomes of Integrated Coastal andOcean Management. IOC Manuals and Guides, 46; ICAM Dossier 2. UNESCO, Paris.
USACE (U.S. Army Corps of Engineers), 2002. Coastal Engineering Manual. EngineerManual 1110–2-1100. U.S. Army Corps of Engineers, Washington, D.C.
van Koningsveld, M., 2003. Matching Specialist Knowledge with End User Needs (PhDThesis) University of Twente, Enschede.
van Koningsveld, M., Davidson, M., Huntley, D., 2005. Matching science with coastal man-agement needs: the search for appropriate coastal state indicators. J. Coast. Res. 213,399–411. http://dx.doi.org/10.2112/03- 0076.1.
van Koningsveld, M., Davidson, M., Huntley, D., Medina, R., Aarninkhof, S., Jiménez, J.,Ridgewell, J., Kruif, A., 2007. Critical review of the CoastView project: recent and fu-ture developments in coastal management video systems. Coast. Eng. 54, 567–576.http://dx.doi.org/10.1016/j.coastaleng.2007.01.006.
van Rijn, L., 2010. Description of coastal state indicators in concepts and Science for Coast-al Erosion Management (Conscience) Project. Description of coastal state indicators,Deliverable D9 (http://conscience-eu.net/documents/index.htm).
WCED (World Commission on Environment and Development), 1987. Our Common Fu-ture: Bruntland Report. WCED (http://www.un-documents.net/our-common-future.pdf).
Xianchun, X., 2002. Study on some problems in estimating China's gross domestic prod-uct. Rev. Income Wealth 48 (2), 205–215. http://dx.doi.org/10.1016/j.chieco.2003.09.021.