coastal regions - european commission
TRANSCRIPT

Coastal regions

13 Coastal regions
170 Eurostat regional yearbook 2011 eurostat
IntroductionThe following chapter depicts the population of European Union coastal regions. It will emphasise the characteristics of these regions, taking into account the country to which they belong and the maritime basin they border. It will also take a special look at the female population of these unique EU regions.
Main statistical findingsEU coastal regions bordering the maritime basins
EU coastal regions (1) belong to the 22 Member States that have a coastline. They are statistical regions defined at NUTS 3 level with a coastline or with more than half of their population living less than 50 km from the sea. These regions are distributed along oceans and seas bordering the EU coastline. As Map 13.1 shows, EU coastal regions border six main maritime basins: the Baltic Sea, the North Sea, the North East Atlantic Ocean, the Mediterranean Sea, the Black Sea and the outermost regions. However, the outermost coastal regions cannot be really considered as bordering a maritime basin. In these areas, the distance between the regions and their metropolis is the first criterion considered for this group.
Population of the EU coastal regions
In 2008, around 205 million people lived in the EU coastal regions, i.e. 41 % of the EU population or 44 % of the coastal Member States’ population. As Table 13.1 shows, the share of the national population living in a coastal region mainly depends on the geographical characteristics of a country, such as the length of the coastline and its configuration. For island states, such as Cyprus, or peninsulas such as Denmark, the share is 100 % because all regions in these countries are deemed to be coastal. At the other end of the scale, 2009 figures show the share of inhabitants of coastal regions was only 5 % in Romania and 9 % in Germany.
The EU population living along maritime basins
The most populated EU coastline is the Mediterranean. As Figure 13.1 shows, in 2009, the coastal regions bordering the Mediterranean housed 36 % of the EU coastal regions’ population, followed by the North East Atlantic Ocean coastal regions (30 %). This distribution is linked to the
(1) See definition of EU coastal region in ‘Data sources and availability’.
attractiveness of the area but is mainly impacted by geographic criteria, such as coast length and the number of coastal regions in each basin. In total, 142 EU coastal regions belong to the seven Member States bordering the Mediterranean Sea and only five EU coastal regions in Romania and Bulgaria border the Black Sea.
Structure of the EU coastal regions’ population by maritime basins
The structure of the EU coastal regions’ population by age and gender shows quite different profiles according to the maritime basin. Figure 13.2 shows the different basins’ age pyramids as compared with the age pyramid of the EU population as a whole.
Indeed, as clearly shown by the age pyramid of the EU outermost coastal regions, there was a greater share of people aged less than 40 years in these coastal regions than in the EU population as a whole. This is even more pronounced for people aged under 15 years. The structural difference is mainly due to the age structure of French overseas regions.
By contrast, the age pyramid of the EU coastal regions bordering the Baltic Sea shows an overrepresentation of people aged over 50 years as compared with the EU population as a whole.
The age pyramids also show a structural difference between the genders. In the EU coastal regions bordering the North Sea, there is an overrepresentation of the group including men aged over 40 years as compared with the EU population as a whole. Overrepresentation of this age group among women appears to be less pronounced.
The EU coastal regions population by maritime basins and urban–rural typology
The profile of the population living along the maritime basins also depends on the urban–rural type of the coastal regions bordering each basin. Indeed, the urban–rural type of the EU coastal regions has an impact on the kind of demographic pressure exerted on the coastal area and on socioeconomic issues. There has been a recent revision of urban–rural typology, taking into account the population density observed by grid cells of 1 km² and the population living in contiguous grid cell groups (2).
In 2009, as shown in Figure 13.3, 64 % of the population of EU coastal regions bordering the North Sea lived in predominantly urban regions. This is mainly due to the presence of large cities such as London, Hamburg and
(2) See definition of the new urban–rural typology in ‘Data sources and availability’.

13
171Eurostat regional yearbook 2011eurostat
Coastal regions
Map 13.1: Coastal regions in the European Union, by sea basins and by NUTS 3 regions
0 600 kmCoastal regions in the EuropeanUnion, by sea basins and
by NUTS 3 regions
Cartography: Eurostat — GISCO, 06/2011© EuroGeographics Association, for the administrative boundaries
Source: Eurostat
Guadeloupe (FR)
0 25
Martinique (FR)
0 20
Guyane (FR)
0 100
Réunion (FR)
0 20
Açores (PT)
0 50
Madeira (PT)
0 20
Canarias (ES)
0 100
Malta
0 10
0 100
ÍslandLiechtenstein
0 5
North East Atlantic Ocean
Baltic Sea
North Sea
Mediterranean Sea
Black Sea
Outermost regions
Data not available
Source: Eurostat.

13 Coastal regions
172 Eurostat regional yearbook 2011 eurostat
Table 13.1: Population in EU coastal regions by country
Population in coastal regions, 1st of January
(per 1 000 000 inhabitants)
Share of population in coastal regions compared
to national population (%)
2007 2008 2009 2009
EU-27 (¹) 495.3 497.7 499.7 41
EU coastal regions (¹) 203.2 204.7 : 44
Belgium (²) 3.43 3.45 3.48 32
Bulgaria 1.08 1.08 1.09 14
Denmark 5.45 5.48 5.51 100
Germany (²) 7.20 7.20 7.18 9
Estonia 1.00 1.00 1.00 74
Ireland 4.05 4.14 4.18 94
Greece 10.45 10.49 10.54 94
Spain 26.47 27.00 27.32 60
France (²) 24.24 24.40 24.52 38
Italy 35.83 36.06 36.25 60
Cyprus 0.78 0.79 0.80 100
Latvia 1.40 1.40 1.40 62
Lithuania 0.38 0.38 0.38 11
Malta 0.41 0.41 0.41 100
Netherlands 8.83 8.86 8.91 54
Poland 4.43 4.43 4.44 12
Portugal 8.72 8.75 8.77 83
Romania 0.97 0.97 0.97 5
Slovenia 0.28 0.28 0.28 14
Finland 3.31 3.33 3.35 63
Sweden 7.40 7.47 7.54 81
United Kingdom (¹) 47.07 47.36 : 77
(¹) 2008 instead of 2009.(2) Belgium, Germany and France, estimated data for 2009.
Source: Eurostat (online data codes: demo_r_pjanaggr3).

13
173Eurostat regional yearbook 2011eurostat
Coastal regions
Figure 13.1: Distribution of population in EU coastal regions by maritime basin, 1 January 2009 (¹) (%)
Baltic Sea 10.9%
Black Sea 1.0%
Mediterranean Sea 36.0%
North East Atlantic Ocean 29.4%
North Sea 20.6%
Outermost Regions 2.1%
(¹) United Kingdom, 2008 instead of 2009; Belgium, Germany and France, estimated data.
Source: Eurostat (online data code: demo_r_pjanaggr3).
Rotterdam and the high population density in the Belgian, Dutch and German coastal regions.
By contrast, only 25 % of the population of EU coastal regions bordering the Baltic Sea lived in predominantly urban regions. Although these regions are home to major cities areas such as Copenhagen, Riga, Stockholm and Helsinki, the regions bordering this basin are predominantly rural, especially along the Finnish, Swedish and Estonian coastlines.
The population of EU coastal regions bordering the Black Sea lived in predominantly rural regions (12 %) or intermediate regions (88 %). None of the regions bordering this basin are considered to be predominantly urban. This is mainly a country effect as Romania and Bulgaria house few predominantly urban regions.
Geographic criteria also influence the distribution of the population in these regions. The fact that the majority (72 %) of the population of EU coastal outermost regions lived in predominantly urban regions is linked to the fact that these regions are quite small islands, mainly volcanic, and consequently housing space is limited.
Change in EU coastal regions’ populationIn 2008, the population of the EU coastal regions increased by 0.6 % or 0.2 percentage points more than in the European Union as a whole. However, there were significant disparities between individual coastal regions and between coastal regions bordering each basin.
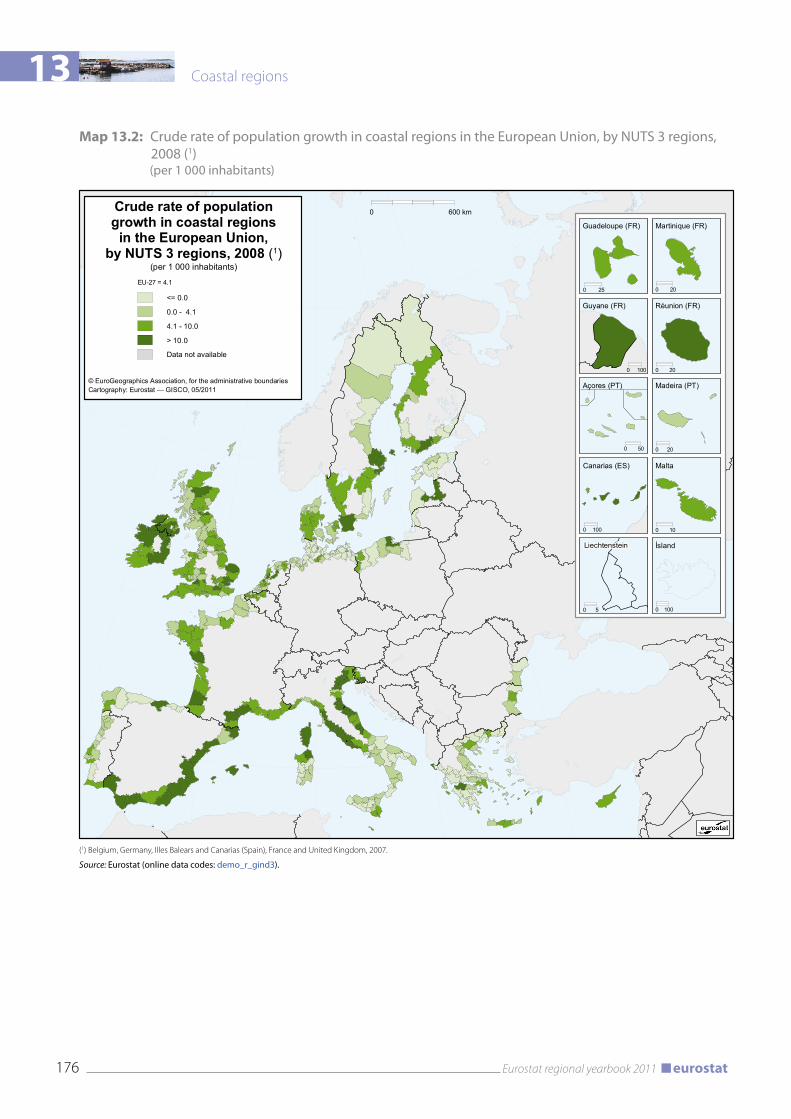
Population change or growth is the difference between the number of inhabitants in an area at the end and the beginning of a period. Relative population growth, evaluated here by the crude rate of population growth, has two components: natural population growth (balance between live births and deaths) and net migration. Map 13.2 showing the crude rate of population growth of the EU coastal regions in 2008 can be compared to Map 13.3 showing the crude rate of net migration of these regions in the same period.
In 2008, along the Mediterranean coastline, the crude rate of population growth was usually higher in the EU coastal regions of the western and central coast than in the east. This growth can be explained by net migration. The crude rates of population growth were higher in coastal regions such as the Spanish regions of Almería (27 ‰), the French region of Aude (11 ‰) or the Italian region of Viterbo (16 ‰) where net migration reached 20 ‰ in the region of Almería, 11 ‰ in the region of Aude and 18 ‰ in the region of Viterbo. By contrast, the crude rates of population growth were negative in the Greek region of Lakonia (– 6 ‰) partly explained by the crude rate of net migration (– 2 ‰) and in the Italian region of Napoli, where the crude rate of population growth (– 3‰) was deeply impacted by net migration (– 6 ‰). By contrast, in some regions, the trend in the crude rate of population growth went in the opposite direction to net migration, such as in the Greek region of Arkadia where the crude rate of population growth was – 5 ‰ despite a positive net migration (1 ‰).

13 Coastal regions
174 Eurostat regional yearbook 2011 eurostat
Figure 13.2: Age pyramids for EU coastal regions by maritime basin and compared to EU-27, 2009
Baltic Sea
Source: Eurostat rural development database.
0 5
10 15 20 25 30 35 40 45 50 55 60 65 70 75 80 85 90
100 Age
North East Atlantic Ocean (¹)
(¹) United Kingdom, data not available; Ireland, 2006 instead of 2009.Source : Eurostat rural development database.
5% 4% 3% 2% 1% 0% 1% 2% 3% 4% 5%
0 5
10 15 20 25 30 35 40 45 50 55 60 65 70 75 80 85 90
100 Age
Female Male EU-27 Male EU-27 Female
5% 4% 3% 2% 1% 0% 1% 2% 3% 4% 5%
Female Male EU-27 Male EU-27 Female
Black Sea (¹)
(¹) Romania, data not available.
Source: Eurostat rural development database.
0 5
10 15 20 25 30 35 40 45 50 55 60 65 70 75 80 85 90
100
Age North Sea (¹)
(¹) United Kingdom, data not available.
Source: Eurostat rural development database.
0 5
10 15 20 25 30 35 40 45 50 55 60 65 70 75 80 85 90
100 Age
Mediterranean Sea (¹)
(¹) Greece, data not available.Source: Eurostat rural development database.
0 5
10 15 20 25 30 35 40 45 50 55 60 65 70 75 80 85 90
100 Age
Outermost regions
Source: Eurostat rural development database.
0 5
10 15 20 25 30 35 40 45 50 55 60 65 70 75 80 85 90
100 Age
5% 4% 3% 2% 1% 0% 1% 2% 3% 4% 5%
Female Male EU-27 Male EU-27 Female
5% 4% 3% 2% 1% 0% 1% 2% 3% 4% 5%
Female Male EU-27 Male EU-27 Female
5% 4% 3% 2% 1% 0% 1% 2% 3% 4% 5%
Female Male EU-27 Male EU-27 Female
5% 4% 3% 2% 1% 0% 1% 2% 3% 4% 5%
Female Male EU-27 Male EU-27 Female

13
175Eurostat regional yearbook 2011eurostat
Coastal regions
Figure 13.3: Distribution of population in EU coastal regions by maritime basin and urban-rural typology, 1 January 2009 (¹) (%)
0%
20%
40%
60%
80%
100%
Outermost Regions North Sea North East Atlantic Ocean
Mediterranean Sea Baltic Sea Black Sea
Predominantly urban Intermediate Predominantly rural
(¹) United Kingdom, 2008 instead of 2009; Belgium, Germany and France, estimated data.
Source: Eurostat (online data code: demo_r_pjanaggr3).
Along the Black Sea coastline, in 2008, population changes in the coastal regions bordering this basin were rather more even. However, the crude rates of population change varied in the same way as net migration, such as in the Bulgarian coastal region of Varna, where the population grew by (8 ‰) due to net migration (8 ‰), and in the Romanian coastal region of Tulcea, where population growth was negative (– 6 ‰), reflecting net migration (– 3 ‰).
In 2008, along the North East Atlantic Ocean coastline, the crude rates of population growth were higher in the Irish coastal regions, such as in the Mid-East region (20 ‰) partly explained by net migration (6 ‰). The crude rates of population growth were also high along the west French coastline, such as in the region of Landes (11 ‰), explained by net migration (10 ‰), and in some Portuguese regions such as the region of Algarve (9 ‰), explained by net migration (8 ‰). By contrast, the crude rate of population growth was negative in the Portuguese region of Alentejo Litoral (– 7 ‰), partly due to net migration (– 2 ‰). The Spanish region of Lugo bucked this trend with a negative crude rate of population growth (– 4 ‰) despite positive net migration (4 ‰).
Along the North Sea coastline, the highest crude rates of population growth were in the English, Belgian and Dutch regions, partly explained by net migration in Belgium and the Netherlands. By contrast, the negative crude rate of population growth in the German regions is also partly due to net migration. However, during this period, in the Dutch region of Delfzijl en omgeving, the crude rate of population growth was negative (– 15‰), explained by net migration (– 14 ‰), and growth in the German region of Hamburg was positive (9 ‰), also due to net migration (9 ‰).
In 2008, along the Baltic Sea coastline, the highest crude rates of population growth were mainly in the predominantly urban regions, such as the Finnish region of Uusimaa (12 ‰), partly explained by net migration (7 ‰), the Swedish region of Stockholms län (16 ‰), partly due to net migration (10 ‰), and the Latvian region of Pieriga (13 ‰), due to net migration (14‰).
In 2008, population changes in outermost coastal regions were mixed. In the Spanish coastal region of Gran Canaria, population growth was 13 ‰, mainly due to net migration (10 ‰). By contrast, in the French coastal region of Guadeloupe, population growth was 6 ‰, despite a net migration of – 3 ‰.
Share of women in the population of EU coastal regions
As Map 13.4 shows, in 2009, the share of women in the EU coastal regions population was fairly even. Along the Baltic Sea coastline, the share of women in the Swedish and Finnish coastal regions was below the EU average, but it was above average in the Latvian, Estonian and Lithuanian coastal regions.
In the same period, along the Mediterranean coastline, there was also a contrast between the Spanish and Greek coastal regions, which had a lower female population, and the French and north Italian coastal regions, which had a higher female population.
The North Atlantic Ocean Spanish coastal regions had a higher share of women than the Mediterranean coastline, and as compared with the EU average.
13 Coastal regions
176 Eurostat regional yearbook 2011 eurostat
Map 13.2: Crude rate of population growth in coastal regions in the European Union, by NUTS 3 regions, 2008 (1)(per 1 000 inhabitants)
0 600 kmCrude rate of populationgrowth in coastal regions
in the European Union,by NUTS 3 regions, 2008 (1)
Cartography: Eurostat — GISCO, 05/2011© EuroGeographics Association, for the administrative boundaries
Source: Eurostat (online data code: demo_r_gind3)
(per 1 000 inhabitants)
(¹) Belgium, Germany, lles Balears (ES53), Canarias (ES70), France and United Kingdom, 2007.
Guadeloupe (FR)
0 25
Martinique (FR)
0 20
Guyane (FR)
0 100
Réunion (FR)
0 20
Açores (PT)
0 50
Madeira (PT)
0 20
Canarias (ES)
0 100
Malta
0 10
0 100
ÍslandLiechtenstein
0 5
EU-27 = 4.1
<= 0.0
0.0 - 4.1
4.1 - 10.0
> 10.0
Data not available
(1) Belgium, Germany, Illes Balears and Canarias (Spain), France and United Kingdom, 2007.
Source: Eurostat (online data codes: demo_r_gind3).

13
177Eurostat regional yearbook 2011eurostat
Coastal regions
Map 13.3: Net migration (crude rate, including corrections) in coastal regions in the European Union, by NUTS 3 regions, 2008 (1)(per 1 000 inhabitants)
0 600 kmNet migration (crude rate,including corrections) in coastalregions in the European Union,
by NUTS 3 regions, 2008 (1)
Cartography: Eurostat — GISCO, 05/2011© EuroGeographics Association, for the administrative boundaries
Source: Eurostat (online data code: demo_r_gind3)
(per 1 000 inhabitants)
(¹) Belgium, Germany, lles Balears (ES53), Canarias (ES70) and France, 2007.
Guadeloupe (FR)
0 25
Martinique (FR)
0 20
Guyane (FR)
0 100
Réunion (FR)
0 20
Açores (PT)
0 50
Madeira (PT)
0 20
Canarias (ES)
0 100
Malta
0 10
0 100
ÍslandLiechtenstein
0 5
EU-27 = 2.9
<= 0.0
0.0 - 2.9
2.9 - 10.0
> 10.0
Data not available
(1) Belgium, Germany, Illes Balears and Canarias (Spain) and France, 2007.
Source: Eurostat (online data codes: demo_r_gind3).

13 Coastal regions
178 Eurostat regional yearbook 2011 eurostat
Map 13.4: Share of women in the population of coastal regions in the European Union, by NUTS 3 regions, 2009 (1)(%)
0 600 kmShare of women in thepopulation of coastal regions
in the European Union,by NUTS 3 regions, 2009 (1)
Cartography: Eurostat — GISCO, 05/2011© EuroGeographics Association, for the administrative boundaries
Source: Eurostat (online data code: demo_r_pjanaggr3)
(%)
(¹) Population at 1 January; Belgium, Germany and France, estimated value; lles Balears (ES53), Canarias (ES70) and United Kingdom, 2008.
Guadeloupe (FR)
0 25
Martinique (FR)
0 20
Guyane (FR)
0 100
Réunion (FR)
0 20
Açores (PT)
0 50
Madeira (PT)
0 20
Canarias (ES)
0 100
Malta
0 10
0 100
ÍslandLiechtenstein
0 5
EU-27 = 51.2
<= 50.5
50.5 - 51.2
51.2 - 52.0
> 52.0
Data not available
(1) Population at 1 January; Belgium, Germany and France, estimated value; Illes Balears and Canarias (Spain) and United Kingdom, 2008.
Source: Eurostat (online data codes: demo_r_pjanaggr3).

13
179Eurostat regional yearbook 2011eurostat
Coastal regions
Active population of the EU coastal regions
In 2009, the active population (3) of the EU coastal regions was around 97 million persons, i.e. 41 % of the whole EU active population. In general, the active population grew in the EU coastal regions faster than in the EU. However, the rise in active population differed greatly between countries. Between 2007 and 2009, as Table 13.2 shows, the active population in Germany remained fairly stable, rising from 3 652 000 persons to 3 669 000 persons, giving a 0.2 % average annual growth rate. During the same period, the active population of Malta increased by an annual average rate of 2.1 %.
Share of women in the active population of EU coastal regions
In 2009, the share of women in the active population of the EU coastal regions varied from 33.7 % in Malta to 50.5 % in Latvia. In general, as Map 13.5 shows, the share of women in the active population of the EU coastal regions along the Mediterranean and Black Sea basins was lower than the EU average, except for the Mediterranean French regions and the Spanish region of Barcelona. By contrast, the share was higher than the EU average in the EU coastal regions along the Baltic Sea. The share of women in the active population was more varied in the EU coastal regions along the other maritime basins.
Unemployment in EU coastal regions
In 2009, as shown in Map 13.6, the risk of unemployment (4) in the EU coastal regions was no higher than the national average. In 53 % of EU coastal regions, unemployment was lower than the national average. In general, proximity to the sea was not a discriminatory factor. Thus, in the southern and the Mediterranean coastal regions of Spain, the active population was more exposed to unemployment. This was also the case for the southern Italian coastal regions, eastern German coastal regions and French and Spanish outermost coastal regions. By contrast, the majority of the active population of the coastal regions along the North East Atlantic Ocean was less exposed to unemployment.
Female unemployment in EU coastal regions
In 2009, as shown in Map 13.7, the female active population was at greater risk of unemployment, in particular in the
(3) See definition of active population in ‘Data sources and availability’.(4) See definition of unemployment in ‘Data sources and availability’.
coastal regions along the southern coastlines of France, Spain and Italy, several Greek regions and in the French and Spanish coastal outermost regions. Female unemployment rates can be compared to the share of women in the active population illustrated in Map 13.5. In the coastal regions along the southern Italian coastline and in several Greek coastal regions, the share of women in the active population was below the EU average and female unemployment was higher than the EU average. By contrast, in the Swedish and Finish coastal regions, the share of women in the active population was above the EU average and female unemployment was below the EU average.
Data sources and availability EU coastal regions: a coastal region of the European Union is a statistical region defined at NUTS level 3 of the geographical nomenclature that has a coastline or more than half of its population living less than 50 km from the sea. The EU has 446 such regions, belonging to the 22 Member States which have a coastline. Of these 446 coastal regions, 372 have a coastline, while 73 meet the second criterion. Lastly, the German region of Hamburg has been added to the list, given the strong influence of the sea there.
The 22 Member States which have a coastline are: Belgium, Bulgaria, Denmark, Germany, Estonia, Ireland, Greece, Spain, France, Italy, Cyprus, Latvia, Lithuania, Malta, the Netherlands, Poland, Portugal, Romania, Slovenia, Finland, Sweden and the United Kingdom.
Urban–ruraltypology: the typology is based on a definition of urban and rural grid cells by 1 km². Urban grid cells fulfil two conditions: (1) a population density of at least 300 inhabitants per km² and (2) a minimum population of 5 000 inhabitants in contiguous cells above the density threshold. Other cells are considered as rural.
Based on the share of the rural population (i.e. living in rural grid cells), the NUTS 3 regions have been classified into the following three groups:
• predominantly urban regions: the rural popula-tion is less than 20 % of the total population;
• intermediate regions: the rural population is be-tween 20 % and 50 % of the total population;
• predominantlyruralregions: the rural population is 50 % or more of the total population.
Activepopulationandunemployment:the active popula-tion comprises the population in employment plus the popu-lation of unemployed. The definitions and references relat-ing to the active population and unemployment correspond to those used in the Labour Force Survey.

13 Coastal regions
180 Eurostat regional yearbook 2011 eurostat
Table 13.2: Active population aged 15 years and over in EU coastal regions by country
Active population in coastal regions (per 1 000 persons)
Share of women in the active popu-lation of coastal regions
(%)
2007 2008 2009 2009
EU-27 236 549.5 238 992.0 239 810.2 45.3
Belgium (¹) 1 571.2 : : 44.8
Bulgaria (²) 495.7 503.3 : 44.8
Denmark 2 913.7 2 951.9 2 952.5 47.1
Germany 3 652.3 3 656.2 3 669.5 45.9
Estonia 526.2 530.6 527.3 49.7
Ireland : : 2 047.2 44.1
Greece 4 611.2 4 621.7 4 665.7 41.5
Spain 13 294.8 13 687.5 13 791.1 44.0
France (³) 10 321.0 10 418.8 10 571.1 47.4
Italy 13 990.3 14 172.1 14 005.1 39.1
Cyprus 393.4 397.4 402.6 44.9
Latvia 761.2 771.7 752.7 50.5
Lithuania 176.2 181.3 185.7 50.2
Malta 167.1 170.6 174.2 33.7
Netherlands 4 734.2 4 777.3 4 827.4 46.1
Poland 1 700.2 1 705.7 1 738.3 44.6
Portugal (¹) 4 585.2 : : 47.0
Romania 416.7 418.6 416.9 38.5
Slovenia 142.4 144.1 142.3 44.8
Finland (²) 1 727.9 1 755.6 : 48.5
Sweden 3 940.9 3 998.8 4 017.6 47.5
United Kingdom (4) 20 272.7 22 930.0 24 144.5 46.1
(1) Share of women calculated for 2007 instead of 2009.(2) Share of women calculated for 2008 instead of 2009.(³) France, share of women estimated value.(4) United Kingdom, 2007 excluding Scotland and Northern Ireland; 2008 excluding Highlands and Islands and Northern Ireland.
Source: Eurostat (online data codes: lfst_r_lfp3pop).
Crude rate of population growth is the ratio of total population growth during the year to the average population of the area in question that year. The value is expressed per 1 000 inhabitants.
Cruderateofnetmigration is the ratio of net migration during the year to the average population in that year. The value is expressed per 1 000 inhabitants.
ContextOn 10 October 2007, the Commission adopted the Blue Paper launching an integrated maritime policy for the European Union. The aims of this policy are to maximise the sustainable use of oceans and seas, enhance Europe’s knowledge and innovation potential in maritime affairs, ensure development and sustainable growth in coastal regions, strengthen Europe’s maritime leadership and raise the profile of maritime Europe. This policy stresses the importance of coastal regions due to their geographic location and aims to develop sea basin strategies.

13
181Eurostat regional yearbook 2011eurostat
Coastal regions
Map 13.5: Share of women aged 15 years and over in the active population of coastal regions in the European Union, by NUTS 3 regions, 2009 (1)(%)
0 600 kmShare of women aged 15 years
and over in the active populationof coastal regions in the
European Union,by NUTS 3 regions, 2009 (1)
Cartography: Eurostat — GISCO, 05/2011© EuroGeographics Association, for the administrative boundaries
Source: Eurostat (online data code: lfst_r_lfp3pop)
(%)
(¹) Bulgaria, Malta and Finland, 2008; Belgium, France and Portugal, 2007.
Guadeloupe (FR)
0 25
Martinique (FR)
0 20
Guyane (FR)
0 100
Réunion (FR)
0 20
Açores (PT)
0 50
Madeira (PT)
0 20
Canarias (ES)
0 100
Malta
0 10
0 100
ÍslandLiechtenstein
0 5
EU-27 = 45.3
<= 40.0
40.0 - 45.3
45.3 - 47.5
> 47.5
Data not available
(1) Bulgaria, Malta and Finland, 2008; Belgium, France and Portugal, 2007.
Source: Eurostat (online data code: lfst_r_lfp3pop).

13 Coastal regions
182 Eurostat regional yearbook 2011 eurostat
Map 13.6: Unemployment rate for persons aged 15 years and over in coastal regions in the European Union, by NUTS 3 regions, 2009 (1)(as compared with the national level, national level = 100)
0 600 kmUnemployment rate for pe sonsaged 15 years and over in coastalregions in the European Union,
by NUTS 3 regions, 2009 (1)
Cartography: Eurostat — GISCO, 05/2011© EuroGeographics Association, for the administrative boundaries
Source: Eurostat (online data code: lfst_r_lfu3rt)
(as compared with the national level,national level = 100)
(¹) Bulgaria, Malta and Finland, 2008; France and Portugal, 2007; Belgium, 2006.
rGuadeloupe (FR)
0 25
Martinique (FR)
0 20
Guyane (FR)
0 100
Réunion (FR)
0 20
Açores (PT)
0 50
Madeira (PT)
0 20
Canarias (ES)
0 100
Malta
0 10
0 100
ÍslandLiechtenstein
0 5
<= 75.0
75.0 - 100.0
100.0 - 125.0
> 125.0
Data not available
(1) Bulgaria, Malta and Finland, 2008; France and Portugal, 2007; Belgium, 2006.
Source: Eurostat (online data code: lfst_r_lfu3rt).

13
183Eurostat regional yearbook 2011eurostat
Coastal regions
Map 13.7: Unemployment rate for women aged 15 years and over in coastal regions in the European Union, by NUTS 3 regions, 2009 (1)(%)
0 600 kmUnemployment rate for womenaged 15 years and over in coastalregions in the European Union,
by NUTS 3 regions, 2009 (1)
Cartography: Eurostat — GISCO, 05/2011© EuroGeographics Association, for the administrative boundaries
Source: Eurostat (online data code: lfst_r_lfu3rt)
(%)
(¹) Bulgaria, Malta and Finland, 2008; France and Portugal, 2007; Belgium, 2006.
Guadeloupe (FR)
0 25
Martinique (FR)
0 20
Guyane (FR)
0 100
Réunion (FR)
0 20
Açores (PT)
0 50
Madeira (PT)
0 20
Canarias (ES)
0 100
Malta
0 10
0 100
ÍslandLiechtenstein
0 5
EU-27 = 8.9
<= 5.0
5.0 - 8.9
8.9 - 15.0
> 15.0
Data not available
(1) Bulgaria, Malta and Finland, 2008; France and Portugal, 2007; Belgium, 2006.
Source: Eurostat (online data code: lfst_r_lfu3rt).