coastal sea surface temperature and coho salmon production off the north-west united states
TRANSCRIPT

Coastal sea surface temperature and coho salmonproduction off the north-west United States
JAMES COLE
NOAA-NMFS, Paci®c Fisheries Environmental Lab, Paci®cGrove, CA 93950, USA
ABSTRACT
A time series of mean weekly sea surface temperature(SST) images was used to investigate the relationshipbetween ¯uctuations in the marine survival of hatch-ery-reared coho salmon and coastal ocean dynamics offthe north-western United States (51° to 37°N)between 1985 and 1996, using univariate and nonlinearbivariate regression analysis. Ocean conditions werematched against survival for a number of differentannual time frames according to the sum of negativeor positive weekly SST anomalies. From the univariateanalyses, the sum of negative anomalies from April toJune, when the juvenile salmon ®rst enter the ocean,was found to have an R2 of 0.88 against survival with1991 excluded as an outlier. The bivariate multipleregressions used the sum of negative anomalies fromApril to June as the ®rst independent variable. Whenthe sums of positive anomalies from the followingperiods during the ®shes' second calendar year in theocean were each used as the second independentvariable, the R2 values were all greater than or equal to0.92 (with no data points excluded): January to June,February to June, April to June, March to June. Theseresults are discussed within the context of coastalocean processes. It is concluded that the analysis ofSST image time series might allow management tomake reasonable forecasts of hatchery-reared cohosalmon survival.
Key words: California Current, coho salmon, marinesurvival, remote sensing, sea surface temperature,upwelling
INTRODUCTION
Background
Coho salmon (Oncorhynchus kisutch) are a valuableresource to both commercial and sports ®shermen inthe north-east Paci®c, from Alaska to northern Cali-fornia. They have a three year life cycle, as illustratedin Fig. 1. Unlike other species of Paci®c salmon, theyspend little time in estuaries, and once in the ocean,they are thought to remain fairly close to the coast(Pearcy, 1992). In addition to the stages depicted inFig. 1, a number of sexually precocious males (called`jacks') remain at sea for only about 6 months, andreturn to fresh water during the autumn of the sameyear that they entered the ocean.
Coho salmon in the `Oregon Production Index'(OPI) area, which covers the region from Willapa Bayto Monterey Bay (Fig. 2), have been commerciallyexploited since the 1900s. At about the same time, the®rst hatcheries for rearing and releasing coho fry wereopened on the Columbia River and other coastalstreams. Since the 1960s, there has been a largeincrease in the number and size of hatcheries, andconsequently in the number of smolts released(Fig. 3a), in an attempt to counter the adverse affectsof dam building, logging, and agriculture on thesalmon's natural freshwater habitats (Pearcy, 1992).Hatchery-reared ®sh have, in general, accounted forwell over 50% of the adult population since the mid1960s (Oregon Department of Fisheries and Wildlifedata).
Coho populations within the OPI region have beendivided into Ecologically Signi®cant Units (ESU)based on genetic data, the results from catch±releasestudies, and life-history traits (Weitkamp et al., 1995;Weitkamp et al., 1997; see also Coronado and Hil-born, 1998). The genetic, life-history and migratorycharacteristics of coho differ between different ESUs,but are relatively homogeneous within each ESU. Thethree main ESUs in the region encompass the areasfrom the Columbia River to Cape Blanco, from CapeBlanco to just south of Cape Mendocino, and theremaining stretch of California coast from CapeMendocino down to Monterey Bay (Fig. 2). Over 95%of all public hatchery-reared coho salmon in the OPI
*Correspondence. e-mail: [email protected]
Received 19 January 1999
Revised version accepted 12 August 1999
FISHERIES OCEANOGRAPHY Fish. Oceanogr. 9, 1±16, 2000
Ó 2000 Blackwell Science Ltd. 1

Figure 2. The western United States. TheOregon Production Index area for cohosalmon is between Willapa Bay and Mon-terey Bay.
Figure 1. Life cycle of Oregon coho salmon.
2 J. Cole
Ó 2000 Blackwell Science Ltd., Fish. Oceanogr., 9, 1±16.

region are released into the ®rst ESU, mainly into theColumbia River. Of those which reach adulthood,most either return to their `natal streams' or else arecaught by ®shermen in nearby coastal waters (e.g.Weitkamp et al., 1997).
The boundaries between these ESUs also corres-pond to trends in the region's physical oceanography.Winds south of Cape Blanco are mostly upwelling-favourable throughout the year. The area to the northis downstream from where the North Paci®c SubarcticCurrent (or `West Wind Drift') splits into the pole-ward Alaska Current and the equatorward California
Current. Washington and Oregon coastal waters northof Cape Blanco are in¯uenced by the Columbia Riverplume, the Davidson Current and seasonal upwellingactivity. During summer and spring, coastal upwellingis common, mean coastal ¯ow is equatorward, and theColumbia River plume is mainly orientated in asoutherly direction. During winter, the winds aremostly from the south and west, downwelling iscommon, and the coastal Davidson Current andColumbia River plume ¯ow northwards (Fiedler andLaurs, 1990; Pearcy, 1992; Schwing et al., 1998; Struband James, in press).
Previous studies in the OPI area have shown thatcoastal ocean conditions play an important role indetermining the marine survival of juvenile andmaturing coho salmon, and hence the number ofadults that return to fresh water each year (Pearcy,1992; Lawson, 1997). The occurrence and magnitudeof upwelling during the juvenile coho's ®rst spring andsummer in the ocean is thought to be particularlyimportant (Scarnecchia, 1981; Zirges, 1981; Nickel-son, 1986; Fisher and Pearcy, 1988), although condi-tions later in the marine phase can also play a role(Pearcy et al., 1985; Lawson, 1997).
A large drop in marine survival during the mid 1970s(Fig. 3b) was associated with the well-documented`regime shift' in the eastern Paci®c, which off Californiaand Oregon was characterized by reduced upwelling,increased surface temperatures, and higher sea levels(Mantua et al., 1997; Schwing et al., 1998). In general,large-scale interdecadal studies indicate that warmconditions in the NE Paci®c generally favour Alaskansalmon stocks, whilst cooler conditions appear to fa-vour stocks south of British Columbia (Francis andHare, 1994; Gargett, 1997; Mantua et al., 1997).
The problem and aims
The abundance and ocean survival of coho salmon hasdeclined dramatically between 1985 and 1996 (Fig. 3).Prior to this period, good relationships existed betweensurvival and coastal upwelling indices derived fromwind speed and direction (Ekman transport) (Nickel-son, 1986). A breakdown in these relationships sincethe mid 1980s has, however, made it dif®cult toexplain the recent decline purely in terms of changesin coastal wind forcing (Lawson, 1997).
The strong surface temperature signal typicallyassociated with ¯uctuations in coastal upwelling alsomakes sea surface temperature (SST) a suitableparameter for measuring oceanographic variability inthe OPI region for ®sheries research. The purpose of thisstudy is to create and use a time series of AdvancedVery High Resolution Radiometer (AVHRR) sea
Figure 3. Statistics for coho salmon released from publichatcheries in the OPI region: (a) number of smolts released,and of these the number surviving to adulthood; (b) marinesurvival, as calculated from the number returning the fol-lowing year divided by the number of smolts released frompublic hatcheries.
Ó 2000 Blackwell Science Ltd., Fish. Oceanogr., 9, 1±16.
Temperature and coho survival 3

surface temperature (SST) images from the NOAApolar-orbiting satellites to answer the following ques-tions: (1) can coastal ocean conditions, as representedby SST images, account for the drop in survival ofhatchery-reared coho since the mid 1980s; and (2)could AVHRR-derived SST data be used for predict-ing coho salmon production, on a year-to-year basis,for management purposes?
DATA AND METHODS
Construction of a time series of meanweekly SST images
A time series of mean weekly SST images from 1985to 1996 was constructed for the area shown in Fig. 4from processed AVHRR SST data from the Jet Pro-pulsion Laboratory's `Path®nder' project (http://pod-aac.jpl.nasa.gov/sst/). I used 9 km spatial resolution`daytime' and `night-time' daily images to constructthe weekly mean SST images. On average the daytimeimages had marginally higher SSTs than the night-time images (»0.25°C). I decided, however, that theextra spatial coverage gained by including both day-time and night-time images outweighed any biasescaused by differences in daytime and night-time SSTs.
Four mean weekly SST images were generated foreach calendar month. The ®rst three weeks were alwaysseven-day averages (days 1±7, 8±14, and 15±21,respectively), whilst the fourth week was an average ofall the remaining days in the month (days 22 onwards).
Within 150 km of the Washington, Oregon andnorthern California coasts, levels of `cloud contam-ination' in the mean weekly images were generally less
than 30%. In other words, for a given pixel site, 70%or more of the images in the time series would usuallyhave a valid mean weekly SST value, whilst the restwould have a `cloud-contaminated' value of zero owingto cloud cover at that site throughout an entire week.Finally, a clean data set was produced by removing thecloud-contaminated areas in each image with SSTestimates using a bilinear spatial interpolation routine.An example of a mean weekly image with cloudcontamination removed is shown in Fig. 4.
Calculation of coastal SST anomalies
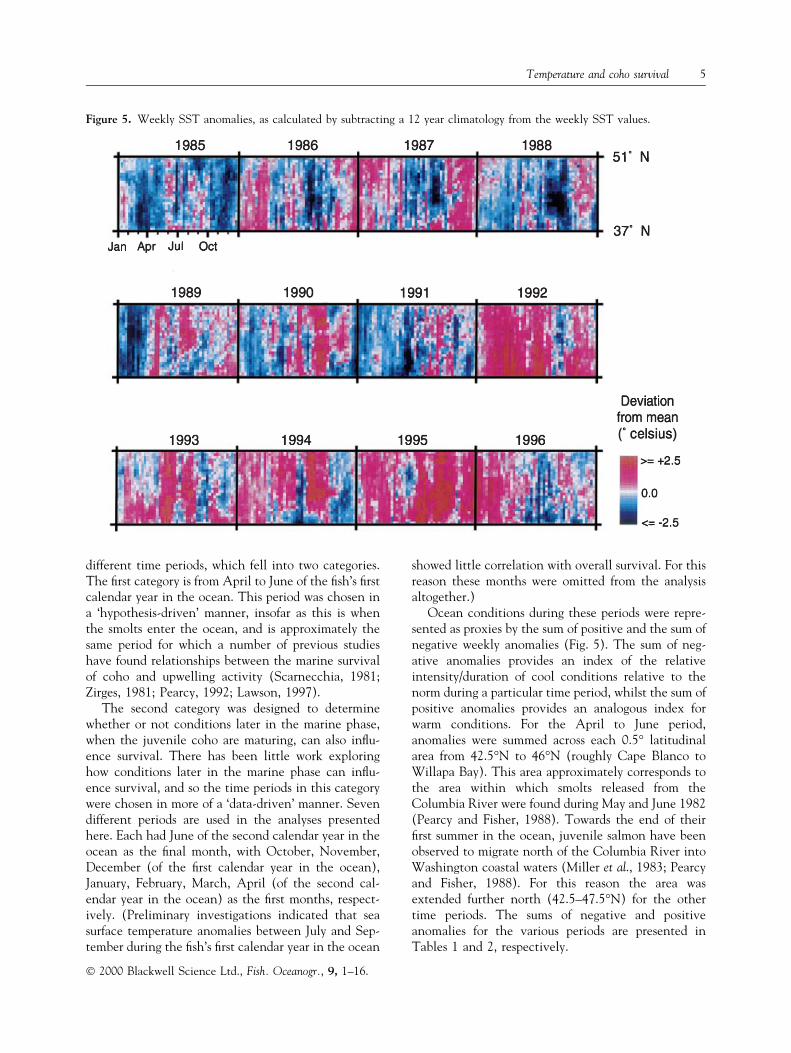
Mean weekly SSTs were extracted from 28 coastalboxes, consecutively spaced at 0.5° latitudinal inter-vals, between 51°N and 37°N. Each box covers an areawithin 40 km of the coast. A 12 year SST climatologywas then calculated from 1985 to 1996. SST anom-alies, for each latitudinal interval and for each week,were calculated as deviations from the 12 year clima-tology (Fig. 5), and used as the basis for the analyseswhich follow.
Coho salmon data
The coho salmon data for the OPI region used in thisanalysis come from the Oregon Department of Fish-eries and Wildlife (Joe Fisher, Oregon State Univer-sity, pers. comm.; Rod Kaiser and Curt Melcher,Oregon Department of Fish and Wildlife, Newport,Oregon, pers. comm.). Three types of coho data areused (Paci®c Fisheries Management Council, 1998).
1 Estimates of public hatchery coho abundance in theOPI, as shown in Fig. 3(a), are derived from catchdata combined with estimates of the number of ®shthat escape being caught and return to the hatch-eries (`escapement').
2 Estimates of the marine survival of OPI publichatchery ®sh are based on the number of hatchery-reared adults that were caught or returned the fol-lowing year to the hatcheries, divided by the num-ber of smolts released.
3 Data on the number of hatchery-reared precociousmales (jacks) that returned each year to publichatcheries on the Columbia River. A `hatchery jackindex' was calculated to remove any `biasing' in thenumber of jacks that returned owing to interannualdifferences in the number of smolts released. Theindex was calculated by dividing the number ofreturning jacks by the number of smolts released,and multiplying the result by a thousand.
In¯uence of coastal oceanography on coho survival
How ocean conditions might affect the ocean survivalof hatchery-reared salmon was investigated for several
Figure 4. An example of a mean weekly SST image withcloud contamination removed.
Ó 2000 Blackwell Science Ltd., Fish. Oceanogr., 9, 1±16.
4 J. Cole
different time periods, which fell into two categories.The ®rst category is from April to June of the ®sh's ®rstcalendar year in the ocean. This period was chosen ina `hypothesis-driven' manner, insofar as this is whenthe smolts enter the ocean, and is approximately thesame period for which a number of previous studieshave found relationships between the marine survivalof coho and upwelling activity (Scarnecchia, 1981;Zirges, 1981; Pearcy, 1992; Lawson, 1997).
The second category was designed to determinewhether or not conditions later in the marine phase,when the juvenile coho are maturing, can also in¯u-ence survival. There has been little work exploringhow conditions later in the marine phase can in¯u-ence survival, and so the time periods in this categorywere chosen in more of a `data-driven' manner. Sevendifferent periods are used in the analyses presentedhere. Each had June of the second calendar year in theocean as the ®nal month, with October, November,December (of the ®rst calendar year in the ocean),January, February, March, April (of the second cal-endar year in the ocean) as the ®rst months, respect-ively. (Preliminary investigations indicated that seasurface temperature anomalies between July and Sep-tember during the ®sh's ®rst calendar year in the ocean
showed little correlation with overall survival. For thisreason these months were omitted from the analysisaltogether.)
Ocean conditions during these periods were repre-sented as proxies by the sum of positive and the sum ofnegative weekly anomalies (Fig. 5). The sum of neg-ative anomalies provides an index of the relativeintensity/duration of cool conditions relative to thenorm during a particular time period, whilst the sum ofpositive anomalies provides an analogous index forwarm conditions. For the April to June period,anomalies were summed across each 0.5° latitudinalarea from 42.5°N to 46°N (roughly Cape Blanco toWillapa Bay). This area approximately corresponds tothe area within which smolts released from theColumbia River were found during May and June 1982(Pearcy and Fisher, 1988). Towards the end of their®rst summer in the ocean, juvenile salmon have beenobserved to migrate north of the Columbia River intoWashington coastal waters (Miller et al., 1983; Pearcyand Fisher, 1988). For this reason the area wasextended further north (42.5±47.5°N) for the othertime periods. The sums of negative and positiveanomalies for the various periods are presented inTables 1 and 2, respectively.
Figure 5. Weekly SST anomalies, as calculated by subtracting a 12 year climatology from the weekly SST values.
Ó 2000 Blackwell Science Ltd., Fish. Oceanogr., 9, 1±16.
Temperature and coho survival 5

The nature and strength of the relationshipsbetween these indices of ocean conditions and themarine survival of hatchery-reared coho was assessedusing simple and nonlinear multiple regressionsbetween the `sum of anomalies' (independent vari-ables) and marine survival (dependent variable). Themultiple regressions were all bivariate with the sum ofnegative anomalies from April to June during the ®rstyear in the ocean being one independent variable, andthe sum of negative or positive anomalies fromanother period later in the life cycle being the other.(The results from the univariate analysis suggestedthat the summed negative anomalies from April toJune, and not the summed positive anomalies, wouldmake the most appropriate ®rst independent variable).
The multiple regressions were performed using thesame alternating conditional expectation (ACE)algorithm used by Cury and Roy (1989) to test their`optimal environmental window' hypothesis. Thealgorithm iteratively ®nds the `optimal transformation'of the input data so as to maximize the R2 value of amultiple regression (Breiman and Freidman, 1985). Inthe present study, with two independent variables, themultiple regression is of the following form,
Ts � Ta � Tb; �1�where Ts denotes the optimal transformation ofmarine survival (constrained to be a linear transfor-mation), Ta is the optimal transformation of the sumof negative anomalies from April to June, and Tb
Table 1. Sums of negative weekly SST anomalies for various periods, and the marine survival of each year class of hatchery-reared coho. The Aprt ± Junt values were summed between 42.5 and 46°N in Fig 5; 42.5±47.5°N was used for the other periods.
Year (t) ofsmolt entry
Aprt ±Junt
Octt ±Junt+1
Novt ±Junt+1
Dect ±Junt+1
Jant+1 ±Junt+1
Febt+1 ±Junt+1
Mart+1 ±Junt+1
Aprt+1 ±Junt+1 Survival
1985 )68.74 )213.9 )173.74 )114.59 )57.49 )47.74 )44.94 )30.43 0.07261986 )30.43 )104.92 )76.72 )72.13 )71.4 )67.48 )65.69 )40.19 0.02071987 )40.19 )112.89 )104.72 )101.82 )100.97 ) 96.94 )87.95 )50.23 0.04451988 )50.23 )232.75 )215.96 )214.92 )211.25 )176.38 )89.93 )18.73 0.0451989 )18.73 )148.35 )138.34 )134.31 )125.33 )108.23 )68.83 )33.9 0.01651990 )33.9 )221.83 )219.18 )219.18 )191.25 )139.66 )118.76 )68.2 0.04851991 )68.2 )60.18 )34.7 )13.12 )3.01 )0.79 )0.79 )0.46 0.01121992 )0.46 )60.21 )51.58 )51.06 )48.05 )31.82 )26.31 )11.61 0.00561993 )11.61 )62.74 )41.91 )20.84 )6.25 )5.93 )5.93 )3.54 0.00511994 )3.54 )94.25 )84.85 )64.27 )42.51 )36.58 )36.58 )21.61 0.00421995 )21.61 )14.54 )14.54 )12.16 )12.16 )12.16 )11.59 )5.05 0.00591996 )5.05 ± ± ± ± ± ± ± 0.0061
Table 2. Sums of positive weekly SST anomalies for various periods, and the marine survival of each year class of hatchery-reared coho. The Aprt ± Junt values were summed between 42.5 and 46°N in Fig 5; 42.5±47.5°N was used for the other periods.
Year (t) ofsmolt entry
Aprt ±Junt
Octt ±Junt+1
Novt ±Junt+1
Dect ±Junt+1
Jant+1 ±Junt+1
Febt+1 ±Junt+1
Mart+1 ±Junt+1
Aprt+1 ±Junt+1 Survival
1985 7.84 72.62 72.44 72.44 72.44 67.12 49.96 10.93 0.07261986 10.93 97.59 96.62 92.39 73.75 51.31 31.26 14.54 0.02071987 14.54 81.55 62.22 37.02 16.92 8.77 6.43 3.88 0.04451988 3.88 81.41 74.91 56.23 43.65 43.65 43.65 26.53 0.0451989 26.53 52.67 46.04 41.61 31.69 27.85 27.8 13.95 0.01651990 13.95 52.72 37.56 5.81 2.89 2.89 2.74 1.3 0.04851991 1.3 260.79 258.2 256.12 253.16 243.96 200.51 106.36 0.01121992 106.36 160.58 152.03 127.42 116.26 108.19 95.24 56.76 0.00561993 56.76 163.93 158.34 155.17 154.63 131.42 112.5 59.49 0.00511994 59.49 136.8 114.73 113.56 112 98.03 57.95 21.01 0.00421995 21.01 342.75 268.59 243.62 175.92 118.39 76.91 30.1 0.00591996 30.1 ± ± ± ± ± ± ± 0.0061
Ó 2000 Blackwell Science Ltd., Fish. Oceanogr., 9, 1±16.
6 J. Cole

represents the optimal transformation of the sum ofnegative or positive anomalies from later in the marinephase. The functional nature of the relationshipbetween the two independent variables and marinesurvival is deduced by plotting the transformed valuesof the variables against their original values.
An environmental model of marine survival
Lastly, a bivariate environmental model of marinesurvival was constructed according to the results fromone of the multiple regressions (which multipleregression, and how it was chosen is discussed in theresults section). This was done both `illustratively' andquantitatively: illustratively, by plotting the sum ofnegative anomalies from April to June against the sumof anomalies from the second time frame, and notingwhether separate areas in the plot correspond to dif-ferent levels of marine survival; and quantitatively, by®tting curves to the transformed values from the ACEalgorithm, and then using the equations for thesecurves to generate a formula relating the sum of SSTanomalies to marine survival. The model was thentested by plotting observed survival against the model-generated estimates of survival.
RESULTS
Summed anomalies have relatively consistent rela-tionships with the survival of hatchery-reared cohosalmon for each of the time periods investigated(Fig. 6). The form of the relationships is essentiallysimilar for all the plots. In each case, linear regressioncurves have been ®tted to the `survival vs. sum ofnegative anomalies', and power curves to the `survivalvs. sum of positive anomalies'. For the April to Juneperiod of the ®sh's ®rst year in the ocean (Fig. 6a), R2
values are presented for the all the years, and for when1991 is omitted. Omitting 1991 greatly increased theR2 values for both the sum of negative anomalies, andthe sum of positive anomalies.
Exclusion of the 1991 data points from the regres-sions in Fig. 6(a) is justi®ed by the rapid transition towarm El NinÄo conditions at the beginning of 1992(Fig. 5). During the 1983 El NinÄo, low food avail-ability was concluded to have greatly increased themortality of maturing and adult coho (Pearcy, 1992).It is thus possible that increased mortality of maturingand adult coho during the 1992 El NinÄo would haveoutweighed the bene®cial effects of cool conditionsduring the spring/summer of 1991 on juvenile survival.(The effects of ocean conditions on survival during1991/92 will be covered in greater detail in the dis-cussion.)
With 1991 excluded, the best univariate relation-ships between the summed anomalies (both positiveand negative) and marine survival are for April toJune, the period when the smolts enter the ocean. Forthe other periods, the strength of the relationshipstends to tail off as the starting month moves forward(i.e. from October, to November, to December, and soon). A possible statistical factor contributing to thistrend is that as the initial month moves ahead, thedegree of auto-correlation with the April to Juneperiod (i.e. Figure 6a) tails off. Conversely, a mechan-istic factor might be that the older and larger the ®shbecome (i.e. the longer they have spent in the marineenvironment), the less susceptible they are to envi-ronmental variability.
The bivariate nonlinear multiple regressions werebetter at accounting for all the data points, and noyears needed to be excluded from the analyses. The R2
values from the nonlinear multiple regressions arepresented in Table 3. Full regression statistics for whenthe sum of positive anomalies from January±June arethe second independent variable are presented inTable 4, and the transformed values of all the vari-ables for each multiple regression are shown inTables 5 and 6. (The sum of negative anomalies fromApril±June of the ®rst year in the ocean was always the®rst independent variable).
Table 3 contains two notable features. First, the R2
values are usually higher when the sum of positiveanomalies is used as the second independent variable,than when the sum of negative anomalies is used.Second, the four multiple regressions that used thesum of positive anomalies for the periods with January,February, March, and April (of the second calendaryear) as their respective initial months all had R2
values over 0.90.The degree by which the ACE algorithm improves
the R2 value of the multiple regressions, in comparisonwith standard linear multiple regressions, depends onthe degree of nonlinearity uncovered by the algorithm.As an example, however, when the sum of positiveanomalies from January to June is used as the secondindependent variable, a standard linear multipleregression yields an R2 of 0.83, while the ACE-trans-formed values (Table 5) yield an R2 of 0.92.
The sum of positive anomalies from January to Junewas chosen as the second independent variable forconstructing an `environmental model' of coho sur-vival. Although the multiple regressions which usedthe sum of positive anomalies from February to June,March to June and April to June (of the second cal-endar year in the ocean) had higher or equivalent R2
values, January to June was chosen for the following
Ó 2000 Blackwell Science Ltd., Fish. Oceanogr., 9, 1±16.
Temperature and coho survival 7

Figure 6. Survival of hatchery-reared coho (y-axis) vs the sum of positive and negative anomalies (x-axis) for a number ofdifferent time frames during their marine phase. Linear regression curves are ®tted to the sum of negative anomalies plots, andpower curves to the positive anomaly plots. For the April±June period of their ®rst year in the ocean (a), the 1991 data pointswere treated as outliers. R2 values for when the 1991 data points were included in the regression are shown in brackets forcomparison.
Ó 2000 Blackwell Science Ltd., Fish. Oceanogr., 9, 1±16.
8 J. Cole

two reasons. Firstly, a second-order polynomial curvegave a very close ®t to the January±June transformedvalues (Fig. 7), whereas the ®ts were less good for theFebruary±June and March±June periods owing to thetransformations having small sigmoidal `kinks' inthem. Secondly, as regards the April±June period,January±June was considered to be better because it islonger, and it includes the winter downwelling periodwhich previous research has indicated to be of someimportance in in¯uencing wild and hatchery-rearedcoho survival (Lawson, 1997).
The model is `illustratively' represented in Fig. 8.The general relationships between levels of marinesurvival and the summed anomalies are shown usingcontours generated from a second-order polynomialregression. The contours were generated for displaypurposes only and should not be confused with theregression analysis described above, nor with thegeneration of the quantitative model, as describedbelow. Nonetheless, comparison with the survival data(Fig. 3b and Table 1) con®rms that the contourscapture the main trends in survival, with only somesmall errors (e.g. 1988 falls on just the wrong side ofthe `0.05 survival contour').
Different regions in the plot clearly correspond todifferent levels of recruitment. As regards 1991, theimplication from Fig. 8 is that the `deleterious effect' ofvery warm conditions from January to June counter-acted the `bene®cial effect' of cool conditions duringthe previous spring. The transformed values from theACE multiple regression (Fig. 7) also indicate that coldconditions promote survival when the juvenile salmonenter the ocean, and that warm conditions betweenJanuary and June of the ®sh's second calendar year inthe ocean increases mortality. (Although not shown,the transformation plots for the other multiple regres-sions, which used the sum of positive anomalies for thesecond period, all looked similar to those in Fig. 7).
The equations for the curves ®tted in Fig. 7 wereused to generate the following `quantitative' environ-mental model of hatchery-reared coho survival:
Table 3. R2 values from the multiple regressions that usedeither the sum of positive anomalies, or the sum of negativeanomalies, from the following time intervals as the secondindependent variable. (t is the calendar year during whichthe smolts entered the ocean). The sum of negativeanomalies from April to June (of the ®rst calendar year inthe ocean) was always the ®rst independent variable. Seetext for more details.
2nd Time frame
R2 from sumof negativeanomalies
R2 from sumof positiveanomalies
Octt ± Junt+1 0.82 0.80Novt ± Junt+1 0.82 0.83Dect ± Junt+1 0.81 0.86Jant+1 ± Junt+1 0.78 0.92Febt+1 ± Junt+1 0.77 0.95Mart+1 ± Junt+1 0.80 0.93Aprt+1 ± Junt+1 0.83 0.92
Table 4. Multiple regression analysis of coho marine survi-val (dependent variable) versus the sum of April ± Junepositive anomalies and January ± June positive anomalies(independent variables) from 1985 to 1995. The transformedvalues illustrated in Fig. 8 were used in the analysis. Statis-tical signi®cance is represented by an asterisk (*).
Regression statistics
Multiple R 0.962R2 0.925Adjusted R2 0.906Standard error 0.321Observations 11
Analysis of variance d.f. SS MS F-value P
Regression 2 10.157 5.079 49.317 <0.0001*Residual 8 0.823 0.103Total 10 10.981
Coef®cient SE t-value P
Intercept 0.0386 0.098 0.399 1.000Sum of April ± June negative anomalies (transformed values) 1.0273 0.131 7.850 <0.0001*Sum of January ± June positive anomalies (transformed values) 1.0401 0.141 7.359 <0.0001*
Ó 2000 Blackwell Science Ltd., Fish. Oceanogr., 9, 1±16.
Temperature and coho survival 9

Table 5. Transformed values from the ACE non-linear bivariate multiple regressions which had the sum of negative anomalies from April to June as the ®rst independentvariable, and the sum of positive anomalies from a time period later in the marine phase as the second. In each case the transformed values for survival were exactly the same.See text for more details.
Year (t) ofsmolt entry
Coho-survival
Aprt ±Junt
Octt ±Junt+1
Aprt ±Junt
Novt ±Junt+1
Aprt ±Junt
Dect ±Junt+1
Aprt ±Junt
Jant+1 ±Junt+1
Aprt ±Junt
Febt+1 ±Junt+1
Aprt ±Junt
Mart+1 ±Junt+1
Aprt ±Junt
Aprt+1 ±Junt+1
1985 2.119 0.9 0.508 1.058 0.38 1.147 0.298 1.338 0.258 1.569 0.146 1.556 0.163 1.402 0.4551986 )0.213 0.003 0.235 )0.021 0.171 )0.05 0.171 )0.172 0.243 )0.293 0.263 )0.32 0.391 )0.278 0.2681987 0.857 0.269 0.421 0.282 0.45 0.274 0.561 0.194 0.691 0.124 0.831 0.096 0.83 0.093 0.8881988 0.879 0.506 0.397 0.568 0.343 0.591 0.404 0.596 0.467 0.627 0.353 0.605 0.215 0.558 )0.0181989 )0.402 )0.341 0.63 )0.396 0.63 )0.421 0.522 )0.496 0.57 )0.601 0.543 )0.606 0.443 )0.543 0.3111990 1.036 0.098 0.63 0.086 0.725 0.071 0.821 )0.026 0.806 )0.131 0.92 )0.151 0.897 )0.13 1.0471991 )0.64 0.889 )0.819 1.044 )1.04 1.131 )1.268 1.316 )1.654 1.541 )2.004 1.528 )1.87 1.377 )1.6451992 )0.891 )0.8 )0.298 )0.893 )0.249 )0.935 )0.083 )0.866 )0.107 )0.803 )0.192 )0.735 )0.373 )0.691 )0.6071993 )0.914 )0.532 )0.354 )0.602 )0.319 )0.629 )0.3 )0.656 )0.48 )0.707 )0.475 )0.687 )0.619 )0.62 )0.6641994 )0.954 )0.726 )0.136 )0.813 0.023 )0.851 0.022 )0.808 )0.06 )0.776 )0.087 )0.722 0.064 )0.671 0.0781995 )0.878 )0.266 )1.212 )0.313 )1.115 )0.328 )1.148 )0.42 )0.734 )0.549 )0.298 )0.565 )0.143 )0.496 )0.114
Table 6. Transformed values from the ACE non-linear bivariate multiple regressions which had the sum of negative anomalies from April to June as the ®rst independentvariable, and the sum of negative anomalies from a time period later in the marine phase as the second. In each case the transformed values for survival were exactly the same.See text for more details.
Year (t) ofsmolt entry Survival
Aprt ±Junt
Octt ±Junt+1
Aprt ±Junt
Novt ±Junt+1
Aprt ±Junt
Dect ±Junt+1
Aprt ±Junt
Jant+1 ±Junt+1
Aprt ±Junt
Febt+1 ±Junt+1
Aprt ±Junt
Mart+1 ±Junt+1
Aprt ±Junt
Aprt+1 ±Junt+1
1985 2.123 0.573 0.849 0.73 0.647 0.924 0.341 1.082 0.148 1.092 0.089 1.105 0.004 1.175 0.3091986 )0.218 0.028 )0.147 )0.001 )0.186 )0.033 0.023 )0.057 0.255 )0.097 0.262 )0.169 0.282 )0.177 0.4741987 0.856 0.189 )0.038 0.197 0.08 0.214 0.268 0.223 0.368 0.202 0.411 0.115 0.594 0.144 0.6661988 0.878 0.332 1.012 0.388 0.956 0.464 0.833 0.518 0.633 0.507 0.668 0.453 0.625 0.514 )0.0061989 )0.407 )0.205 0.296 )0.258 0.384 )0.325 0.448 )0.37 0.454 )0.399 0.466 )0.399 0.32 )0.439 0.3621990 1.036 0.093 0.917 0.075 0.979 0.062 0.854 0.052 0.591 0.023 0.56 )0.059 1.073 )0.036 1.0111991 )0.646 0.566 )0.586 0.72 )0.706 0.91 )0.85 1.065 )0.881 1.075 )0.866 1.086 )0.925 1.155 )1.0611992 )0.899 )0.567 )0.586 )0.65 )0.483 )0.763 )0.234 )0.864 0.001 )0.774 )0.156 )0.651 )0.34 )0.731 )0.3051993 )0.921 )0.345 )0.631 )0.41 )0.623 )0.499 )0.724 )0.564 )0.812 )0.564 )0.743 )0.51 )0.804 )0.556 )0.8411994 )0.962 )0.505 )0.241 )0.584 )0.109 )0.69 )0.093 )0.781 )0.072 )0.716 )0.098 )0.612 )0.161 )0.683 0.1251995 )0.84 )0.159 )0.844 )0.208 )0.939 )0.264 )0.865 )0.305 )0.685 )0.348 )0.594 )0.36 )0.671 )0.366 )0.733
Ó2
00
0B
lackw
ellS
cience
Ltd
.,F
ish.O
ceanogr.,
9,
1±16.
10
J.C
ole

s � 0:00000477815a2 ÿ 0:000401929a
ÿ 0:000000292171b2 ÿ 0:000142784b
� 0:0235464;
�2�
where s represents the estimated marine survival, a isthe sum of April±June negative anomalies, and b thesum of January±June positive anomalies. A plot ofestimated survival from the model vs. actual survival isshown in Fig. 9.
DISCUSSION
SST anomalies, oceanographic conditionsand coho survival
Coastal oceanographic conditions, as represented bysummed anomaly indices, can account for over 90% ofinterannual variation in the marine survival ofhatchery-reared coho salmon from 1985 to 1996(Table 3, Table 4, Fig. 8, Fig. 9). The general declinein the marine survival and productivity of cohosalmon since the mid 1980s is thus associated with ageneral warming trend (Fig. 5), and the increasedfrequency of El NinÄo conditions during the 1990s(Goddard and Graham, 1997; Mantua et al., 1997).
Figure 7. Optimal transformation plotsof (a) coho survival (constrained to belinear), (b) the sum of negative anom-alies from April to June (®rst year inocean), and (c) the sum of positiveanomalies from January to June (secondcalendar year in ocean). Linear andsecond order polynomial curves havebeen ®tted as appropriate. See text formore details.
Figure 8. The sum of negative anomalies from April to June(®rst year in ocean) plotted against the sum of positiveanomalies from January to August (second year in ocean).Contours corresponding to various levels of marine survivalwere estimated from a second-order polynomial of the fol-lowing form: z(x,y) � a + bx + cy + dx2 + exy.
Ó 2000 Blackwell Science Ltd., Fish. Oceanogr., 9, 1±16.
Temperature and coho survival 11

The negative relationships between SST andmarine survival, illustrated in Figs 6, 7 and 8, broadlycorrespond to the results from previous studies thathave looked at the relationship between coastal oceandynamics and coho salmon productivity. This is trueboth for spring/summer, when the smolts ®rst enter theocean (Gunsolus, 1978; Scarnecchia, 1981; Zirges,1981; Nickelson, 1986; Fisher and Pearcy, 1988), andfor periods later during the marine phase (Lawson,1997).
Lower SSTs during spring/summer primarily indi-cate increased coastal upwelling, and thus increasednutrient enrichment of the surface layers. The actualmechanisms whereby upwelling in¯uences the survivalof juvenile coho remain an area of debate. Foodavailability and the way in which upwelling activitymay affect the distribution of predators are both likelyto play some role. During periods, or years, where thereis reduced upwelling activity, not only is there likely tobe less food for the salmon when they enter the ocean,but there is likely to be relatively more predation (asdiscussed below). Furthermore, the deleterious effectof reduced upwelling on food availability may bereinforced because the ®sh need to eat more to com-pensate for increased metabolic costs during warmperiods (Brodeur et al., 1992).
There are two reasons why predation mightincrease when upwelling is sluggish. Firstly, less foodwill result in lower coho growth rates, which in turnmeans that it may take longer for juvenile coho tooutgrow the reach of their predators (predation±
growth hypothesis, Pearcy, 1992). Secondly, until thehatchery-reared salmon are released, their develop-ment is independent of local ocean conditions. Hence,in the absence of good upwelling-driven production ofalternative prey, predators might be expected to targetthe high concentrations of smolts as they enter theestuaries and ocean. Anecdotal support is offered bytwo sets of observations. First, newly released smoltsfrom private hatcheries were heavily preyed upon bydense aggregations of common murres during 1983, ayear when upwelling activity was particularly low(Bayer, 1986). Second, there is some evidence fromexperimental work that levels of inshore predation onjuvenile coho are much higher during summers withlow levels of upwelling than during cooler summerswith higher levels of upwelling (Pearcy, 1992).
The negative linear relationship between the sumof negative April±June SST anomalies and survival(Fig. 6a) does, however, differ from a recent studywhich found a dome-shaped `optimal environmentalwindow' relationship between June SSTs and thesurvivorship of hatchery-reared coho salmon fromsouthern Washington and the Columbia River (Ryd-ing, 1998). She found that survivorship was maximizedat intermediate SSTs, and that survivorship declinedas SSTs rose, or dropped away from, the optimummidpoint. At very low SSTs, when upwelling is par-ticularly strong, the suggestion is that high levels ofwind-driven turbulence would reduce food availabilityfor the juvenile coho by disrupting the small-scaleconcentrations of prey across convergent frontalfeatures and thermoclines.
There was no evidence of a dome-shaped rela-tionship in this study, even when anomalies weresummed for June only (not shown). The differentresults between the two studies may relate to the factthat this study covered the years from 1985 to 1996,whilst Ryding's (1998) covers 1972 to 1993. Prior to1985, coastal June SSTs off Washington were gener-ally much lower than after 1985. Between 1972 and1984 the maximum, minimum and mean SSTs forJune are 14.84°C, 11.84°C and 12.92°C, respectively.In contrast, the equivalent values for 1985±1993 are14.89°C, 12.84°C and 13.67°C (data from Ryding,1998). If a dome-shaped relationship does exist for theApril±June period used in this study, the implication isthat conditions between 1985 and 1996 were nevercool enough to resolve this. In other words, the rangeof spring/early summer SSTs between 1985 and 1996would have fallen on the right-hand side of any`dome'.
Interpreting lower SSTs is less straightforward fortime periods later in the marine phase. Between Janu-
Figure 9. Estimated survival from the model (eqn 2) vsactual survival of hatchery-reared coho from 1985 to 1995.
Ó 2000 Blackwell Science Ltd., Fish. Oceanogr., 9, 1±16.
12 J. Cole

ary and March, downwelling is common along thecoast in the OPI region, sea level heights are raised,and the northward geostrophic Davidson Current¯ows close to the coast. It is thought that cooler SSTsindicate an increased southerly ¯ow of zooplankton-rich Subarctic water into the California Current, andvice versa for warmer SSTs (for more details seeChelton et al., 1982; Fulton and Le Brasseur, 1985;Brodeur, 1997).
This cool zooplankton-rich sub-Arctic water mayreach the coastal OPI region via two routes. Firstly,onshore advection may occur during winter down-welling conditions when south-westerly winds arestrong; second, the Davidson Current may entrainSubarctic water from the California Current northalong the Oregon and Washington coasts during winter(Strub and James, in press). Either way, during winter,cooler SSTs are likely to indicate higher zooplanktonconcentrations and thus better feeding conditions forthe entire food web, including coho salmon. In contrast,warmer winter SSTs will indicate the reduced presenceof Subarctic water, and thus lower zooplanktonconcentrations and poorer feeding conditions.
With regards to the January±June period used fordeveloping the model (Figs 7, 8 and 9, eqn 2), it is notpossible to distinguish between the relative effects ofwinter conditions and spring/early summer conditionson the survival of the older ®sh. High positive SSTanomalies may represent reduced upwelling conditionsduring the second spring/early summer in the ocean,and/or the reduced onshore advection of zooplankton-rich Subarctic water during winter. Either way, posi-tive SST anomalies will indicate poor conditions forthe survival of maturing and adult coho.
The locations of maturing coho during winter andearly summer of their second calendar year in theocean remain largely unknown. Limited evidence fromtagging programmes suggests anywhere from Califor-nian to Alaskan waters, but there is no information asto what proportion remain close to their natal streamsvs. those that migrate larger distances (Laurie Weitk-amp, NMFS, Northwest Fisheries Science Center,Seattle, pers. comm.). There is some suggestion,however, that during EL NinÄo years the ®sh are furthernorth than usual (Pearcy, 1992).
The uncertainty surrounding coho distributionduring this part of their life cycle makes it dif®cult toknow the best places at which to measure the SSTanomalies. Nevertheless, from the results presentedhere (and what is known about the effects of 1982/83EL NinÄo), it appears that the ocean survival of thematuring ®sh is only seriously perturbed when theocean is unusually warm, such as during an El NinÄo
(Figs 6 and 8). Given that an El NinÄo has a strongsignal all along the west coast, the area from which theSSTs are measured for the `winter±second summer'time period may not be too important.
1991/92
Sea surface temperature anomalies from April to Juneduring the year of ocean entry generally correlate wellwith eventual survival (Fig. 6a), thus supporting thenotion that the ®rst few weeks in the ocean is usually,in terms of overall marine survival, the most criticalphase in the life cycle (Pearcy et al., 1985; Pearcy,1992). However, 1991 was clearly different. Theimplication from Fig. 8 is that the detrimental effectsof warm conditions on coho survival from January±June 1992, associated with the 1992 El NinÄo event,counteracted the bene®cial effects of cool upwellingconditions from April to June 1991.
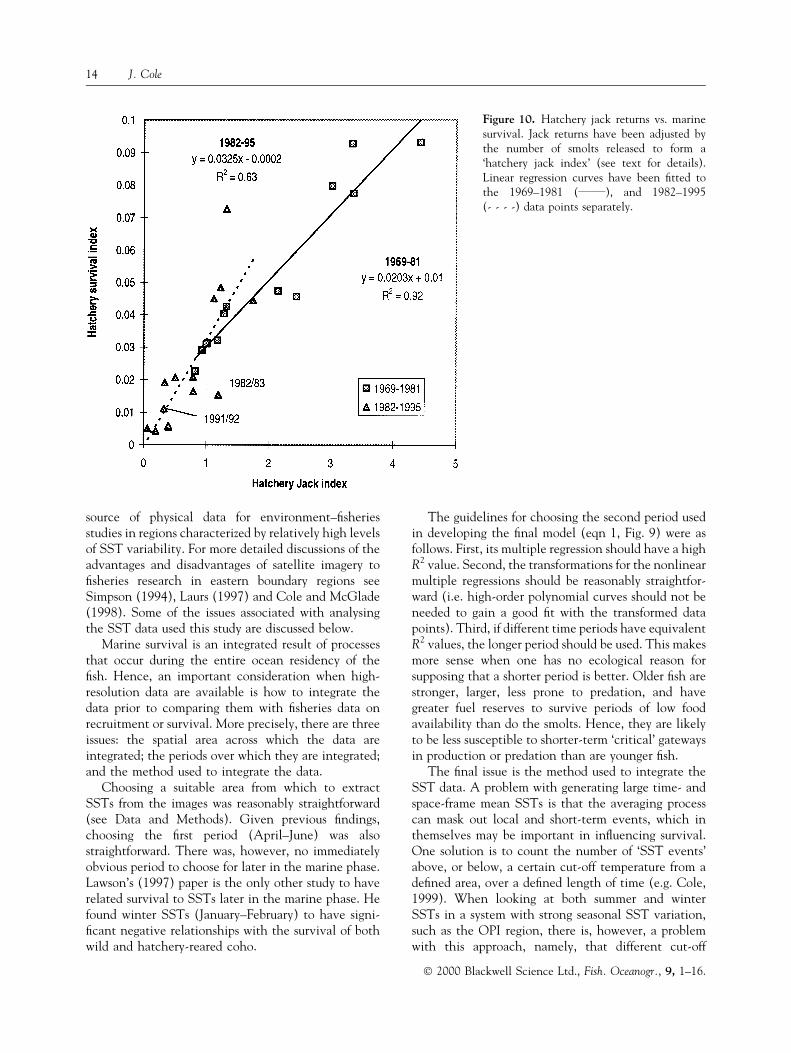
The 1983 El NinÄo is thought to have had the aboveeffect on the year class that entered the ocean during1982 (Pearcy, 1992). Unusually high mortality ofmaturing/adult coho during 1983 outweighed any goodjuvenile survival that may have occurred during thespring and summer of 1982 when upwelling was vig-orous (Fisher and Pearcy, 1988). The number of pre-cocious males (jacks) returning to fresh water during1982 vs. the number of nonprecocious adults thatreturned in 1983 is cited as evidence. In the past, thenumber of jacks that return during any year has usuallybeen a good predictor of the number of adults thatreturn the following year (Fig. 10). During 1983,however, fewer than half the number of adultsreturned than would have been expected based on jackreturns during 1982 (Pearcy, 1992) (see also Fig. 10).
Unfortunately, the generally weaker relationshipbetween jack returns and overall survival from 1982 to1995, and the fact that the 1991/92 data point is veryclose to the origin in Fig. 10, means that the number ofjack returns cannot be invoked to substantiate or dis-prove the theory of increased winter/early summermortality for the maturing year class during 1992. Pos-sible reasons for the weakening of this relationship from1982 include a shift in the timing of signi®cant mortalityevents to later in ocean residency (perhaps owing to anincrease in the frequency of El NinÄo events), and pop-ulation changes in the proportion of males that becomejacks (Weitkamp et al., 1997). Conversely, one mightsimply expect the data points to become relatively morescattered as one approaches the origin in Fig. 10.
Comments on the data analysis
The high R2 values in Fig. 9, and Tables 3 and 4 illus-trate how time series of SST images can be a valuable
Ó 2000 Blackwell Science Ltd., Fish. Oceanogr., 9, 1±16.
Temperature and coho survival 13
source of physical data for environment±®sheriesstudies in regions characterized by relatively high levelsof SST variability. For more detailed discussions of theadvantages and disadvantages of satellite imagery to®sheries research in eastern boundary regions seeSimpson (1994), Laurs (1997) and Cole and McGlade(1998). Some of the issues associated with analysingthe SST data used this study are discussed below.
Marine survival is an integrated result of processesthat occur during the entire ocean residency of the®sh. Hence, an important consideration when high-resolution data are available is how to integrate thedata prior to comparing them with ®sheries data onrecruitment or survival. More precisely, there are threeissues: the spatial area across which the data areintegrated; the periods over which they are integrated;and the method used to integrate the data.
Choosing a suitable area from which to extractSSTs from the images was reasonably straightforward(see Data and Methods). Given previous ®ndings,choosing the ®rst period (April±June) was alsostraightforward. There was, however, no immediatelyobvious period to choose for later in the marine phase.Lawson's (1997) paper is the only other study to haverelated survival to SSTs later in the marine phase. Hefound winter SSTs (January±February) to have signi-®cant negative relationships with the survival of bothwild and hatchery-reared coho.
The guidelines for choosing the second period usedin developing the ®nal model (eqn 1, Fig. 9) were asfollows. First, its multiple regression should have a highR2 value. Second, the transformations for the nonlinearmultiple regressions should be reasonably straightfor-ward (i.e. high-order polynomial curves should not beneeded to gain a good ®t with the transformed datapoints). Third, if different time periods have equivalentR2 values, the longer period should be used. This makesmore sense when one has no ecological reason forsupposing that a shorter period is better. Older ®sh arestronger, larger, less prone to predation, and havegreater fuel reserves to survive periods of low foodavailability than do the smolts. Hence, they are likelyto be less susceptible to shorter-term `critical' gatewaysin production or predation than are younger ®sh.
The ®nal issue is the method used to integrate theSST data. A problem with generating large time- andspace-frame mean SSTs is that the averaging processcan mask out local and short-term events, which inthemselves may be important in in¯uencing survival.One solution is to count the number of `SST events'above, or below, a certain cut-off temperature from ade®ned area, over a de®ned length of time (e.g. Cole,1999). When looking at both summer and winterSSTs in a system with strong seasonal SST variation,such as the OPI region, there is, however, a problemwith this approach, namely, that different cut-off
Figure 10. Hatchery jack returns vs. marinesurvival. Jack returns have been adjusted bythe number of smolts released to form a`hatchery jack index' (see text for details).Linear regression curves have been ®tted tothe 1969±1981 (______), and 1982±1995(- - - -) data points separately.
Ó 2000 Blackwell Science Ltd., Fish. Oceanogr., 9, 1±16.
14 J. Cole

temperatures would need to be de®ned for differenttimes of the year. Using the sums of the negative orthe positive SST anomalies not only bypasses thisproblem, but the `sums' have the further advantage ofintegrating both the occurrence and the magnitude of`warm' and `cold events'. The advantage of usingsummed anomalies, instead of mean SSTs, is illus-trated by the fact that the R2 value in Table 4 wouldhave been 0.83, as opposed to 0.92, had mean SSTsbeen used instead of the summed anomalies.
CONCLUSIONS
1 Coastal SST conditions, as measured by summedSST anomalies, from April to June in the year thesmolts enter the ocean, and from January to June ofthe following year, together account for over 90% ofthe interannual variation in hatchery-reared cohosalmon survival from 1985 to 1996. Cold upwellingconditions from April to June of the ®shes' ®rst yearin the ocean promote survival, whilst warm condi-tions from January to June of their second year aredetrimental to survival. The general decline in cohoproductivity and marine survival is thus stronglyassociated with the general warming trend in thecoastal ocean since the mid 1980s.
These relationships shed little direct light on theproximal factors causing mortality, but can be in-terpreted in terms of (1) the effects of spring/sum-mer coastal upwelling activity on food availabilityand predator distribution, and (2) a hypothesizednegative relationship between winter SSTs andzooplankton concentrations.
2 Satellite-derived time series of SST images providea good source of environmental data for investi-gating linkages between oceanography and theproductivity of coho salmon, and may be of use to®sheries management by enabling estimates ofmarine survival before the adult salmon startreturning to freshwater (e.g. see eqn 1 and Fig. 8).
3 Whether or not the relationships between coastalSSTs and the marine survival of hatchery-rearedcoho shown in Figs 5, 6, 7 and 8 hold true in thefuture needs to be assessed. Although the resultspresented here cover 11 years, there are two reasonsfor remaining cautious. First, even good relation-ships between oceanographic conditions and ®sh-eries data have a reputation for periodicallybreaking down. Second, the years covered by thisanalysis are after the late 1970s regime shift towarmer conditions in the eastern Paci®c (Mantuaet al., 1997; Schwing et al., 1998). The period from1985 to 1996 does not therefore represent the full
range of surface temperature and oceanographicconditions found in the OPI region since theexpansion of coho hatcheries in the 1960s.A recent investigation for a longer time series
(1982±1997), using the Reynolds SST data set as asubstitute for the `Path®nder' AVHRR data, illustratesthis need for caution (George Boehlert and LynndeWitt, Paci®c Fisheries Environmental Lab,NOAA-NMFS-SWFSC, pers. comm.). Summed SSTanomalies from the Reynolds data and coho survivalgenerally had very similar relationships to the resultsfrom this study, but there were some differences. Forexample, a model similar to the one illustrated in Fig. 9predicted very different survival for smolts that enteredthe ocean in 1984 from what was actually observed.The fact that the spatial resolutions of the Reynoldsand Path®nder SST data are different (1° ´ 1° vs.9 km ´ 9 km, respectively) means there is, perhaps,some question about generalizing the results from onedata set to another, given that the local upwelling SSTsignal is often found in a narrow band next to the coast.Nonetheless, this example does illustrate the dangers ofdrawing conclusions about the behaviour of ®sh pop-ulations prior to, and after, the period used for a cor-relation study with environmental parameters.
ACKNOWLEDGEMENTS
This work was conducted while the author held apostdoctoral research associateship from the NationalResearch Council funded by NOAA (NMFS andNESDIS). The following individuals are thanked fortheir assistance: Joe Fisher from Oregon State Uni-versity for the historical data on coho abundance andsurvival; Rod Kaiser and Curt Melcher from theOregon Department of Fish and Wildlife for the jackreturn data; Jorge Vazquez from the Jet PropulsionLaboratory for his help with the `Path®nder' AVHRRdata; and Frank Schwing, George Boehlert, RichardParrish and Ric Brodeur for variously drawing myattention to relevant literature, commenting on thedata analysis, and feedback on the manuscript; JamesSchumacher and R. C. Francis for their comments onthe manuscript; and Philippe Cury for donating a copyof the ACE algorithm.
REFERENCES
Bayer, R.D. (1986) Seabirds near an Oregon salmon hatchery in1982 and during the 1983 El NinÄo. Fishery Bull. (U.S.)84:279±286.
Breiman, L. and Freidman, J.H. (1985) Estimating optimaltransformations for multiple regression and correlation.J. Am. Stat. Assoc. 80:580±619.
Ó 2000 Blackwell Science Ltd., Fish. Oceanogr., 9, 1±16.
Temperature and coho survival 15

Brodeur, R.D. (1997) The importance of various spatial andtemporal scales in the interaction between juvenile salmonand the marine environment. In: Estuarine and Ocean Survivalof Northeastern Paci®c Salmon, a Workshop of the Workshop.R.L. Emmett and M.H. Schiewe (eds). US Dept Commerce,NOAA Tech. Memo. NMFS-NWFSC 29:197±212.
Brodeur, R.D., Francis, R.C. and Pearcy, W.G. (1992) Food con-sumption of juvenile coho (Oncorhynchus kisutch) and chinooksalmon (O. tshawytscha) on the continental shelf off Wash-ington and Oregon. Can. J. Fish. Aquat. Sci. 49:1670±1685.
Chelton, D.B., Bernal, P.A. and McGowan, J.A. (1982) Large-scale interannual physical and biological interaction in theCalifornia Current. J. Mar. Res. 40:1095±1125.
Cole, J. (1999) Environmental conditions, satellite imagery, andclupeoid recruitment in the northern Benguela upwellingregion. Fish. Oceanogr. 8:25±38.
Cole, J. and McGlade, J. (1998) Clupeoid population variability,the environment and satellite imagery in coastal upwellingsystems. Rev. Fish Biol. Fisheries 8:445±471.
Coronado, C. and Hilborn, R. (1998) Spatial and temporalfactors affecting survival in coho salmon (Oncorhynchuskisutch) in the Paci®c Northwest. Can. J. Fish. Aquat. Sci.55:2067±2077.
Cury, P. and Roy, C. (1989) Optimal environmental windowand pelagic ®sh recruitment success in upwelling areas. Can.J. Fish. Aquat. Sci. 46:670±680.
Fiedler, P.C. and Laurs, R.M. (1990) Variability of theColumbia River plume observed in visible and infra-redsatellite imagery. Int. J. Remote Sensing 11:999±1010.
Fisher, J.P. and Pearcy, W.G. (1988) Growth of juvenile cohosalmon (Oncorhynchus kisutch) in the ocean off Oregon,Washington, and Vancouver Island during the summers1982±85. Fishery Bull. (U.S.) 85:819±826.
Francis, R.C. and Hare, S.R. (1994) Decadal-scale regime shiftsin the large marine ecosystems of the North-east Paci®c:a case for historical science. Fish. Oceanogr. 3:279±291.
Fulton, J.D. and Le Brasseur, R.J. (1985) Interannual shifting ofthe Subarctic Boundary and some of the biotic effects onjuvenile salmonids. In: El NinÄo North: NinÄo Effects in theEastern Subarctic Paci®c. W.S. Wooster and D.L. Fluharty(eds). Seattle: Washington Sea Grant Program, pp. 237±247.
Gargett, A.E. (1997) The optimal stability `window': a mecha-nism underlying decadal ¯uctuations in North Paci®c salmonstocks? Fish. Oceanogr. 6:109±117.
Goddard, L. and Graham, N.E. (1997) El NinÄo in the 1990s.J. Geophys Res. 102:10 423±10 436.
Gunsolus, R.T. (1978) The status of Oregon coho and recom-mendations for managing the production, harvest andescapement of wild and hatchery-reared stocks. ProcessedReport, Oregon Department of Fish and Wildlife, 59 pp.Available from Oregon Dept Fish. Wildl., P.O. Box 59,Portland, OR 97207, USA.
Laurs, R.M. (1997) Overview of satellite remote sensing appli-cations in ®sheries research. In: Changing Oceans andChanging Fisheries: Environmental Data for Fisheries Researchand Management ± a Workshop, Paci®c Fisheries EnvironmentalGroup, Paci®c Grove, California. J.W. Boehlert and J.D.Schumacher (eds). US Dept Commerce, NOAA Tech.Memo. NMFS-SWFSC 239:9±16.
Lawson, P.W. (1997) Interannual variability in growth andsurvival of chinook and coho salmon. In: Estuarine and Ocean
Survival of Northeastern Paci®c Salmon, a Workshop. R.L.Emmett and M.H. Schiewe (eds). US Dept Commerce,NOAA Tech. Memo. NMFS-NWFSC 29:81±92.
Mantua, N.J., Hare, S.R., Zhang, Y., Wallace, J.M. and Francis,R.C. (1997) A Paci®c interdecadal climate oscillation withimpacts on salmon production. Bull. Am. Met. Soc.78:1069±1079.
Miller, D.R., Williams, J.G. and Sims, C.W. (1983) Distribu-tion, abundance and growth of juvenile salmonids off Ore-gon and Washington, summer 1980. Fish. Res. 2:1±17.
Nickelson, T.E. (1986) In¯uences of upwelling, ocean temper-ature, and smolt abundance on marine survival of coho(Oncorhynchus kisutch) salmon in the Oregon productionarea. Can. J. Fish. Aquat. Sci. 43:527±535.
Paci®c Fisheries Management Council (1998) Review of 1997Ocean Salmon Fisheries. Paci®c Fisheries ManagementCouncil, 2130 SW Fifth Avenue, Suite 224, Portland,Oregon 97201.
Pearcy, W.G. (1992) Ocean Ecology of North Paci®c Salmonids.Seattle: Washington Sea Grant Program.
Pearcy, W.G. and Fisher, J.P. (1988) Migrations of coho salmon,Oncorhynchus kisutch, during their ®rst year in the ocean.Fishery Bull. (U.S.) 86:173±195.
Pearcy, W.G., Fisher, J., Brodeur, R. and Johnson, S. (1985)Effects of the 1983 El NinÄo on coastal nekton off Oregon andWashington. In: El NinÄo North: NinÄo Effects in the EasternSubarctic Paci®c. W.S. Wooster and D.L. Fluharty (eds).Seattle: Washington Sea Grant Program, pp. 188±204.
Ryding, K.E. (1998) Analyzing adult returns to assess ocean effectsand salmon survival relationships. MSc thesis, University ofWashington, Seattle.
Scarnecchia, D.L. (1981) Effects of stream¯ow and upwelling onyield of wild coho salmon (Oncorhynchus kisutch) in Oregon.Can. J. Fish. Aquat. Sci. 38:471±475.
Schwing, F.B., Parrish, R. and Mendelssohn, R. (1998) Recenttrends in the spatial structure of wind forcing and SST in theCalifornia Current system. In: Global Versus Local Changes inUpwelling Systems. Proceedings of the First International CEOSWorkshop. M.H. Durand, R. Mendelssohn, P. Cury, C. Royand D. Pauly (eds). Paris: ORSTOM, pp. 101±126.
Simpson, J.J. (1994) Remote sensing in ®sheries: a tool for bettermanagement in the utilization of a renewable resource. Can.J. Fish. Aquat. Sci. 51:743±771.
Strub, P.T. and James, C. (2000) Altimeter-derived variabilityof surface velocities in the California Current System: 2.Seasonal circulation and eddy statistics. Deep-Sea Res.47:831±870.
Weitkamp, L.A., Wainwright, T.C., Bryant, G.J., Milner, G.B.,Teel, D.J., Kope, R.G. and Waples, R.S. (1995) Status Reviewof Coho Salmon from Washington, Oregon, and California. USDept Commerce, NOAA Tech. Memo. NMFS-NWFSC 24.
Weitkamp, L., Busby, P. and Neely, K. (1997) Geographicalvariation in life histories of salmonids. In: Estuarine andOcean Survival of Northeastern Paci®c Salmon, a Workshop.R.L. Emmett and M.H. Schiewe (eds). US Dept Commerce,NOAA Tech. Memo. NMFS-NWFSC 29:27±34.
Zirges, M.H. (1981) A hypothesis for coho salmon survivalmechanisms. In: Coho Salmon Management Plan. Portland,OR: Oregon Department of Fish and Wildlife. Availablefrom Oregon Dept Fish. Wildl., P.O. Box 59, Portland,OR 97207, USA.
Ó 2000 Blackwell Science Ltd., Fish. Oceanogr., 9, 1±16.
16 J. Cole