coastal water quality - northland regional council · coastal waters in northland are affected...
TRANSCRIPT

8 COASTAL WATER QUALITY
Summary
RPS Objectives
Northland Regional Council seeks to maintain and enhance coastal water quality in the region to ensure its long term suitability for a range of purposes.
• In estuaries and inner harbours this includes; aquatic ecosystems, contact recreation, aesthetic and cultural purposes.
• In other harbour areas and coastal beaches water should be suitable for the above purposes and also for gathering shellfish for human consumption.
• Open coastal water is to be maintained in its natural state.
In addition, the council seeks to reduce the quantity of contaminants entering coastal waters and minimise the impact of oil pollution.
Pressures • Sediment input from erosion caused by land use practices employed in forestry,
farming and other earthworks.
• Nutrient and bacteria input from farming, septic tanks and wastewater treatment system discharges.
• Metals and biocides input from boat maintenance and construction.
• Sewage from recreational vessels.
• Re-suspension of contaminants already in harbour sediments.
State • In open coastal sites water quality is usually very high and maintained in its
natural state.
• In harbour areas and coastal beaches, water is usually suitable for the purposes listed in the policy objectives. However, after heavy rain water quality is often not suitable for shellfish gathering or swimming due to bacterial levels. Sewage spills in the Whangarei Harbour and the Bay of Islands are causing concern for residents and marine farmers.
• In estuaries and inner harbours water quality depends largely on catchment land use and the tidal flushing characteristics of the inlet. In most cases water is suitable for swimming in fine weather but may not be after heavy rainfall.
Northland Regional Council 2007 State of the Environment Report 128

8 - Coastal Water Quality
Doing well • Overall microbiological water quality is good in Northland with 52 of 55 monitored
bathing sites passing the microbiological guideline (MFE 2003) on 90% or more of sampling occasions from 2002 to 2007.
• Water and sediment quality in Whangarei Harbour, particularly in the upper harbour has improved over the last 20 years.
Areas for improvement • Few of Northland’s many harbours are monitored on a regular basis and little is
known about nutrient concentrations in Northland harbours and the effects of land use on this.
Northland Regional Council 2007 State of the Environment Report 129

8 - Coastal Water Quality
8.1 Introduction
Coastal waters in Northland are affected primarily by contaminants sourced from land through river/stormwater runoff and to a lesser extent by direct discharges from industry and vessels. These contaminants are diluted and dispersed by mixing with ocean water and in some cases degrade or settle to the sea bed. The balance between sources and sinks for a site at any given time determines local water quality.
Northland’s coastline includes 14 major harbours, numerous other small estuaries and extensive sections of rocky and sandy open coast. On the open coast tidal mixing and flushing combined with low freshwater input generally ensure very high water quality. However, all of Northland’s major rivers discharge into harbours providing very high freshwater input in areas of limited mixing. These harbours are also often near towns and industry and consequently have lower water quality than open coastal sites.
Mangawhai harbour and spit.
Regional Policy Statement objectives
The Regional Policy Statement for Northland (NRC 2002) contains a number of objectives relating to coastal water quality. These seek to maintain and where possible improve coastal water quality in the Northland region, recognising the different levels of existing human impact in estuarine, harbour and open coastal areas.
The Regional Policy Statement (RPS) objectives are:
• The maintenance or enhancement of the water quality of coastal waters in Northland to be suitable, in the long term, and after reasonable mixing of any contaminant with the receiving environment and disregarding the effect of any natural events, for the purposes listed below: Estuaries and areas of inner harbours influenced by major river inflows –
aquatic ecosystems, contact recreation and aesthetic purposes, cultural purposes.
Other harbour areas and open coastal beaches and bays – as above, plus the gathering of shellfish for human consumption, cultural purposes.
Open coastal waters – its natural state, cultural purposes. • The reduction and minimisation of the quantities of contaminants which adversely
affect water quality entering coastal waters, in particular those that are potentially toxic, persistent or bio-accumulative.
• Avoid, remedy or mitigate the adverse effects of discharges of contaminants on the traditional, cultural and spiritual values of water held by tangata whenua.
Northland Regional Council 2007 State of the Environment Report 130

8 - Coastal Water Quality
• The efficient and effective control and minimisation of the impact of oil pollution in the Coastal Marine Area (CMA).
The NRC works towards these objectives by controlling activities which impact on water quality and by monitoring water quality to detect long-term trends.
Environmental results anticipated
The following is the anticipated environmental results after the implementation of the coastal water quality policies in the RPS:
• Water quality suitable for desired purposes. • Contaminants in water bodies reduced. • The adverse effects of contaminants in water bodies and coastal waters be
avoided, remedied or mitigated. • That all new discharges of organic contaminants be via the best practicable option
for treatment and disposal. • Improved aquatic habitat.
Northland Regional Council 2007 State of the Environment Report 131

8 - Coastal Water Quality
8.2 What are the pressures on coastal water quality?
Coastal water quality can be affected by contaminants including sediment, nutrients, bacteria and viruses, oils, metals and biocides. These contaminants can be derived from many sources including recreational and commercial fishing/boating, shipping, consented discharges, diffuse surface run off from agricultural land and earthworks and stormwater, sewage spills and rubbish dumping from developed areas.
These sources are summarised into the following main pressures on coastal water quality; environmental incidents, consented discharges, catchment land use, shipping and recreational boating.
Fishing vessel grounded on rocks in Mangonui Harbour, November 2003 (right).
Environmental incidents
Environmental incidents include any pollution or unauthorised activity that may have an adverse effect on the environment. Unauthorised discharges or activities (i.e. those not permitted by a rule in a Regional Plan or consent) can have a detrimental effect on the coastal environment, in particular coastal water quality. This includes incidents such as sewage spills, sewage discharges from vessels, ballast discharges from ships, sediment discharges from earthworks, unauthorised coastal structures.
Since the environmental hotline started in 1993 there has been over 160 coastal incidents reported to the council every year. The number of incidents peaked in 2000 and 2001 with 246 and 254 coastal incidents respectively, as shown in figure 1 (below).
Figure 1: Number of coastal incidents reported to the Regional Council from January 1994 to December 2006 and their impact on the environment.
Northland Regional Council 2007 State of the Environment Report 132

8 - Coastal Water Quality
Over the 13-year period from January 1994 to December 2006 there has been approximately 2500 coastal incidents reported to the council, of which only 16 were reported as having a large effect on the environment as shown in figure 1 (above). A further 220 incidents (8% of the total) were reported as having a significant effect on the environment.
Oil, diesel and other fuel spills are the most common type of coastal incident reported to the council since 1994 as shown in figure 2 (below). More recently the number of incidents relating to structures and other coastal activities has increased. However there has been a subsequent drop in the number of incidents recorded as miscellaneous (shown in the ‘other” category in figure 2). This is likely to be as a result of a change in recording from ‘miscellaneous’ to ‘other coastal activities’, which was added to the database system as an incident type in 2002.
Figure 2: Different types of coastal incidents reported to the Council between January 1994 and December 2006.
Incidents causing bacterial contamination include human sewage and farm dairy effluent spills. Microbial contaminants, such as viruses and pathogens derived from animal and human effluent, adversely affect the suitability of water bodies for recreational purposes, such as swimming and shellfish gathering, and commercial and cultural purposes.
Coastal discharge consents
There has been a steady increase in the number of coastal discharge consents from 1997 to 2007 as shown in figure 3 (below). Stormwater discharges are the most common. More recently there has been an increase in the number of ‘other’ discharge consents. The majority of these are for chemical use to remove algae from boat ramps within consent conditions.
Northland Regional Council 2007 State of the Environment Report 133

8 - Coastal Water Quality
Figure 3: Number of coastal discharge consents at 1 January of each year for 1997 to 2007.
Catchment land use
The coastal environment can be affected by land use on the surrounding coastline but also land use in inland areas through contributing river catchments and stormwater discharges. This can include contaminants such as sediment, nutrients and toxicants.
Sediment discharges from land-use activities, such as earthworks, have potential to cause:
• Sedimentation of estuaries and river systems. • Poor visual clarity of water bodies leading to reduced photosynthesis and changes
in predator-prey relationships. • Changes in sea-bed sediment composition. • Changes to habitat, flora and fauna.
Nutrient discharges from land-use activities, primarily nitrogen and phosphorous, have potential to cause nuisance growth of aquatic plants and algal blooms.
Toxicants, including metals, hydrocarbons, biocides and others, discharged from land and coastal-based activities have potential for environmental accumulation and toxic effects, with effect usually confined to near source.
Re-suspension and redistribution of sediment already in harbours through river and coastal processes (i.e. waves and currents) is also an ongoing problem.
Shipping
The majority of Northland’s commercial shipping activities are based at Port Whangarei, Marsden Point and the refinery facilities at Marsden Point. On average there are 200 oil tanker visits and 200 non-oil tanker ship visits to these two facilities. There are a further 110 visits per year made to the Portland cement out-loading facility and a largely transient
Northland Regional Council 2007 State of the Environment Report 134

8 - Coastal Water Quality
fishing fleet where numbers vary between 20 - 40 vessels operating from facilities in the upper Whangarei Harbour and in other Northland harbours. There are also 20 - 30 commercial cruise ships that visit the Bay of Islands each year.
The effect of commercial shipping on coastal water quality may include: • Contamination resulting from discharged ballast water and waste, and from anti-
fouling paint. • Contamination resulting from oil spills and other hazardous substance spills. • Introduction of unwanted marine organisms
Ship being loaded at Whangarei Port.
Recreational boating
The effect of recreational boating on the water quality of open coast waters is minimal due to the relatively small group of resource users, the dynamic mixing of the surface waters by waves and the transportation of coastal water by far-reaching coastal currents.
However, in semi-enclosed coastal waters the opposite applies. Semi-enclosed waters are often popular areas of concentrated boat use. These areas have small waves and limited mixing of surface waters, coupled with restricted circulation controlled by ebb and flood-dominated tidal currents that re-circulate water. In Northland there are many semi-enclosed areas that are popular for recreational boating. Most of these areas are located on the east coast and include the Bay of Islands and the many harbours and estuaries along the length of the coast. The popularity of boating in Northland is highlighted by the fact that there are about 2800 permanent moorings and nine marinas, with increasing demand for more mooring facilities. Most of these facilities are located in semi-enclosed locations.
Concentrated boat use in semi-enclosed waters can become an environmental pressure due to the restricted circulation of water and multiple effluent discharges. Pathogens (disease-causing bacteria and viruses) contained in the discharged effluent may affect other resource users, including the aquaculture industry, shellfish gatherers and swimmers.
Northland Regional Council 2007 State of the Environment Report 135

8 - Coastal Water Quality
8.3 What is the state of coastal water quality?
Water quality for recreational use
Surveillance water quality sampling and testing is undertaken by the NRC during summer to assess the suitability of marine waters for recreational bathing purposes.
Samples are analysed for levels of enterococci bacteria, which are the indicator most closely correlated with health effects in New Zealand marine waters. When enterococci bacteria exceed a level of 140 enterococci per 100 ml (‘alert mode’), the Microbiological Water Quality Guidelines (MFE 2003) recommends that sampling is increased and the source of contamination identified.
During the five summers between 2002/2003 and 2006/2007 surveillance water quality sampling was undertaken on a weekly basis at up to 57 sites. Most sampling sites are located within semi-enclosed coastal water bodies, such as estuaries and harbours, as water quality within these locations is more variable than open coast sites.
What is the quality of coastal waters for bathing purposes?
A total of 2564 water quality samples were collected during the five summers between 2002 and 2007 from up to 57 sites. Ninety-three percent of these samples were less than the ‘alert mode’ standard of 140 enterococci per 100 ml, indicating the water is likely to be safe for swimming. Ninety-six percent of water quality samples collected were less than the ‘action mode’ standard of 280 enterococci per 100 ml.
Water quality at virtually all semi-enclosed sites or sites adjacent to major river outflows is reduced to reasonably poor following heavy rainfall. Enterococci levels usually return to a level considered suitable for recreational bathing purposes after several days have elapsed following heavy rainfall.
In Whangarei District there are two sites with more than 20% of their samples above 140 enterococci per 100ml, at Ruakaka River and Church Bay; and two sites with 100% of their samples below 140 enterococci, Whananaki near the estuary mouth and Oakura Beach below the shops as shown in figure 4 (right).
Figure 4: Percentage of samples between 2002 and 2007 that are greater than 140 Enterococci per 100ml for sites in the Whangarei District.
Of the seven sites in the Kaipara District all comply with the guideline of 140 Enterococci per100ml on at least 80% of sampling occasions, as shown in figure 5 (below). However none of these sites had 100% of their samples comply with the guideline.
Northland Regional Council 2007 State of the Environment Report 136

8 - Coastal Water Quality
Figure 5: Percentage of samples between 2002 and 2007 that are greater than 140 enterococci per 100ml for sites in the Kaipara District
In Far North District there is only site with more than 20% of its samples above 140 enterococci per 100ml, which is Rawene, while five sites complied with the guideline of 140 enterococci on all sampling occasions, as shown in figure 6 (below). This was four sites in the Bay of Islands (English and Matauwhi Bays and two sites at Russell) and Cable Bay near Taipa.
Figure 6: Percentage of samples between 2002 and 2007 that are greater than 140 enterococci per 100ml for sites in the Far North.
Northland Regional Council 2007 State of the Environment Report 137

8 - Coastal Water Quality
Whangarei Harbour study
Water quality in Whangarei Harbour has been regularly monitored to identify trends in water quality. More recently the monitoring has been limited to sampling 20 sites as shown in figure 7 (below), on a monthly basis. The parameters tested include temperature, dissolved oxygen, bacterial levels, turbidity and water clarity.
The bacterial results from 2001 (when enterococci testing was introduced) onwards can be compared to the recreational bathing guideline of 140 enterococci per 100 ml even though this sampling is not part of the recreational bathing sampling programme. However caution should be taken as these samples are not collected using the recreational bathing sampling methods i.e. they are collected from a boat at depth all year round.
Figure 7: Whangarei Harbour study sampling sites.
In general, water quality is poor in the upper harbour near the Town Basin and improves as you move down the harbour as shown in table 1 and figure 8 (below). The upper harbour sites frequently exceed the 140 enterocooci per 100ml guideline, on anywhere between 20 to 35% of sampling occasions.
Sites from Waikaraka seaward meet the guideline on all sampling occasions, due to the large mixing volume of the lower harbour. The Onerahi foreshore, a popular swimming beach, meets the guideline on 98% of sampling occasions, this equates to only one exceedance in October 2003 at both sites 100200 and 100199.
Northland Regional Council 2007 State of the Environment Report 138

8 - Coastal Water Quality
Table 1: Percentage of samples in compliance with recreational bathing guideline of 140 enterococci per 100ml from September 2001 to November 2006. Note: Sites are in order from upper harbour to lower harbour. Site number Site description Percentage of samples < 140 ENT
100212 Hatea River above bridge 79.6
100211 Mid Town Basin 74.5
100210 Smiths boat yard 71.4
101309 Opposite Baxters 63.3
100209 Orams Marine 76.0
100208 United Carriers 70.0
100207 Limeburners Creek 70.2
100206 Fagans 77.6
100205 Cullhams 81.3
100204 Kissing Point 84.0
100203 Beacon 87.8
100202 Slipway 89.8
100201 Main Wharf 93.9
100200 Kaiwaka Point 98.0
100199 Onerahi Jetty 97.9
101082 Waikaraka 100.0
101077 Manganese Point 100.0
101075 One Tree Pt off lead light 100.0
100192 NZRC Jetty 100.0
100190 Mair Bank outer marker pile 100.0
This decreasing trend in bacterial levels as you move down the harbour corresponds to decreasing turbidity and increasing water clarity as shown in figure 9 (below).
These trends are most likely as a result of a combination of a greater proportion of freshwater influence and potential inputs from more concentrated boating activity (e.g. Town Basin marina) in the upper harbour and a lower dilution effect compared to the lower harbour.
Northland Regional Council 2007 State of the Environment Report 139

8 - Coastal Water Quality
Figure 8: Median Enterococci (n/100mL) levels in Whangarei Harbour for 2001 - 2006.
Figure 9: Median turbidity (ntu) levels in Whangarei Harbour for 2001 to 2006.
Northland Regional Council 2007 State of the Environment Report 140

8 - Coastal Water Quality
Trends in Whangarei Harbour water quality
There was a significant improvement in bacterial levels at several upper harbour sites in the area of Limeburners Creek between 1989 and 1990 linked to an upgrade in the Whangarei wastewater treatment plant (NRC 2002b). A formal trend analysis was carried out on temperature, dissolved oxygen and faecal coliform levels for eight sites in the upper Whangarei Harbour for data from 1986 to 2007. The results are presented in table 2 (below).
There was a decreasing trend in faecal coliform levels at all eight sites for this 20-year period but particularly for sites in the vicinity of Limeburners Creek (sites 100205, 100206 and 100207). There was an increasing trend in dissolved oxygen levels at all eight sites for this 20-year period. There was also an increasing trend in temperature at three sites, interestingly the same three sites that had the largest decreasing trend for faecal coliforms.
Table 2: Significant trends (i.e. p ≤ 0.05) for eight Whangarei Harbour sites from 1986 to 2007 with the slope of the trend (i.e. change per year) and the number of samples in brackets. Note: NS = No significant trend Site number
Description Temperature °C/year (n)
Dissolved oxygen mgL-1/year (n)
Faecal coliforms MPN100mL-1/year (n)
100205 Culhams 0.04 (290) 0.06 (289) -37 (383)
100206 Fagans 0.02 (285) 0.06 (286) -71 (381)
100207 Limeburners Crk 0.04 (347) 0.1 (347) -100 (469)
100208 United Carriers NS 0.04 (290) -15 (392)
100209 Orams NS 0.07 (288) -8 (350)
100210 Smiths NS 0.06 (304) -11 (366)
100211 Town Basin NS 0.1 (293) -5 (358)
100212 Hatea River NS 0.1 (291) -7 (355)
To check that the decreasing trend in faecal coliforms for this 20-year period was not due to the significant change after the upgrade in 1989, further trend analysis was carried out on subsets of the data. Trend analysis was carried out on faecal coliform data from 1986 to 1991 and from 2000 to 2007. The results are shown in table 3 (below).
These results show the large improvement in faecal coliforms levels at the three sites near Limeburners Creek in the six-year period, 1986 to 1991, during which the treatment plant upgrade was carried out. However this is not the case when we look at the last six years of data, which shows there are no significant trends.
Northland Regional Council 2007 State of the Environment Report 141

8 - Coastal Water Quality
Table 3: Significant trends (i.e. p ≤ 0.05) for faecal coliform levels (MPN100mL-1/year) for eight Whangarei Harbour sites with the slope (i.e. change per year) and the number of samples in brackets. Note: NS = No significant trend Site number Description Jan 1986 – Dec 1991 Jan 2000 – Apr 2007
100205 Culhams -335 (150) NS
100206 Fagans -561 (151) NS
100207 Limeburners Creek -3811 (151) NS
100208 United Carriers NS NS
100209 Orams NS NS
100210 Smiths NS NS
100211 Town Basin NS NS
100212 Hatea River NS NS
Median faecal coliform levels for the last five years for Whangarei Harbour are shown in figure 10 (below). The high results in the upper harbour can partly be contributed to discharges and sewage spills from the Whangarei wastewater treatment plant and reticulation system. Other potential sources include illegal discharges from boats and freshwater catchment inputs such as leaking septic tanks or run off from small areas of low intensity agricultural farming and feral animals in areas of native and exotic forest.
Since 1 January 2002 there have been 43 sewage spill incidents in the Whangarei Harbour and its contributing streams reported to the regional council, which includes spills from the Whangarei wastewater treatment plant as well as other minor spills from onsite systems.
Figure 10: Median faecal coliform levels (MPN/100mL) in Whangarei Harbour for 2001 to 2006.
Northland Regional Council 2007 State of the Environment Report 142

8 - Coastal Water Quality
The Okara Park pump station, located on Port Road, is the largest pump station in the Whangarei sewer system. Raw sewage from Whangarei City and outlying suburbs (excluding Onerahi) flows to the Okara Park pump station from where it is pumped to the Whangarei Wastewater Treatment Plant on Kioreroa Road. The Okara Park pumps have the ability to pump up to 800 litres of sewage per second. If the sewage flow exceeds this rate, which can occur during extreme wet weather events, the excess is discharged into the Hatea River, at a location adjacent to the Okara Park stadium. This overflow during storm events is a consented activity.
A common problem with reticulated sewer systems is the effects of stormwater, which can enter sewer pipes either directly via inflow, such as from illegal gutter connections, or indirectly via infiltration such as pipeline fractures. The volume of sewage combined with stormwater can exceed the capacity of the sewer system, resulting in overflows. A particular site of concern in central Whangarei is Butter Factory Lane, where the back up of sewage and stormwater during extremely wet weather can cause local sewers to overflow affecting shop owners and other people in the central business district.
Whangarei District Council has started an upgrade of the Whangarei Wastewater Treatment System. Recently the second stage of the high flow bypass (i.e. during heavy rain) has been diverted to discharge the secondary treated sewage to the wetland on Kioreroa Road, rather then directly to Limeburners Creek. The next step is adding ultraviolet treatment to this bypass discharge before it is discharged to the wetland. The Whangarei District Council is also currently investigating options to reduce the occurrence of overflows in the reticulation system and determining whether there is a cost-effective solution.
Water quality for shellfish gathering
Sampling to assess the suitability of microbial water quality for recreational shellfish gathering is undertaken by the NRC at a number of popular recreational shellfish gathering sites during summer. This programme involves testing the water at popular shellfish gathering sites for concentrations of faecal coliform bacteria. Up to 17 sites have been sampled on a weekly basis for four summers from 2003/04 to 2006/07.
The guideline for recreational shellfish gathering water quality is a median faecal coliform count not exceeding 14 MPN per 100 ml over a shellfish-gathering season and not more than 10% of samples exceeding 43 MPN per 100 ml (MFE 2003). Non-compliance with either of these parameters indicates that the waters are not suitable for the purpose of recreational shellfish gathering.
What is the quality of coastal waters for recreational shellfish gathering?
The compilation of all results for the four summers from 2003/2004 to 2006/2007 indicated that the water quality of most areas sampled were unlikely to comply, or may not comply, with the water quality guideline for recreational shellfish gathering. A total of 605 water quality samples were collected during these four summers from up to 17 sites. Twenty-three percent of these samples exceeded a faecal coliform count of 43 per 100ml.
Of the 17 sites, 14 had more than 10% of samples that exceeded a faecal coliform count of 43 per 100ml as shown in figure 11 (below) and three sites exceeded the median faecal coliform limit of 14 per 100 ml, as shown in figure 12 (below). These results indicate that three of the 17 sites sampled were compliant with the water quality guideline for recreational shellfish gathering. These were sites at Cable Bay, Ruakaka and Paihia.
Northland Regional Council 2007 State of the Environment Report 143

8 - Coastal Water Quality
Figure 11: Percentage of samples for the last four summers less then the 43 faecal coliforms/100ml guideline (left). Figure 12: Median faecal coliform for the last four summers less then the guideline of a median faecal coliform of 14 MPN/100ml (right).
The majority of sites are within semi-enclosed coastal water bodies, such as harbours and estuaries, and these results are influenced by runoff following rainfall. These results are indicative only, as they were not collected over an entire shellfish-gathering season (which in Northland is considered year round) and are a composite of samples collected over several summer sampling periods. Nevertheless, these data provide a reasonable snapshot of the suitability of water-quality for recreational shellfish gathering purposes in the areas assessed.
Viruses in shellfish
Shellfish from the Bay of Islands and Whangaroa Harbour were studied between January 2004 to February 2006 to determine whether the shellfish were contaminated with human enteric viruses from sewage (Greening and Lewis 2007).
The study showed that shellfish beds were frequently contaminated with human viruses over the two-year period, particularly in the Bay of Islands. At two traditional shellfish- gathering areas in the Bay of Islands, human enteric viruses were detected in 19 of 49 shellfish samples. This is of concern as shellfish are a significant source of food for the local community. Further investigation and routine sampling will be established at selected sites in the future. Overall there was little virus contamination detected in oysters from the Whangaroa Harbour.
For more information refer to the detailed report available on the Institute of Environmental Science and Research’s website at the following link:
http://www.esr.cri.nz/competencies/foodsafety/SafeguardingHealthandAccessforNZfoods.htm
Northland Regional Council 2007 State of the Environment Report 144

8 - Coastal Water Quality
Water and sediment quality for ecosystems
Far North harbour water and sediment quality
The main contaminant issues affecting Far North Harbour ecosystems are sedimentation and nutrient enrichment, primarily resulting from land use activities.
Ecosystems are changing in response to sediment and nutrient inputs, with increased sedimentation affecting a change to finer sediments enriched with nutrients. These effects are presently being witnessed, anecdotally, in many of these estuaries with increased areas of intertidal flats colonised by mangrove, fewer areas colonised by seagrass (due to higher turbidity) and less filter feeding infaunal invertebrates.
Reducing sediment, nutrient and microbial contamination will require significant changes in current land use practices and management, and is likely to require considerable time before positive changes can be realised.
Parengarenga Harbour.
Investigations were undertaken to assess sediment and nutrient levels in water and sediment of selected Far North Harbours in May to August 2004. Data from these investigations was compared with other estuarine systems and contaminant guideline values to assess the ‘health’ of the estuaries.
Harbour water quality
The nutrient and turbidity water quality results for harbour waters were compared to the Australian and New Zealand Environment and Conservation Council trigger values for south-east Australia (ANZECC 2000). These trigger values are considered the most suitable standard for comparison in the absence of a set of trigger values specific to New Zealand. Concentrations of nutrients above the trigger level values indicate the potential for adverse environmental effects as a result of nutrient enrichment.
Highest concentrations of suspended solids and highest turbidity were recorded for the West Coast estuaries. This is considered to be largely a function of the catchments of these particular estuaries and historic sediment loading following land clearance practises in the contributing catchments. These catchments all have substantial areas of deforested pastoral highlands with steep topographies. These areas are prone to erosion during high intensity rainfall events, which provide for high sediment-load transport from upper catchments to estuarine areas.
Northland Regional Council 2007 State of the Environment Report 145

8 - Coastal Water Quality
Table 4: Mean total phosphorus (TP), dissolved reactive phosphorus (DRP), ammoniacal nitrogen (NH4), nitrate, nitrite nitrogen (NNN), suspended solids (SS) and turbidity results in estuarine waters in 2004. Results in bold red italics exceed the ANZECC trigger value. Harbour TP
(g/m3) DRP
(g/m3) NH4
(g/m3) NNN
(g/m3) SS
(g/m3) Turbidity
(ntu)
Hokianga 0.064 0.013 0.042 0.092 15.8 10.8
Whangape 0.052 0.011 0.033 0.036 31.7 15.8
Herekino - 0.007 0.018 0.033 20.7 10.6
Parengarenga - North 0.018 0.009 0.038 0.026 6.7 1.5
Parengarenga - South 0.058 0.009 0.103 0.031 5.2 1.2
Houhora 0.029 0.013 0.043 0.039 6.1 1.6
Rangaunu 0.030 0.011 0.037 0.036 6.9 2.8
Taipa - 0.013 0.025 0.029 8.5 5.4
Mangonui - 0.010 0.018 0.047 6.8 3.2
Whangaroa - 0.010 0.024 0.035 7.6 3.4
Overall Mean 0.039 0.011 0.044 0.043 10.8 5.1
ANZECC Trigger Values 0.03 0.05 0.015 0.015 - 0.5 - 10
Coastal Plan Maximums - 0.01 0.005 0.06 - -
Concentrations of nutrients were elevated in all harbour water bodes in comparison to the ANZECC guidelines, particularly for ammoniacal nitrogen and nitrate-nitrite nitrogen. Elevated nitrogen concentrations are of concern, as nitrogen is typically the ‘limiting’ nutrient in marine ecosystems. Potential impacts that may occur include changes in community composition (i.e. increased growth rate and distribution of mangrove), particularly when combined with sedimentation, and increased risk of algal blooms. However, the ranges of concentrations encountered appear similar to other northern North Island harbours, and is indicative of developed catchments and land use activities.
Table 5: Northland total phosphorus (TP), dissolved reactive phosphorus (DRP), nitrate nitrite nitrogen (NNN) and ammoniacal nitrogen (NH4) results compared to other northern NZ examples. Parameter (g.m-3)
Northland range (mean)
Waitemata range (mean) (Lam 1979)
Tauranga/Ohiwa range (mean) (Park 1994)
TP 0.018 – 0.064 (0.039) N/A (0.022)
DRP 0.09 – 0.013 (0.011) 0 – 0.022 (0.01) 0.005 – 0.015 (0.005)
NNN 0.026 – 0.092 (0.043) 0.002 – 0.3 (0.1) 0.032 – 0.216 (0.115)
NH4 0.018 – 0.103 (0.044) 0.01 – 0.02 0.005 – 0.036 (0.021)
Harbour seabed sediment quality
High proportions of fine sediments, elevated nutrient levels and organic content in the Hokianga and Whangape estuaries, and to a lesser extent the Mangonui and Whangaroa estuaries, indicate a high level of sedimentation in these estuaries.
High sedimentation is likely to be a result of catchment modification and catchment land use, such as pastoral farming and forestry. The sedimentation of these estuaries, coupled with elevated nutrient concentrations, is likely to be having a significant effect on the composition of the estuarine flora and fauna. For example, anecdotal evidence points to an increase in the proportion of mangrove-colonised intertidal flats and a reduction in filter feeding infaunal invertebrates (such as pipi and cockle), as sediment composition
Northland Regional Council 2007 State of the Environment Report 146

8 - Coastal Water Quality
changes to a higher fines content.
Table 6: Estuarine mean seabed sample analysis results for Northland harbours in 2004. Mean %
of fine1 Mean ash (g/100g)2
Mean TP (mg/kg)
Norm TP
(mg/kg)3
Mean TN (mg/kg)
Norm TN (mg/kg)4
Hokianga 53.6 13.5 492.6 1870 1300 3160
Whangape 50.2 13.2 375.6 868 1500 3398
Herekino 9.7 4 216.0 2478 900 10048
Parengarenga Nth 16.2 2.4 108.5 887 5792 40620
Parengarenga Sth 5.7 1.1 66.2 895 650 1368
Houhora 5.5 1.5 84.3 1497 3533 57531
Rangaunu 11.6 4.0 204.9 2769 960 3478
Taipa 19.4 4.3 561.2 3325 600 3793
Mangonui 32.5 6.8 689.7 2483 1200 3648
Whangaroa 45.1 6.0 702.7 2005 1067 2659
Overall Mean 23.5 5.3 300.3 1790 2451 15018 1 Percentage of sediment < 63um fraction as an overall proportion of total sample dry weight. 2 Grams of ash per 100 grams of sediment dry weight. 3 Mean total phosphorous normalised to % of sediment < 63 um (mg/kg). 4 Mean total nitrogen normalised to % of sediment < 63 um (mg/kg).
Antifouling contaminant monitoring
There are approximately 2800 registered moorings and nine marina facilities in Northland’s coastal waters, mostly situated within sheltered east coast harbours and embayments.
High concentrations of moorings have the potential to cause contamination of water and sediments from the metals and booster biocides leached from antifouling paints, applied to the hulls of vessels.
A study was undertaken of mooring areas in Mangonui Harbour, Doves Bay, Opua and Parua Bay (Whangarei Harbour) in February 2006 to assess:
• Concentrations of the common antifouling paint biocides Diuron and Irgarol in seawater, in and adjacent to high-density mooring areas.
• Concentrations of copper, lead and zinc in the surface of seabed sediments and in the flesh of pacific rock oysters at sites in and adjacent to high-density mooring areas.
Concentrations of Irgarol in seawater were less than detection limits at all sites sampled, whilst Diuron was detected in seawater in low concentrations at two sampling sites. In all cases the concentrations recorded were less than the applicable guideline limits for the protection of marine organisms as shown in table 7 (below).
Northland Regional Council 2007 State of the Environment Report 147

8 - Coastal Water Quality
Table 7: Marine environmental protection guidelines for Irgarol and Diuron in seawater (adapted from Stewart (2003)), and results from NRC study in 2006. Guidelines Irgarol (ng/L) Diuron (ng/L)
NZ Environmental Exposure Limits 24 1800
Netherlands Max Permissible Concentrations 24 430
Range of concentrations in NRC study All samples < 5 < 20 – 30
Concentrations of copper, lead and zinc in sediments were recorded in concentrations below recommended guideline limits for the protection of the ecological health of sediments as shown in table 8 (below). Concentrations of copper and lead generally showed a pattern for highest concentrations in those sediments in the closest vicinity of the highest density of moorings.
Table 8: ANZECC (2000) sediment quality guidelines and summary of results from 2006 study. Copper
(mg/kg) Lead
(mg/kg) Zinc
(mg/kg)
Low effect guideline trigger value 65 50 200
High effect guideline trigger value 270 220 410
Range of concentrations in NRC study 2.2 – 31.0 2.5 – 19.3 16.6 – 93.1
Copper, lead and zinc in oyster flesh were recorded in concentrations similar to those recorded for other comparable moderately-disturbed northern New Zealand coastal ecosystems. Concentrations of copper in oyster flesh were typically greatest at those sites in closest vicinity of the highest density of moorings.
Table 9: Concentrations of metals in oyster flesh from 2006 study compared to other studies. Study Location Copper
(mg/kg) Zinc
(mg/kg) Lead
(mg/kg)
NRC study Various high density mooring areas, Northland
15.3 – 88.7 102 - 382 0.01 – 0.072
Tricklebank (2003)
Marsden Point, Northland 30.8 – 56.9 145 - 249 0.029 – 0.036
ARC (1992) Tamaki Estuary, Auckland 39 - 133 182 - 523 <0.54 – <1.01
ARC (2001) Manukau Harbour, Auckland 21 - 96 190 - 393 <0.59 - <0.74 Note: Results were converted from dry weight valves to wet weight values using a conversion ratio of 1:6.8 as per Chen and Chen (2002). The data in this table was taken from Tricklebank (2003).
Whangarei Harbour Sediment-Metal Monitoring
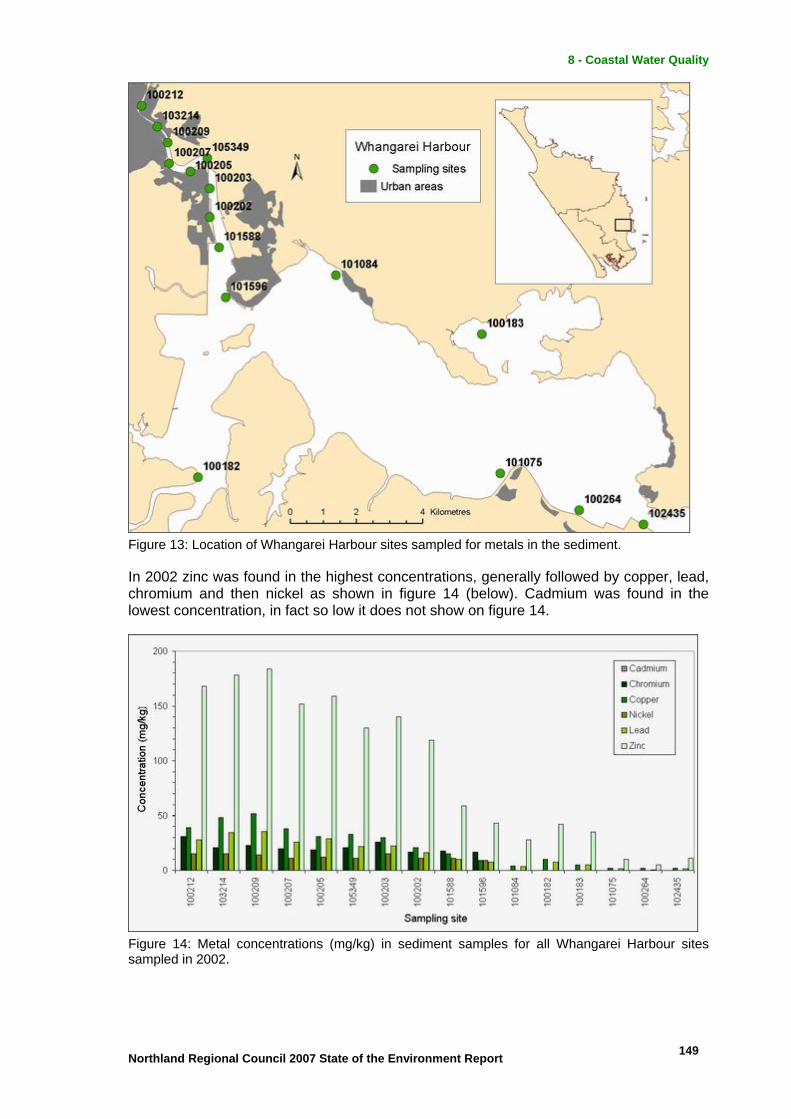
At low concentrations most metals are harmless; however, accumulation of metals in sediments can cause concentrations to reach toxic levels. Metal concentrations in seabed sediments of the Whangarei Harbour have been assessed on an irregular basis since 1985, with the most recent sampling taking place in 2002. Approximately 16 sites, as shown in figure 13 (below), are sampled each time for a range of metals including lead, zinc, copper, cadmium, chromium and nickel. The sampling is undertaken to assess spatial and temporal trends in metal concentrations and any possible toxicity issues.
Northland Regional Council 2007 State of the Environment Report 148
8 - Coastal Water Quality
Figure 13: Location of Whangarei Harbour sites sampled for metals in the sediment.
In 2002 zinc was found in the highest concentrations, generally followed by copper, lead, chromium and then nickel as shown in figure 14 (below). Cadmium was found in the lowest concentration, in fact so low it does not show on figure 14.
Figure 14: Metal concentrations (mg/kg) in sediment samples for all Whangarei Harbour sites sampled in 2002.
Northland Regional Council 2007 State of the Environment Report 149

8 - Coastal Water Quality
In 2002 the metal concentrations at all sites were below the ‘low effect level’ trigger value from the ANZECC guidelines for marine sediment, indicating a low probability for adverse effects on the ecosystem (ANZECC 2000).
A number of sites in the upper harbour area had concentrations of lead nearing the ANZECC ‘low effect level’ trigger value of 50 mg/kg as shown in figure 15 (below), while sites in the lower harbour had extremely low levels.
Figure 15: Lead (mg/kg) in sediment samples from the Whangarei Harbour in 2002.
Similarly to lead, several sites in the upper harbour had concentrations of zinc near the ANZECC low level trigger value of 200 mg/kg as shown in figure 16 (below), while lower harbour sites had very low concentrations.
Likewise copper concentrations neared the ANZECC low level trigger value of 65 mg/kg for several upper harbour sites in 2002 as shown in figure 17 (below). Nickel was also elevated at some upper harbour sites, nearing the ANZECC low level trigger value of 21 mg/kg. Both cadmium and chromium levels in 2002 were extremely low and were well below their respective ANZECC trigger values of 1.5 and 80 mg/kg at all sites.
Northland Regional Council 2007 State of the Environment Report 150

8 - Coastal Water Quality
Figure 16: Zinc (mg/kg) in sediment samples from the Whangarei Harbour in 2002.
Figure 17: Copper (mg/kg) in sediment samples from the Whangarei Harbour in 2002.
Northland Regional Council 2007 State of the Environment Report 151

8 - Coastal Water Quality
A trend was evident for a decreased concentration in metal levels with increased distance from the urbanised area of Whangarei City. This trend is most likely a result of:
• Sediment type tending to coarser in gradient down harbour. • Supply of metals decreasing in gradient down harbour. • Tidal flushing and tidal mixing increasing in gradient down harbour.
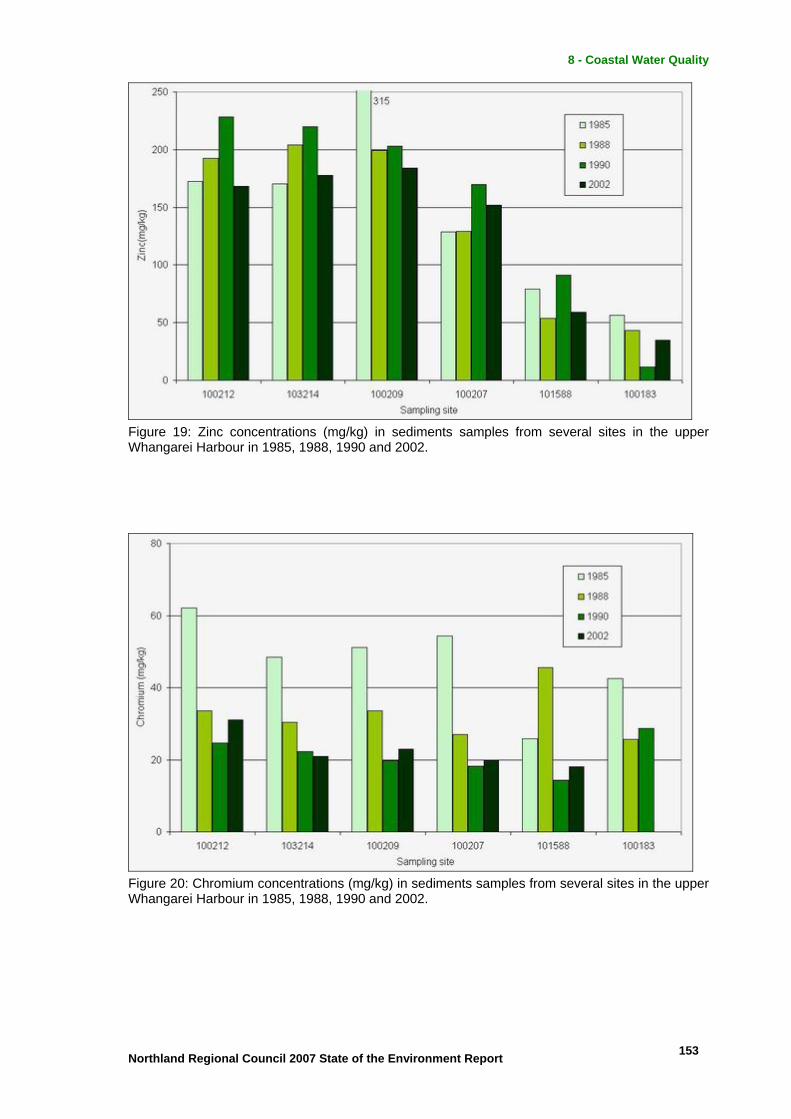
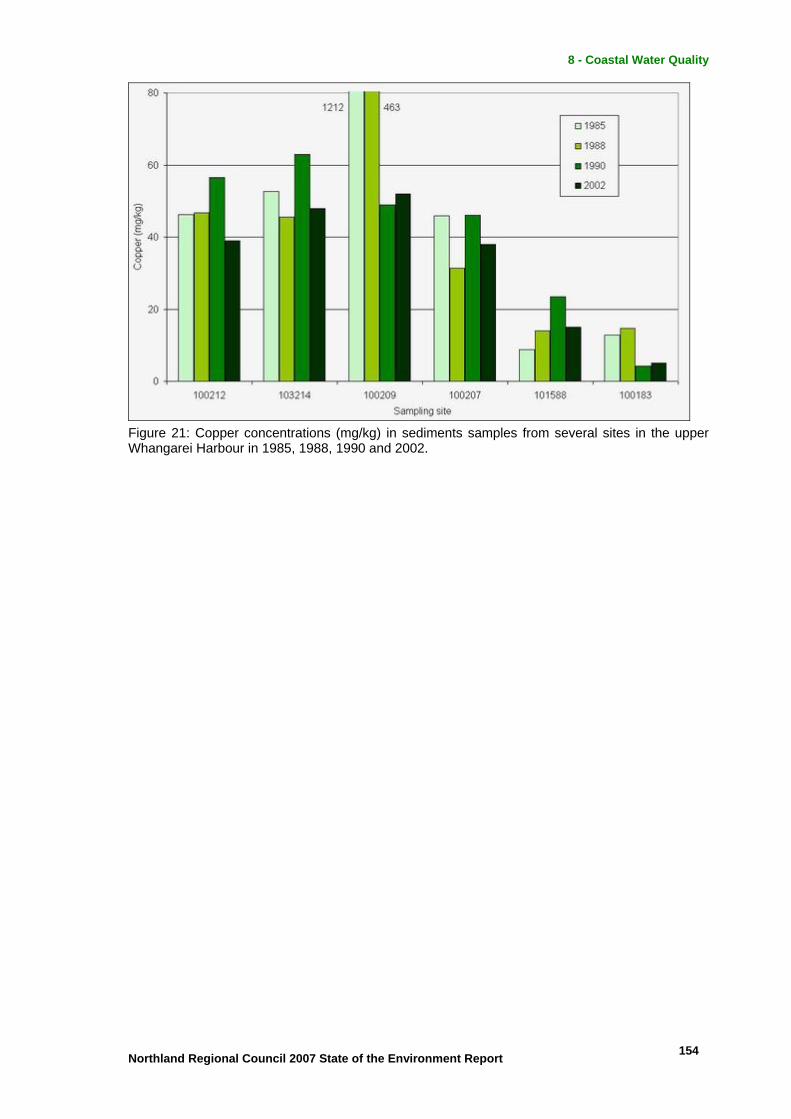
There was no strong indication of an overall increase in the concentration of metals in the sediments over time as shown in figures 18 to 21 (below). In fact, in some cases there appeared to have been a reduction in the concentration of some metals in the upper harbour sites between 1990 and 2002, particularly for zinc (figure 19) and copper (figure 21).
Lead is showing a slightly increasing trend at two sites (100212 and 103214) but has had a significant decrease at some of the other sites between 1990 and 2002 (figure 18). Although chromium has not decreased much between 1990 and 2002, since 1985 there has been an overall reduction in chromium concentrations in sediments from the upper Whangarei Harbour (figure 20).
Figure 18: Lead concentrations (mg/kg) in sediments samples from several sites in the upper Whangarei Harbour in 1985, 1988, 1990 and 2002.
Northland Regional Council 2007 State of the Environment Report 152
8 - Coastal Water Quality
Figure 19: Zinc concentrations (mg/kg) in sediments samples from several sites in the upper Whangarei Harbour in 1985, 1988, 1990 and 2002.
Figure 20: Chromium concentrations (mg/kg) in sediments samples from several sites in the upper Whangarei Harbour in 1985, 1988, 1990 and 2002.
Northland Regional Council 2007 State of the Environment Report 153
8 - Coastal Water Quality
Figure 21: Copper concentrations (mg/kg) in sediments samples from several sites in the upper Whangarei Harbour in 1985, 1988, 1990 and 2002.
Northland Regional Council 2007 State of the Environment Report 154

8 - Coastal Water Quality
8.4 What is being done?
Policy documents
The Regional Policy Statement for Northland (RPS) provides an overview of resource management issues in Northland, including those with regard to coastal water quality. It contains objectives, policies and methods to achieve the integrated management of Northland’s environment.
To achieve the objectives in the RPS the Council has developed a suite of policies and rules through its regional plans.
The Regional Coastal Plan for Northland (NRC 2004) includes rules that control the extent and type of discharges to the coastal marine area. These rules exist to help minimise the potentially adverse environmental affects of discharges on coastal water quality. This plan also sets out "Management Areas", in an effort to avoid conflict between uses in the coastal environment. The "Management Areas" of the coast are divided into six categories "protection, conservation, marine farming, moorings, port facilities and wharves", ensuring appropriate use of the coastal resource.
The Regional Water and Soil Plan for Northland (NRC 2007) and the Regional Air Quality Plan for Northland (NRC 2003) include rules that help minimise potentially adverse effects on coastal water quality resulting from cross boundary issues, such as subdivisions, earthworks and discharges to air in the vicinity of the coastal marine area.
Estuarine Monitoring Programme
The Northland Regional Council has commenced the implementation of the national Estuarine Monitoring Protocol (Robertson et al. 2002) programme (EMP) to assess estuarine habitat health and change over time. The EMP assesses changes in the fine-scale estuarine health and broad-scale estuary habitat composition over time. The fine-scale assessment involves routine sampling of a suite of characteristics relevant to estuarine condition, such as faunal and floral composition, nutrient and contaminant status and seabed sediment grain size characteristics. The broad-scale mapping of habitat characteristics is to determine the proportion of different habitat coverage within the estuary.
The main outcomes from the implementation of the EMP are:
• Baseline assessment of estuarine sediment and ecological health. • Baseline assessment of habitat composition of estuaries. • Continued assessment of changes in estuarine health, based on the above
factors. • Provision of quantitative data from which informed decisions can be made on the
management of estuarine areas and activities impacting on these systems.
The output from the Estuarine Monitoring Protocol includes a digitised habitat map such as the example for Ruakaka Estuary below (figure 22).
Northland Regional Council 2007 State of the Environment Report 155

8 - Coastal Water Quality
Figure 22: Digitised habitat map of Ruakaka Estuary showing results of broad-scale habitat mapping.
Aquaculture growing area water quality investigations
The Regional Council has recently appointed a new catchment management officer specifically to look at land use in catchments that may impact oyster growing areas. Their focus is mainly diffuse runoff from pastoral intensification, fine sediment loading and associated microbiological and nutrient inputs into wetlands, streams, rivers and harbours.
The impact of cattle on estuarine health is proving to be of particular concern in certain areas. Examples of these impacts include:
• Bank erosion and pugging of the intertidal coastal margins and wetlands. • Grazing of coastal vegetation, including complete exclusion of coastal rushes from
some areas. • Excrement from cattle, which affects water quality for downstream resource users
and shellfish gatherers.
Northland Regional Council 2007 State of the Environment Report 156

8 - Coastal Water Quality
Farm riparian management projects such as riparian fencing and planting, land retirement from stock grazing, controlled grazing and enhancing habitat have been targeted for support by the Regional Council through the Environment Fund. Fencing stock out of the CMA is a priority.
Future work will include catchment management plans for areas such as Te Puna Inlet and Whangaroa Harbour with the aim of identifying existing land use pressures such as septic tanks; resident and visiting boats; farm runoff; flooding; subdivision growth; other local concerns and suggesting ways of managing these catchments for the benefit of all stakeholders.
Marine sewage pollution
A number of measures have been undertaken to reduce incidences of marine sewage pollution. These include:
• Introduction of the Marine Pollution Regulations and rules in the RCP, making it illegal to discharge sewage to coastal waters from vessels in certain locations, including most harbours and estuaries and extension of no discharge boundaries beyond minimum requirements for these areas.
• Resource consent requirements for installation of sewage pump-out facilities for new marina developments, and supporting, through contributions, the installation of pump-out facilities at existing marina areas.
• Supporting and lobbying for the use of lock-off seals on vessels’ toilets or sewage discharge systems for ‘live-aboard’ vessels berthed in marinas.
• Summer marine pollution surveys and promotion of education materials at high-use maritime locations.
Stock exclusion from the Coastal Marine Area
The Northland Regional Council is actively promoting the exclusion of stock from the coastal marine area and riparian management through the Regional Coastal Plan for Northland. Access to and use of the coastal marine area by stock is set to become a prohibited activity by June 2009.
This rule is supported by the employment of a catchment management officer and the delegation of NRC Environment Funds specifically for the fencing of riparian margins in the CMA.
NRC Environment Fund
The NRC Environment Fund is used to assist with funding projects that are designed to restore and enhance the natural environment, including coast care initiatives, the fencing of coastal margins, biodiversity enhancement and others.
Marine oil spill response
Protection of our marine environment from pollution is a high priority for Northland. Marine oil spills – even very small – are likely to cause environmental damage, have impacts on amenity values and interfere with the use of the coastal environment.
Having the oil refinery located at Marsden Point and the oil tanker movements to and from that facility, together with the large volume of ships that travel to and from the main ports of Marsden Point, Auckland and Tauranga right on our doorstep, makes Northland the most at-risk region in New Zealand.
Northland Regional Council 2007 State of the Environment Report 157

8 - Coastal Water Quality
Under law we are required to maintain a capability of oil spill preparedness and response. The Marine Oil Spill Contingency Plan for Northland provides a guide to assist with responding to a spill at a regional level, using regional-based equipment and manpower. Its primary objectives are to prevent further pollution and to contain and clean up an oil spill in a manner that does not cause further damage to the marine environment. In the event of a major incident, the response may escalate to a national level response whereby equipment and manpower resources from around the country and perhaps overseas would be sourced.
We have an experienced and well trained team of people and a large quantity of oil spill cleanup equipment ready to respond to marine oil spills at any time. Regular regional and national exercises are held to make sure the response team continues to receive ongoing equipment familiarisation training. In May 2007 about 40 experts from around New Zealand joined the Northland oil spill response team in Whangarei to participate in “Exercise Manaia 07” which was run over two days.
Fortunately, there have been no significant oil spills in Northland in the past several years and the frequency of reported marine spills in general has continued to decrease. This is largely the result a number of initiatives including the implementation of environmental and industry standards, the production of “voluntary codes of practice” and the provision of information and educational material.
We will continue to develop and improve our preparedness and response capabilities in the event that we will need to respond to a spill, whatever the size.
Deploying the Ro-boom from the Waikare in an oil spill response exercise.
Northland Regional Council 2007 State of the Environment Report 158

8 - Coastal Water Quality
8.5 Where to from here?
The following are key areas to continue improving coastal water quality in Northland:
• Continue to build on the frequency and number of Northland’s estuarine and harbour sites that are regularly monitored.
• Continue to improve integrated management of the coastal environment between different agencies and focus on catchment management – improving water quality and addressing cumulative discharges in the entire catchment is likely to have the most benefit for coastal water quality. This includes developing better strategies for reducing adverse impacts of land use, particularly sediment and nutrient run-off.
• Continue developing and promoting best practice – particularly in relation to sewage disposal. This is supported by the current development of a sewage accord for Northland.
• Stock exclusion from the coastal marine area.
• Implement routine virus monitoring of shellfish at selected sites in Northland. At this stage monthly sampling at four sites in the Bay of Islands is being proposed.
Northland Regional Council 2007 State of the Environment Report 159

8 - Coastal Water Quality
8.6 What can you do to help?
There are several ways that you can help to maintain and improve coastal water quality in Northland.
• Report any coastal water pollution to the Regional Council environmental hotline on 0800 504 639, including fuel, oil and chemical spills.
• Keep stormwater drains for the rain. Do not tip any chemicals, detergents, paints, oils or fuels down stormwater drains, as these all empty to our rivers, harbours and beaches without any treatment.
If you are recreational or commercial boat user make sure that:
• You comply with the Marine Pollution Regulations at all times. It is illegal to discharge untreated sewage within harbours, inlets and estuaries in Northland. Information about these regulations including maps can be obtained from any Regional Council office or by phoning 0800 002 004.
• You do not cause a fuel or oil spill. Any spills of fuel or oil from your boat should be cleaned up with special sorbent material, which can be purchased from marine suppliers. Keep your bilge water clean. Clean up any fuel or oil floating on bilge water.
• Prevent spills when refuelling. Plug the scuppers with rags whenever possible and keep sorbent material handy to mop up spills. Whenever possible refuel at an approved area, using a fuel pump.
• You keep your boat bottom clean, to prevent the spread of marine pest plants and animals. Clean the hull regularly disposing of any debris safely to land and use antifouling paint appropriately. Ensure your hull is clean before moving to a new location in New Zealand.
• Likewise ship operators should ensure that their ship ballast water and hulls are clean to prevent the spread of unwanted organisms.
For more information refer to the ‘marine pollution regulations’ flyer available on the Regional Council website at the following link:
http://www.nrc.govt.nz/upload/2910/Marine%20Pollution%20Regulations.pdf
If you are farmer or landowner:
• Restrict stock access to waterways or the CMA including estuaries, beaches, rivers and lakes.
• If practical fence these areas off and establish riparian vegetation to reduce the amount of sediment, nutrients and bacteria entering our waterways and coastal environment.
For more information contact a Land Management Officer at the Regional Council on 0800 002 004 or refer to the ‘Keep Stock Out Of The Tide’ brochure on the Regional Council website at the following link:
http://www.nrc.govt.nz/upload/1781/Keep%20stock%20out%20of%20the%20tide%20(Jun%2006).pdf
Northland Regional Council 2007 State of the Environment Report 160

8 - Coastal Water Quality
8.7 Case study 1: Whangaroa Harbour Study
An investigation was established in the Whangaroa Harbour in 2003 to identify faecal contamination in the harbour and sources of this contamination. Historically the closure criteria for the operation of the marine farms was brought into question as a result of high results during normal sampling by Northland Health on behalf of the oyster farmers and the New Zealand Food Safety Authority. Frequent events of bacterial contamination were occurring when they were not expected, threatening the operating classification of the harbour for commercial growing of oysters.
In July 2003 a sampling programme was developed which included 12 sites around the harbour, five sites in the Kaeo River catchment and five sites at the mouth of other freshwater inputs to the harbour. These are marked with a circle in figure 23 (below). These 22 sites were sampled monthly for physio-chemical and microbiological parameters. The five sites within the Kaeo River catchment were sampled to establish a data profile up the catchment, to determine likely contamination sources.
Figure 23: Sampling sites included in the Whangaroa Harbour study.
Northland Regional Council 2007 State of the Environment Report 161

8 - Coastal Water Quality
In October 2005 this data was reviewed and it was found that microbiological water quality deteriorated as you moved down the Kaeo River catchment, as shown in figure 24 (below).
The worst site was below the Kaeo Wastewater treatment plant (site 100671) with a median E. coli level of 932/100ml as shown in table 10 (below). However microbiological water quality was also impacted above the Kaeo township. The most likely source is faecal contamination carried in surface runoff from agricultural farming and where stock have access to the river. Faecal contamination from septic tanks and feral animals is also a possibility.
Figure 24: Median E. coli (n/100mL) results at Whangaroa Harbour study sites. Note: Results also available in table 10 (below).
This highlighted that there are several sources of faecal contamination in the Kaeo River and that the cumulative effects of these different sources as you move down the catchment is leading to elevated bacterial levels entering the Whangaroa Harbour, particularly after heavy rain.
Meetings have been held with key stakeholders to follow up on the findings of this initial sampling, including Far North District Council, Northland Regional Council, Department of Conservation, landowners, Te Rununga O Whangaroa, Federated Farmers, Northland Health and stakeholders from the marine farming industry. Key areas identified as requiring action were the discharge consent for Kaeo’s treated wastewater, onsite disposal systems, land management of stock access to waterways and farm dairy effluent discharges, boat pump-out and dumping facilities, pest control and shellfish harvest management.
Northland Regional Council 2007 State of the Environment Report 162

8 - Coastal Water Quality
Table 10: Median E. coli (n/100mL), turbidity (ntu), proportion of freshwater (%) and number of samples for all sites in the Whangaroa Harbour study. Note: Median E. coli results also shown in figure 24 (above).
Site Description Median E. coli
Median turbidity
Median % freshwater
Sample number
100765 North of Whangaroa marina 10 3.4 2.0 42
100858 Middle of Waitapu Bay 10 4.0 1.7 42
100928 Midway of Touwai Bay 10 3.2 2.6 42
101620 North corner of marine farm 10 4.8 2.6 42
101701 South corner of marine farm 10 7.1 5.4 42
102231 Totara North jetty 10 4.7 2.9 39
101614 Near Waitaruke drain outflow 31 8.8 4.3 42
102234 Ferguson Point 31 9.8 3.4 42
104993 Middle of Lane Mill Bay 31 5.6 2.9 42
102232 West of Cape Horn 41 8.5 5.4 42
108605 Pupuke River at culvert beside road 68 4.2 99.9 16
102228 Entrance of Waihapa Bay 109 11.4 8.9 43
108689 Headwaters of Anaotehuruhuru Strm 115 7.4 99.9 8
101622 Whangaroa Rd culvert before turnoff 166 6.8 47.4 40
108960 Touwai Strm at Matangirau School Rd 199 4.1 99.9 8
108564 Unnamed trib near Campbell Rd 347 6.1 64.9 18
102224 Mangaiti Stream at Dip Rd 400 6.1 99.7 26
100047 Kaeo River at Green Lane 428 4.3 99.7 25
102237 Near Kaeo River mouth 434 11.3 82.0 26
108959 Headwaters of Te Ahu Stream 472 5.2 99.9 8
108958 Whakare Stream at Huia Road 477 7.5 99.9 8
108603 Pupuke River at Weber Rd footbridge 480 4.6 99.9 16
100431 Touwai Stream near stream mouth 547 4.8 80.0 43
108690 Headwaters of Whakare Stream 552 6.4 99.9 8
101608 Kaeo River at SH 10 bridge 559 8.4 96.0 26
108604 Pupuke River at Mangapa Rd bridge 562 3.4 99.9 16
102199 Touwai Stream at Wainui Rd bridge 594 4.5 98.6 8
100862 Waitapu creek below road bridge 598 7.8 50.3 43
102227 Pupuke River at SH 10 bridge 613 9.2 75.1 43
108565 Unnamed trib at Totara School Rd 635 9.1 20.0 18
101607 Kaeo River below fire station 679 5.3 99.7 26
100436 SH 10 Bridge at Weber Rd 695 10.8 40.3 43
108566 Unnamed trib at Gangway Rd 789 7.6 97.1 18
100671 D/strm of Kaeo Sewage discharge 932 7.7 99.7 25
108602 Unnamed trib at Weber Rd 1308 6.8 34.9 16
Following these findings, sampling on the Kaeo River ceased in October 2005 and sampling efforts were shifted to other contributing catchments of the Whangaroa
Northland Regional Council 2007 State of the Environment Report 163

8 - Coastal Water Quality
Harbour. This includes 33 sites on the Pupuke River, Touwai Stream, Waitapu Creek and small tributaries in the Totara North area, marked by a triangle in figure 23 (above). The initial results for these sites show there are some areas of concern in terms of faecal contamination. For example the unnamed tributary that flows into the upper Whangaroa Harbour by Weber Road (sites 108602 and 100436), Waitapu Creek (site 100862) and two unnamed tributaries in Totara North (sites 108566 and 108565).
An analysis was carried out to see if there was any relationship between turbidity or salinity and E. coli levels. No relationship was found between turbidity and E. coli as shown in figure 25 (below).
Figure 25: Median turbidity (ntu) against median E. coli (n/100ml) for all Whangaroa Harbour study sampling sites.
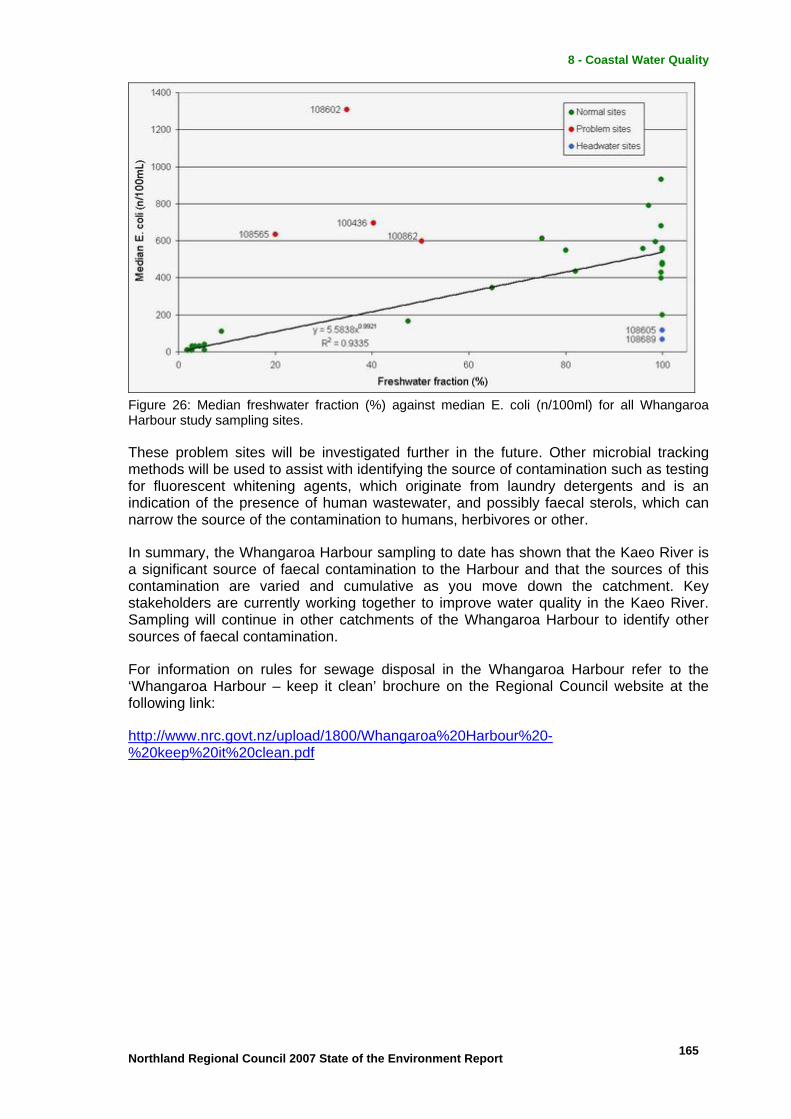
However, there appears to be a relationship between E. coli levels and the proportion of freshwater, as shown in figure 26 (below). The trend line in figure 26 has been fitted to the ‘normal sites’ dataset (shown in green) which has an equation of y=5.58x0.99 (R2=0.93). This shows that higher E. coli levels tend to be associated with freshwater sites, while lower E. coli levels with saline sites.
There are a few exceptions to this trend, which are shown in red and blue in figure 26. The two sites shown in blue (108605 and 108689) have reasonably low E. coli levels and are both headwater sites. Their surrounding and upstream land use is predominantly native shrub and low intensity farming and therefore there are limited sources for faecal contamination.
At the other end of the scale, the sites shown in red have relatively high E. coli levels considering the low proportion of freshwater at these sites. This includes the unnamed tributary that flows into the upper Whangaroa Harbour by Weber Road (sites 108602 and 100436), Waitapu Creek (site 100862) and an unnamed tributary in Totara North (site 108565).
Northland Regional Council 2007 State of the Environment Report 164
8 - Coastal Water Quality
Figure 26: Median freshwater fraction (%) against median E. coli (n/100ml) for all Whangaroa Harbour study sampling sites.
These problem sites will be investigated further in the future. Other microbial tracking methods will be used to assist with identifying the source of contamination such as testing for fluorescent whitening agents, which originate from laundry detergents and is an indication of the presence of human wastewater, and possibly faecal sterols, which can narrow the source of the contamination to humans, herbivores or other.
In summary, the Whangaroa Harbour sampling to date has shown that the Kaeo River is a significant source of faecal contamination to the Harbour and that the sources of this contamination are varied and cumulative as you move down the catchment. Key stakeholders are currently working together to improve water quality in the Kaeo River. Sampling will continue in other catchments of the Whangaroa Harbour to identify other sources of faecal contamination.
For information on rules for sewage disposal in the Whangaroa Harbour refer to the ‘Whangaroa Harbour – keep it clean’ brochure on the Regional Council website at the following link:
http://www.nrc.govt.nz/upload/1800/Whangaroa%20Harbour%20-%20keep%20it%20clean.pdf
Northland Regional Council 2007 State of the Environment Report 165

8 - Coastal Water Quality
8.8 References
ANZECC. (2000). Australian and New Zealand guidelines for fresh and marine water quality, Vol 1. The Guidelines. Prepared by Australian and New Zealand Environment and Conservation Council (ANZECC) and Agriculture and Resource Management Council of Australia and New Zealand. Available on the Ministry for the Environment website at the following link:
http://www.mfe.govt.nz/publications/water/anzecc-water-quality-guide-02/index.html
ARC. (1992). Tamaki estuary water quality survey 1988- 1991: annual report. Auckland Regional Council technical publication 12. Auckland.
ARC. (2001). Manukau Harbour shellfish quality survey 2000. Auckland Regional Council technical publication 105. Auckland.
Chen, C. and Chen. C. (2002). Investigation of Zn, Cu, Cd and Hg concentrations in the oyster of Chi-ku, Tai-shi and Tapeng Bay, Southwestern Taiwan. Journal of Food and Drug Analysis 11(1), 32 –38.
Greening, G. E. and Lewis, G.D. (2007). FRST Programme C03X0301 Safe guarding Environmental Health and Market Access for NZ foods Objective 2: Virus Prevalence in Shellfish. Report published by the Institute of Environmental Science and Research Ltd. Available on the Institute of Environmental Science and Research’s website at the following link:
http://www.esr.cri.nz/competencies/foodsafety/SafeguardingHealthandAccessforNZfoods.htm
Lam, C.W.Y. (1979).The assessment of eutrophication in estuaries: a review of New Zealand and overseas studies. Auckland Regional Water Board. 44p
MFE. (2003) Microbiological Water Quality Guidelines for Marine and Freshwater Recreational Areas. Ministry for the Environment, Wellington. Available on the Ministry for the Environment’s website at the following link:
http://www.mfe.govt.nz/publications/water/microbiological-quality-jun03/
NRC. (2002). Regional Policy Statement for Northland. Produced by the Northland Regional Council. Whangarei: New Zealand. Latest version available on the Regional Council’s website at the following link:
http://www.nrc.govt.nz/Resource-Library-Summary/Plans-and-Policies/Regional-Policy-Statement/Regional-Policy-Statement/
NRC. (2002b). State of the Environment Report. Published by Northland Regional Council. Whangarei: New Zealand. Available on the Regional Council’s website at the following link:
http://www.nrc.govt.nz/Resource-Library-Summary/Environmental-Monitoring/State-of-the-Environment-Monitoring/2002-State-of-the-Environment-Report/
NRC. (2003). Regional Air Quality Plan for Northland. Published by Northland Regional Council. Latest version and current plan changes are available on the Regional Council’s website at the following link:
http://www.nrc.govt.nz/Resource-Library-Summary/Plans-and-Policies/Regional-plans/Regional-Air-Quality-Plan/
Northland Regional Council 2007 State of the Environment Report 166

8 - Coastal Water Quality
NRC. (2004). Regional Coastal Plan for Northland. Produced by the Northland Regional Council. Latest version and current plan changes are available on the Regional Council’s website at the following link:
http://www.nrc.govt.nz/Resource-Library-Summary/Plans-and-Policies/Regional-plans/Regional-Coastal-Plan/
NRC. (2007). Regional Water and Soil Plan for Northland. Produced by the Northland Regional Council. Whangarei: New Zealand. Latest version and current plan changes are available on the Regional Council’s website at the following link:
http://www.nrc.govt.nz/Resource-Library-Summary/Plans-and-Policies/Regional-plans/Regional-Water-and-Soil-Plan/
Park, S. (1994). Environment B.O.P natural environment regional monitoring network - coastal and estuarine ecology programme. Report produced by Environment Bay of Plenty. 137p.
Robertson, B.M.; Gillespie, P.A.; Asher, R.A.; Frisk, S.; Keeley, N.B.; Hopkins, G.A.; Thompson, S.J.; Tuckey, B.J. (2002). Estuarine Environmental Assessment and Monitoring: A National Protocol. Part A. Development, Part B. Appendices, and Part C. Application. Prepared for supporting Councils and the Ministry for the Environment, Sustainable Management Fund Contract No. 5096. Part A. 93p. Part B. 159p. Part C. 40p plus fieldsheets.
Stewart, C. (2003). Antifouling Co-biocides in New Zealand Coastal Waters. Report prepared for Ministry for the Environment.
Tricklebank, K. (2003). Identification of contaminants and assessment of levels in the marine environment, adjacent to the Marsden Point deepwater port development, Whangarei Harbour. Auckland Uniservices Limited, University of Auckland, Auckland. Report prepared for Northland Regional Council.
Northland Regional Council 2007 State of the Environment Report 167