coating evaluation by electrochemical impedance
TRANSCRIPT
U.S. Department of the Interior Bureau of Reclamation Research and Development Office December 2015
Coating Evaluation by Electrochemical Impedance Spectroscopy (EIS) Research and Development Office Science and Technology Program Final Report ST-2016-7673-1


Mission Statements The U.S. Department of the Interior protects America’s natural resources and heritage, honors our cultures and tribal communities, and supplies the energy to power our future.
The mission of the Bureau of Reclamation is to manage, develop, and protect water and related resources in an environmentally and economically sound manner in the interest of the American public.


REPORT DOCUMENTATION PAGE Form Approved OMB No. 0704-0188
T1. REPORT DATE December 2015
T2. REPORT TYPE Research
T3. DATES COVERED
T4. TITLE AND SUBTITLE Coating Evaluation by Electrochemical Impedance Spectroscopy (EIS)
5a. CONTRACT NUMBER RY1541IR201327673
5b. GRANT NUMBER 5c. PROGRAM ELEMENT NUMBER
1541 (S&T) 6. AUTHOR(S)
Bobbi Jo Merten, [email protected], 303-445-2380 5d. PROJECT NUMBER
7673
5e. TASK NUMBER 5f. WORK UNIT NUMBER
86-68540 7. PERFORMING ORGANIZATION NAME(S) AND ADDRESS(ES)
Bobbi Jo Merten, Materials and Corrosion Laboratory U.S. Department of the Interior, Bureau of Reclamation, PO Box 25007, Denver CO 80225-0007
8. PERFORMING ORGANIZATIONREPORT NUMBER
MERL-2015-099
9. SPONSORING / MONITORING AGENCY NAME(S) AND ADDRESS(ES)Research and Development Office U.S. Department of the Interior, Bureau of Reclamation, PO Box 25007, Denver CO 80225-0007
10. SPONSOR/MONITOR’S ACRONYM(S)R&D: Research and Development Office BOR/USBR: Bureau of Reclamation DOI: Department of the Interior 11. SPONSOR/MONITOR’S REPORT NUMBER(S)
ST-2016-7673-1
12. DISTRIBUTION / AVAILABILITY STATEMENTFinal report can be downloaded from Reclamation’s website: https://www.usbr.gov/research/
13. SUPPLEMENTARY NOTES
14. ABSTRACT (Maximum 200 words)Commercial protective coatings used on Reclamation structures received nearly ten years of laboratory evaluation through thesophisticated technique of electrochemical impedance spectroscopy (EIS). The research project organized this data and performedcritical evaluations in search of electrical signatures for material degradation, i.e. loss of the coatings protective nature. The result isa quantitative field inspection method that augments our standard, visual inspection methods. The report details the conversion ofthe laboratory EIS technique into a ruggedized field inspection tool; the long-term laboratory studies provide benchmarking for evaluation of these field coating systems. The results include successful demonstrations and recommendations.
15. SUBJECT TERMSProtective Coatings, Impedance Spectroscopy, EIS, Coating Lifetime Prediction, Coating Field Inspection
16. SECURITY CLASSIFICATION OF: 17. LIMITATION OF ABSTRACT
U
18. NUMBER OF PAGES
Total #
19a. NAME OF RESPONSIBLE PERSON Merten
a. REPORTU
b. ABSTRACTU
c. THIS PAGEU
19b. TELEPHONE NUMBER 303-445-2125
S Standard Form 298 (Rev. 8/98) P Prescribed by ANSI Std. 239-18
58


Disclaimer Information in this report may not be used for advertising or promotional purposes. The enclosed data and findings should not be construed as an endorsement of any product or firm by the Bureau of Reclamation (Reclamation), U.S. Department of the Interior, or the Federal Government. The products evaluated in this report were evaluated for purposes specific to Reclamation’s mission. Reclamation gives no warranties or guarantees, expressed or implied, for the products evaluated in this report, including merchantability or fitness for a particular purpose.


Acknowledgements We thank the Bureau of Reclamation Research and Development Office’s Science and Technology Program for funding this research. In addition, many field and facility offices provided in-kind contributions, access, and support, for which we are very grateful. These include United States Army Corps of Engineers Ozark-Jetta Taylor and Wilbur D. Mills Lock and Dams, Denver Water Marston Dam, and Bureau of Reclamation Grand Coulee Powerplant, John Keys Pumping Plant, Little Oso Dam, Parker Powerplant, and Glen Canyon Powerplant.


Acronyms and Abbreviations AC alternating current CPC corrosion prevention and control DHS dilute Harrison solution ECM equivalent circuit model EIS electrochemical impedance spectroscopy FIST Facility Instructions, Standards, and Techniques O&M operations and maintenance NSF National Science Foundation MERL Materials Engineering and Research Laboratory RC resistor-capacitor Reclamation Bureau of Reclamation S&T Science and Technology Program SCE saturated calomel electrode UT ultrasonic testing USACE United States Army Corps of Engineers VOC volatile organic content vol % volume percent wt % weight percent Symbols Ccoat coating capacitance Cdl double layer capacitance cm2 centimeters square F Farads g/L grams per Liter Hz Hertz I current j square root of -1 Z impedance |Z| impedance magnitude mV millivolt NaCl sodium chloride (NH4)2SO4 ammonium sulfate R resistance Rcoat coating resistance Rct charge transfer resistance RS solution resistance V voltage yr year(s) Ω ohms


Executive Summary Coatings are the primary control against corrosion of Reclamation structures. The annual cost of corrosion prevention and control (CPC) systems for steel structures has greatly increased in recent decades. This research assesses electrochemical impedance spectroscopy (EIS) as an evaluation tool to maximize service life for protective coating investments on Bureau of Reclamation (Reclamation) structures, particularly those in the harshest and most inaccessible service environments. Commercial protective coatings used on Reclamation structures received nearly ten years of laboratory evaluation through the sophisticated technique of EIS. The research project organized this data and performed critical evaluations in search of electrical signatures for material degradation, i.e. loss of the coatings protective performance. The result is a quantitative field inspection method that augments our standard visual inspection methods. This report documents the conversion of the laboratory EIS technique into a ruggedized field inspection tool using the long-term laboratory studies for benchmarking during these field coating systems evaluations. The field EIS experiments resulted in successful demonstrations and iterative method improvements. Future work should continue the critical evaluation of the EIS data through methods such as equivalent circuit modeling. Advancement in the manufacturing of the portable potentiostats provides new opportunities to make EIS field measurements with greater versatility. These options should continue to be explored and incorporated into standard evaluations of coated infrastructure.


i
Contents
Page Introduction ......................................................................................................... 1 Conclusions ......................................................................................................... 2 Background ......................................................................................................... 3
EIS Testing .............................................................................................. 4 Research Objectives ................................................................................. 5
Literature Review ................................................................................................ 6 Coating Service Life Prediction ................................................................ 6 EIS Field Testing of Coatings .................................................................. 8
Experimental ..................................................................................................... 10 Coating Material Selection ..................................................................... 10 Laboratory Testing ................................................................................. 10 Field Method Development .................................................................... 12
Results and Discussion ...................................................................................... 13 Laboratory Testing ................................................................................. 13
Epoxy Coatings (Solvent Borne)................................................. 13 Epoxy Coatings (100% Solids) ................................................... 15 Polyurethane Coatings ................................................................ 15
Field EIS Test Demonstrations and Refinements .................................... 16 Outdoor EIS Testing – Proof of Concept .................................... 17 EIS Field Method Demonstrations .............................................. 19
Remaining Service Life Analysis ........................................................... 24 Practical Interpretations of EIS Field Results .............................. 25 Equivalent Circuit Modeling of EIS Data.................................... 26
References ......................................................................................................... 30
ii
Tables Page
Table 1. Example coating service life prediction literature and findings. .............. 7 Table 2. Example field EIS testing literature. ....................................................... 9 Table 3. Typical epoxy-based and polyurethane coatings for
immersion service ........................................................................... 10 Table 4. EIS field testing demonstrations. .......................................................... 16 Table 5. EIS field testing demonstrations. .......................................................... 21
Figures Page
Figure 1. Example weather methods: (left) USACE Paint Technology
Center atmospheric test rack and (right) Reclamation immersion tanks. ............................................................................... 5
Figure 2. EIS testing three-electrode cell set-up; the colored leads are the working (green), reference (white), and counter (red) electrodes. .............................................................................. 11
Figure 3. EIS test data for solvent borne epoxy coatings: a) Amerlock 2, b) Macropoxy 646, c) Bar-Rust 235, and d) N69. ............................ 14
Figure 4. EIS test data for 100% solids epoxy coatings: a) Plasite 4500 and b) Powercrete J. ........................................................................ 15
Figure 5. EIS test data for polyurethane coatings: a) Enduraflex 1988 and b) Uroflex 65. .......................................................................... 16
Figure 6. Outdoor EIS test on known coating without Faraday cage: a) test set-up and b) EIS test data. .................................................... 17
Figure 7. Outdoor EIS test for unknown coating on steel pipe: (a) 2eEIS test set-up and (b) 2eEIS versus 3eEIS data. .................... 18
Figure 8. EIS field demonstration at US Army Corps of Engineers' Ozark-Jeta Taylor Lock and Dam (a) test cell set-up and (b) test in progress. .......................................................................... 19
Figure 9. Comparison of EIS data for laboratory reference and field structure (left) and destructive evaluation revealed corrosion spots underneath coating (right) ....................................... 20
Figure 10. EIS field demonstration at Grand Coulee Dam, Cells 1 and 2 located near the scroll case mandoor (left) and triplicate Cells 3, 4, and 5 (right). .............................................. 21
Figure 11. EIS field test results in duplicate for (a) Cell 1 and (b) Cell 2. .......... 22 Figure 12. EIS field testing results for Cells 3, 4 and 5. ...................................... 22 Figure 13. EIS test set-up for two-electrode experiment. Three test
cells shown; Cell 1 is reference cell and Cell 2 is working cell in this example. ........................................................................ 24

iii
Figure 14. EIS field test results for coating with no visible defect (left); photograph Sample 1 (right) ............................................................ 25
Figure 15. EIS field test results for coating with one visible defect (left); photograph Sample 3 (right) ............................................................ 25
Figure 16. ECM with typical circuit elements for (a) 1 RC circuit and (b) 2 RC circuits in parallel. ............................................................ 26
Figure 17. ECM with 2 RC circuits and a Warburg element for corrosion reaction ............................................................................ 27
Figure 18. EIS data plots for Macropoxy 646 with raw data and ECM fitting. .................................................................................... 28
Figure 19. ECM with 2 RC circuits in series. .................................................... 28 Figure 20. ECM elements values (a) 1 RC and (b) 2RC in series
for Rcoat and Ccoat plotted versus time of exposure; low frequency |Z| also included ....................................................... 29


Coating Evaluation by Electrochemical Impedance Spectroscopy (EIS)
1
Introduction This research assesses electrochemical impedance spectroscopy (EIS) as an evaluation tool to determine service life of protective coatings on Bureau of Reclamation (Reclamation) structures. Reclamation’s Materials Engineering and Research Laboratory (MERL) acquired a potentiostat capable of sensing extremely small currents, on the order of femtoAmps (10-15 Amps) in 2006. The instrument software package included the EIS test with a primary application of laboratory evaluation of dielectric materials, such as protective coatings. MERL’s coatings laboratory initiated long-term evaluations of the commercial coating systems frequently used for recoating of Reclamation structures and equipment. Typical applications included gates of all types, penstock interiors, and associated interior hydroelectric turbine components: scroll case, wicket gates, turbine runner, etc. Therefore, these coatings were used on Reclamation’s most critical structures and in the harshest service environments. The first coatings evaluated at Reclamation by EIS testing were solvent borne epoxy and 100% solid epoxy. Epoxy-based coatings became the recommended coating at Reclamation for immersion service environments in the mid 1990’s, and were used widely prior to the initiation of MERL’s EIS testing. However, coatings industry support for polyurethane coatings as an improvement to epoxy-based systems greatly increased by 2010, at which time Reclamation incorporated candidate polyurethane commercial products into EIS testing. EIS testing continues on a periodic basis, typically once per year, for all coating systems initiated since the original 2006 investigations. Only several exceptions occurred for coatings removed from the study due to severe loss of protection, blistering, or delamination. The collection of data in MERL’s coatings laboratory is extensive and extremely long-term by most EIS testing standards. The evaluation of this data was cursory prior to the onset of this project supported by Reclamation’s Science and Technology Program (S&T).

2
Conclusions
1. The laboratory analysis of the EIS data revealed differences between coating materials commonly used on Reclamation structures.
2. A working method is now available for applying field EIS tests on in-service structures during coating inspections. It is a two cell set-up that is completely non-destructive and does not require electrical connection to the underlying steel structure.
• Field demonstrations were performed at Bureau of Reclamation, U.S. Army Corps of Engineers, and Denver Water facilities.
• Test refinements improved guidance for when, how, and where to set up a test cell. The field test method voltage amplitude is increased compared to the laboratory experiments, and the number of data points is decreased to reduce the test period to five minutes.
3. A simplified process for data interpretation is given using color coding of the coating condition by green-yellow-red as good-moderate-poor, respectively. Maintenance planning should begin when the coating measurement is in the yellow region of the plot. The color code used is dependent on the service condition, i.e. immersion versus atmospheric.
4. Equivalent circuit modeling of the laboratory EIS data provided greater insight for the coatings tested.
Coating Evaluation by Electrochemical Impedance Spectroscopy (EIS)
3
Background Coatings are the primary control against corrosion of Reclamation structures. Operation and maintenance (O&M) guidelines dictate regular inspection of these structures and their corrosion prevention and control (CPC) system to keep them in good working condition. As needed, Reclamation includes established safety factors for these inspections. For example, Reclamation’s Facility Instructions, Standards, and Techniques (FIST), Volume 2-8, or FIST 2-8, describes the required inspection of penstock pipes, which are a critical component to Reclamation’s infrastructure from both an operational and public safety perspective [1]. Here, ultrasonic testing (UT) is the designated inspection method used to measure the wall thickness of the penstocks. The respective safety factors guide the data analysis and conclusions. The periodic evaluation of metal loss on Reclamation structures is critical to ensure their continued safe operation. However, once the steel has degraded, the only means to regain it is by expensive replacement or weld repairs. Therefore, it is critical that an effective CPC system is in place at all times. There is no standard inspection method for all CPC systems at Reclamation. Testing of cathodic protection systems in accordance with FIST 4-5 is possible for many structures but exceptions exist, including penstocks, where this quantitative measurement and protection determination is not possible [2]. The inspection of protective coatings receives qualitative reporting through FIST 2-8 [1]. The protocol to inspect steel penstocks and pressure conduits only requires a visual inspection of the coating condition. An inspection report may note areas where the coating is no longer present or where there is significant rusting or other damage such as blistering. A strong inspection report provides a calculation of the surface area of the structure that is in need of coating repair. From an O&M perspective, this surface area is used to apply “rule of thumb” decision-making for the protective coating repairs [3]. The annual cost of CPC systems for steel structures has greatly increased in recent decades and is estimated to be 3.1% of the gross domestic product in the United States [4]. Key contributors to this are escalating construction costs and reduced service life of the coatings systems. Construction costs are high at Reclamation because structures tend to be inaccessible and require more safety protocols to mitigate the risks to construction crews. For coating service life, several decades of field experience with epoxy-based coating systems shows that they provide approximately 15-25 years of service before requiring a full recoat. Most Reclamation penstock structures were originally coated with coal tar enamel as a protective coating at the time of construction. This material is no longer used because of its hazards to those applying it; however, its service life is often more than 80 years. It remains in good condition at a number of Reclamation facilities today.

4
EIS Testing EIS testing is an alternating current (AC) impedance method used to measure the complex resistance of dielectric materials, such as coatings on steel substrates [5, 6, 7, 8, 9, 10, 11, 12, 13]. A potentiostat is the common instrument for applying the test procedure [14]. The test algorithm applies a sinusoidal perturbation to the steel substrate, typically at the millivolt (mV) scale. The instrument detects the amount of current that passes through the protective coating to achieve the voltage algorithm. Ohm’s Law shows that applied voltage, V, is directly proportional to measured current, I, by a factor of resistance, R (Equation 1). In the EIS testing set-up, this is the complex resistance of the protective coating. Equation 2 provides Ohm’s Law as a complex resistance, as measured in EIS testing, where j is the square root of -1. Complex resistance is more commonly known as impedance, Z.
V = I * R Equation 1
V = I * jZ Equation 2 The primary application of EIS testing in a coatings laboratory is for the periodic evaluation of protective coatings on steel substrates during natural or accelerated weathering. Here natural weathering could be an outdoor atmospheric test rack such as those used at the U.S. Army Corps of Engineers (USACE) Paint Technology Center in Champaign, IL (Figure 1). Standard accelerated weathering procedures include ASTM G85 [15], ASTM D4587 [16], and ASTM D870 [17]. MERL’s coating laboratory uses all of these techniques. Accelerated weathering techniques, as the name suggests, greatly decrease the amount of time to cause failure of the protective coating under evaluation. The assumption required to use accelerated weathering methods appropriately is that the coating degradation mechanism is consistent with that experienced during its anticipated service.

Coating Evaluation by Electrochemical Impedance Spectroscopy (EIS)
5
Figure 1. Example weather methods: (left) USACE Paint Technology Center atmospheric test rack and (right) Reclamation immersion tanks. Together, laboratory EIS testing and accelerated weathering provide a truncated, quantitative method for evaluating the loss of a coating material’s protective properties. Researchers interpret the EIS test data by simple plotting on a graph as well as by methods that are more sophisticated. Equivalent circuit modeling is the primary method used here. In practice, researchers also use this data to derive values for material properties, i.e. coating capacitance and resistivity, and water uptake volume fraction, among others. Research Objectives This research seeks a quantitative approach to evaluating coating health on Reclamation structures. Three research objectives guided the progression of this work:
1. Compile existing laboratory EIS data for coatings typically used on Reclamation structures
2. Develop field EIS method to collect data during regularly scheduled inspections
3. Perform sophisticated analyses, including equivalent circuit modeling, of laboratory and field EIS data to extract key indicators of coating performance

6
Literature Review Coating Service Life Prediction EIS testing became a common technique for evaluating coating service life during the mid-20th century. Research and development laboratories coupled the test method with accelerated weathering to quickly rank new coating materials for their protective properties. In 1948, Bakelite Corporation reported their electrolytic resistance evaluations, fundamentally EIS testing, of more than 300 organic coatings, noting the method to be a reliable predictor of coating service life. The combination of accelerated weathering and resistance testing reduced the evaluation period to less than one-fifth of the time, compared to traditional exposure and visual observation [18]. The employment of EIS testing as a coating service life prediction method has not escaped criticism, nor has its counterpart—accelerated weathering. Table 1 documents a partial listing of relevant publications that address the use of coating service life prediction. Google Scholar keyword search terms included, “service life prediction of organic coatings,” and similar phrases.

Coating Evaluation by Electrochemical Impedance Spectroscopy (EIS)
7
Table 1. Example coating service life prediction literature and findings. Year Publisher Author(s) Summary or Conclusions Ref 2015 Corrosion
Science Su, Wu, Li, and Guo
Corrosion protection lifetime estimated using EIS low frequency impedance and middle frequency
phase angle to extrapolate to a time of failure
[19]
2015 Journal of Coatings
Technology and Research
Hinderliter and Sapper
Good barrier systems may exhibit increased barrier properties in accelerated protocols. This causes less exposure challenge to the interface compared to the time of wet exposure in actual
service. Therefore, accelerated weathering may overestimate the performance of these coatings.
[20]
2012 Corrosion Engineering, Science and Technology
Lee et al. Proposes a field image processing of coating deterioration which correlates to low frequency
impedance values and pore resistance as derived from EIS data.
[21]
2011 Journal of Coatings
Technology and Research
Shreepathi et al.
Derives an expression for predicting service life using EIS. The low frequency EIS data detected
the coating degradation before it was visible.
[22]
2010 ECS Transactions
Hinderliter and Croll
Random statistics can be applied to mechanistic degradation models and service life extrapolated.
[23]
2003 Polymer Degradation and Stability
Guseva, Burnner,
and Richner
Stresses for temperature, UV and aerosol modelled to estimate loss of gloss in aircraft
coatings.
[24]
2003 Progress in Organic Coatings
Bierwagen et al.
EIS used to examine corrosion protective properties of organic coatings as well as predict
service life by calculating a time to failure.
[25]
1999 Federation of Societies for
Coatings Technology
Martin et al. Reliability-based methodology proposed which incorporates short-term laboratory experiments,
long-term in-service experiments, and fundamental mechanistic studies.
[26]
1990 Corrosion Kendig and Scully
Evaluated coated steel with EIS testing by change in capacitance to show water uptake and change in resistance to show penetration of ionic species.
Long-term behavior shows good agreement.
[10]
1968 Journal Paint Technology
Brand et al. Reviewed technical literature and surveyed paint manufacturers. Concluded that present methods are unreliable due to disproportional acceleration of some failure modes with respect to others; a
truly rapid test method requires each deteriorative factor to be accelerated proportionately to that
seen outdoor exposure.
[27]
The conclusion drawn from the coating service life prediction literature is to proceed with caution. In particular, the following variables must be carefully considered during any and all employments:
• Coating type – What is known about the materials’ degradation mechanisms for each of the exposure stimulus experienced during actual service? This requires knowledge of the polymer backbone structure and functional groups that constitute the bulk coating material. Information about the coating’s physical or chemical bonding to its substrate is also important.

8
• Film formation – What is known about the conditions during film formation? Information about the degree of cure, residual solvents, and other cure conditions, such as temperature and humidity, contribute to the material’s degradation.
• Service exposure – What is the actual exposure experienced during
service? Common exposure stimuli that facilitate material degradation are ultraviolet (UV) rays, water and ions, and thermal energy. The cumulative amount of this exposure and the number of cycles, such as wetting and drying, must also be estimated with reasonable certainty.
EIS Field Testing of Coatings Traditionally, the potentiostats designed for EIS testing are for laboratory use. There are several obstacles in producing an EIS test method that is field-ready and portable:
• The potentiostat contains sensitive electronics, including a complex array of precise resistors and capacitors.
• The instrument operates by control through a desk or laptop computer.
• The coated steel panel is set into a Faraday cage to shield the sensing of external electromagnetic noise during EIS testing.
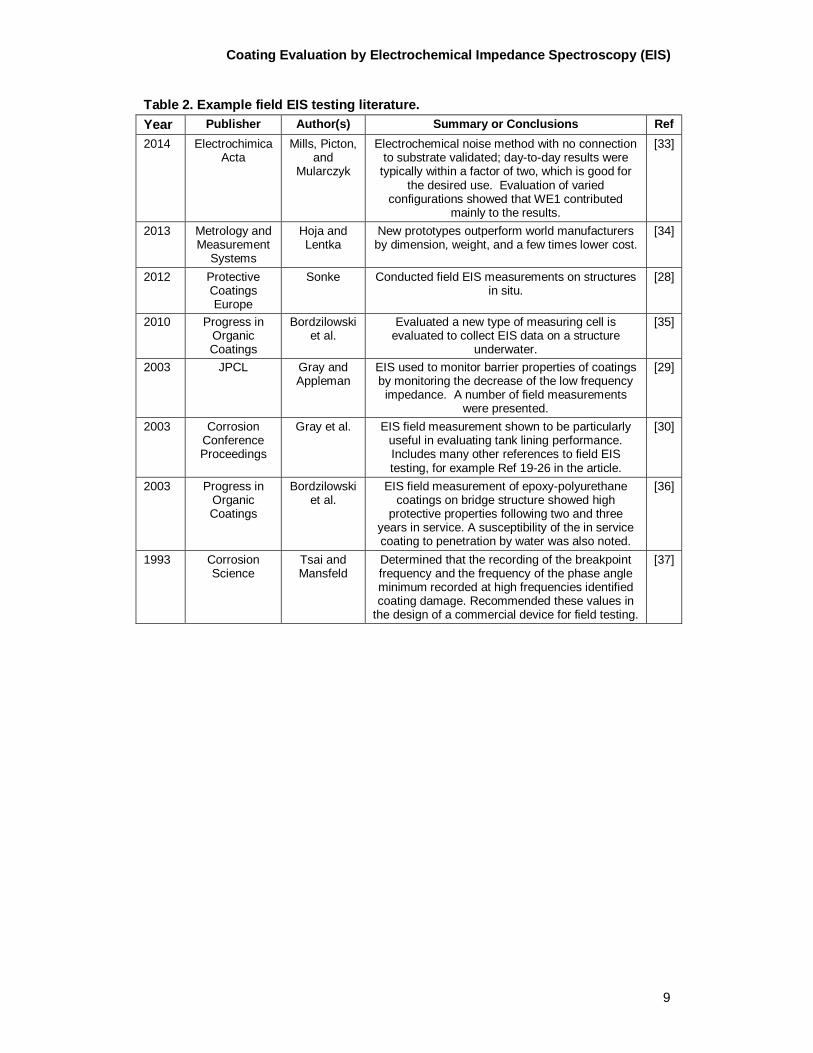
Despite these challenges, several coating scientists and engineers successfully transported the EIS testing set-up to field locations to evaluate coated structures in-situ [28, 29, 30]. The continued advancements of computers and instruments in recent decades make this transition exceedingly more accomplishable. Two major potentiostat manufacturers now sell a potentiostat marketed as portable or field-usable [31, 32]. Table 2 provides literature that employed EIS field testing or strongly contributes to the advancement of these methods. Google Scholar keyword search terms included, “field EIS measurement of coated structures.” A number of conference proceedings also exist on this subject but are not presented here.
Coating Evaluation by Electrochemical Impedance Spectroscopy (EIS)
9
Table 2. Example field EIS testing literature. Year Publisher Author(s) Summary or Conclusions Ref 2014 Electrochimica
Acta Mills, Picton,
and Mularczyk
Electrochemical noise method with no connection to substrate validated; day-to-day results were
typically within a factor of two, which is good for the desired use. Evaluation of varied
configurations showed that WE1 contributed mainly to the results.
[33]
2013 Metrology and Measurement
Systems
Hoja and Lentka
New prototypes outperform world manufacturers by dimension, weight, and a few times lower cost.
[34]
2012 Protective Coatings Europe
Sonke Conducted field EIS measurements on structures in situ.
[28]
2010 Progress in Organic Coatings
Bordzilowski et al.
Evaluated a new type of measuring cell is evaluated to collect EIS data on a structure
underwater.
[35]
2003 JPCL Gray and Appleman
EIS used to monitor barrier properties of coatings by monitoring the decrease of the low frequency impedance. A number of field measurements
were presented.
[29]
2003 Corrosion Conference Proceedings
Gray et al. EIS field measurement shown to be particularly useful in evaluating tank lining performance. Includes many other references to field EIS testing, for example Ref 19-26 in the article.
[30]
2003 Progress in Organic Coatings
Bordzilowski et al.
EIS field measurement of epoxy-polyurethane coatings on bridge structure showed high
protective properties following two and three years in service. A susceptibility of the in service coating to penetration by water was also noted.
[36]
1993 Corrosion Science
Tsai and Mansfeld
Determined that the recording of the breakpoint frequency and the frequency of the phase angle minimum recorded at high frequencies identified coating damage. Recommended these values in
the design of a commercial device for field testing.
[37]

10
Experimental Coating Material Selection This project evaluates a subset of coating materials in MERL’s coatings laboratory receiving widespread use on critical Reclamation structures. In addition, these are some of Reclamation’s most severe service environments. Specifically, the coating selection targeted Reclamation infrastructure or equipment with low accessibility, rarely out of service or dewatered for inspection, or very expensive to recoat. These criteria match well with the interior water conveyance equipment of Reclamation’s hydroelectric power facilities. This is a particularly severe environment because the coating material is in a pressurized immersion service; it may also erode from entrained particulates in the water and become impacted by debris. The most-used coatings for these applications are epoxy-based and, more recently, polyurethane materials. Table 3 provides the selected subset of these commercial materials with the test initiation date shown in right-most column. They are described by their commercial name. Also shown are the volatile organic content (VOC) in grams per Liters (g/L) and the volume percent (vol %) of solids in the packaged products, as reported by the respective manufacturer. Regulation of maximum VOC for the category Industrial Maintenance Coatings is found in the Code of Federal Regulations [38]. The table gives additional information on the material type, National Sanitation Foundation (NSF) certification, and uses. Table 3. Typical epoxy-based and polyurethane coatings for immersion service Type Product Name VOC
(g/L) Solid (vol %)
Notes / Certifications Initiated (Date)
Epox
y
(Sol
vent
Bo
rne)
Macropoxy 646-21 <100 73 polyamide epoxy 11/13/06 Amerlock 2 <250 83 NSF 61 11/13/06 N69 <250 67 polyamidoamine epoxy 11/13/06 Bar-Rust 235 292 68 Low temperature cure 11/13/06
Epox
y (1
00%
So
lids)
Plasite 4500S 0 100 NSF 61 for pipe greater than 42-in diameter, flake-filled
8/13/07
Powercrete J 0 100 Bisphenol A 2/16/07
Poly
-ur
eth
ane
Enduraflex 1988 0 100 NSF 61, elastomeric 9/9/08 Uroflex 0 100 Urethane modified epoxy,
elastomeric 2/16/10
Laboratory Testing Beginning in 2006, MERL’s coating laboratory prepared substrates and applied the coating material for most commercial coatings evaluated. Several exceptions exist in which the manufacturer prepared the test samples for one reason or at no

Coating Evaluation by Electrochemical Impedance Spectroscopy (EIS)
11
cost to Reclamation. For all cases, the coating manufacturer’s data sheet provided instruction for their recommend surface preparation and coating application. The method described below was typical for these coatings. Steel panels, measuring 3-in by 6-in by 1/8-in are solvent cleaned in xylene and abrasive blasted with steel grit to white metal at a 3-mil or greater angular profile [39, 40]. Coating material was spray-applied to the freshly prepared metal surface and allowed to cure for at least two weeks. This was done in accordance with each product's application data sheet. The accelerated weathering exposure for the coated samples was constant immersion in dilute Harrison solution (DHS), which contains 0.35 weight percent (wt %) ammonium sulfate ((NH4)2SO4) and 0.05 wt % sodium chloride (NaCl). Once placed into immersion testing, coatings remain in this exposure at all times and are only removed for EIS testing. A Gamry Instruments (Warminster, PA) FAS2 Femtostat, with dedicated EIS300 software, served as the potentiostat for EIS testing. The test parameters for all measurements were 10 mV sinusoidal perturbation at the open circuit potential, a frequency range of 105 to 10-2 Hertz (Hz), and ten data points per decade. The EIS test cell was consistent with a three-electrode set-up, as demonstrated in Figure 2. Here, a saturated calomel electrode (SCE), platinum mesh electrode, and the steel substrate were connected to the instrument as the reference, counter, and working electrode, respectively. The EIS testing surface area, as defined by the test cell, is 20 centimeters square (cm2). No corrections were made to the raw data for surface area.
Figure 2. EIS testing three-electrode cell set-up; the colored leads are the working (green), reference (white), and counter (red) electrodes.

12
Field Method Development EIS field testing proceeded following the acquisition of an Ivium (Fernandina Beach, FL) Compactstat.e10800 potentiostat with dedicated EIS software. Field tests commenced at a number of Reclamation and USACE facilities as well as at Denver Water’s Marston Lake pipeline in Denver, CO. During these evaluations, the set-up received subsequent improvements. Facilities evaluated by EIS testing during this project and their test parameters appear in the Results and Discussion section. This includes proof-of-concept testing performed outdoors at MERL’s coatings laboratory. The goal was to simplify the technique and ease data interpretation for use by Reclamation field personnel. Reference [41] further documents the evolution of the EIS test method development following the initial site visits. The site visit at Little Oso Dam resulted in a large data set, designed to evaluate the precision and accuracy of EIS field testing. This work validates the field method.

Coating Evaluation by Electrochemical Impedance Spectroscopy (EIS)
13
Results and Discussion Laboratory Testing Accelerated weathering in DHS immersion produced a controlled degradation of the coated steel panels. By comparison, this weathering is very similar to the actual field exposure experienced by these coatings. It is dissimilar in that the ionic concentrations in laboratory testing are slightly more corrosive than actual service conditions at most Reclamation facilities. In addition, the hydrostatic pressure experienced by penstock interior coatings, for example, is an added variable. The effect of service pressure on service life or coating degradation is not known. EIS testing occurs weekly when the immersion exposure commences. Here water and ions penetrate the coating matrix and eventually reach the substrate. The testing periods quickly increase and testing occurs on an annual schedule following six months of exposure. During this infrequent testing, it is typical to observe only minor changes to the coating properties. The data analysis proceeded by a categorization of coating type. These included the two epoxy-based systems, solvent borne and 100% solids, as well as polyurethanes. The EIS results appear in the subsequent sections of this report along with a simplified interpretation of the raw data, plotted by impedance magnitude, |Z|, and phase angle, left and right y-axis, respectively, versus the measurement frequency. Coatings with excellent barrier properties maintain highly capacitive behavior through many years of weathering exposure. Furthermore, |Z| is at least 109 Ohms (Ω) at the lowest frequency, 10-2 Hz. Graphically, this is a line with a slope of -1 for |Z| and a measure of -90° at all frequencies for the phase angle. Deviations from this in the low frequency region indicate resistive behavior. The phase angle is 0° for a perfect resistor—the current and voltage signals are synchronous. Increased resistive behavior is representative of coating degradation for barrier coatings and often corrosion of the underlying steel substrate. Equivalent circuit modeling of the data appears in a later section of this report and derives numerical values for the coating’s capacitive and resistive elements. Each interpretation of the EIS test data seeks a reliable analysis method for evaluating and estimating the remaining service life of coated structures. In addition, it should provide more reliable screening of new commercial products in the laboratory. Epoxy Coatings (Solvent Borne) Figure 4 provides the EIS test data for solvent borne epoxy coatings. They appear in relative order of performance, from high to low. Amerlock 2 (Figure 3a) has high |Z| at low frequencies and the least variation throughout test period. Some

14
variation occurs at the low frequencies. Notice that the final data series, 6.1 years (yrs), has a higher |Z| and phase angle than early test times. This may indicate a resurgence of protective properties, such as by the build-up of insoluble oxides or hydroxides at the interfaces, as opposed to a consistent degradation.
Figure 3. EIS test data for solvent borne epoxy coatings: a) Amerlock 2, b) Macropoxy 646, c) Bar-Rust 235, and d) N69. Macropoxy 646 and Bar-Rust 235 (Figures 3b and 3c) are similar to Amerlock 2, particularly the former. The data for Bar-Rust 235 exhibits a monotonic decrease in properties. The low frequency |Z| is more than 109 ohms (Ω) after 6 years in immersion exposure, suggesting good long-term field performance. Figure 3d shows EIS test data for N69. A lower |Z| appears but capacitive properties are more pronounced at the 6.1 yrs data series, as shown by the phase angle trend. A hypothesis is that the coating contains corrosion-inhibitors; here an active coating ingredient undergoes chemical reaction, forming precipitates which block coating pores or active corrosion sites on the steel substrate.

Coating Evaluation by Electrochemical Impedance Spectroscopy (EIS)
15
Epoxy Coatings (100% Solids) Figures 4 provides EIS test data for two 100% solids epoxy products evaluated. The data presents more deviation during the coatings’ exposure than those shown in Figure 3, especially Figure 4b. In both cases, the initial data series at 0.0 yrs is very high, but it decreases immediately. The protective properties are inferior to the solvent borne epoxy coatings within the first year of exposure. Plasite 4500 is glass flake-filled; these flakes increase the tortuosity of water and ion pathways and maintain a high |Z|, compared to Powercrete J results.
Figure 4. EIS test data for 100% solids epoxy coatings: a) Plasite 4500 and b) Powercrete J. The 100% solids materials are typically higher viscosity at the time of coating applications due the absence of low molecular weight solvents. This may also decrease the coating’s ability to completely wet the substrate. A partially wet substrate produces gaps in the adhesive layer; such sites are unprotected from corrosion. The revelation of this degradation within several months of exposure supports this hypothesis. Polyurethane Coatings Figure 5 provides EIS test data for two polyurethane coatings. These plots are distinctly different than the epoxy coatings evaluated; this is largely attributed to inherent material properties. The low frequency |Z| is approximately one order of magnitude higher. For Enduraflex 1988 (Figure 5a), it is more than 1011 Ω. These values approach the instrument’s limitations and the noise in the data results from this reduced accuracy. Both coatings’ data exhibits a significant phase angle shift for low frequencies at longer exposure periods. This indicates that the coatings are strong barriers to water and ions, but that they do penetrate over time. Additional analysis, such as equivalent circuit modeling, may suggest that corrosion reactions are present on the steel surface.

16
10-2 10-1 100 101 102 103 104 105103
105
107
109
1011
|Z| (Ω
)
Frequency (Hz)
0.0 yrs 0.5 yrs 1.5 yrs 2.4 yrs 4.1 yrs
0
-20
-40
-60
-80
-100
Pha
se a
ngle
(O)
(a)
10-2 10-1 100 101 102 103 104 105103
105
107
109
1011
|Z| (Ω
)
Frequency (Hz)
0.0 yrs 0.5 yrs 1.4 yrs 2.8 yrs
(b)0
-20
-40
-60
-80
-100
Pha
se a
ngle
(O)
Figure 5. EIS test data for polyurethane coatings: a) Enduraflex 1988 and b) Uroflex 65. Field EIS Test Demonstrations and Refinements Table 4 documents all completed EIS field testing demonstrations. Method improvements occurred at several points, including the transition to a two-electrode test cell set-up and an increase of the experimental parameter, voltage amplitude. All demonstrations are noteworthy; however, the following sections are limited to several examples. Table 4. EIS field testing demonstrations. Facility (date) Coating Set-up^ Results or Findings Lakewood, CO (11/2013)
Epoxy primer, silicone topcoat
Three Outdoor portability demonstrated and good agreement with lab results
Unknown Two Demonstrated two-electrode method (no substrate connection)
Ozark and Wilbur Mills (5/2014)
Vinyl Resin and Others
Three Minimizing substrate-to-working electrode resistance a challenge
Grand Coulee (7/2014)
Lead Alkyd with Aluminum Phenolic
Three Lessons learned – advanced technique
Little Oso (7/2014)
Unknown Three Precision and accuracy testing, validates method; publication in preparation; decreased to five points
per decade—cut test time by more than half Parker (8/2014)
Epoxy – Barrust 235
Three Evaluation of a $3 million coating failure; coating impedance low compared to laboratory data
Grand Coulee (10/2014)
Coal tar enamel Three Noise at distinct frequencies; solution: increase amplitude by 10 or 20 mV
Marston Lake (10/2014)
Polyurethane Three Evaluation of an eighteen year old polyurethane coating; some short circuiting, increase amplitude
Glen Canyon (7/2015)
Coal tar enamel Two Two electrode testing; completely non-destructive and easier to administer; reduced final frequency,
cut test time further by two-thirds. ^ number of electrodes in test set-up—two-electrode does not require substrate connection

Coating Evaluation by Electrochemical Impedance Spectroscopy (EIS)
17
Outdoor EIS Testing – Proof of Concept
Standard, Three Electrode Test Cell Outdoor EIS testing occurred on coated steel outside of MERL’s coatings laboratory with a known coating. Figure 6 shows this outdoor test set-up as well as the data. Laboratory EIS testing for the same coating system provides a reference at a similar stage of weathering. The outdoor test was set to measure five points per decade, reducing the number of data points and time of experiment by half.
10-2 10-1 100 101 102 103 104 105103
105
107
109
1011
Lab reference data (1.0yr immersion)
3eEIS outdoor (1.3yr atmospheric)
Laboratory vs. Outdoor Measurement
|Z| (Ω
)
Frequency (Hz)
(b)
0
-20
-40
-60
-80
-100
Pha
se a
ngle
(O)
Figure 6. Outdoor EIS test on known coating without Faraday cage: a) test set-up and b) EIS test data. There was a slight offset between the two curves with the outdoor coating recording higher impedance. This was due to the smaller sample area—the test cell measured 8 cm2 for the outdoor test versus 20 cm2 in laboratory. Other possible contributors to the higher impedance include: less degradation during the atmospheric exposure, unsaturated coating, and higher film thickness. Overall, the difference is insignificant in terms of coating quality and anticipated service life; both provide strong barrier protection. This experiment demonstrated a proof-of concept for making portable measurements with no Faraday cage and showed little or no reduction in the data quality.
No Connection to Substrate—Completely Non-Destructive This experiment evaluated an unknown coating by two different EIS test cell set-ups. The first was the standard, three-electrode set-up, which requires a substrate connection. The second is a two-electrode, requiring no substrate connection. The latter is a completely non-destructive approach for EIS testing. A non-destructive test would greatly improve the test method for large structures with no existing defects or bare metal.
(a)
EIS outdoor

18
The three total measurements are given, a three-electrode measurement of Cell 1 and Cell 2, each, and a two-electrode measurement through Cell 1 and Cell 2. The latter test set-up is shown in Figure 7a. The closed symbols in Figure 7b are |Z| and open symbols are phase angle. In theory, the two-electrode set-up measures Cell 1 and Cell 2 in series, which is additive by Kirchhoff’s Laws (Equation 3):
|Z|(Cell 1 + Cell 2) = |Z|Cell 1 + |Z|Cell 2 Equation 3
10-2 10-1 100 101 102 103 104 105102
104
106
(b)
Cell 2 - rusted steel
Cell 1 - coated steel
2eEIS (both cells)
2eEIS vs. 3eEIS
|Z| (Ω
)
Frequency (Hz)
0
-20
-40
-60
-80
-100
Pha
se a
ngle
(O)
Figure 7. Outdoor EIS test for unknown coating on steel pipe: (a) EIS test set-up for two-electrode measurement and (b) two-electrode (both cells) versus three-electrode measurement. Cell 2 has very low impedance values and is primarily resistive with a phase angle near 0° for most frequencies; this is representative of a coating with a large pinhole or defect. Cell 1 provides the impedance data for a typical, thin coating. The low frequency |Z| is 106 Ω, or minimal barrier protection; however, this is adequate for some atmospheric exposures. The two-electrode EIS test data is very similar to the three-electrode Cell 1 data but with slightly higher impedance. With the several points deviating from the main curves removed, Equation 3 produces an average error of 11%. This is one tenth of an order of magnitude and insignificant for the desired analyses. This experiment demonstrated valid results for a portable two-electrode test set-up, making the EIS test completely non-destructive.
(a)
eEIS (both cells)

Coating Evaluation by Electrochemical Impedance Spectroscopy (EIS)
19
EIS Field Method Demonstrations
Ozark-Jeta Taylor Lock and Dam Initial EIS field testing began mid-2014. USACE’s Ozark-Jeta Taylor Lock and Dam in Arkansas provided the first opportunity to demonstrate the portable EIS test. Figure 8 provides photos for a successful test on a tainter gate arm. The results appear in much greater detail in the prepared conference proceedings, Ref [41]. The paper was presented at the Society for Protective Coatings annual conference, SSPC 2015, and is a joint production of Reclamation and USACE. A key feature is recommendations for identifying ideal EIS test cell locations.
Figure 8. EIS field demonstration at US Army Corps of Engineers' Ozark-Jeta Taylor Lock and Dam (a) test cell set-up and (b) test in progress. Joh
Parker Dam – Coating Failure Investigation EIS field testing accompanied the coating specialists’ inspection of recoated penstock gates at Parker Dam in California. Following completion of the painting contract, the gates were placed back into their operating position. The maintenance crew removed these several weeks later to readjust the gate seals and noted extensive rust staining on the newly recoated gates. A thorough investigation of the recoating work ensued, including standard qualitative inspection techniques and EIS field testing. In this case, EIS laboratory data existed for the coating product applied to these gates. The coating’s batch applied to the gates received additional laboratory investigation, including EIS testing. The EIS test data appears in Figure 9 for each of these.
(a) (b)

20
The evaluation concluded that the coating applied to the penstock gates was not providing effective corrosion protection. In this case, the coating batch provided a low frequency |Z| value near 108 Ω and instead of the anticipated 1010 Ω for a newly applied coating. The EIS data suggests the coating film had inherent defects at the time of application and product cure. Also, note that the end test data frequency was 10-1 Hz compared to 10-2 Hz in lab testing. This reduced the field test time to five minutes. However, the disparity in the test data remains apparent. A sample of the coating was removed using a putty knife (Figure 9, right). This destructive test revealed corrosion spots on the underside of the coating. This confirms the non-destructive results obtained by EIS testing.
10-1 100 101 102 103 104 105103
105
107
109
1011
|Z| (Ω
)
Frequency (Hz)
Lab data - 0 years Lab data - 8 years Field data - no visible defect Field data - rust stain
Figure 9. Comparison of EIS data for laboratory reference and field structure (left) and destructive evaluation revealed corrosion spots on the underside of the coating (right)
Grand Coulee Dam The first investigation of a penstock lining occurred at Grand Coulee Dam, Washington. The interior penstock coatings provide corrosion protection to this critical component of the hydroelectric facility, and these coatings are very expensive to replace. The goal was to apply EIS field testing to penstock coatings’ evaluation in order to maximize the service life of these coatings. Predicting the degradation of these coatings has the potential to greatly improve maintenance planning for facility owners. Figure 10 shows the test set-up for several test cells.

Coating Evaluation by Electrochemical Impedance Spectroscopy (EIS)
21
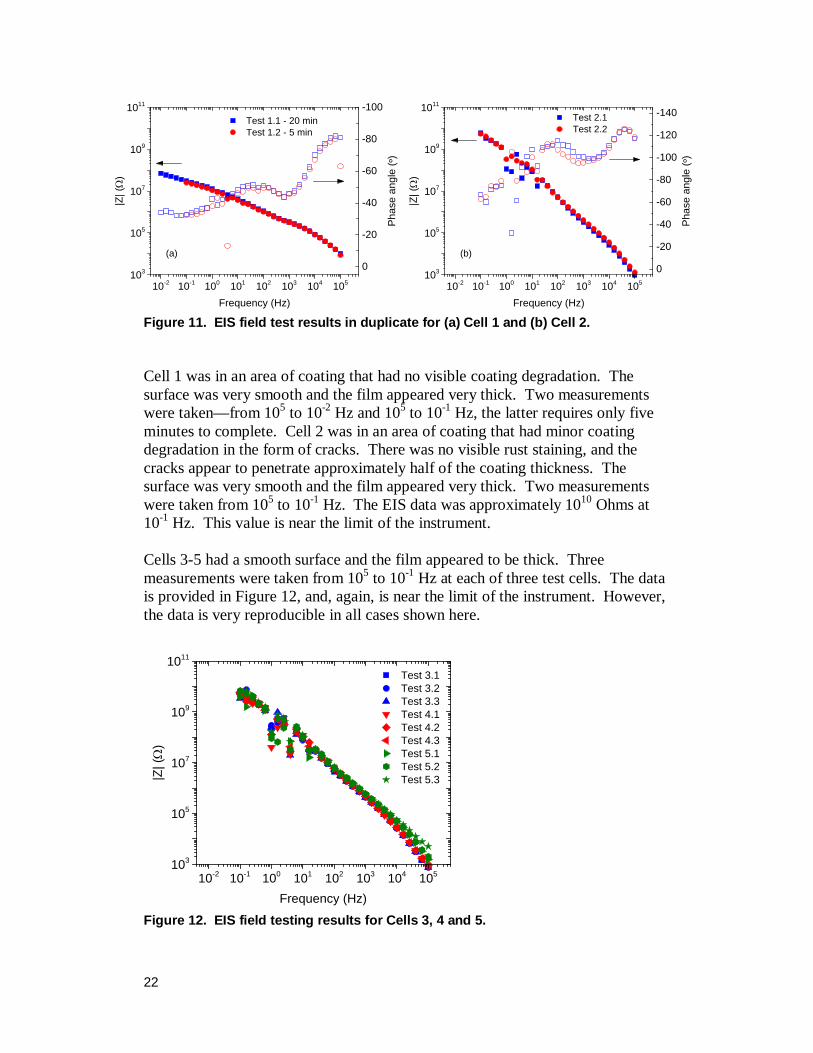
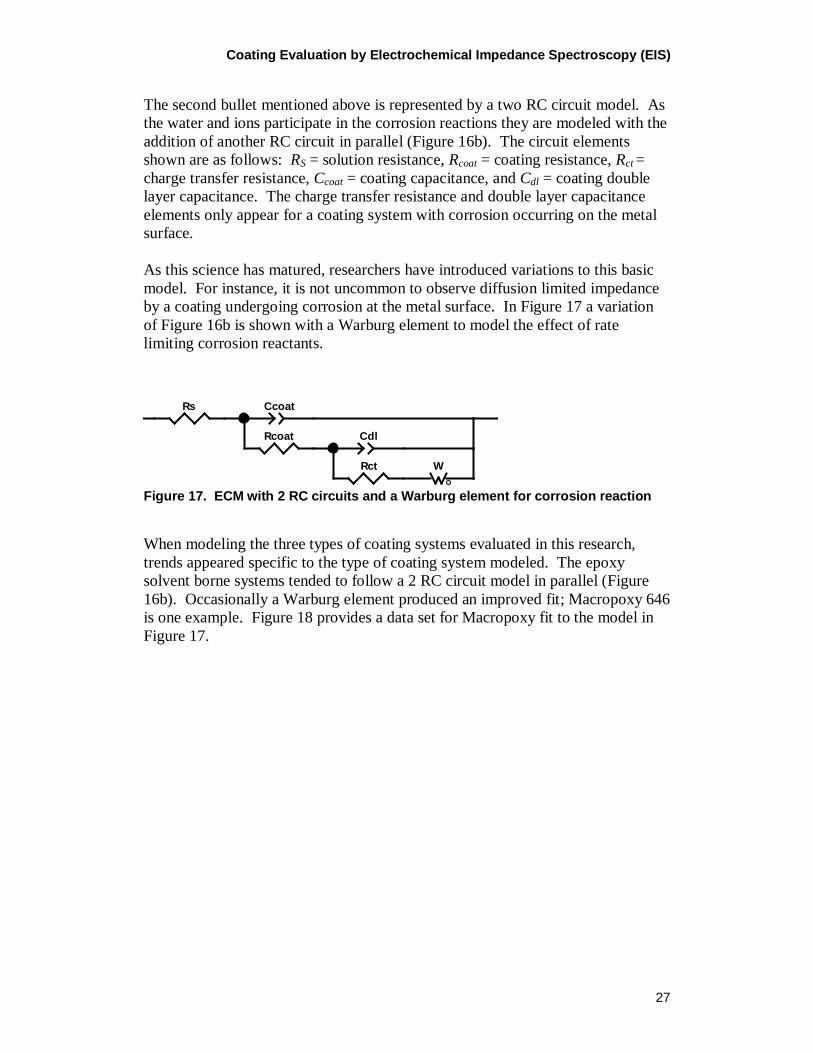
Figure 10. EIS field demonstration at Grand Coulee Dam, Cells 1 and 2 located near the scroll case mandoor (left) and triplicate Cells 3, 4, and 5 (right). EIS field testing proceeded during this demonstration using the three electrode technique. Table 5 provides details on the test locations and notes on the coating appearance. As shown in Figure 11, the nearly 1/8-inch thick coating recorded extremely high impedance; this is not unexpected for this coating type. However, the data consistently provided scattered results between the measurement frequencies 1 and 10 Hz. This data requires caution during interpretation, particularly when the noise source remains unidentified. Troubleshooting to eliminate the noise source did not improve results. Table 5. EIS field testing demonstrations.
Identifier Location Notes Cell 1 25 feet downstream manway @ 5:30 position Very thick coating, smooth
surface Cell 2 20 feet downstream manway @ 6:30 position Thick coating, minor cracking Cells 3-5 50 feet upstream manway @ 5:30 position Thick coating, minor cracking
22
Figure 11. EIS field test results in duplicate for (a) Cell 1 and (b) Cell 2. Cell 1 was in an area of coating that had no visible coating degradation. The surface was very smooth and the film appeared very thick. Two measurements were taken—from 105 to 10-2 Hz and 105 to 10-1 Hz, the latter requires only five minutes to complete. Cell 2 was in an area of coating that had minor coating degradation in the form of cracks. There was no visible rust staining, and the cracks appear to penetrate approximately half of the coating thickness. The surface was very smooth and the film appeared very thick. Two measurements were taken from 105 to 10-1 Hz. The EIS data was approximately 1010 Ohms at 10-1 Hz. This value is near the limit of the instrument. Cells 3-5 had a smooth surface and the film appeared to be thick. Three measurements were taken from 105 to 10-1 Hz at each of three test cells. The data is provided in Figure 12, and, again, is near the limit of the instrument. However, the data is very reproducible in all cases shown here.
10-2 10-1 100 101 102 103 104 105103
105
107
109
1011
Test 3.1 Test 3.2 Test 3.3 Test 4.1 Test 4.2 Test 4.3 Test 5.1 Test 5.2 Test 5.3|Z
| (Ω
)
Frequency (Hz) Figure 12. EIS field testing results for Cells 3, 4 and 5.
10-2 10-1 100 101 102 103 104 105103
105
107
109
1011
|Z| (Ω
)
Frequency (Hz)
Test 1.1 - 20 min Test 1.2 - 5 min
(a)0
-20
-40
-60
-80
-100
Pha
se a
ngle
(O)
10-2 10-1 100 101 102 103 104 105103
105
107
109
1011
|Z| (Ω
)
Frequency (Hz)
Test 2.1 Test 2.2
(b)0
-20
-40
-60
-80
-100
-120
-140
Pha
se a
ngle
(O)

Coating Evaluation by Electrochemical Impedance Spectroscopy (EIS)
23
Based on the EIS field demonstrations, the conclusion was insufficient moisture in the film to make the measurement. An additional possibility is a high resistance from the working electrode lead to the mating infrastructure surface; however, the variance in the open circuit measurement was less than 5 mV over the 30 second acquisition period. The noise source was never positively identified. The demonstration concluded with the following future adjustments as recommendations:
• The test cells were set up for approximately 2 hours before testing. More time is needed for high barrier coatings that have been dewatered for an extended period of time.
• Increase voltage amplitude to at least 20 mV for extremely high impedance coatings such as coal tar enamel and polyurethane.
• Demonstrate the field feasibility of the two-electrode method—no
connection to substrate—and compare it to the three-electrode method from relevant perspectives: ease of use, interpretation of data, etc.
Glen Canyon Dam EIS field testing on the interior penstock coating at Glen Canyon Dam in Arizona produced the desired two-electrode method demonstration, yielding excellent results (Figure 13). Additional advancements to the field method reduced the test time per EIS test spectra. Here, the final tested frequency was reduced from 10-2 Hz to 8 x 10⁻² Hz. This change reduces the total test time to approximately 4 minutes per test spectra. By comparison, the laboratory test method typically exceeds 30 minutes. At this point the recommendation became to proceed with fast EIS tests at several coating sites within the structure and to make one or more measurements with the end frequency at 10-2 Hz, as time permitted. The latter provides additional information that could be useful during analysis. This reduced test time also incorporates the change from 10 points per decade to 5 points per decade, a practice since the first outdoor demonstration.

24
Figure 13. EIS test set-up for two-electrode experiment. Three test cells shown; Cell 1 is reference cell and Cell 2 is working cell in this example.
Additional Non-Destructive Demonstrations Subsequent demonstrations of the two-electrode method occurred on Dworshak Dam penstocks in Idaho and John Keys Pumping Plant interior discharge tubes in Washington during the fall months of 2015. Overall, the two-electrode method expedited the test procedure. It also eliminated the need for an area of coating damage with bare steel or a long electrical connection to other bare steel on the structure. Therefore, the new test method classifies as completely non-destructive, which is appealing to facility owners. Remaining Service Life Analysis The final stage of this project was to evaluate service lifetime analysis methods and produce a practical method for using EIS results. It targets two outstanding coating research needs, listed below. Both are Reclamation needs that would improve corrosion management.
1. Determine remaining service life of an existing coating at Reclamation facilities with sufficient accuracy to greatly improve maintenance planning and maximize the useful life of the coating.

Coating Evaluation by Electrochemical Impedance Spectroscopy (EIS)
25
2. Analyze emerging commercial products to determine their anticipated field service life in a specific exposure environment, i.e., immersion, atmospheric, fluctuation immersion-atmospheric, etc.
Practical Interpretations of EIS Field Results Figures 14 and 15 provide field EIS data from Little Oso Dam in Colorado for sample areas with and without visible defects, respectively. A photograph is also provided for one sample from each set. The lowest frequencies, less than 10-1 Hz, provide a data set that is useful for basic evaluation by Reclamation facilities. These values indicate the coating’s total barrier protection, i.e., the resistance to water and ion migration, and represent its ability to prevent corrosion.
10-2 10-1 100 101 102 103 104 105102
104
106
108
1010
Grey rake equipment coating-No visible defects in test area-Atmospheric exposure
|Z| (Ω
)
Frequency (Hz)
Sample 1 Sample 2 Sample 3
Figure 14. EIS field test results for coating with no visible defect (left); photograph Sample 1 (right)
10-2 10-1 100 101 102 103 104 105102
104
106
108
1010
Grey rake equipment coating-One small defect in test area-Atmospheric exposure
|Z| (Ω
)
Frequency (Hz)
Sample 1 Sample 2 Sample 3
Figure 15. EIS field test results for coating with one visible defect (left); photograph Sample 3 (right)
1 cm
Defect
1 cm

26
The colored strip at the left of each graph provides a stoplight analogy, designating the coating condition by green-yellow-red as good-moderate-poor, respectively. The coating with no visible defects is in moderate condition, measuring 106 Ω of resistance at 10-2 Hz. To illustrate a failed coating system, the smallest visible defect in Figure 15 measured poor resistance to corrosion, 104 Ω at 10-2 Hz. Over time, the coating impedance decreases in the low frequency region of the plot. Maintenance planning should begin when the coating measurement approaches the red region of the plot. As a caution, the color designations in this stoplight are appropriate for light duty atmospheric exposure only. Equivalent Circuit Modeling of EIS Data A more advanced interpretation of EIS Data is equivalent circuit modeling. Here, numerical values are derived for the modeled circuit elements in a coating system. Typically, these models evolve in line with changes in physical phenomena that occur within the system. These phenomena are often described as the following:
• Water and ions penetrate the coating system, causing the water/ion pathways to slowly increase in width and decrease in tortuosity.
• Water and ions participate in corrosion reactions at the coating/metal interface. Often times, these species are the rate limiting reactants for corrosion.
Equivalent circuit models (ECM) can be used to describe the EIS data and the occurrence of these physical phenomena. The first bullet above is modeled by a simple circuit with one resistor and capacitor (RC) in parallel (Figure 16a). This ECM did not represent the EIS data in a meaningful way for those coating systems examined here, indicating that corrosion is already underway by the first or second week of exposure.
Figure 16. ECM with typical circuit elements for (a) 1 RC circuit and (b) 2 RC circuits in parallel.
Rs Ccoat
Rcoat
Rs Ccoat
Rcoat Cdl
Rct
Coating Evaluation by Electrochemical Impedance Spectroscopy (EIS)
27
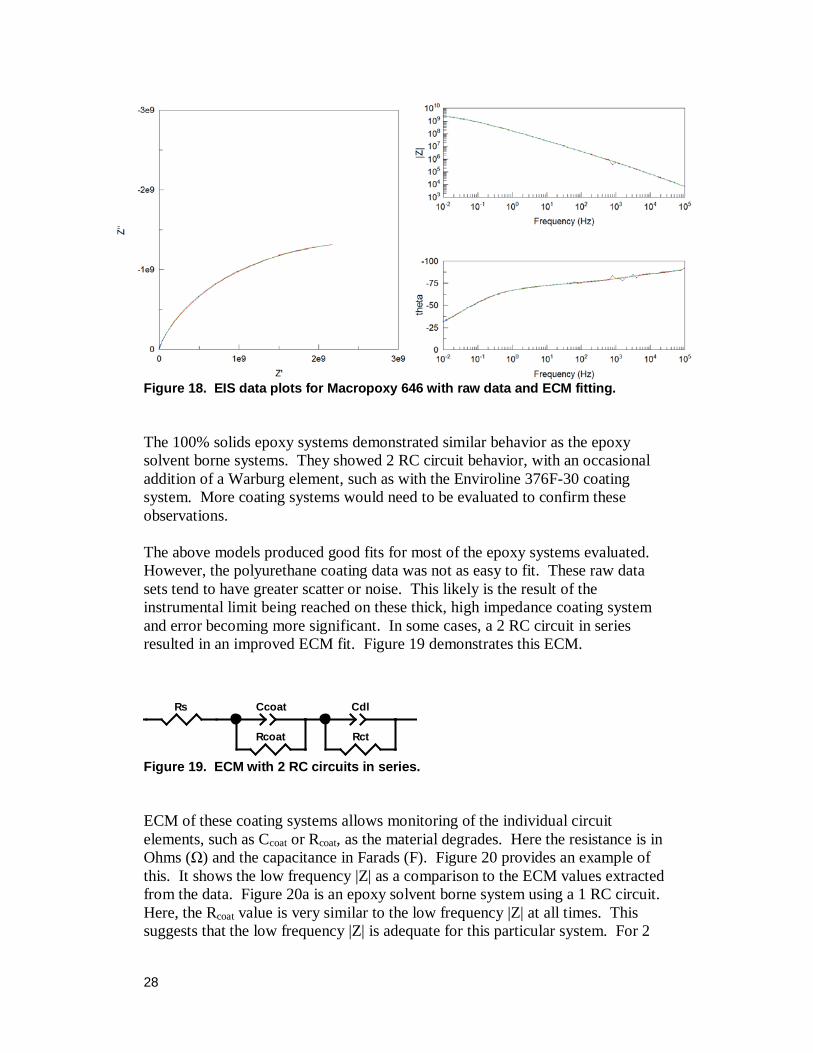
The second bullet mentioned above is represented by a two RC circuit model. As the water and ions participate in the corrosion reactions they are modeled with the addition of another RC circuit in parallel (Figure 16b). The circuit elements shown are as follows: RS = solution resistance, Rcoat = coating resistance, Rct = charge transfer resistance, Ccoat = coating capacitance, and Cdl = coating double layer capacitance. The charge transfer resistance and double layer capacitance elements only appear for a coating system with corrosion occurring on the metal surface. As this science has matured, researchers have introduced variations to this basic model. For instance, it is not uncommon to observe diffusion limited impedance by a coating undergoing corrosion at the metal surface. In Figure 17 a variation of Figure 16b is shown with a Warburg element to model the effect of rate limiting corrosion reactants.
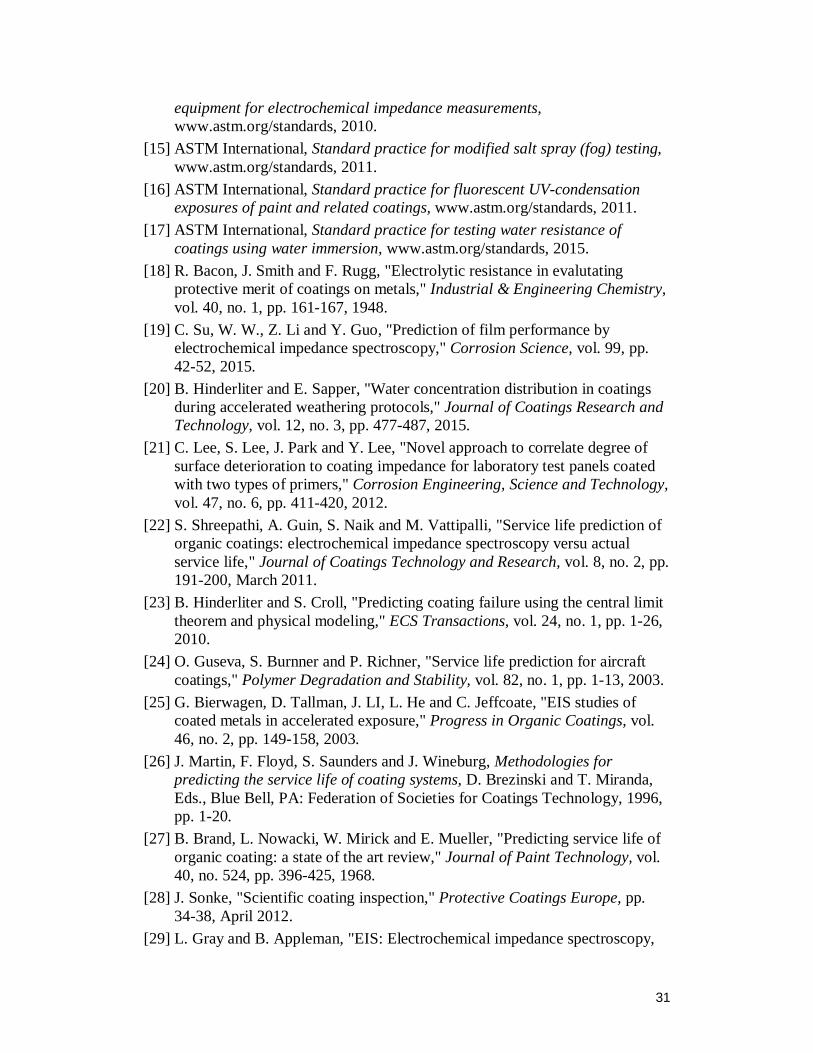
Figure 17. ECM with 2 RC circuits and a Warburg element for corrosion reaction When modeling the three types of coating systems evaluated in this research, trends appeared specific to the type of coating system modeled. The epoxy solvent borne systems tended to follow a 2 RC circuit model in parallel (Figure 16b). Occasionally a Warburg element produced an improved fit; Macropoxy 646 is one example. Figure 18 provides a data set for Macropoxy fit to the model in Figure 17.
Rs Ccoat
Rcoat Cdl
Rct W
28
Figure 18. EIS data plots for Macropoxy 646 with raw data and ECM fitting. The 100% solids epoxy systems demonstrated similar behavior as the epoxy solvent borne systems. They showed 2 RC circuit behavior, with an occasional addition of a Warburg element, such as with the Enviroline 376F-30 coating system. More coating systems would need to be evaluated to confirm these observations. The above models produced good fits for most of the epoxy systems evaluated. However, the polyurethane coating data was not as easy to fit. These raw data sets tend to have greater scatter or noise. This likely is the result of the instrumental limit being reached on these thick, high impedance coating system and error becoming more significant. In some cases, a 2 RC circuit in series resulted in an improved ECM fit. Figure 19 demonstrates this ECM.
Figure 19. ECM with 2 RC circuits in series. ECM of these coating systems allows monitoring of the individual circuit elements, such as Ccoat or Rcoat, as the material degrades. Here the resistance is in Ohms (Ω) and the capacitance in Farads (F). Figure 20 provides an example of this. It shows the low frequency |Z| as a comparison to the ECM values extracted from the data. Figure 20a is an epoxy solvent borne system using a 1 RC circuit. Here, the Rcoat value is very similar to the low frequency |Z| at all times. This suggests that the low frequency |Z| is adequate for this particular system. For 2
Rs Ccoat
Rcoat
Cdl
Rct

Coating Evaluation by Electrochemical Impedance Spectroscopy (EIS)
29
RC circuits in series, Rcoat values were much lower than the low frequency |Z|, which is expected (Figure 20b).
0 1 2 3 4 5103
105
107
109
1011
|Z| @ 0.01Hz RCOAT
|Z| 0.
01 H
z, R
p (Ω
)
Time (Years)
1x10⁻¹⁰
1x10⁻⁹
1x10⁻⁸
1x10⁻⁷
CCOAT
C (F
)
(a)
0 2 4 6 8
103
105
107
109
1011
|Z| @ 0.01Hz RCOAT
|Z| 0.
01 H
z, R
coat (Ω
)
Time (Years)
1x10⁻¹⁰
1x10⁻⁹
1x10⁻⁸
1x10⁻⁷
CCOAT
Cco
at (F
)
(b)
Figure 20. ECM elements values (a) 1 RC and (b) 2RC in series for Rcoat and Ccoat plotted versus time of exposure; low frequency |Z| also included This research demonstrated a modeling technique using equivalent circuits to describe the physical system. Further research could show that ECMs or similar data manipulations provide an added value compared to the straightforward interpretations of the data sets. However, the high level of scatter in the high impedance polyurethane coatings evaluated here limits this usefulness.

Coating Evaluation by Electrochemical Impedance Spectroscopy (EIS)
30
References [1] B. McStraw, Inspection of Steel Penstocks and Pressure Conduits, Vols.
Volume 2-8, Denver, CO : United States Department of Interior, Bureau of Reclamation, 1996.
[2] R. Turcotte, Corrosion and Cathodic Protection, Vols. Volume 4-5, Denver, CO: United States Department of the Interior, Bureau of Reclamation, 2013.
[3] B. Merten, A. Skaja, R. Pepin and D. Tordonato, "Coating maintenance planning to ensure reliable water and power delivery," Journal of Protective Coatings and Linings, pp. 54-63, May 2014.
[4] G. Koch, M. Brongers, N. Thompson, P. Virmani and J. Payer, "Corrosion costs and preventative strategies in the United States," National Technical Information Service, Springfield, VA, 2002.
[5] D. Jones, Principles and Prevention of Corrosion ... double-check pages, 2nd Edition ed., Upper Saddle River, NJ: Prentice-Hall, Inc., 1996, pp. 477-511.
[6] D. Loveday, P. Peterson and B. Rodgers, "Evaluation of organic coatings with electrochemical impedance spectroscopy Part 1: Fundamental of electrochemical impedance spectroscopy," JCT Coatings Tech, pp. 46-52, 2004.
[7] D. Loveday, P. Peterson and B. Rodgers, "Evaluation of organic coatings with electrochemical impedance spectroscopy Part 2: Application of EIS to coatings," JCT Coatings Tech, pp. 88-93, 2004.
[8] D. Loveday, P. Peterson and B. Rodgers, "Evaluation of organic coatings with electrochemical impedance spectroscopy Part 3: Protocoals for testing coatings with EIS," JCT Coatings Tech, pp. 22-27, 2005.
[9] F. Mansfeld and C. Tsai, "Determination of coating deterioration with EIS Part I. Basic relationships," Corrosion, vol. 47, pp. 726-737, 1991.
[10] M. Kendig and J. Scully, "Basic aspects of electrochemical impedance application for the life prediction of organic coatings on metals," Corrosion, vol. 46, no. 1, pp. 22-29, January 1990.
[11] Q. Thu, G. Bierwagen and S. Touzain, "EIS and ENM measurements for three different organic coatings on aluminum," Progress in Organic Coatings, vol. 42, pp. 179-187, 2001.
[12] B. Hinderliter, S. Croll, D. Tallman, Q. Su and G. Bierwagen, "Interpretation of EIS data from accelerated exposure of coated metals based on modeling of coating physical properties," Electrochimica Acta, vol. 51, pp. 4505-4515, 2006.
[13] E. Barsoukov and J. Macdonald, Eds., Impedance Spectroscopy Theory, Experiment, and Applications, 2nd Edition ed., Hoboken, New Jersey: John Wiley & Sons, Inc., 2005.
[14] ASTM International, Standard practice for verification of algorithm and
31
equipment for electrochemical impedance measurements, www.astm.org/standards, 2010.
[15] ASTM International, Standard practice for modified salt spray (fog) testing, www.astm.org/standards, 2011.
[16] ASTM International, Standard practice for fluorescent UV-condensation exposures of paint and related coatings, www.astm.org/standards, 2011.
[17] ASTM International, Standard practice for testing water resistance of coatings using water immersion, www.astm.org/standards, 2015.
[18] R. Bacon, J. Smith and F. Rugg, "Electrolytic resistance in evalutating protective merit of coatings on metals," Industrial & Engineering Chemistry, vol. 40, no. 1, pp. 161-167, 1948.
[19] C. Su, W. W., Z. Li and Y. Guo, "Prediction of film performance by electrochemical impedance spectroscopy," Corrosion Science, vol. 99, pp. 42-52, 2015.
[20] B. Hinderliter and E. Sapper, "Water concentration distribution in coatings during accelerated weathering protocols," Journal of Coatings Research and Technology, vol. 12, no. 3, pp. 477-487, 2015.
[21] C. Lee, S. Lee, J. Park and Y. Lee, "Novel approach to correlate degree of surface deterioration to coating impedance for laboratory test panels coated with two types of primers," Corrosion Engineering, Science and Technology, vol. 47, no. 6, pp. 411-420, 2012.
[22] S. Shreepathi, A. Guin, S. Naik and M. Vattipalli, "Service life prediction of organic coatings: electrochemical impedance spectroscopy versu actual service life," Journal of Coatings Technology and Research, vol. 8, no. 2, pp. 191-200, March 2011.
[23] B. Hinderliter and S. Croll, "Predicting coating failure using the central limit theorem and physical modeling," ECS Transactions, vol. 24, no. 1, pp. 1-26, 2010.
[24] O. Guseva, S. Burnner and P. Richner, "Service life prediction for aircraft coatings," Polymer Degradation and Stability, vol. 82, no. 1, pp. 1-13, 2003.
[25] G. Bierwagen, D. Tallman, J. LI, L. He and C. Jeffcoate, "EIS studies of coated metals in accelerated exposure," Progress in Organic Coatings, vol. 46, no. 2, pp. 149-158, 2003.
[26] J. Martin, F. Floyd, S. Saunders and J. Wineburg, Methodologies for predicting the service life of coating systems, D. Brezinski and T. Miranda, Eds., Blue Bell, PA: Federation of Societies for Coatings Technology, 1996, pp. 1-20.
[27] B. Brand, L. Nowacki, W. Mirick and E. Mueller, "Predicting service life of organic coating: a state of the art review," Journal of Paint Technology, vol. 40, no. 524, pp. 396-425, 1968.
[28] J. Sonke, "Scientific coating inspection," Protective Coatings Europe, pp. 34-38, April 2012.
[29] L. Gray and B. Appleman, "EIS: Electrochemical impedance spectroscopy,

Coating Evaluation by Electrochemical Impedance Spectroscopy (EIS)
32
A tool to predict remaining coating life?," Journal of Protective Coatings and Linings, pp. 66-74, February 2003.
[30] L. Gray, B. Drader, M. O'Donaghue, R. Garrett, J. Garrett, R. Graham and V. Datta, Using EIS to better understand tank lining performance in laboratory and field evaluation, Houston, TX: NACE International, 2003.
[31] "Gamry Instruments Reference 600 Plus," [Online]. Available: https://www.gamry.com/products/potentiostats/reference-600-plus/. [Accessed 1 December 2015].
[32] "Ivium Technologies Compactstat.e: Portable Electrochemical Interface & Impedance Analyzer," [Online]. Available: http://www.ivium.nl/compactstat. [Accessed 1 December 2015].
[33] D. Mills, P. Picton and L. Mularczyk, "Developments in the electrochemical noise method (ENM) to make it more practical for assessment of anti-corrosive coatings," Electrochimica Acta, vol. 124, pp. 199-205, 2014.
[34] J. Hoja and G. Lentka, "A family of new generation miniaturized impedance analyzers for technical object diagnostics," Metrology and Measurement Systems, vol. 20, no. 1, pp. 43-52, 2013.
[35] J. Bordzilowski, A. Krolikowska, P. Bonora, I. Maconi and A. Sollich, "Underwater EIS measurements," Progress in Organic Coatings, vol. 67, pp. 414-419, 2010.
[36] J. Bordzilowski, K. Darowicki, S. Krakowiak and A. Krolikowska, "Impedance measurements of coating properties on bridge structures," Progress in Organic Coatings, vol. 46, pp. 216-219, 2003.
[37] C. Tsai and F. Mansfeld, "Determination of coating deterioration with EIS: Part II. Development of a method for field testing of protective coatings," Corrosion Science, vol. 49, no. 9, pp. 726-737, 1993.
[38] Environmental Protection Agency, Code of Federal Regulations, Title 40, Part 59, Subpart D, Washington, D.C.: Government Printing Office, 1998.
[39] Society for Protective Coatings, SSPC-SP 1, Solvent Cleaning, www.sspc.org, 2015.
[40] Society for Protective Coatings, SSPC-SP 5, White Metal Blast Cleaning, www.sspc.org, 2007.
[41] B. Merten, S. Drozdz, C. Gills, D. Tordonato and J. Ryan, Methodology for coated infrastructure inspection by mobile potentiostat, Las Vegas, NV: Conference Proceedings for SSPC 2015, 2015.

Data Sets that support the final report If there are any data sets with your research, please note:
• Share Drive folder name and path where data are stored: H:\D8180\COATINGS\_EIS Lab Analysis & Field Inspection
• Point of Contact name, email and phone: Bobbi Jo Merten, 303-445-2380
• Short description of the data: Laboratory EIS data (Gamry data files),
Field EIS data (Ivium data files), Analyzed data sets (Origin and Zview files), Publications, Reports
• Keywords: Coatings, Electrochemical Impedance Spectroscopy, EIS,
Field EIS of Coated Structures, Service Lifetime Analysis of Coatings
• Approximate total size of all files: 999 MB


