cober catchment management review 2017 2027 plan · pdf file2017 cober catchment management...
TRANSCRIPT

COBER CATCHMENT
MANAGEMENT PROJECT
2017 Management Review and 2027 Plan
ABOUT
Loe Pool Forum is an environmental partnership working to improve water quality and reduce flood risk in the River Cober catchment. Specifically with the aim to rehabilitate Loe Pool to a state that is ecologically stable, and one that the local community finds attractive. The 2017 Cober Catchment Management Plan examines progress made towards water quality targets and sets out Loe Pool Forum’s 10 year strategy.
AUTHOR Written on behalf of Loe Pool Forum by Dr Timothy Walker.

2017 Cober Catchment Management Plan
1
Executive Summary Loe Pool is the largest natural freshwater lake in Cornwall. Its national significance is reflected in
its designation as a Site of Special Scientific Interest (SSSI) and a County Wildlife Site. The Lake is in an advanced stage of eutrophication. The standing water unit of the SSSI is
currently in “unfavourable – no change’ (NE, 2016); both the ecological and chemical status of Loe Pool are classified as ‘Moderate’ under the 2015 Water Framework Directive (WFD). Eutrophic standing waters are also a priority habitat under the UK Biodiversity Action Plan (JNCC, 2011).
Outcome 1A of the Government’s ‘Biodiversity 2020 - A Strategy for England’s Wildlife and
Ecosystem Services’ is for 90% of priority habitats to be in favourable or recovering condition and at least 50% of SSSIs in favourable condition; while maintaining at least 95% in favourable or recovering condition. In addition, the National Trust has a strategic objective to improve the condition of SSSI and priority habitats within its ownership. The WFD target is for all waterbodies be in ‘good’ condition by 2027.
The Loe Pool catchment suffers from a number of other inter-related and equally complex problems. The history of intensive mining activity in the catchment has produced a highly silted river. Historic channelisation and re-profiling of the River Cober, aimed atreducing flood risk in Helston, has also reduced the ecological function of the watercourse and separated the river from its floodplain. Recent works have however taken place to restore better linkage between the river and the Willow Carr area below Helston.
The Loe Pool Forum (LPF) seeks to address these problems and is clear that a Catchment Based
Approach (CaBA) is most appropriate. The aim is to rehabilitate Loe Pool to a state that is ecologically stable, and one that the local community finds attractive. The aspiration is that the lake community will be macrophyte, rather than algae, dominated with a thriving population of trout (Salmo trutta), and that the water will be clear. Although reassessment as to how feasible this is may be necessary as further information about the physical parameters of the lake becomes available.
Loe Pool Catchment Management Project (LPCMP) set project end targets and objectives in
1998; these remain unaltered in 2017. Under the WFD, Loe Pool has been subject to a comprehensive programme of long-term
monitoring. It has been possible to measure progress against the Project’s targets. Between
1995-96 and 2003-04 the average total phosphorus concentrations at Loe Pool outfall dropped
from 0.301 mg/l to 0.274. This dropped to 0.0955 mg/l in 2015-16. This coincided with the installation of improvements at RNAS Culdrose Sewage Treatment Works (STW) and upstream agricultural interventions through capital works and advice.
The lake rehabilitation programme can be divided into 3 clear steps: (1) Reduction of nutrient
loading; (2) Biomanipulation; (3) Recovery of water plants. The LPCMP remains within step 1 of this programme but with actions undergoing to enter step 2.
The focus of management for 2017-2027 needs to remain on reducing nutrient export sources
within the Catchment. Changes in land use and farm management are also necessary to improve the retention of water in soils, with benefits for flood risk management and the associated recovery of the lower River Cober.
An integrated catchment approach to addressing agricultural sources of nutrients, sediments
and pesticides is a priority for the next reporting period (2017-2027). LPF will seek to combine outreach to the farming community with technical evaluation of environmental risks, management options and outcomes, to bring improvements catchment water quality. The
2017 Cober Catchment Management Plan
2
South West Water (SWW) Upstream Thinking Project (UsT) in conjunction with Natural England’s (NE) stewardship, advisory and capital grant initiatives will be leading this work on the ground. Achieving targets will also require Environment Agency (EA) support through NVZ and DWP compliance and other regulatory enforcement.
A nutrient budget for Loe Pool has been produced based on WFD monitoring data. The budget
shows that annual PO4 load was 1861.9 kg/yr in 2013-14 and 1423.9 kg/yr in 2015-16. The WFD target is 1326kg/yr and the SSSI target is 959kg/yr. In order for Loe Pool to meet the stricter SSSI target there needs to be a reduction of 464.9 kg/yr.
Rehabilitation of the River Cober requires a two-pronged approach. Good progress has been
achieved towards reach-based restoration activities and these should continue alongside a whole river catchment approach, which is recommended to resolve river restoration issues at source as far as possible.
An effective community engagement strategy is paramount to the LPFs success. This is being
led by the Community sub group who are working to raise pollution awareness, reduce the impact of domestic water practices and improve access around Loe Pool.
Adopting a water level regime that provides an extensive seasonal drawdown zone around the
margins of Loe Pool is critical for the re-establishment of submerged vegetation, and hence for successful lake rehabilitation. A revised Water Level Management Plan is in production, as of 2017, and will be integrated into the CCMP once completed.
LPF was restructured in 2014 to form three task groups which meet twice per annum. The
individual management measures recommended within this report have been allocated to the most appropriate task group and incorporated into that group’s annual action plan. The Executive Group meet on an annual basis in order to review progress.

2017 Cober Catchment Management Plan
3
Table of Contents: Executive Summary ........................................................................................................... 1
Table of Figures: ................................................................................................................ 5
Table of Tables: ................................................................................................................. 6
1.0: Introduction ................................................................................................................. 8
2.0: Management Strategy Review ................................................................................... 9
2.1: Aim, Objectives and Targets ..................................................................................... 10
2.2: Statutory Targets ...................................................................................................... 11
2.2.1: WFD .................................................................................................................. 11
2.2.2: SSSI .................................................................................................................. 13
2.3: Lake Rehabilitation Strategy ..................................................................................... 16
2.4: Loe Pool Forum ........................................................................................................ 18
3.0: Management Delivery Review 2009 - 2017 ............................................................... 21
3.1: Loe Pool and Tributary Water Quality ..................................................................... 21
3.2: Reducing Impact of Agriculture ............................................................................... 26
3.2.1: Cross Compliance ............................................................................................ 27
3.2.2: Soils for Profit ................................................................................................... 27
3.2.3: Lower and Higher Level Stewardship Schemes ............................................... 28
3.2.4: Countryside Stewardship .................................................................................. 29
3.2.5: Catchment Sensitive Farming ........................................................................... 31
3.2.6: SWW Upstream Thinking.................................................................................. 31
3.2.7: Downstream Thinking ....................................................................................... 35
3.3: Reducing Impact of Sewage Treatment Works ....................................................... 36
3.3.1: Helston STW ..................................................................................................... 36
3.3.2: Culdrose WWTW .............................................................................................. 38
3.4: Reducing Impact of Other Point Sources ................................................................ 40
3.4.1: Urban Drainage and CSO’s .............................................................................. 40
3.4.2: Septic Tanks ..................................................................................................... 41
3.5: Monitoring Provision and Research ......................................................................... 42
3.5.1: LPF Walk Overs ................................................................................................ 42
3.5.2: University of Exeter ........................................................................................... 44
3.5.3: Camborne School of Mines............................................................................... 44
3.6: Rehabilitation of the River Cober and Loe Pool....................................................... 44
3.6.1: Upper Catchment Management ........................................................................ 45
3.6.2: Helston Flood Alleviation Scheme .................................................................... 45
3.6.3: Lower Cober Maintenance ................................................................................ 49
3.6.4: Loe Pool Water Level Management .................................................................. 50
3.7: Community Engagement ......................................................................................... 51

2017 Cober Catchment Management Plan
4
4.0: Management Plan 2017 - 2027................................................................................... 53
4.1: Lake and Lower Cober Group ................................................................................. 53
4.3: Catchment Group .................................................................................................... 56
4.4: Community Group ................................................................................................... 58
4.5: Research Agenda .................................................................................................... 60
5.0: References ................................................................................................................ 61
6.0: Appendix ................................................................................................................... 63
6.1: Tributary Loading Analysis ...................................................................................... 64
6.2: WFD Reasons for failure ......................................................................................... 66
6.3: ELS and HLS Options ............................................................................................. 67
6.4: CSF Delivery ........................................................................................................... 70
6.5: Helston Flood Alleviation Scheme Explanation Posters .......................................... 74
2017 Cober Catchment Management Plan
5
Table of Figures: Figure 1: Significant water management issues in South West RBD (EA, 2016) ............... 12
Figure 2: SSSI Favourable condition % chart .................................................................... 16 Figure 3: Governance structure of LPF in 2017 ................................................................. 19
Figure 4: Types of catchment groups and scales of governance ....................................... 20 Figure 5: Average total phosphorus concentrations for Loe Pool tributaries and outfall .... 21
Figure 6: Average total phosphorus loadings from tributaries ............................................ 22 Figure 7: % PO4 load to Loe Pool ..................................................................................... 23
Figure 8: Average % contribution to total PO4 load/flow to Loe Pool ................................. 24 Figure 9: Total phosphorus load vs flow ............................................................................ 24
Figure 10: Map of active Countryside Stewardship Agreement Areas in 2017 .................. 30 Figure 12: Map of safeguard zone for Cober DrWPA ........................................................ 32
Figure 12: Map showing locations of the County Wildlife Sites in the Cober catchment .... 34 Figure 13: Helston STW consent limits .............................................................................. 36
Figure 14: Helston STW final effluent discharge including Phosphorous ........................... 37 Figure 15: Helston STW final effluent discharge including BOD ........................................ 37
Figure 16: Culdrose STW Phosphorous discharge pre and post infrastructure upgrade ... 39 Figure 18: Culdrose STW Ammonia, Turbidity and PH discharge pre and post infrastructure upgrade ........................................................................................................ 39 Figure 18: Photograph of LPF team on Walk Over 2 ......................................................... 43
Figure 19: FAS shortlisted options for Loe Pool and the River Cober ................................ 46 Figure 20: Chosen scheme for Loe Pool............................................................................ 47
Figure 21: Chosen scheme for the Cober .......................................................................... 48 Figure 22: Photograph of pipe laying into the Willow Carr ................................................. 50
Figure 23: Principles of the Loe Valley Maintenance Agreement ....................................... 50 Figure 25: LPF Research Agenda ..................................................................................... 61
Figure 25: Poster 1) Why is the scheme needed? ............................................................. 74 Figure 26: Poster 2) What options have been considered? ............................................... 75
Figure 27: Poster 3) The chosen scheme for Loe Pool ...................................................... 76 Figure 28: Poster 4) Environmental benefits of the scheme .............................................. 77
Figure 29: Poster 5) Safety management and timings of works ......................................... 78 Figure 30: Poster 6) The chosen scheme for the River Cober ........................................... 79
2017 Cober Catchment Management Plan
6
Table of Tables: Table 1: LPF Catchment Objectives .................................................................................. 10
Table 2: WFD classification for water bodies in the Cober catchment (EA, 2016a) ........... 13 Table 3: SSSI site specific conservation targets ................................................................ 14
Table 4: SSSI and WFD in-lake Phosphate Targets .......................................................... 15 Table 5: 2010 SSSI Assessment ....................................................................................... 15
Table 6: SSSI Favourable Condition table ......................................................................... 15 Table 7: Groups and Working Themes .............................................................................. 19
Table 8: Total P04 Loading to Loe Pool ............................................................................. 23 Table 9: Comparison of PO4 % Load to Loe Pool from Tributaries ................................... 25
Table 10: Size of farm holdings in catchment .................................................................... 26 Table 11: Summary of S4P activity in the Cober 2010 – 2013 ........................................... 28
Table 12: CSF Engagements and Recommendations ....................................................... 31 Table 13: ODI progress to date in 2017 ............................................................................. 33
Table 14: Achievements in numbers (Cober WFD catchment) April 15 – Jan 17 .............. 35 Table 15: List of observations from PAR cycle 7 ............................................................... 43
Table 16: Lake and Lower Cober Group working objectives.............................................. 55 Table 17: Catchment Group working objectives .................. Error! Bookmark not defined.
Table 18: Community Group working objectives ................................................................ 60 Table 19: PO4 % load to Cober; samples October 2015 to March 2016 (CWT, 2016) ...... 64
Table 20: PO4 load to Loe Pool (EA routine monitoring Jan 2015 – Oct 2016) ................. 65 Table 21: PO4 Load to Carminowe Creek (CWT, 2016) .................................................... 65
Table 22: PO4 load to Carminowe (EA, 2016) ................................................................... 66 Table 23: WFD reasons for failure of water bodies in the Cober catchment ...................... 67
Table 24: ELS and HLS Options being delivered in the Cober .......................................... 70 Table 25: 2009 – 2010 CSF Capital Grants delivered in the Cober Catchment ................. 71
Table 26: 2010 – 2011 CSF Capital Grants delivered in the Cober Catchment ................. 71 Table 27: 2011 – 2012 CSF Capital Grants delivered in the Cober Catchment ................. 71
Table 28: 2012 – 2013 CSF Capital Grants delivered in the Cober Catchment ................. 72 Table 29: 2013 – 2014 CSF Capital Grants delivered in the Cober Catchment ................. 72
Table 30: 2014 – 2015 CSF Capital Grants delivered in the Cober Catchment ................. 72 Table 31: 2015-2016 CSF Capital Grants delivered in the Cober Catchment .................... 73

2017 Cober Catchment Management Plan
7
Figure 0: Cober Catchment Map

2017 Cober Catchment Management Plan
8
1.0: Introduction The Cober catchment, encompassing Loe Bar, Loe Pool and the River Cober, is of great importance because it plays a key role in the rural economy, community well-being, as well as hosting unique environmental habitats. Loe Bar is of national significance because of its unusual geomorphology, the biodiversity and as part of a designated Area of Outstanding Natural Beauty. Loe Pool is the largest natural freshwater lake in Cornwall, part of a designated Site of Special Scientific Interest for the wildlife it supports and of considerable amenity value for Helston’s residents and visitors. The middle and upper parts of the catchment contain a number of County Wildlife Sites (CWS) and have flood alleviation capacity through water storage. In addition, the upper part of the River Cober is of particularly high value for South West Water (SWW) because they abstract to supply Helston and the Lizard with clean drinking water. Loe Pool Forum (LPF) is an environmental partnership working to improve water quality and reduce flood risk in the River Cober catchment. LPF was formed in 1996 in response to the pollution levels in Loe Pool, specifically the summer time algae blooms caused by eutrophication1. As a consequence of the advanced eutrophication in Loe Pool, the standing water unit of the SSSI is currently in ‘unfavourable – no change’ condition (NE, 2016). The Pool and catchment is also failing its EU Water Framework Directive (WFD) (2000/60/EC) targets. The ecological and chemical status of the Lower and Upper Cober Catchment are classified as ‘moderate’ (EA, 2016); the target is to reach ‘Good’ status by 2027. Not only does the catchment face water quality challenges but also peak flow issues, the primary problem being the flooding of properties in the St Johns area of Helston. Eutrophic standing waters, including lakes such as Loe Pool which were formerly mesotrophic (middle-nourished) but are now eutrophic (well-nourished), are a priority habitat under the UK Biodiversity Action Plan (JNCC, 2011) and the Natural Environment and Rural Communities Act, Section 41 (http://www.legislation.gov.uk/ukpga/2006/16/section/41). These lakes are priority because of their declining condition. The Natural Capital Committee’s (2015) ‘The State of Natural Capital’ report explains that over the past 75 years, 45% of wetland habitats have been lost in England. Those that remain have declined in condition due to a variety of pressures (particularly diffuse water pollution) and tend to be highly fragmented across landscapes. These freshwater wetlands are important because they can provide a wide range of benefits, in particular recreation, improved water quality, flood protection, carbon storage and wildlife habitat. Furthermore, the Report says there is strong evidence on the economic benefits of increasing the area of wetlands particularly upstream of towns and cities. Every few years LPF review the progress made towards targets, scrutinise the approach and develop a future management plan. The first Cober Catchment Management Plan was produced in 1998 (Wilson and Dinsdale), the second in 2002 (Dinsdale and Wilson) and the most recent in 2009 (Dinsdale). Over the last 20 years LPF have not only achieved significant reductions in pollution but also widened their approach to water management. In accordance with DEFRA’s Catchment Based Approach (CaBA) LPF are now committed to 1 Eutrophication is defined as the input of elevated levels of nutrients, mainly nitrogen (N) and phosphorus
(P), to a waterbody or watercourse from its catchment. In the early stages, eutrophication leads to an increase in productivity within existing communities. With continued inputs of nutrients, the ecosystem suffers deterioration in water quality, changes in community structure, reduction in species diversity and a frequent occurrence of summer algal blooms.

2017 Cober Catchment Management Plan
9
Integrated Catchment Management (ICM2). As a result, the 2017 Cober Catchment Management Plan (CCMP) includes a strategy for action which takes into account not only the Lake’s water quality targets but also the needs and priorities of new partners and stakeholders, specifically the requirement to reduce pollution related shutdowns of SWW water treatment plant and the need to increase upstream flood alleviation capacity. Nevertheless, the primary aim of LPF is to rehabilitate3 Loe Pool to a state that is ecologically stable and one that the local community finds attractive,or in other words, the lake community will be macrophyte, rather than algae, dominated with a thriving population of trout (Salmo trutta), and the water will be clear. Although reassessment as to how feasible this is may be necessary as further information about the physical parameters of the lake becomes available.
2.0: Management Strategy Review This section sets out the reviewed Management Strategy for the Cober Catchment Management Project for 2017 – 2027. The need to review the 2009 strategy is due to the environmental changes and new challenges LPF face in its 20th year. These changes and challenges include:
Aim, objectives and targets: Since 2009 LPF have made significant progress in addressing point and diffuse source pollution. New data on water quality, thanks to the SWW UST project, for the Cober is now available. The aims, objectives and targets LPF have now broadened.
Land use change: The decline of dairy farming and expansion of horticultural farming pose new environmental challenges and demand new ways of working.
European policy and funding: Brexit has brought uncertainty to the funding LPF relies on; LPFs need to proactively adapt to potential risks and opportunities.
Catchment Based Approach: The launch of the CaBA in 2011 places new demands on the way LPF should approach water risks and engage with stakeholders.
Upstream Thinking: SWW UST project is now underway. LPF need to collectively review how this project is best married to other LPF activities in order to ensure efficient use of resources.
New partners: There are a number of new LPF partners whose interests are not fully integrated into the strategic vision of LPF.
These changes and challenges considered, the purpose of this revised Management strategy is as follows:
Ensure LPF’s aims, objectives, targets and ways of working are adapted to face the current environmental, political and social challenges.
The strategic direction of LPF is aligned with current European, National and regional environmental policy; resulting in a compliance with water quality targets.
The progress and achievements LPF have made towards improving the environment are logged, recognised and publicised; to the ends of increasing public understanding, engagement and support
The interests of new LPF partners are integrated into LPF’s strategic vision; resulting in increased opportunity for support.
2 ICM is about on thinking holistically on catchment issues; working at the water body scale, co-ordinating
between various sectors and stakeholders, and seeking out soft engineering solutions 3 The restoration of Loe Pool is not deemed practical or appropriate (Wilson & Dinsdale, 1998).

2017 Cober Catchment Management Plan
10
The efficient use of resources from coordination between the different environmental agencies working in the catchment.
To this end, this section includes the revised project aim and objectives, Loe Pool end targets, an overview of LPF partners and how they will deliver the Plan. In essence this section provides an overarching explanation to the purpose of LPF, the statutory and non-statutory targets and how LPF are working to achieve them. 2.1: Aim, Objectives and Targets
LPF’s original 1998 aim was to ‘bring the Pool back to life’. Four catchment objectives (see Table 1) and eight lake rehabilitation end targets were set in 1998 (Wilson and Dinsdale, 1998; pp. 89-92 and 95). The four objectives remain little altered in 2017. The eight end targets for Loe Pool remain the same. However, since 2009 there has been increasing recognition of the wider catchment’s role in water pollution risk and its function for flood alleviation. As such, the Plan (Section 4.0) also includes wider catchment plans being led by partners. All the targets have been developed in attempt to make them as SMART (Specific, Measureable, Achievable, Realistic, Time-bound) as possible, although they are not time-bound as this was not considered to be appropriate at this stage of the lake rehabilitation programme.
Aim: Bring the Pool back to life
Objectives Description
1: Water Quality
To bring about a change in Loe Pool from an algae-dominated turbid water state to a macrophyte-dominated clear water state, characteristic of mesotrophy
4.
2: Water Levels
To restore hydrological function throughout the river catchment in order to bring sustainable flood management. To instate natural seasonal fluctuations in lake water levels, in order to create conditions for a more diverse shoreline and submerged flora.
3: Nature Conservation
To maximise the biodiversity value of Loe Pool and enhance the biodiversity value of its catchment.
4: Community Involvement & Communication
To interest and engage individuals and the local community in the management of Loe Pool and its catchment and to raise the profile of the Loe Pool Project, both locally and further afield.
Table 1: LPF Catchment Objectives
Loe Pool End Targets:
4 The achievability of Objective 1, and associated water quality targets, has recently been brought into
question following the latest data on total phosphate, a CSM study on lake inputs, and the macrophyte surveys. Further research will be conducted to assess how realistic Objective 1 is.

2017 Cober Catchment Management Plan
11
1. Clear water, with mean Secchi disc transparency (SDT) of 6m to 3m, and a minimum SDT of 3m to 1.5m.
2. Mean annual total phosphorus concentration of 10 to 35 g/l. 3. Mean annual chlorophyll a concentration of 2.5 to 8 g/l, and a maximum of 8 to 25 g/l. 4. Macrophyte, rather that algae, dominated community, composed of a diverse range of
species such as Potamogeton natans, Ranunculus peltatus, Elatine hexandra and charophytes, with characteristic vegetation zonation within increasing depth and a Trophic Ranking Score (TRS) of between 5.5 and 7.
5. Diverse assemblage of benthic macroinvertebrates indicative of mesotrophic waters, with the riffle beetle Oulimnius troglodytes abundant and a Predictive System for Multimetrics (PSYM) Index of 3.
6. Diverse open shoreline vegetation communities which include species such as Littorella uniflora, Eleocharis acicularis, Ranunculus flammula, Bidens spp., Persicaria hydropiper. Stands of Phragmites australis swamp community (NVC S4a) are extensive but not covering more than 40% of total shore length.
7. Self-sustaining population of trout (Salmo trutta). 2.2: Statutory Targets Alongside Loe Pool specific targets LPF are also driven by, and are working to achieve, the SSSI and WFD targets. The following two sections include an overview to these targets and their policy context. 2.2.1: WFD The WFD came into force in 2000 and set a programme for delivering integrated management of water resources in Europe through setting EU-wide objectives (Frederiksen and Maenpaa, 2007, Asai et al., 2014). It was the most substantial piece of water legislation ever produced by the European Commission and presents enormous opportunities for the LPF. At the core of the WFD is the classification system and the ecological approach to the assessment of the health of waterbodies. The WFD’s ambitious aim is to improve the quality of all water bodies in the EU to a rating of ‘good’ on the scale: ‘high’ (no human impact), ‘good’ (slight deviation from ‘high’), ‘moderate’, ‘poor’ and ‘bad’ (highly toxic). Further, the WFD aims to prevent deterioration in existing status of all water bodies (Blackstock et al., 2010, Petersen et al., 2009). Achieving the Good Ecological Status (GES) targets will require addressing a number of pressures on the water environment. But as illustrated in Figure 1 the most significant water management issue, and primary reason for WFD target failure, in South West England is diffuse pollution.

2017 Cober Catchment Management Plan
12
Figure 1: Significant water management issues in South West RBD (EA, 2016)
The WFD objectives will be implemented at the River Basin District (RBD) scale through River Basin Management Plans (RBMP). These RBMPs set out a strategic vision for exactly how each water body within each RBD will achieve ‘good’ status through a Programme of Measures (PoM) (Gouldson et al., 2008). Loe Pool falls within the South West RBD, which covers over 21,000km2, and includes all of Cornwall and the Isles of Scilly, Devon, Dorset, parts of Somerset, Hampshire and Wiltshire. The first South West RBD Management Plan was published by the Secretary of State for Environment, Food and Rural Affairs in 2009 and is reviewed on a six-yearly cycle. The RBD Management Plan was updated in December 20155. Under the WFD, Loe Pool was one of only four lakes in the South West to be assigned ‘surveillance’ water body status. This was of enormous benefit to LPF as surveillance waterbodies are subject to the most detailed level of data collection, in order to validate the characterisation pressure, assess impact and detect long-term trends (WFD UK TAG, 2009). So for the first time, Loe Pool was a subject to a comprehensive programme of long-term monitoring which included over 30 biological and physico-chemical indicators of environmental quality, with progress measured against specific targets. The 2009 and 2015 classifications of waterbodies in the Cober are listed in Table 2 below.
5 The latest RBD Management Plans can be found here: https://www.gov.uk/government/collections/river-
basin-management-plans-2015
Physical modifications
20%
Pollution from waste water
29%
Pollution from towns, cites and
transport 4%
Changes to the natural flow and
level of water 3%
Negative effects of invasive non-native species
1%
Pollution from rural areas
39%
Pollution from abandoned mines
4%
2017 Cober Catchment Management Plan
13
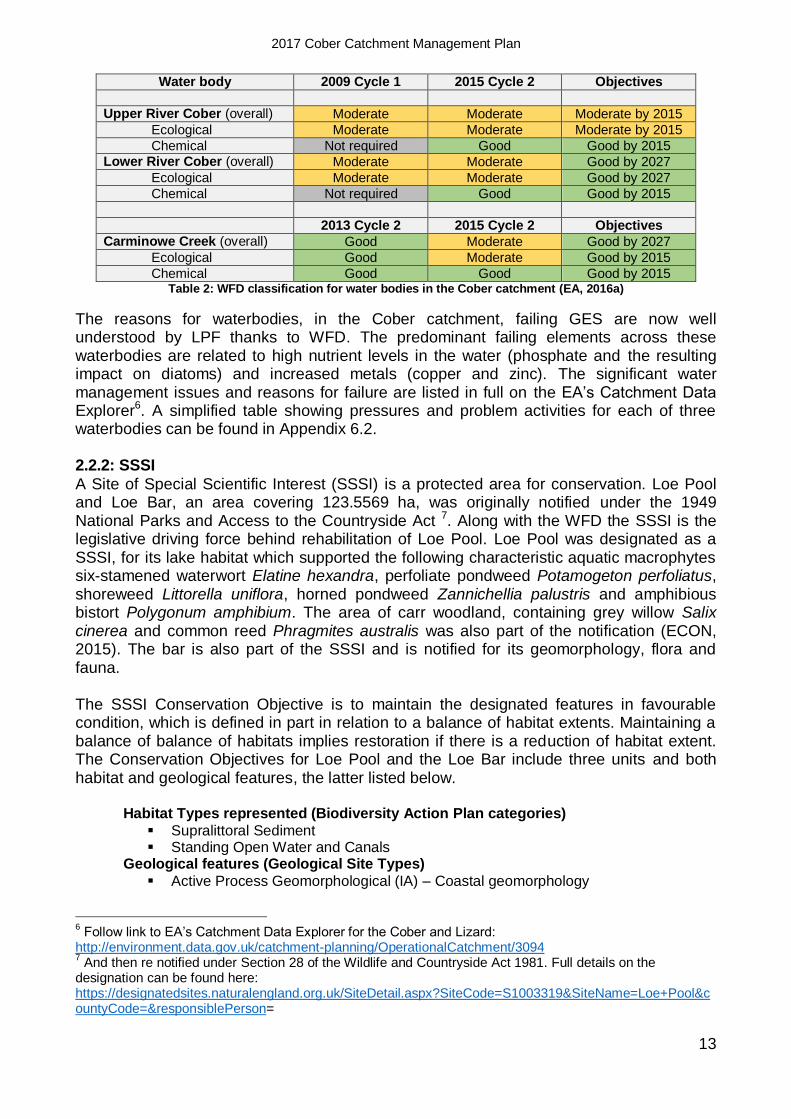
Water body 2009 Cycle 1 2015 Cycle 2 Objectives
Upper River Cober (overall) Moderate Moderate Moderate by 2015
Ecological Moderate Moderate Moderate by 2015
Chemical Not required Good Good by 2015 Lower River Cober (overall) Moderate Moderate Good by 2027
Ecological Moderate Moderate Good by 2027
Chemical Not required Good Good by 2015
2013 Cycle 2 2015 Cycle 2 Objectives
Carminowe Creek (overall) Good Moderate Good by 2027
Ecological Good Moderate Good by 2015
Chemical Good Good Good by 2015 Table 2: WFD classification for water bodies in the Cober catchment (EA, 2016a)
The reasons for waterbodies, in the Cober catchment, failing GES are now well understood by LPF thanks to WFD. The predominant failing elements across these waterbodies are related to high nutrient levels in the water (phosphate and the resulting impact on diatoms) and increased metals (copper and zinc). The significant water management issues and reasons for failure are listed in full on the EA’s Catchment Data Explorer6. A simplified table showing pressures and problem activities for each of three waterbodies can be found in Appendix 6.2. 2.2.2: SSSI
A Site of Special Scientific Interest (SSSI) is a protected area for conservation. Loe Pool and Loe Bar, an area covering 123.5569 ha, was originally notified under the 1949 National Parks and Access to the Countryside Act 7. Along with the WFD the SSSI is the legislative driving force behind rehabilitation of Loe Pool. Loe Pool was designated as a SSSI, for its lake habitat which supported the following characteristic aquatic macrophytes six-stamened waterwort Elatine hexandra, perfoliate pondweed Potamogeton perfoliatus, shoreweed Littorella uniflora, horned pondweed Zannichellia palustris and amphibious bistort Polygonum amphibium. The area of carr woodland, containing grey willow Salix cinerea and common reed Phragmites australis was also part of the notification (ECON, 2015). The bar is also part of the SSSI and is notified for its geomorphology, flora and fauna. The SSSI Conservation Objective is to maintain the designated features in favourable condition, which is defined in part in relation to a balance of habitat extents. Maintaining a balance of balance of habitats implies restoration if there is a reduction of habitat extent. The Conservation Objectives for Loe Pool and the Loe Bar include three units and both habitat and geological features, the latter listed below.
Habitat Types represented (Biodiversity Action Plan categories)
Supralittoral Sediment Standing Open Water and Canals
Geological features (Geological Site Types)
Active Process Geomorphological (IA) – Coastal geomorphology
6 Follow link to EA’s Catchment Data Explorer for the Cober and Lizard:
http://environment.data.gov.uk/catchment-planning/OperationalCatchment/3094 7 And then re notified under Section 28 of the Wildlife and Countryside Act 1981. Full details on the
designation can be found here: https://designatedsites.naturalengland.org.uk/SiteDetail.aspx?SiteCode=S1003319&SiteName=Loe+Pool&countyCode=&responsiblePerson=

2017 Cober Catchment Management Plan
14
The site specific targets for these units are listed in Table 3 below.
Criteria feature Site-specific Targets
Standing waters
Mesotrophic standing waters: No loss of characteristic species recorded from the site. Citation includes:
Littorella uniflora, Elatine hexandra, Potamogeton perfoliatus. 6 out of 10 sampled spots should include at least one characteristic
species
Standing waters & Invertebrate assemblage: W221 Open water
Non-native species should be absent or present at low frequency. At this site, occurrence of non-native species should be no more than 50%
frequency. Algal dominance: Cover of benthic and epiphytic filamentous algae should
be less than 10%.
Standing waters & Invertebrate assemblage: W221 Open water
Characteristic zones of vegetation should be present. Maximum depth distribution should be maintained. At least the present
structure should be maintained.
Invertebrate assemblage: W221 Open water
Maintain preferred features for this site: Complex structure of submerged vegetation (where appropriate); areas
with high proportion of macrophytes with floating leaves; any emergents with abundant flowers; small patches of marginal scrub or trees; fallen wood in water; ‘beach’ areas of bare wet sediment.
Standing waters: quality Stable nutrient levels appropriate to lake type. Mean annual total phosphorus concentration less than target for appropriate lake type : 20µg P l¯¹ (as total phosphorus)
Stable pH/ANC values appropriate to lake type: pH 7.00 (circumneutral between 6.00 and 8.00)
Adequate dissolved oxygen levels for health of characteristic fauna No excessive growth of cyanobacterial or green algae.
Standing waters: hydrology
There should be a natural hydrological regime No loss of marginal vegetation Maintain the natural shoreline of the lake. No more than 5% of lakeshore
should be heavily modified.
Standing waters: lake substrate
Maintain the natural shoreline of the lake. No more than 5% of lakeshore should be heavily modified.
Maintain natural and characteristic substrate.
Standing waters: sediment load
Maintain natural sediment load.
Table 3: SSSI site specific conservation targets
Of particular importance for LPF is the total phosphorus concentration SSSI target. To calculate the Total P (TP8) targets for both the SSSI and WFD the EA used the OECD9 lake model, see Table 4. Essentially the table shows the most amount, ug/l or kg/yr, of Phosphate which can enter the lake and the targets still be achieved. The caveat on these targets is that the model predicts in-lake concentration to be around 55ug/l based on inputs of 3000 kg/year. This is not supported by the in-lake data. The EA are working to
8 It is important to note the difference between Orthophosphate and Total Phosphate for reasons of clarity in
discussion of data. Orthophosphate is what the EA use in monitoring rivers. Essentially this is the bio-available component of the TP; which is why this is used for WFD river targets. The processes in lakes are different as they act as ‘sinks’ for P. Some will be bio-available PO4 and some will be unavailable P bound up in bottom and suspended sediments; but there is also a lot of in-lake nutrient cycling and therefore interchange between the two. This is why TP is used by the EA for WFD lake targets. 9 The OECD (1982) is a simple model that relates total phosphorus load to in lake total phosphorus
concentration. This model is widely used for water quality planning. The model is based on empirical data and was derived following an international eutrophication study OECD (1982). The model takes estimates of total phosphorus load, the annual volume discharge to a lake and the mean depth in a formula.

2017 Cober Catchment Management Plan
15
refine the model but with a limited data set acknowledge that reliably predicting in-lake concentration may not be possible. Nevertheless, the targets set out in Table 4 provides an adequate guide at this stage of lake rehabilitation.
Total P ug/l Loading Total P kg/yr Loading
SSSI Target 21ug/l 959kg/yr
WFD Target 24ug/l 1326kg/yr Table 4: SSSI and WFD in-lake Phosphate Targets
A progress assessment towards the SSSI targets was last made in 2010 by the NE HLS Lead Advisor. The HLS Lead Advisor is also the chair of the LPF Catchment Group and as such a regular check is kept on progress towards SSSI targets. See Table 5 below for the latest assessment and reasons for adverse conditions.
Main Habitat Area (ha)
Latest Assessment
Date
Assessment Description
Comment Adverse Condition Reasons
INSHORE SUBLITTORAL SEDIMENT - CL
95.7267 08/09/2010 Unfavourable - No change
Proxy invertebrate habitat surveyed by Patrick Saunders. Targets not met for the feature Standing open water: macrophyte community composition, macrophyte community structure, water quality, hydrology.
FRESHWATER - INAPPROPRIATE WATER LEVELS,FRESHWATER POLLUTION - WATER POLLUTION - AGRICULTURE/RUN OFF,
SUPRALITTORAL SEDIMENT
27.8302 02/09/2010 Favourable
EARTH HERITAGE
29/01/2010 Favourable
Table 5: 2010 SSSI Assessment
% meeting area of
favourable or unfavourable recovering
Favourable Unfavourable - Recovering
Unfavourable - No change
Unfavourable - Declining
Area (ha) 27.83 27.83 95.73
Percentage 22.52% 22.52% 0.00% 77.48% 0.00%
Table 6: SSSI Favourable Condition table

2017 Cober Catchment Management Plan
16
Figure 2: SSSI Favourable condition % chart
2.3: Lake Rehabilitation Strategy The scale and complexity of the task of rehabilitating Loe Pool is immense. The deterioration in water quality has been a gradual phenomenon taking place over the last 200 years; a relatively short time when compared with the history of the lake (Wilson and Dinsdale, 1998). Whilst the water quality is no longer deteriorating and the relatively large inputs of Phosphate from the two point sources (Helston and Culdrose STWs) have been reduced, due to Phosphate stripping, the level of Phosphate in the Pool remains too high. The pollution of Loe Pool has affected all of the aquatic life and restoration will therefore be a long-term process. LPF have agreed that it will not be possible to turn back the clock, but believe it is desirable and possible to move forward, to re-establish a cleaner, healthier and more diverse water environment which is self-sustaining and self-supporting, benefiting biodiversity and all who enjoy and appreciate Loe Pool (Wilson and Dinsdale, 1998, Dinsdale and Wilson, 2002). The management measures set out in the previous management plans (1998, 2002, 2009) prescribed a step-by-step approach to the rehabilitation of Loe Pool; i.e for an eutrophic, temperate, shallow, lowland lake. In principle, the strategy for lake rehabilitation remains the same in 2017. As such the rehabilitation steps and the Lake information is listed below: Step 1: Reduction of Nutrient Loading
Reduce nutrient inputs from catchment as far as practicable and to at least 50gl-1 (from Moss et al., 1996; Mehner et al., 2002; Phillips, 2005; Hosper et al., 2005). More recently the EA’s Analysis and Reporting Team have calculated that for the WFD target to be met it requires an input of 24ug/l; and for the SSSI target to be met it requires an input of 21ug/l (EA, 2016). Step 2: Biomanipulation Biomanipulation, the manipulation of a lake’s food chain, has been heralded as a powerful tool for the management of eutrophic lakes and has even been called ‘the lynchpin of shallow lake restoration’ (Moss et al., 1996). The theory of biomanipulation is based on a combination of:

2017 Cober Catchment Management Plan
17
the knowledge of the importance of fish in structuring the zooplankton communities of lakes and the cascading impacts, through grazing, on phytoplankton and nutrient status (e.g. Carpenter et al. 1985; Carpenter & Kitchell, 1993);
the theory that at moderate nutrient concentrations in shallow and eutrophic lakes, two alternative stable states may exist, a turbid-water and a clear-water state (May, 1977; Moss, 1999).
Substantial selective reduction of the fish population relaxes the predation pressure and so promotes high densities of large-bodied zooplankton, which then consume the algae. The major disturbance of the turbid-water system brought about by the reduction of fish stocks triggers a shift between alternate stable states; away from the algal dominated, turbid-water state with high densities of planktivorous and benthivorous fish and towards the macrophyte dominated clear-water state with low fish stocks. For further explanation of this bio-manipulation see the 2009 Catchment Management. Step 3: Recovery of Water Plants The re-establishment of dense, submerged water plant beds in clear water is critical to the recovery of the whole ecosystem and the future stability of the lake. Results of multilake studies have shown that where macrophyte are slow to respond to clear water conditions, lake rehabilitation becomes a longer process and is less likely to be ultimately successful (e.g. Moss, 1990; Jeppesen et al., 1990; Jeppesen, 1998; Broads Authority, 2009; Hosper et al., 2005; Phillips, 2005; Meijer, 2000).
The positive effect of submerged rooted vegetation on lake water clarity is the result of a number of mechanisms including:
providing refuge for phytoplankton-grazing zooplankton structural complexity promotes piscivorous perch promoting top-down control reducing availability of nutrients for phytoplankton reducing wind- and fish- induced re-suspension of sediments
(Hosper et al., 2005) Rehabilitation Progress: In 2009 LPF remained firmly within step one. In 2017 LPF also remain within stage one of this rehabilitation programme but have made preparation steps towards stage two. Despite progress in reducing STW Phosphate input (see section 3.1 for details) to the Pool there is much work still to be done in reducing overall in-lake nutrient levels before moving onto steps two and three. Two factors have enabled progress to be made towards stage two. Firstly, the plans for Helston Flood Alleviation scheme are progressing and there is provision within the plan for more natural fluctuations in lake levels to be maintained. This is important for creating the conditions for macrophyte communities to survive. The second factor is the potential bio-manipulation management options provided as part of the 2015 Loe Pool Fisheries Survey (ECON, 2015). The details of which, and recommendations from ECON, are as follows. The three management options considered by NT and ECON are: 1) Do nothing; 2) Conduct a full-scale bio-manipulation; or 3) Carry out an experimental demonstration of the effect of fish within fish exclosures. There are costs, benefits and risks attached to all options. Options 1 and 2 represent management extremes in terms of intensity and cost, with 3 providing an intermediate approach that will provide a clear direction for future fish management (ECON, 2015). Given the high level of uncertainty of the influence of fish on the water quality of the lake and specifically whether fish are currently preventing macrophytes from regenerating, ECON recommend introducing experimental fish

2017 Cober Catchment Management Plan
18
exclosures (ECON, 2015). This provides a cost effective approach to determining whether whole-lake bio-manipulation would be successful in aiding the rehabilitation of the Loe Pool macrophyte community. This would reduce uncertainty of the impact of the fish community on the status of the lake and other factors contributing to the failure of macrophytes to establish, following the successful reduction in nutrient input. In summary, the focus of catchment management for 2017-2027 needs to remain on reducing nutrient input sources to the catchment. The specific interventions needed in the catchment are set out Section 4.0. Through 2017/18 plans for bio-manipulation exclosure trials will be drawn up. There are however a number of factors which impact on this plan but are not well understood. These factors have become specific points of investigation and are part of the 2017 LPF Research Agenda. The first factor relates to the functional links in the water chemistry between the lake sediment and water column and also how changes in water levels may affect this balance when the revised WLMP is implemented. The second factor is the potential upwelling in the lake which Camborne School of Mines (CSM) have identified. This could both inhibit conditions for establishment of macrophyte communities and be another source of pollution. The third factor is climate change. Climate change is a potential threat which may over-ride all others: increased storm events have the potential to impact upon water quality; a substantial change in water supply and throughput would alter the character of the lake; rising sea levels may impact upon the geomorphological development of Loe Bar; any rise in temperature may produce wide-ranging effects in-lake including accelerated growth of some algal species and lower dissolved oxygen concentrations. However, again little is known about how this will impact rehabilitation in Loe Pool (Dinsdale, 2009). This third factor is critical in the long term. LPF do not know enough at this stage to change rehabilitation approach. Rather, the plan is to continue on work towards making the Loe ‘natural’ and reduce the other stressors from pollution. In other words, resilience is the key aim for LPF. 2.4: Loe Pool Forum
LPF is currently constituted of three sub groups and an overseeing Executive group (see Figure 3). Each sub group has a different set of responsibilities to achieve the partnerships overall aims and objectives. The Partnership Executive is made up of the Chairs from each of the sub groups and has overall responsibility for strategic direction of the partnership; meeting once a year to review. The Catchment Group is primarily working to address diffuse pollution in the catchment. The Lake and Lower Cober group is responsible for improving the Loe’s biodiversity and aiming to achieve the lake SSSI standards and WFD GES through activity within and around the pool and adjacent Lower Cober floodplain. The Community and Communications Group are responsible for stakeholder engagement and communicating LPF’s successes. Each sub group has a number of Working Themes (see Table 8) which are informed by the overall LPF Objectives and Targets. These Working Themes guide discussion and actions in the bi-annual sub group meetings. The sub groups meet in late Spring and early Autumn. The Executive Group meets annually in February.

2017 Cober Catchment Management Plan
19
Figure 3: Governance structure of LPF in 2017
Group Working Themes
Lake and Lower Cober Group
1) Water Levels: Improve management of water levels in Loe Pool and the River Cober floodplain. 2) Research & Monitoring: Promote ecological, and broader limnological research and monitoring of Loe Pool and within the Lower Cober floodplain 3) Management: Improve management of Loe Pool and the River Cober flood plain to increase flora, fauna and natural processes.
Catchment Group
1) Research & Monitoring: Increase understanding of the sources of the nutrient and sediment load into Loe Pool, tributary flows, and areas of upstream water storage. 2) Discharge Permits: Reduce nutrient inputs from point sources within the catchment 3) Diffuse Pollution: Undertake evidence-based action on farm holdings and domestic properties within the catchment. 4) Flood Alleviation: Work upstream on flow attenuation features and seek to influence, and add value to, the Helston Flood Alleviation Scheme
Community Group
1) Communication: Communicate and promote the work of LPF to the local community, visitors and professional networks. 2) Educational Action: Reduce domestic pollution in the catchment through educational action 3) Engagement: Collaborate with local stakeholders and UoE researchers on catchment focused projects.
Table 7: Groups and Working Themes
It is worth considering the LPF structure, partners and management approach as this influences catchment priorities and the way in which objectives are achieved. In essence, LPF is a partnership-cooperation which has emerged to collectively tackle a local environment risk. While all stakeholders’ have a significant relationship with some aspect to the catchment their fundamental interests and responsibilities differ. The LPF Executive Group recognised differences in these relationships and as a result run the three separate
2017 Cober Catchment Management Plan
20
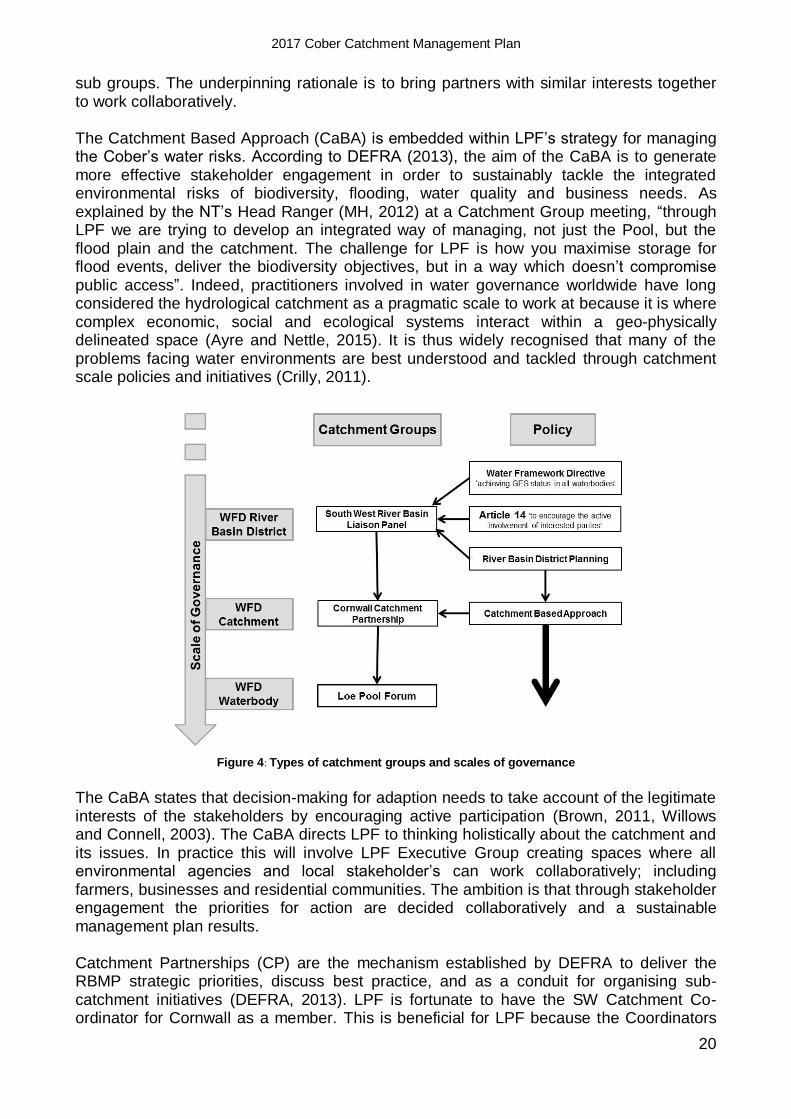
sub groups. The underpinning rationale is to bring partners with similar interests together to work collaboratively. The Catchment Based Approach (CaBA) is embedded within LPF’s strategy for managing the Cober’s water risks. According to DEFRA (2013), the aim of the CaBA is to generate more effective stakeholder engagement in order to sustainably tackle the integrated environmental risks of biodiversity, flooding, water quality and business needs. As explained by the NT’s Head Ranger (MH, 2012) at a Catchment Group meeting, “through LPF we are trying to develop an integrated way of managing, not just the Pool, but the flood plain and the catchment. The challenge for LPF is how you maximise storage for flood events, deliver the biodiversity objectives, but in a way which doesn’t compromise public access”. Indeed, practitioners involved in water governance worldwide have long considered the hydrological catchment as a pragmatic scale to work at because it is where complex economic, social and ecological systems interact within a geo-physically delineated space (Ayre and Nettle, 2015). It is thus widely recognised that many of the problems facing water environments are best understood and tackled through catchment scale policies and initiatives (Crilly, 2011).
Figure 4: Types of catchment groups and scales of governance
The CaBA states that decision-making for adaption needs to take account of the legitimate interests of the stakeholders by encouraging active participation (Brown, 2011, Willows and Connell, 2003). The CaBA directs LPF to thinking holistically about the catchment and its issues. In practice this will involve LPF Executive Group creating spaces where all environmental agencies and local stakeholder’s can work collaboratively; including farmers, businesses and residential communities. The ambition is that through stakeholder engagement the priorities for action are decided collaboratively and a sustainable management plan results. Catchment Partnerships (CP) are the mechanism established by DEFRA to deliver the RBMP strategic priorities, discuss best practice, and as a conduit for organising sub-catchment initiatives (DEFRA, 2013). LPF is fortunate to have the SW Catchment Co-ordinator for Cornwall as a member. This is beneficial for LPF because the Coordinators

2017 Cober Catchment Management Plan
21
role is to develop a shared evidence base of the catchment’s water risks, raise awareness of regulations to support compliance, and feedback potential issues to include in the RBMPs; along with being the conduit to Local Nature Partnerships to optimise opportunities for collaboration on planning and activities (DEFRA, 2013, EA, 2011). The relationships of governance between the WFD, CP, and LPF are visualised in Figure 4.
3.0: Management Delivery Review 2009 - 2017 This section provides a summary of the catchment management progress made during this reporting period, 2009-2017. 3.1: Loe Pool and Tributary Water Quality
In this section the water quality data on Loe Pool and its tributaries is examined. Phosphorus is focused upon because it is a key WFD and SSSI target and because of its significant role in lake rehabilitation. The EA first sampled phosphorus concentrations at Loe Pool’s tributaries and outfall in 1995. Since then sampling has been conducted in 2003-2004, 2013-2014, and 2015-2016. This has enabled the EA to produce an average total Phosphorus concentration graph (see Fig 5) which shows change over time. The data in Figure 5 was collected as part of EA routine sampling and therefore can be considered representative - or put differently, all data collected in wet weather or deliberately targeted (e.g. pollution events) has been removed to reduce bias. The number of samples for each data set are stated above each column. For the years where few P data samples were taken the confidence is low.
Figure 5: Average total phosphorus concentrations for Loe Pool tributaries and outfall
10
Figure 5 shows a reduction of phosphorus concentrations over the last 20 years. The EA inform LPF that while the phosphorus inputs (see tributary loading figures below) are reducing it will take years or decades for reductions in the rivers to be reflected in the Pool.
10
The EA did not collect data for the Cober in 2013-14.
0
0.1
0.2
0.3
0.4
0.5
0.6
0.7
95/96 2003/2004 2013/14 2015/16
Avera
ge tota
l phosphoru
s c
oncentr
ation
(mg/l)
CARMINOWE CREEK FEEDER AT INFLOW TOLOE POOL
RIVER COBER AT INFLOW TO LOE POOL
RIVER COBER AT LOE POOL BAR OUTFALL
PENROSE FEEDER AT INFLOW TO LOE POOL
23
23
23
23 6
5
11
17 8
8 29
16
16 17 23

2017 Cober Catchment Management Plan
22
Nevertheless, Fig 5 is encouraging as it shows a significant reduction in inputs since the 90’s. The decreasing P concentrations from the Cober and most recently Carminowe are primarily the result of improvements at STW. P stripping to 2mg/l was installed at Helston STW in July 2003. This explains why 2003/2004 is so much lower than 95/96 for the Cober. P stripping to 1mg/l is due at Helston STW by 2020 which will improve things further. At Culdrose P stripping to 1mg/l was installed at Culdrose STW in Jan 2015. This explains the reduction at Carminowe Creek in 15/16. Figure 6 shows the average total phosphorus loadings (kg/d) from tributaries to Loe Pool. With the exception of Carminowe Creek in 2013/4 the total phosphorus entering Loe Pool has continued to decline over the last 20 years. Due to the lack of flow data, long term P loads for Loe Pool bar outfall cannot be calculated. However, based on the concentrations graph (Fig 5) there has been a significant decrease in concentrations at the outfall over the last 20 years. In sum, there has been positive progress towards targets and this demonstrates that the LPF catchment based approach is working.
Figure 6: Average total phosphorus loadings from tributaries
11
Table 8 shows the total phosphorus loadings to Loe Pool since monitoring began in 1994. It is encouraging that the overall input of PO4 to Loe Pool (kg/day) has reduced significantly over the last 20 years. The overriding message is that P levels still need to be reduced from the catchment in order for the Pool to reach its targets and therefore hopefully start to improve ecologically (EA, 2015). The Total P kg/yr loading needs to be reduce from 2015-16 levels by 464.9 kg/yr to meet the SSSI target and 97.9 kg/yr to meet the WFD target.
11
The Cober has been displayed on a separate axis in order for the change to been illustrated properly.
0
5
10
15
20
25
30
0
0.5
1
1.5
2
2.5
3
95/96 2003/2004 2013/14 2015/16
Ave
rage
to
tal p
ho
sph
oro
us
(kg/
d) R
iver
Co
ber
Ave
rage
to
tal p
ho
sph
oru
s (k
g/d
) (C
arm
ino
we
Cre
ek
and
P
enro
se s
trea
m)
CARMINOWE CREEK FEEDER AT INFLOW TO LOE POOL
PENROSE FEEDER AT INFLOW TO LOE POOL
RIVER COBER AT INFLOW TO LOE POOL
2
6
8
1
2
5
12 18
1
2017 Cober Catchment Management Plan
23
Years TP kg/day P04 Load
kg/d P04 Load
kg/yr PO4 load kg/yr reduction
needed to meet SSSI target
1994 -1995 29.8 24 8760
2003 - 2004 11.8 6.6 2409
2013-2014 No data 5.1 1861.9
2015 - 2016 5.2 3.9 1423.9 464.9 Table 8: Total P04 Loading to Loe Pool
12
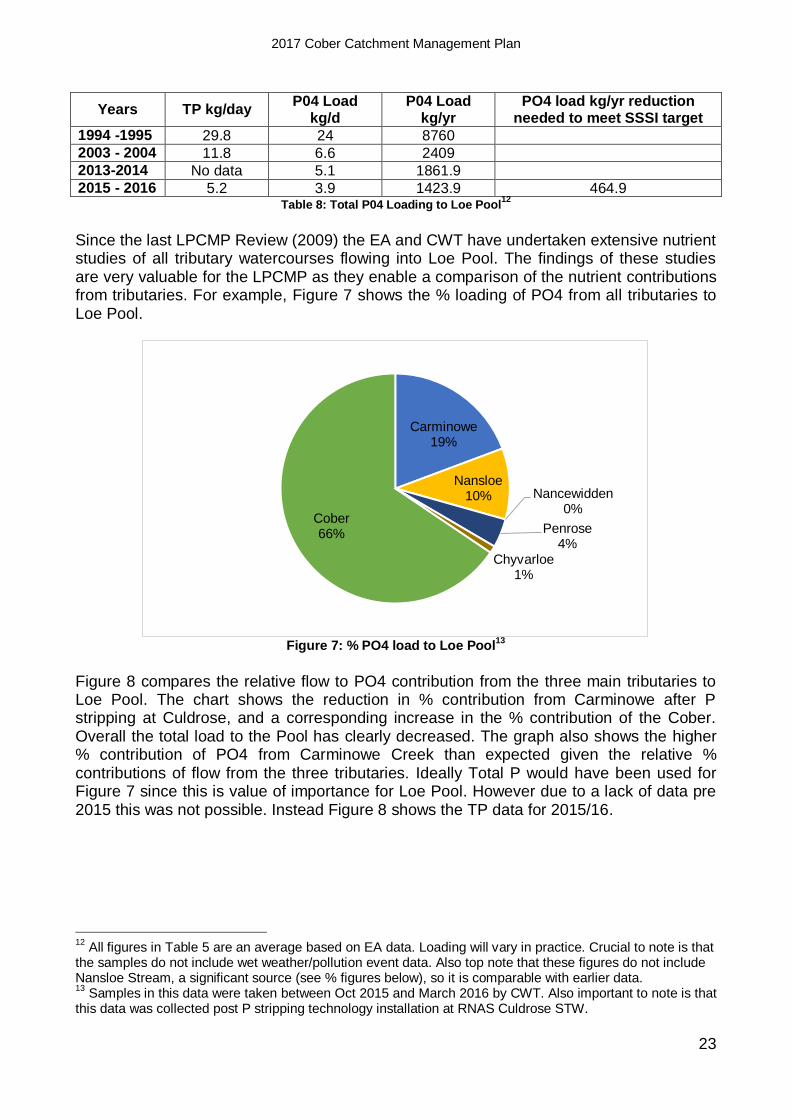
Since the last LPCMP Review (2009) the EA and CWT have undertaken extensive nutrient studies of all tributary watercourses flowing into Loe Pool. The findings of these studies are very valuable for the LPCMP as they enable a comparison of the nutrient contributions from tributaries. For example, Figure 7 shows the % loading of PO4 from all tributaries to Loe Pool.
Figure 7: % PO4 load to Loe Pool
13
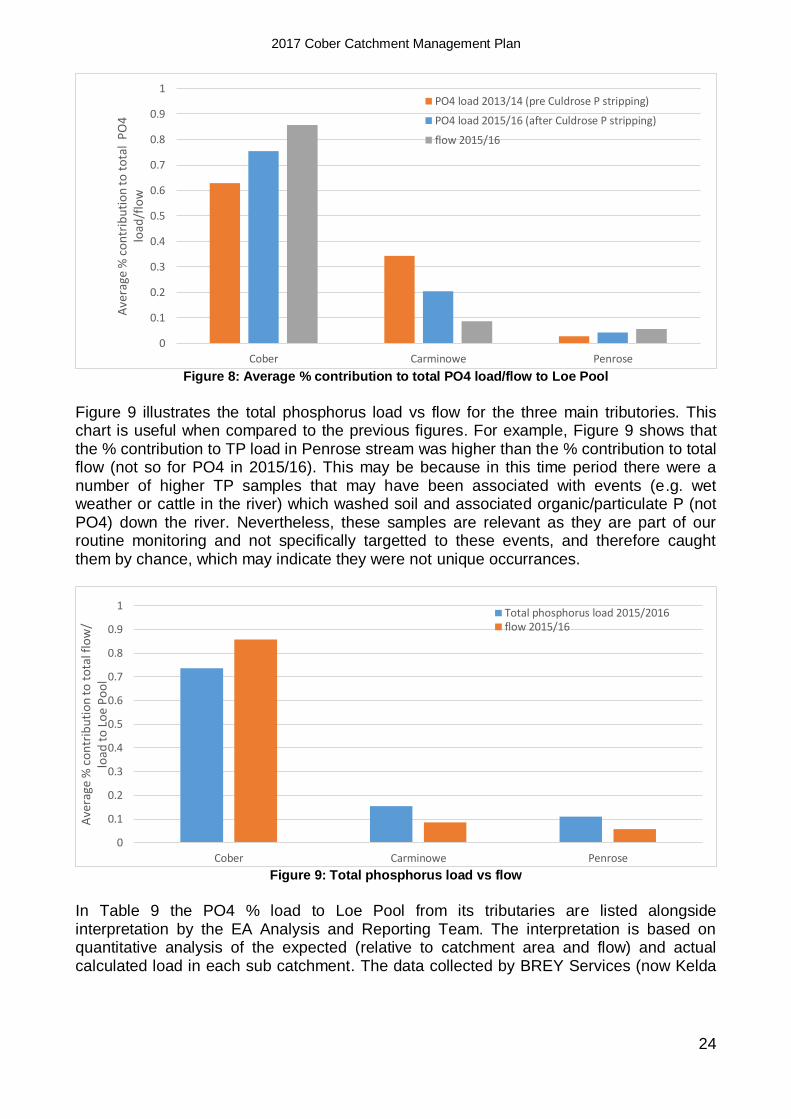
Figure 8 compares the relative flow to PO4 contribution from the three main tributaries to Loe Pool. The chart shows the reduction in % contribution from Carminowe after P stripping at Culdrose, and a corresponding increase in the % contribution of the Cober. Overall the total load to the Pool has clearly decreased. The graph also shows the higher % contribution of PO4 from Carminowe Creek than expected given the relative % contributions of flow from the three tributaries. Ideally Total P would have been used for Figure 7 since this is value of importance for Loe Pool. However due to a lack of data pre 2015 this was not possible. Instead Figure 8 shows the TP data for 2015/16.
12
All figures in Table 5 are an average based on EA data. Loading will vary in practice. Crucial to note is that the samples do not include wet weather/pollution event data. Also top note that these figures do not include Nansloe Stream, a significant source (see % figures below), so it is comparable with earlier data. 13
Samples in this data were taken between Oct 2015 and March 2016 by CWT. Also important to note is that this data was collected post P stripping technology installation at RNAS Culdrose STW.
Cober 66%
Carminowe 19%
Nansloe 10% Nancewidden
0%
Penrose 4%
Chyvarloe 1%
2017 Cober Catchment Management Plan
24
Figure 8: Average % contribution to total PO4 load/flow to Loe Pool
Figure 9 illustrates the total phosphorus load vs flow for the three main tributories. This chart is useful when compared to the previous figures. For example, Figure 9 shows that the % contribution to TP load in Penrose stream was higher than the % contribution to total flow (not so for PO4 in 2015/16). This may be because in this time period there were a number of higher TP samples that may have been associated with events (e.g. wet weather or cattle in the river) which washed soil and associated organic/particulate P (not PO4) down the river. Nevertheless, these samples are relevant as they are part of our routine monitoring and not specifically targetted to these events, and therefore caught them by chance, which may indicate they were not unique occurrances.
Figure 9: Total phosphorus load vs flow
In Table 9 the PO4 % load to Loe Pool from its tributaries are listed alongside interpretation by the EA Analysis and Reporting Team. The interpretation is based on quantitative analysis of the expected (relative to catchment area and flow) and actual calculated load in each sub catchment. The data collected by BREY Services (now Kelda
0
0.1
0.2
0.3
0.4
0.5
0.6
0.7
0.8
0.9
1
Cober Carminowe Penrose
Ave
rage
% c
on
trib
uti
on
to t
ota
l P
O4
load
/flo
w
PO4 load 2013/14 (pre Culdrose P stripping)
PO4 load 2015/16 (after Culdrose P stripping)
flow 2015/16
0
0.1
0.2
0.3
0.4
0.5
0.6
0.7
0.8
0.9
1
Cober Carminowe Penrose
Ave
rage
% c
on
trib
uti
on
to
to
tal f
low
/ lo
ad t
o L
oe
Po
ol
Total phosphorus load 2015/2016flow 2015/16

2017 Cober Catchment Management Plan
25
Water) provides a baseline for comparison14 against the 2015-16 data. The data by BREY Services was collected between June 2007 and July 2008. The EA data was collected as part of routine monitoring between January 2015 and October 2016. The CWT data was collected between October 2015 and March 2016. This was winter sampling and targeted for wet weather events. As such its not necessarily representative of the year but useful for identifying problem tributaries. Ideally TP would have been used in this table. The EA interpretation signposts Carminowe and Nansloe tributaries as areas for action. Further analysis by the EA also highlights the contribution from Helston STW. Based on final effluent data for Helston STW analysis suggests that in 2015/16 it contributed 47% of the total phosphorus load to Loe Pool and 63% of the TP load to the Cober. This is clearly significant. This is probably because it is a high volume discharge which is at the bottom of the catchment; less opportunity for drop out or uptake of P by plants etc. The large contribution of TP, compared with PO4, may also be because the phosphate stripping process is more effective at removing the PO4 than the other (organic/particulate) portion of the TP.
Tributary
% PO4 load to Loe Pool
EA Interpretation 2007- 2008
BREY Services
2015 - 2016 EA
2015 - 2016
CWT
Cober 61%15
43%16
66%17
Carminowe Creek
22% 13% 19% High contribution for relative size of Carminowe catchment
Nansloe Stream
12% 12% 10% Very high contribution considering very small size of sub catchment
Penrose feeder
3% 4% 4%
Chyvarloe feeder
2% 1%
Helston STW 22%18
Culdrose STW
6% Substantially more than expected for the size of catchment.
Nancewidden Stream
0%
Degibna 0%
Table 9: Comparison of PO4 % Load to Loe Pool from Tributaries19
14
It is important to note that when comparing datasets there will be natural variability due to variations in weather patterns in different time periods. The variation between the CWT data and the EA routine monitoring data, for example, is due to the fact that there are more samples in the EA dataset and they are spread over the whole year rather than a few sampling runs in the winter as with the CWT data. 15
Including inputs from Helston STW 16
Calculated from Cober at inflow to Loe Pool minus Helston STW final effluent. 17
Including inputs from Helston STW 18
Calculated from Helston final effluent data. 19
In incidence where figures do not exactly add up to 100% this is due to a sampling or analytical error (EA, 2015).

2017 Cober Catchment Management Plan
26
More detailed analysis, conducted by the EA, of the various % flow vs % load contributions for the various small tributaries and stretches within the catchment can be found in Appendix 6.1.
3.2: Reducing Impact of Agriculture
This section reviews the work completed, between 2009 and 2016, on farms to reduce pollution risks and improve habitat. The phosphate levels in the Pool need to be reduced by 464.9 kg/yr and the Cober represents ~43% of the load. As such tackling diffuse pollution in the catchment is a priority for LPF. Ideally this section would also include a quantitative analysis about the resulting improvement to water quality following farm interventions. However, because of the nature of diffuse pollution this is not possible. Indeed, diffuse pollution is classed as a ‘wicked problem’20 (Patterson et al., 2013) because it is difficult to monitor, model with a high degree of certainty, assign responsibility for, and regulate (Lane et al., 2006, Stazyk, 2006, EA, 2007, Chon et al., 2012, Patterson et al., 2013). Furthermore, attempts to do so are resource intensive and thus expensive (DEFRA, 2004; Stazyk, 2006). It is therefore with great expectation that LPF awaits the results of the UsT project as this will include, for the first time in the catchment, evidence of water quality improvement from farm interventions. Overview of agricultural economy in the Cober:
There is little up to date information on the Cober catchments agricultural economy as of 2017. This is primarily due to the difficultly in cutting the available data on farming to the catchment boundary. For example, a farm may have land in and outside the catchment and separating the two is challenging. As a result, agricultural analysis of catchment has become an action point in the CCMP 2017-2027. The available information on farming in the Cober is set out below. According to 2014 Natural England data there are 170 farm holdings registered with the Rural Payments Agency (RPA) in the catchment. However, based on 2015 information from Catchment Sensitive Farming (CSF) and Soils for Profit (S4P) officers working in the catchment the number of active farms is around 7021. The discrepancy is, in part, explained by the practice of retiring farmers not selling their land but renting it out to neighbouring active farmer and horticultural companies. The 2014 Natural England data also showed the number of farms in relation to size, set out in Table 10.
Size of Holding (Ha) Number of Farm Holdings
>100 7
50-99 12
20-49 41
<20 110
170
Table 10: Size of farm holdings in catchment
From anecdotal and observational knowledge LPF understand there to be an ongoing shift away from dairy farming and towards horticultural farming. No data is available to
20
A wicked problem is a problem that is difficult or impossible to solve because of incomplete, contradictory, and changing requirements that are often difficult to recognize. 21
This figure of 70 active farms and explanation of discrepancy between active and non and originates from interviews Tim Walker conducted with Natural England as part of his PhD research.

2017 Cober Catchment Management Plan
27
corroborate this though. Based on the experience of the UsT Farm Advisor in 2017 the following estimation is made about the catchments economy:
60% grass: mainly beef and fodder production; some small to medium sized dairy farms; very little in the way of sheep; and a smattering of horse, goats and camelids; pigs on a very small scale 25% arable: cereals for animal feed; cropping veg and spuds; and bulbs 15% other uses: including rough-ground / moor, ponds, ex-industrial & small-holdings, and woodland.
3.2.1: Cross Compliance
At a national level, regulation of agricultural impact on the environment comes through the cross-compliance programme, which links rural payments to compliance with relevant environmental legislation. Cross compliance rules22 are linked to the Basic Payment Scheme, Countryside Stewardship, Entry Level Stewardship and Higher Level Stewardship. The programme has greatly helped to focus farmers and landowner’s attention on diffuse pollution issues. Targeting key farms, within the Cober catchment, for compliance visits was an essential Measure (Measure 1.4.6) in the 2009 CCMP. Since 2009 LPF have been in contact with the RPA who provide a broad update about cross compliance issues. Farm visits are based on random selection and a risk basis, based on type of farm, size of farm and pollution maps. Visits are very much dependent on the seriousness of a potential breach; seriousness in terms of any possible action including but not exclusively repayment of subsidy (GOV.UK, 2017b). The number of breaches under the various Statutory Management Requirements and Good Agricultural and Environmental Conditions are published by DEFRA. These are not broken down beyond devolved administration level (i.e. England, Wales, Scotland, N Ireland). However, the SW RPA team are area unaware of prosecutions happening in SW area. Going forward, those working on the ground in the Cober catchment are recommended to make referrals about high risk issues. Referrals need to be accompanied with photographic evidence/proof of problem.
3.2.2: Soils for Profit
Soils for Profit (S4P) was an initiative23 developed in partnership with DEFRA, Environment Agency and Natural England to help farmers improve their management of soils, nutrients and manures. It is framed as a win-win project in that it enables farm business become more profitable through efficiency whilst at the same time reducing environmental impacts from reducing nutrient and sediment enriched runoff. At the heart of the initiative is the free opportunity for farmers to have five soil samples analysed and a follow up report on how best to improve soil management. The five soil samples will be analysed in a lab to determine pH, SOM (soil organic matter), and key nutrients P, K and
22
Cross compliance is made up of ‘Statutory Management Requirements’ (SMRs) and standards for ‘Good Agricultural and Environmental Conditions of land’ (GAECs) (DEFRA, 2017). 23
Follow these link for more detail: http://www.naturalengland.org.uk/regions/south_west/ourwork/soilsforprofitproject/default.aspx

2017 Cober Catchment Management Plan
28
Mg. The follow up report of suggested actions is not simply based on this analysis but a qualitative understanding of the soil structure, the soil management practices and farm system of concern. The S4P programme in Cornwall ran from 2010 till 2013. In 2013 NE closed it to new registrations, although the delivery officers continued to offer follow up visits and contribute to events in 2014. Overall S4P achieved 6,955 direct beneficiaries across Cornwall. This total is based on active farmers engaging in one to one farm advice, and group training events across the SW region. The achievements in the Cober are listed in Table 11. There was also a Farming More Precisely demonstration event held at Franchis Farm in 2012, with about 15 – 20 farmers in attendance.
Farm Area Enterprise 1st
visit Follow-
up
S4P Soil
analysis Summary of recommendations
1 Upper Catchment
Dairy and Arable
July 2012
N Y
Use of soil test results and RB209 or PLANET for nutrient budgets
Consider use of GPS for manure and fertiliser spreading
2 Upper Catchment
Beef, Arable and Bulbs
July 2010
Y N
Regular soil testing
To pursue funding for GPS
3 Upper Catchment
Sheep July 2010
Y N Has moved from beef to sheep enterprise since initial report, superseding the recommendations
4 Upper Catchment
Beef and Sheep
April 2010
Y N Regular soil testing
To consider use of and pursue funding for a grassland aerator
5 Upper Catchment
Dairy August 2010
N N
Consider grassland aeration
Consider pursuing funding for GPS and on-farm slurry N testing kit
6 Loe Pool Mixed May 2013
N Y
Manage timings of field operations
Consider grassland aeration
Continue regular soil testing Table 11: Summary of S4P activity in the Cober 2010 – 2013
3.2.3: Lower and Higher Level Stewardship Schemes
ELS (Entry Level Scheme) and HLS (Higher Level Scheme) are components of the Environmental Stewardship agri-environment scheme. ELS is available to all farmers and includes support for soil and nutrient management planning and other basic pollution mitigation measures, whilst HLS is targeted and includes support for more costly changes in land management. Since 2010 there have been 22 agreements set up under Environmental Stewardship. Each agreement will run for either 5 years if Entry Level or 10 years if Higher Level. The last of these agreements was started in 2013 and so will expire in 2023 as it was Higher Level agreement. Over the next 10 year period spend will be as follows:
Entry Level (including organic) annual options: £321,953.
Higher Level annual options: £463,460.
Higher Level capital items: £276,852.
2017 Cober Catchment Management Plan
29
The details about what Options will be delivered in the Cober are set out in Table 18 in the Appendix. All of these Options will have benefits for the habitat and wildlife. Most of these Options will have benefits for resource protection. For example, Option EE6 (6m buffer strips on intensive grassland), HC8 (Restoration of woodland) and HO2 (Restoration of lowland heath) will all have positive benefits for reducing overland flow and in turn diffuse pollution. As such all the delivery of ELS and HLS schemes are crucially important for the LPF objective of reducing agricultural nutrient input to Loe Pool. 3.2.4: Countryside Stewardship Countryside Stewardship (CS) provides financial incentives for land managers to look after their environment through activities such as conserving and restoring wildlife habitats, flood risk management and reducing widespread water pollution from agriculture (GOV.UK, 2017a). This new £900 million scheme is part of the new CAP and will be replacing Environmental Stewardship (ELS & HLS), the English Woodland Grant Scheme (EWGS) and capital grants from the Catchment Sensitive Farming (CSF) programme (Samuel&Son, 2014). This new scheme opened to applicants in July 2015 with the first new agreements starting on 1 January 2016. Most elements of Countryside Stewardship are competitive with the targeting and scoring approaches developed aiming to encourage applicants to choose options which help achieve the identified environmental priorities in their local area (GWCT, 2017). At the time of this delivery review specific data on Countryside Stewardship agreements in the Cober was not available. However, Figure 11 shows the active Countryside Stewardship Agreement Areas in 2017.

2017 Cober Catchment Management Plan
30
Figure 10: Map of active Countryside Stewardship Agreement Areas in 2017
24
24
Follow this link to the MAGIC website: http://www.magic.gov.uk/

2017 Cober Catchment Management Plan
31
3.2.5: Catchment Sensitive Farming
The Catchment Sensitive Farming (CSF) helps farmers to take action against diffuse water pollution through incentives and advice. The drive behind CSF is the WFD and therefore focused on Water Priority Areas (WPA) i.e catchments failing GES targets like the Cober. CSF have been working in the Cober catchment since 2008. What follows is an overview of CSF farmer engagementsand recommendations made in the Cober catchment between 2008 and 2016. This includes details on farm visits, events, clinics and recommendations to farm practices for improved water quality relating to the pressures in the Cober catchment. Important to note is that the Cober became a priority catchment for CSF in 2008; 2 years after the CSF project started in 2006.
Time Period
Engagements Recommendations
2008 - 2014 (inclusive)
41 farmers received CSF advice on their farming practices. Some farmers received had a 1:1 farm visit and attended a CSF event so number of engagements is higher than 41
31 farmers had 1:1 farm visits 20 farmers attended CSF events 1 farmer attended a CSF advice clinic
28 Farm Infrastructure outcomes recommended
19 Fertiliser management outcomes recommended
17 Livestock management outcomes recommended
23 Manure management outcomes recommended
2 Pesticide management outcomes recommended
18 Soil management outcomes recommended
2015 4 farmers had 1:1 farm visits
4 Farm infrastructure outcomes recommended
1 Livestock management outcomes recommended
4 Manure management outcomes recommended
1 Soil management outcomes recommended
2016
4 farmers had 1:1 farm visits 10 farmers attended a CS water quality
event 3 farmers attended a soil husbandry
event 1 soil husbandry 1:1 advice visit 2 nutrient management planning 1:1
advice visits
Table 12: CSF Engagements and Recommendations
3.2.6: SWW Upstream Thinking Upstream Thinking (UsT) is a multi-award-winning partnership working to improve the water quality in the region’s rivers over the next 5 years (SWW, 2015). The programme is part of South West Water's long term business plan to reduce its environmental footprint and manage the impact of diffuse pollution on customers' bills. This is partnership project between South West Water, the Devon Wildlife Trust, the Cornwall Wildlife Trust, the Westcountry Rivers Trust and the Exmoor National Park Authority. The project is also supported by the National Farmers Union, the Environment Agency, Natural England and the Farming and Wildlife Advisory Group. The programme involves SWW investing £11M across 11 catchments in the SW between 2015 and 2020 to improve raw water quality at their more challenged Water Treatment Works (WTW). The programme has two main elements: advice and grants for farmers and the restoration of peatland in partnership with landowners.

2017 Cober Catchment Management Plan
32
UsT in the Cober:
Raw water from the River Cober is abstracted at Trenear and treated at Wendron WTW. The River Cober Drinking Water Protected area therefore extends south as far as Trenear (see Figure 10) and makes up around half of the whole WFD catchment. The key water quality treatment challenges for SWW in the Cober are ammonium and pesticides (in particular MCPA and Mecoprop). To address this pollution SWW is investing approx. £0.8M in the Cober DrWPA (Drinking Water Protection Area) and CWT is the delivery partner. As a non-statutory organisation, CWT cannot enforce change, so works positively with farmers to find common solutions. Further, that while ammonia and pesticides are the primary targets for SWW the planned farm interventions are anticipated to have positive benefits for both the lake and the catchments habitats.
Figure 11: Map of safeguard zone for Cober DrWPA
Targets: UsT is written into SWW’s business plan and delivers against OfWAT’s Outcome Delivery Incentives (ODIs). The two ODIs for Upstream Thinking are ‘catchment management –

2017 Cober Catchment Management Plan
33
farms’ and ‘catchment management – hectares’. These can be interpreted as: Farms – number of farms where a plan has been agreed to benefit the environment. Hectares – area of semi-natural habitat in better management. In order words, both ODIs are a proxy for water quality. SWW is also required to deliver against the Environment Agency’s National Environment Programme and UsT is one way to achieve these targets.
Target name 2020 target Achieved
by Jan 2017
ODI: No. of plans agreed to benefit the environment
50 14
ODI: Hectares of semi-natural habitat in better management
118 4125
Table 13: ODI progress to date in 2017
Team Structure: The Cober UsT team is made up of 9 specific officers who are working across the catchment. This team includes:
Farm Adviser: advises farmers on land management practices including nutrient management and administers the capital infrastructure funding in the Cober.
Ecologist: works closely with farm advisor to get the most wildlife benefit from land
management solutions. The ecologist surveys whole farms for habitats and species, then works with farmers to help them into agri-environment schemes which provide subsidies to manage land in a more environmentally sympathetic way.
Water Quality Analysis: 2 analysts take water quality samples throughout the DrWPA. These are analysed for general chemistry, pesticides and nutrients and help target advisory work, as well as showing long term trends in changing water quality.
Practical Projects: Volunteer manager leads the Wild Cober volunteers in the
Cober catchment every Thursday. They do hands on conservation work on farmland and semi-natural habitat throughout the WFD catchment. E.g. scrub clearance with hand tools, Himalayan Balsam pulling, hedge laying.
The Farm Advisor and Ecologist are members of the Catchment Group and provide bi-annual updates about project progress. The UsT Cober Project Manager is in regular contact with LPF Executive Group about collaborations with NE and EA. Water monitoring: The UsT water quality monitoring programme has two components. Firstly, the existing on-line monitors at Wendron WTW continually measure the raw water quality. Automatic shutdowns are in place for critical parameters such as ammonia and colour. This raw water quality and plant operation data is taken up by UsT to measure their success. Secondly, UsT have initiated a catchment wide sampling programme for baseline data. This programme has 6 sampling points at strategic places across the catchment. This passive sampling programme will be running for a 6 month period at the beginning of UsT.
25
Area expected to rise following this year’s Countryside Stewardship applications

2017 Cober Catchment Management Plan
34
Farm targeting:
Farms are targeted for advice and funding based on water quality data; including EA’s annual sampling data, flow readings from gauging stations. This allows the team to understand the approximate split of loadings from each of tributaries (i.e. rough source apportionment). Farmyard capital infrastructure:
The total £0.8M budget includes ~£120k for farmyard infrastructure improvements. Funding for farm improvements is flexible and can help build or upgrade any infrastructure which will bring about water quality benefit and is not already a legal requirement for the farmer. Typically funding covers 50% of the total cost of work, with the farmer expected to match fund the remainder. To date (2017) nearly £50k of grant funding towards infrastructure has been spent or committed across the whole Cober. Habitat surveys:
Along with addressing water quality UsT is also focused on finding solutions which benefit wildlife. There is a particular focus on improving the way semi-natural habitat is managed, especially habitats designated as County Wildlife Sites. To forward this objective the UsT Ecologist carries out whole farm surveys for habitats and species. These ensure that management and infrastructure solutions are also going to be beneficial for wildlife, by enhancing existing habitats. Under UsT (2015-2017) over 1100 Ha has been surveyed, of which 91 Ha has been on existing County Wildlife Site. The location of CWS sites in the Cober are marked in figure 12.
Figure 12: Map showing locations of the County Wildlife Sites in the Cober catchment

2017 Cober Catchment Management Plan
35
Outputs and Successes:
The outputs and successes of the UsT so far are listed in Table 14 below.
Number of farmers visited 24
Farm plans 14 Area surveyed 1173 Ha (of which 91 on
CWS)
Approximate number of capital infrastructure grants (spent or committed)
£48,000
Volunteer days 470 Table 14: Achievements in numbers (Cober WFD catchment) April 15 – Jan 17
Future of Upstream Thinking in the Cober: Officers are working with Environment Agency to assess potential for Natural Flood Management on farmland in the Cober. EA ‘opportunity maps’ show areas which both have the necessary topography for NFM while also providing a water quality benefit. Officers are ground-truthing this map to determine farmer interest, incentives needed, impact on biodiversity. Current EA funding is allowing us to incorporate more public engagement work in and around Helston. We are engaging with eating/drinking establishments to raise awareness of impact of Fats, Oils and Greases (FOG) down drains. These block up sewers and lead to flooding of waste into surfaces waters. In collaboration with the LPF Community Group the UsT plan to run a Yellow Fish campaign. This involves getting community groups involved in spray-painting a yellow fish onto surface water drain covers. The rationale being that this alerts others that they should not dispose of anything toxic in these drains as they connect to the Cober and in turn Loe Pool.
Under the PR19 it is likely that Upstream Thinking will continue to deliver land management and infrastructure improvements on farms throughout the Cober beyond 2020. It is possible that the current ground-truthing of NFM maps will pave the way for NFM-focused interventions which will reduce flood peaks in the Cober, create wetland habitats and provide settlement for runoff before it gets into the river. 3.2.7: Downstream Thinking Upstream Thinking has been match funded by Environment Agency, Natural England and Catchment Partnership Action fund. This has enabled the UsT project to be extended to cover downstream of the DrWPA. This funding, listed below, has allowed UsT staff to spend time and part-fund farmyard infrastructure throughout the catchment down to Loe Pool. So far UsT advisers have worked with tenant farmers in the Penrose Estate as well as National Truststaff. This has involved improving land management and upgrading infrastructure thus complementing the work that NT have been coordinating in the willow carr. The delivery of pollution reduction measures and habitat improvement downstream of the SWW intake is being funded by three grants (amounting to ~£120,000) which Catchment Coordinator has secured. These grants are:
1. £50,000 from Catchment Partnership Action Fund for Willow Carr restoration. This project is likely to become a DEFRA case study.
2. £48,000 from local WFD funding for CWT to work with problematic farms below official UsT area. The funding is for 3 years. As part of this project there was a Soil Awareness Day delivered in February 2016; the key speakers were Richard Smith (EA), Matt Shepard (NE) and Sonia Thurley (FWAG).

2017 Cober Catchment Management Plan
36
3. £20,000 from WFD for capital farm investment and feasibility study for removal an old slurry pit and introduction of reed beds in its place. This will cover investment on 5 farms which will be required to provide match funding.
3.3: Reducing Impact of Sewage Treatment Works
There are two main STW in the catchment; the SWW WWTW at Helston and the MoD’s works at RNAS Culdrose. Effort to improve the discharges from these waste water treatment works had been the role of the Point Sources Group up until 2014 when it was incorporated into the Catchment Group. The discharge permits are now managed directly by the EA with SWW and Kelda. The driving force behind the reduction in polluting discharge is now the WFD which has superseded the UWWT Directive targets. LPF are party to these discussions and continue to work with the EA, SWW, and Kelda to explore potential for even tighter standards.
3.3.1: Helston STW
SWW’s WWTW is situated below Helston and directly feeds into the Cober 1km above Loe Pool. As explained previously, this direct discharge means that there is less opportunity for drop out or uptake of phosphate by plants. As a result the impact of effluent is significant and thus lowering the discharge permit for Helston STW is of particular interest to LPF. Indeed, the P stripping technology installation in July 2003 had relatively quick and marked improvement for P levels Loe Pool. The current discharge permit for Helston STW is listed in Figure 13. The Helston STW final effluent discharge is shown in Figure 14; this includes the discharge levels for ammonia, orthophosphate and phosphorus. Figure 15 shows the discharge levels for BOD and Sld Sus. Figure 12 shows that typically the STW is running at below 2mgltr and within permit. Agreement has been reached between the EA and SWW, driven by WFD, that the permit will be tightened to reduce PO4 to 1mgltr by 2020.
Helston STW consent limits (mg/l):
max 95th %ile mean
BOD 56 20
NH4 27 7
TP 2
SS 30 Figure 13: Helston STW consent limits
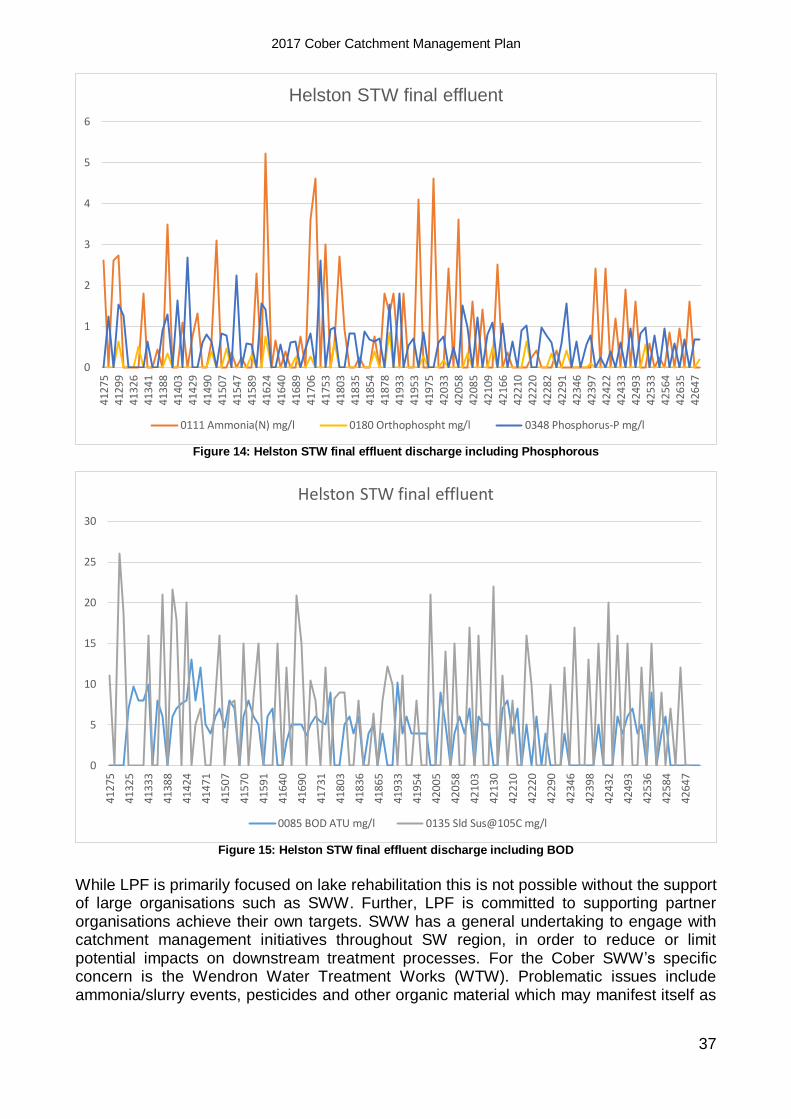
2017 Cober Catchment Management Plan
37
Figure 14: Helston STW final effluent discharge including Phosphorous
Figure 15: Helston STW final effluent discharge including BOD
While LPF is primarily focused on lake rehabilitation this is not possible without the support of large organisations such as SWW. Further, LPF is committed to supporting partner organisations achieve their own targets. SWW has a general undertaking to engage with catchment management initiatives throughout SW region, in order to reduce or limit potential impacts on downstream treatment processes. For the Cober SWW’s specific concern is the Wendron Water Treatment Works (WTW). Problematic issues include ammonia/slurry events, pesticides and other organic material which may manifest itself as
0
1
2
3
4
5
6
41
27
54
12
99
41
32
64
13
41
41
38
84
14
03
41
42
94
14
90
41
50
74
15
47
41
58
94
16
24
41
64
04
16
89
41
70
64
17
53
41
80
34
18
35
41
85
441
878
41
93
34
19
53
41
97
54
20
33
42
05
842
085
42
10
94
21
66
42
21
04
22
20
42
28
242
291
42
34
64
23
97
42
42
24
24
33
42
49
342
533
42
56
44
26
35
42
64
7
Helston STW final effluent
0111 Ammonia(N) mg/l 0180 Orthophospht mg/l 0348 Phosphorus-P mg/l
0
5
10
15
20
25
30
412
75
413
25
413
33
413
88
414
24
414
71
415
07
415
70
415
91
416
40
416
90
417
31
418
03
418
36
418
65
419
33
419
54
420
05
420
58
421
03
421
30
422
10
422
20
422
90
423
46
423
98
4243
2
4249
3
4253
6
4258
4
4264
7
Helston STW final effluent
0085 BOD ATU mg/l 0135 Sld Sus@105C mg/l
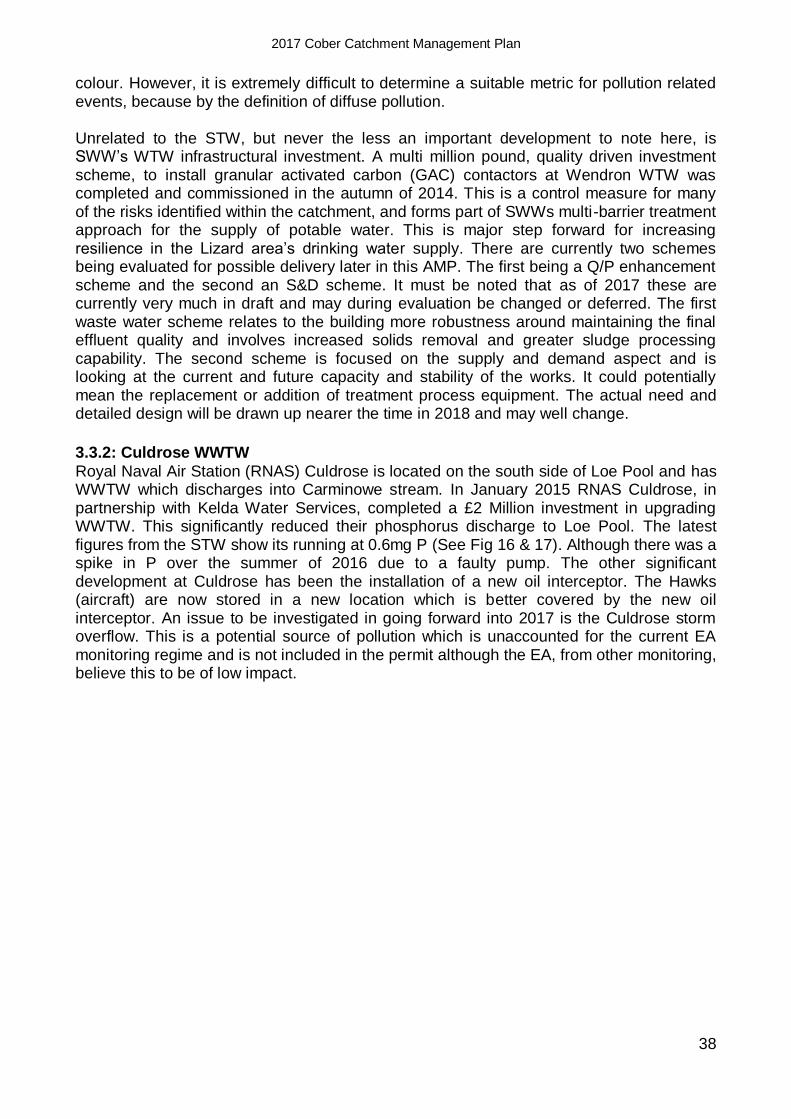
2017 Cober Catchment Management Plan
38
colour. However, it is extremely difficult to determine a suitable metric for pollution related events, because by the definition of diffuse pollution. Unrelated to the STW, but never the less an important development to note here, is SWW’s WTW infrastructural investment. A multi million pound, quality driven investment scheme, to install granular activated carbon (GAC) contactors at Wendron WTW was completed and commissioned in the autumn of 2014. This is a control measure for many of the risks identified within the catchment, and forms part of SWWs multi-barrier treatment approach for the supply of potable water. This is major step forward for increasing resilience in the Lizard area’s drinking water supply. There are currently two schemes being evaluated for possible delivery later in this AMP. The first being a Q/P enhancement scheme and the second an S&D scheme. It must be noted that as of 2017 these are currently very much in draft and may during evaluation be changed or deferred. The first waste water scheme relates to the building more robustness around maintaining the final effluent quality and involves increased solids removal and greater sludge processing capability. The second scheme is focused on the supply and demand aspect and is looking at the current and future capacity and stability of the works. It could potentially mean the replacement or addition of treatment process equipment. The actual need and detailed design will be drawn up nearer the time in 2018 and may well change.
3.3.2: Culdrose WWTW
Royal Naval Air Station (RNAS) Culdrose is located on the south side of Loe Pool and has WWTW which discharges into Carminowe stream. In January 2015 RNAS Culdrose, in partnership with Kelda Water Services, completed a £2 Million investment in upgrading WWTW. This significantly reduced their phosphorus discharge to Loe Pool. The latest figures from the STW show its running at 0.6mg P (See Fig 16 & 17). Although there was a spike in P over the summer of 2016 due to a faulty pump. The other significant development at Culdrose has been the installation of a new oil interceptor. The Hawks (aircraft) are now stored in a new location which is better covered by the new oil interceptor. An issue to be investigated in going forward into 2017 is the Culdrose storm overflow. This is a potential source of pollution which is unaccounted for the current EA monitoring regime and is not included in the permit although the EA, from other monitoring, believe this to be of low impact.

2017 Cober Catchment Management Plan
39
Figure 16: Culdrose STW Phosphorous discharge pre and post infrastructure upgrade
Figure 17: Culdrose STW Ammonia, Turbidity and PH discharge pre and post infrastructure upgrade
2017 Cober Catchment Management Plan
40
3.4: Reducing Impact of Other Point Sources
Nutrient inputs from other point sources are coming to the fore as actions to address gross inputs from the two STW, and from agriculture within the catchment, are advancing. The two main sources of concern for LPF are urban drainage and septic tanks. The following two section provide an update on both of these issues. 3.4.1: Urban Drainage and CSO’s The pollutants associated with urban runoff are many and vary widely depending upon the land uses and pollutant sources present in the local area. On average, urban runoff contains four to five times the N and between two and fifty times the P of water flowing from woodland (Harper, 1992)cited in Dinsdale, 1998). There is relatively little urban area (435ha) within the Cober catchment, most of which is represented by Helston, but added to this is 145km of road (CWT, 2005). The relative contributions of Helston’s urban drainage to the P budget of Loe Pool is set out in Appendix 6.1. Urban drainage was one of the potential sources of pollution to Loe Pool identified in the original 1998 CCMP. (Wilson & Dinsdale, 1998). In the 2009 CCMP (Dinsdale, 2009) are programme of four measures was proposed to address drainage risks: 1) to initiate a community education programme; 2) to negotiate improved street cleaning and maintenance of drains; 3) to assess the feasibility of screening physical litter and pollution loading from Helston road runoff and; 4) to investigate the potential for improvements to the combined sewerage systems. The initiation of a community education programme has received relatively little attention during the current (2009-2017) reporting period. Although part of the 2017 Community Group plans is Yellow Fish project planned with local schools. Street cleaning and maintenance of drains and Kennels (open drains in Helston) have always been a concern with regard to litter entering the Pool. Proposals for installing trash screens was discussed in depth at the Lake and Lower Cober Group meeting in 2016 (7/03/2016). It has been noted by NT Wardens that a significant amount of rubbish from Helston enters Loe Pool after rain events. However, the Cornwall Council representative explained that such a project is unfeasible. Trash screens become a flood risk hazard and have to be regularly checked and maintained. They would therefore need consent from the EA flood defence team. The Group decided not to not proceed with this project. Instead it was agreed that there needs to be a communication exercise with Helston community to raise awareness of the impact of rubbish on the Loe. Nevertheless the amount of litter and pollutants is not well understood and so has been added as an action point for the 2027 Plan, A combined sewerage system, accommodating both foul sewage and storm water within the same pipes, currently operates across the majority of Helston (Wilson & Dinsdale, 1998). During times of dry weather the sewage is treated before discharge. Following a storm event, overflow structures limit the volume that is carried to the STW and the excess, potentially a mix of storm water and untreated sewage is discharged into the River Cober. Such combined sewer overflows (CSO’s) are usually designed to operate when the current exceeds six times dry weather flow, but there is currently no information available regarding the discharge frequency of untreated sewage into the Cober (P. McNie, Principal Scientist, SWW, pers. comm). The EA Environment and Planning Team explain that CSO’s are difficult to model as no data is available on volumes or how many times CSO’s are set out (JD, 2017). Further, when sampling in wet weather any event discharge would get diluted so proportionally a CSO event would look less significant. As such the role of CSO’s remains an unknown factor. Investigation into CSO discharge in

2017 Cober Catchment Management Plan
41
Helston is an action point for 2017-18. This investigation will include looking at the connection between Helston CSO and SWW’s storm overflow tanks. 3.4.2: Septic Tanks With a large proportion of the total annual P load to Loe Pool contributed via the River Cober all potential sources of water pollution within the Cober Catchment require consideration. The urban areas of the catchment, i.e. Helston and Culdrose, are served by large WWTWs with P stripping capabilities to process domestic waste. However, in rural areas, sewage treatment facilities often comprise small, on-site, systems that are much less efficient at retaining P than larger works. Further, that these septic tank systems can be close to waterways and sensitive freshwater ecosystems (May et al., 2015). This is especially true of the Cober catchment which, as the EA Integrated Environmental Team explain, is a very well connected catchment with many small tributaries. And due to relatively densely populated rural nature of the catchment, septic tanks may contribute a significant portion of the P budget (Dinsdale, 2009). That said, a 2017 LPF discussion with the EA concluded that because tanks typically discharge into a small tributaries by the time pollutants reach Loe Pool they have been dispersed. As such the EA team suggested that septic tanks pose a low risk. Nevertheless, no quantitative analysis has been conducted in the Cober catchment to identify the locations of septic tanks nor their risk. The most recent information LPF possess about the risk of septic tanks is from a series of 4 Natural England commissioned reports. These are:
The impact of phosphorus inputs from small discharges on designated freshwater sites (NECR170)
Development of a risk assessment tool to assess the significance of septic tanks around freshwater SSSIs: Phase 1 – Understanding better the retention of phosphorus in the drainage field (NECR171)
Development of a Risk Assessment Tool to Evaluate the Significance of Septic Tanks Around Freshwater SSSIs (NECR222)
A review of the effectiveness of different on-site wastewater treatment systems and their management to reduce phosphorus pollution (NECR179)
These NE reports explain and emphasise the potential septic tank risk for the Cober catchment. For example, in theory septic tank systems should pose little risk to the environment, because much of the P discharged from the holding tank is removed from the effluent as it percolates through the soil in the drainage field or soakaway (May et al., 2015). However, based on available information, albeit limited, many septic tank systems do not function properly because they are incorrectly sited and/or improperly maintained26 (May et al., 2015). Regulatory or advisory action can of course be taken on dysfunctional tanks by the EA but they need to be located in the first place. No systematic nor comprehensive records of the distribution of septic tanks in the Cober catchment exist. In January 2015 new rules were introduced by the EA about how septic tanks will be regulated. Any septic tank, or small sewage treatment plant, must comply by law with the ‘general binding rules’ by ensuring the system is maintained and not causing pollution. The key points of the ‘general binding rules’ are:
Have the system emptied by a registered waste carrier regularly (at least once a year) to ensure it does not cause pollution.
26
Studies in Ireland have indicated that more than 80% of septic systems are probably not working efficiently. Anecdotal information indicates that the situation in England may be similar, though this has yet to be firmly established (May et al, 2015).

2017 Cober Catchment Management Plan
42
Maintain the system regularly, getting faults of problems fixed immediately. Limited to discharging 2,000 litres of treated sewage per day into the ground or
5,000 litres a day into flowing water. Installation of new septic tanks needs requires speaking to the Environment
Agency. Due the uncertainties in locating and regulating septic tank discharge the EA are taking the following approach. Firstly, an advisory approach through distribution of leaflets about the 2015 regulations to home owners. The leaflets also provide the EA hotline number (0800 80 70 60) for risks to be called in. These septic tanks leaflets are also part of a 2018 planned engagement exercise by the Community Group. Secondly, the waiting approach. The EA await house sales wherein new rules mean homeowners will have to declare septic tanks. Thirdly, and most importantly, in 2017 investigation into the septic tank risk has been taken on by the UsT project. The aim is establish the overall risk and the measures which environmental organisation can take to reduce it.
3.5: Monitoring Provision and Research
Under the WFD, Loe Pool was one of only four lakes in the South West to be assigned ‘surveillance’ water body status in 2000. Since 2007, the WFD have provided a long-term monitoring programme for Loe Pool. This has included repeat recording of a wide range of biological and physico-chemical variables, with progress measured against site-specific targets (WFD UK TAG, 2009). Since 2015 the monitoring regime has significantly expanded with the CWT UsT work and several intensive surveys conducted by the EA. In sum, the catchments monitoring provision, sampling resolution and research programmes are the most comprehensive they ever have been since the conception of LPF. And, most importantly, the surveys have all shown the same issues. The focus for LPF is now on stakeholder engagement and action. The problem sub catchments, farms, point sources and other pollution sources are well understood. The barriers to addressing pollution now primarily firmly rest with developing agricultural relationships, dissemination of advice, and financial support for infrastructural or management practice change. The efficacy of this approach was validated in 2017 by the EA’s Environment and Planning Team. The team concurred that engagement should be the priority. Rather than further spend on monitoring which would better detail risky fields the focus needs to be on working with farmers which are in a position to change practice for the benefit of water quality. The results from the 2009-2017 monitoring provision have been discussed throughout this report. What follows is review of other research which has been conducted since the last report.
3.5.1: LPF Walk Overs
In February 2013, January 2014 and January 2015 LPF organised catchment walk over events for partners. This method for understanding the catchment was inspired by the WFD Walk Over survey which was conducted in the Cober by EA on the 25/09/12. The LPF walk overs were also developed in response to discussions at LPF Catchment Group meetings about the lack of local knowledge around diffuse pollution, catchment geography and current farming practices. The walk over aims were to improve LPF partner’s tacit knowledge of the catchments: i) land practices; ii) pollution risks; iii) risk pollution pathways.
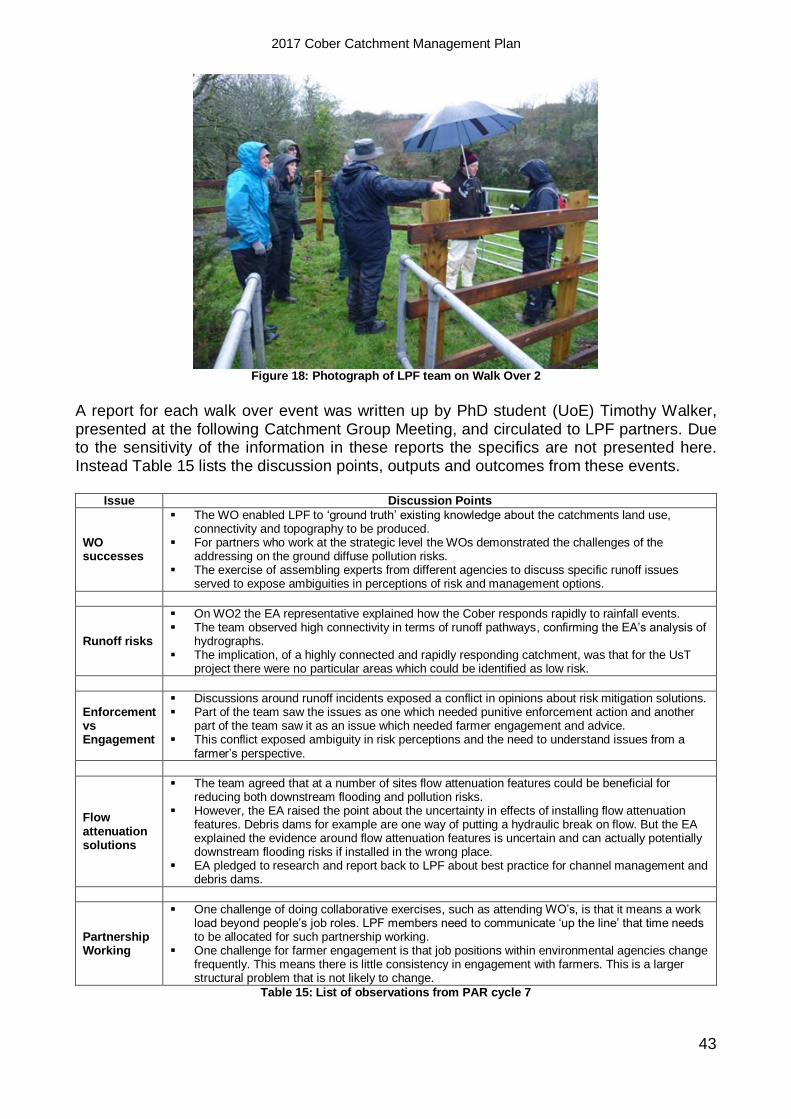
2017 Cober Catchment Management Plan
43
Figure 18: Photograph of LPF team on Walk Over 2
A report for each walk over event was written up by PhD student (UoE) Timothy Walker, presented at the following Catchment Group Meeting, and circulated to LPF partners. Due to the sensitivity of the information in these reports the specifics are not presented here. Instead Table 15 lists the discussion points, outputs and outcomes from these events.
Issue Discussion Points
WO successes
The WO enabled LPF to ‘ground truth’ existing knowledge about the catchments land use, connectivity and topography to be produced.
For partners who work at the strategic level the WOs demonstrated the challenges of the addressing on the ground diffuse pollution risks.
The exercise of assembling experts from different agencies to discuss specific runoff issues served to expose ambiguities in perceptions of risk and management options.
Runoff risks
On WO2 the EA representative explained how the Cober responds rapidly to rainfall events. The team observed high connectivity in terms of runoff pathways, confirming the EA’s analysis of
hydrographs. The implication, of a highly connected and rapidly responding catchment, was that for the UsT
project there were no particular areas which could be identified as low risk.
Enforcement vs Engagement
Discussions around runoff incidents exposed a conflict in opinions about risk mitigation solutions. Part of the team saw the issues as one which needed punitive enforcement action and another
part of the team saw it as an issue which needed farmer engagement and advice. This conflict exposed ambiguity in risk perceptions and the need to understand issues from a
farmer’s perspective.
Flow attenuation solutions
The team agreed that at a number of sites flow attenuation features could be beneficial for reducing both downstream flooding and pollution risks.
However, the EA raised the point about the uncertainty in effects of installing flow attenuation features. Debris dams for example are one way of putting a hydraulic break on flow. But the EA explained the evidence around flow attenuation features is uncertain and can actually potentially downstream flooding risks if installed in the wrong place.
EA pledged to research and report back to LPF about best practice for channel management and debris dams.
Partnership Working
One challenge of doing collaborative exercises, such as attending WO’s, is that it means a work load beyond people’s job roles. LPF members need to communicate ‘up the line’ that time needs to be allocated for such partnership working.
One challenge for farmer engagement is that job positions within environmental agencies change frequently. This means there is little consistency in engagement with farmers. This is a larger structural problem that is not likely to change.
Table 15: List of observations from PAR cycle 7

2017 Cober Catchment Management Plan
44
3.5.2: University of Exeter
Central to a catchment based approach is collaborative working with local research bodies. Since 2009 the research collaborations between the UoE Cornwall campus and LPF have been increasing. This has been driven in particular by the LPF coordinator who is also a Research Fellow at UoE. The recent research outputs (all available at: https://loepool.org/research-reports/camborne-school-of-mines/) have been:
2013 - A Paleolimnological Study of Past and Present Pollution at Loe Pool, Cornwall
2015 - Investigation into managing land use and pollution upstream 2015 – Mapping social and biophysical values of ecosystem services on a
catchment scale: a case study of the River Cober catchment, West Cornwall 2016 - Geographies of Risk, Uncertainty and Ambiguity - A Participatory Action
Research Project in Catchment Management
3.5.3: Camborne School of Mines
Founded in 1888 Camborne School of Mines (CSM) is world leading research and teaching institute based at Exeter University’s Cornwall Campus. Since 2014 Loe Pool Forum have been working collaboratively with CSM; specifically with Neill Wood the Programme Director for MSc Surveying and Environmental Management. This relationship has been extremely useful and productive for LPF. Useful with regard to the technical guidance about limnology NW provides at both the Lake and Lower Cober and Catchment Group meetings. Productive with regard to the research effort NW has turned towards studying the lake and lower catchment. The CSM Masters dissertation projects (all available at: https://loepool.org/research-reports/camborne-school-of-mines/), these include:
2013 – Could Helston have historically been a port settlement? 2015 – The potential to use electrical resistivity to enhance flood prediction 2015 – A study into the history of the bar and the development of a technique for
future monitoring as well as an insight into the geomorphology 2015 – A Hydrographic Survey of Loe Pool 2016 – Flood Capacity Modelling and Flood Inundation on the River Cober 2016 – Historic Landfill Investigation: An Environmental Survey of the Penrose and
Fairground historic landfill sites
3.6: Rehabilitation of the River Cober and Loe Pool
Historically the approach to catchment management in the Cober has been characterised by the traditional engineering schemes and a ‘command-and-control’ approach. Driven by the flood risk priorities in Helston there has been a preference for hard engineering solutions such as canalising the river and concrete flood defences27. However, since 2009 there has been an increasing recognition locally, and a DEFRA policy drive, for the efficacy of an integrated approach to catchment management in order to address both the flood and pollution risks. An integrated approach to catchment management is particularly important for the Cober because of the interdependent factors. For example, rehabilitation of the lake is dependent on natural fluctuations in water levels. Achieving this is dependent on the plans for the Helston Flood Alleviation scheme (FAS); in particular the possible water release settings on the new adit to be built at Loe Bar. Success of the FAS is in turn dependent on the upstream land management regimes which impact the quantity and
27
See LPF 2009 Catchment Plan (p32) for a comprehensive review of the historical approaches to managing the lower Cober.

2017 Cober Catchment Management Plan
45
timings of water flows reaching Helston. Since 2009 much progress has been made towards developing plans for sustainable catchment management. Most importantly these plans have been coordinated, thanks to LPF members, to ensure the outcomes are best for reducing both flooding risk in Helston and the rehabilitation of the lake. Starting at the top of the catchment, the following sections provide an update on: 1) flow attenuation features in the upper catchment; 2) Helston FAS; 3) river channel rehabilitation in the lower Cober; 4) lake level management.
3.6.1: Upper Catchment Management
Little LPF attention has been paid to the potential role of the upper catchment in reducing flood risk prior to 2009. This has been because of EA catchment modelling conclusions. EA analysis has shown that flood events correlate to lake levels and thus points to the, historically accepted, conclusion that flood risk is primarily driven by ‘water backing up’ from the lake. The EA’s conclusion is that land management upstream, i.e. flow attenuation, makes no difference to the peak flow on the hydrograph at Helston; important to note is this EA’s flood model assumes that the catchment is 100% saturated. As such the historical approach has been to get water away from Helston as fast as possible through river canalisation. The alternative hypothesis is of course that flood risk in Helston is exacerbated by upstream catchment flows. As of 2017 there is not sufficient evidence to explain the proportional role of upstream flow to flood risk in Helston. From a LPF perspective any upstream flow attenuation features would have benefit for Loe Pool by slowing pollutant transition to tributaries. Further, DEFRA policy (set out at the 2016 SW Regional Flood Risk Management Committee Conference) and subsequently the Cornwall Catchment Partnership are now steering towards natural flood management. The rationale being the multiple benefits of soft engineering, habitat creation and flood attenuation. However, there are potential flood risks attached to changing upstream flow regimes. In 2016, at a LPF Catchment Group meeting, a EA Flood Risk modeller explained the issue of ‘flood synchronisation’; “in the upper catchment it is always about aiming to slow the flow, in the middle part of the catchment the research is not conclusive about what to do, in the lower part of the catchment the aim is to get water through and away from places of risk”. It was also explained that you would need many upstream storages and rain harvesting interventions to only make a small difference to flow downstream. Taking account of the risks and benefits there are now plans, as part of UsT, to trial installing flow attenuation features and ponds in upstream areas of the Cober. EA flood risk modellers are likely to be supportive of these ponds as they will be in the upper catchment area. Investigation into the potential of natural interventions are also being investigated, by EA’s Tom Fletcher, in the St Austell Bay and Par catchments. In 2016 NE’s Tom Eddy has modelled the Cober for where best to locate these interventions. The map outputs from this were discussed at a UsT meeting is November 2016. These maps were based on the rolling ball maps (overland flow) combined with phosphate and ammonia data (near dairy farms being hotspots). Agreement from partners was that a ‘ground truthing’ exercise needed to follow due to the inaccuracy problems with the rolling ball model (i.e. hedges not included). In sum, LPF have moved markedly closer to developing a holistic approach to catchment management thanks to the UsT commitment to natural flood management. 3.6.2: Helston Flood Alleviation Scheme The EA has a statutory duty to reduce flood risk through funding defence projects. At the strategic regional scale this process is organised through the West Cornwall Catchment

2017 Cober Catchment Management Plan
46
Flood Management Plan (CFMP). This document sets out the preferred, by regional partners, options for sustainable flood risk management over the next 50 to 100 years. Helston is cited as having “high levels of flood risk…with 200 properties at risk” (EA), 2012: 16), and that the “existing flood risk management actions do not adequately deal with river or surface water flood risks” (EA, 2012: 18). In partnership with local stakeholders it is the EA’s responsibility to address this flooding risk. The CFMP will be delivered locally through the Helston Flood Alleviation Scheme (FAS). This scheme has been in development and consultation since 1998. In 2013 the engineering company Black and Veatch produced an Appraisal Long List of Options (B&V project no: 122234) on which the local stakeholders, including the public, NT, NE and CC, were consulted on. In 2015 the EA sought approval on the business case for the FAS, following this there was a stakeholder and public consultation event in 2016 at Helston. At this event the EA alongside Arcadis Consulting, consultants developing FAS plans, presented a series of posters which explained the rationale behind scheme and the planned works; all of these can be found in Appendix 6.5. The shortlisted options set out in the figure below.
Figure 19: FAS shortlisted options for Loe Pool and the River Cober
The chosen scheme for Loe Pool and the Cober are set out in the next two figures. From a LPF perspective there are two keys points to highlight from the chosen scheme. Firstly, modified penstocks with a lower invert and a tilting weir which will allow greater control of water level in Loe Pool and lower the resting level if required. As discussed fully below, this will assist rehabilitation of Loe Pool. Secondly, the scheme supports installation of upstream water storage. EA support for upstream flow attenuation will have benefits for reducing diffuse pollution.
2017 Cober Catchment Management Plan
47
Figure 20: Chosen scheme for Loe Pool
2017 Cober Catchment Management Plan
48
Figure 21: Chosen scheme for the Cober
2017 Cober Catchment Management Plan
49
Helston FAS has been developed in parallel with the Loe Valley Maintenance Agreement and the Loe Pool Water Level Management Plan. This integrated approach to catchment management has been crucial for developing sustainable plans which both reduce flood and pollution risks and benefit habitats. LPF partners, NT and NE in particular, have been at the centre of these FAS negotiations. As such the success of the FAS shows the importance of LPF and the efficacy of partnership working to deliver integrated catchment management. 3.6.3: Lower Cober Maintenance
Management of the lower Cober is directed by the Loe Valley Maintenance Agreement (2016). This agreement covers the river, bank and flood plain management between Zachary’s bridge and the Cober’s entrance to Loe Pool. From a LPF perspective the rationale behind the river maintenance regime is that natural recovery, of the form and function of the lower reaches of the Cober, would benefit habitat and reduce sediment loading to Loe Pool; whilst not increasing upstream flood risk. In the 2009 CCMP the next steps to deliver best benefit to in-channel and bank-side habitat were:
1: Ensure channel de-silting is kept to a minimum. 2: Allow and encourage the establishment of tree cover on both bank sides within the second reach 3: Retain woody debris in stream where this does not increase flood risk. 4: Allow natural river processes, including bank erosion, to develop unhindered 5: Continue to seek Local Nature Reserve (LNR) designation
Much progress has been made on these ‘next steps’ since 2009. Progress includes two major steps. Firstly, the Willow Carr project which has reconnected the Cober to the flood plain. Secondly, a 2016 revised Loe Valley Maintenance Agreement. Willow Carr project:
The Loe Valley Carr forms part of the NT’s Penrose Estate. It is at the head of the Loe Pool and within the wider catchment of the River Cober. The Loe Valley Carr covers an area of 20ha and consists largely of grey willow (Salix cinerea), alder (Alnus spp.) with common reed (Phragmites australis) locally dominant (NVC W2, wet woodland) (PAA, 2014). The Carr is incorporated into the SSSI designation. In 1946 this waterlogged wooded terrain was disconnected from the flood plain when the Cober was originally channelized and straightened. It has long been the objective of LPF to reinstate natural flows in the lower Cober. In 2014 the NT commissioned Penny Anderson Associates Ltd (PAA) to conduct a hydrological study of the Carr. They were asked to determine if re-flooding (re-naturalising by enabling the river to breach its banks and meander) the area would increase the flood risk in Helston. This investigation concluded that it would not increase flood risk. Subsequently the NT have conducted a series of works in 2016 to reconnect the Cober to the Carr. This has involved cutting through the Cober banks on its western side and installing a series of pipes with non-return valves (see picture below) which enable re-flooding. As well as improvements to the habitat, retaining and increasing public access to the Carr and on to Loe Pool is also a priority for the NT. As such re-surfacing on a stretch of footpath has been carried out to improve public access. The success of this project has been because of NT ambition to improve habitat along with an evidence based approach to ensure flood risk was not increased. Crucial to note is that this project has been finically backed, see section 3.2.7 for details, by the Catchment Partnership Action Fund.

2017 Cober Catchment Management Plan
50
Figure 22: Photograph of pipe laying into the Willow Carr
Loe Valley Maintenance Agreement: The Loe Valley Maintenance Agreement was reviewed in 2016 in conjunction with developing Helston FAS. The agreement has been developed by EA consultant engineers in conjunction with EA. The underpinning rationale is that the agreement will help achieve favourable conditions for the SSSI and work towards implementing the Mitigation Measures for the WFD targets. The proposals are set out in the following figure and at the time of writing are out for consultation with NE and NT.
Figure 23: Principles of the Loe Valley Maintenance Agreement
3.6.4: Loe Pool Water Level Management
A Water Level Management Plan (WLMP) provides a means by which the water level requirements for a range of activities, in this case flood risk management and conservation, can be balanced and integrated within a Site of Special Scientific Interest

2017 Cober Catchment Management Plan
51
(SSSI) (EA, 2016b). The revised28 Loe Pool Water Level Management Plan was proposed in 2016 as part of the FAS and at the time of writing is out for consultation with NE and NT. The fundamental drive from a LPF perspective is that natural water levels (i.e. high in winter, low in summer) are restored in order to assist the restoration and maintenance of Loe Pool’s SSSI in favourable condition. The primary objectives for managing water levels (stated in the 2016 WLMP) within Loe Pool are:
To create a more naturally functioning water regime to support the designated interest features. Seasonal fluctuation
Improvement to the water quality of the Loe Pool SSSI Implement a programme of improvement works to ensure that the management of water
that affects the SSSI condition Work towards the natural seasonal variation of water levels within the Loe Pool To enhance the marginal habitat creating draw down zone To allow winter flooding benefitting the Willow Carr without compromising the footpaths To enable emergency flood response without damaging the SSSI features Manages the best environmental outcomes except in high flood risk situations where flood
risk management would become the priority. An agreed criteria for managing desired high levels in the pool for environmental
enhancement. This will focus on the criteria for lowering the pool using the control structure for lower order events and in the extreme events implementing the emergency relief culvert operation. In the latter it will also need to agree the criteria for the culvert to be backfilled as the aspiration is it will not be left exposed for long periods of time
The recommendations set out in the 2016 WLMP will allow for a natural fluctuation in the water level of Loe Pool between +2.00mAOD (April – September) and +4.45AOD (October – March) to coincide with the natural regime during the summer and winter seasons (EA, 2016b). Implementation of these recommendations (see 2016 WLPM for full list of recommendations) will have the following effects:
Allowance for passage of fish and eels through the existing tunnel and inlet structure between spring and autumn during spring tides;
Improved water level management, as water levels within Loe Pool will be more easily controlled as a result of the works;
Enhanced ecology, as the scheme enables a lowering of water levels between spring and summer to allow more light to reach the bottom of the pool thereby enhancing aquatic plant growth; as well as
Enhancing ecology, as submerged areas around the Loe Pool will become exposed due to a reduction in water levels and therefore terrestrial habitat will be restored. In addition, the increases in water movement and flushing should improve water quality and reduce stagnation and the occurrence of algal blooms.
In sum the coordinated development of the WLMP should enable a plan to be agreed on which will improve rehabilitation of Loe Pool.
3.7: Community Engagement
Community engagement has always been an Objective for LPF. The rationale is twofold. Firstly, the Loe Pool rehabilitation process is driven by the rationale that access to the natural environment improves community wellbeing. Secondly, improving Loe Pool’s water
28
See ‘Loe Pool Water Level Management Plan 2016’ (EA, 2016b) and www.loepool.org for more detail and the previous WLMP agreements.

2017 Cober Catchment Management Plan
52
quality and in turn habitat and wildlife is dependent on domestic changes to reduce pollution. As such promoting access and understanding of the catchment issues will have mutual benefits for the community and the environment. LPF agree that a ‘top-down’ policy approach alone will not yield the desired end targets nor will it develop community ownership which is essential for its delivery (Pretty and Smith, 2004). The LPF Community Group are charged with promoting access to Loe Pool and improving public understanding of the catchment issues. Since 2009 this work has centred on and achieved the following: Website and Media Communications: The most significant development, with regard to
LPF pubic communications, has been the development of the LPF website https://loepool.org/, blog and twitter presence in 2014. The website is a public and partner facing site which provides an overview to LPF, updates up LPF activity and a repository for research conducted in and around the catchment. The website has received local, national and international visitors. From which new research relations with CSM and UoE have been established to the benefit of LPF. However, the most read articles have been those focused on local Helston issues. The plan for 2018 is for the website to be re-framed for a non-technical audience and to highlight the local issues, personal stories and environmental successes. School and College Engagements: Over the last 10 years the National Trust have annually supported the Helston College yr9 field trip to Loe Pool. This has been a great success in terms of educating the local younger people to environmental issues and how their lifestyles and domestic behaviours affect habitats and wildlife. Alongside this regular engagement, the NT and LPF have enabled the following events:
2013 – A UoE (Centre for Geography, Environment and Society) and student field trip for the Geo2426/2426b Environmental Policy and Politics Water at a Local Scale module.
2016 - A Helston Community College PSHE day trip to Loe Pool and RNAS Culdrose. This was part of the Healthy Living Project (HCC’s PCHE program). 200 student’s attended.
2016 – Student photo competition with Helston College. On the field trip students were asked to photograph something which represents the theme ‘Healthy Helston’. The LPF Catchment Group judged the winner who was awarded a £10 meal voucher to the Stables at Penrose and 2 bottles of Penrose apple juice In general, the LPF message is communicated as often as possible during every school visit to Penrose.
Public Engagements: The primary point of engagement between the public and LPF are the NT Rangers. The Rangers are out on the NT land around Loe Pool and regularly strike up conversations with the public to explain why and how they are managing the land. In doing so the message about Loe Pool’s pollution issues is communicated. The Rangers captured footage of an otter at Loe Pool in 2016 and used this as a tool to communicate and demonstrate the positive outcomes of the LPF. This was a tangible measure of success for the public and really captured imaginations. Alongside this the NT Head Ranger delivers talks to community group. Each of these talks have had a substantial section on Loe Pool, its significance, historical changes in water quality, threats, formation of LPF, and its partnership working. In 2016 the NT Head Ranger has delivered talks to West Cornwall Footpaths Society, Madron Historical Society, Porthleven Ladies Circle, Porthleven WI, and Helston Old Cornwall Society. It is estimated that a total of 150 people attended these events. Alongside this the NT Rangers regularly support university visits to

2017 Cober Catchment Management Plan
53
the Pool and Bar. For example, in 2016 the Rangers guided Plymouth and Aberdeen Universities. LPF Executive Group believe this is one of the most effective ways to get the LPF message into the community. The effectiveness being with embedding the pollution message in local history and environmental change. Going forward LPF, specifically the Community Group, aim to deliver more of these types of engagement events. Especially as many groups are looking for speakers. The Ranger team also have local volunteers on board, who come regularly every Thursday to assist with practical conservation tasks. 90% of the time they are working within the SSSI on habitat improvements. Working with the local community in this way helps to instil a sense of ownership for Loe Pool.
4.0: Management Plan 2017 - 2027 This section sets out the management measures planned for the period 2017 to 2027. These comprise of both on-going measures from the 2009 CCMP and new measures adopted since 2009. The approach to delivering these measures is as follows: Responsibilities: The management measures have been assigned to each LPF subgroup. As explained in the Management Strategy Review, each subgroup have a number of working themes under which the management measures are organised. The organisation which chairs each sub group will lead on achieving measures in collaboration with partners. Phases: The management measures are divided into 4 phases. Phase 1 includes all measures which are to be completed on an annual basis. Phase 2 runs from 2017 to 2019. Phase 3 runs from 2019 to 2022. Phase 4 runs from 2022 to 2027. The procedure, overseen by the Executive Group on an annual basis, is that the Plan will be used as working document. Sub groups will review and update the planned measures at each bi-annual meeting. As such the following plans will be first consulted on with LPF partners in the 2017 Spring meetings.
4.1: Lake and Lower Cober Group
The Lake and Lower Cober group are working to deliver 3 of the 4 LPF Objectives, namely:
1. Water Quality: To bring about a change in Loe Pool from an algae-dominated turbid
water state to a macrophyte-dominated clear water state, characteristic of mesotrophy. 2. Water Levels: To restore hydrological function throughout the river catchment in order to
bring sustainable flood management. To instate natural seasonal fluctuations in lake water levels to create conditions for a more diverse shoreline and submerged flora. 3. Nature Conservation: To maximise the biodiversity value of Loe Pool and enhance the
biodiversity value of its catchment.
The LPF Objectives fit closely with statutory requirements for the Lake and its catchment through both the Water Framework Directive (WFD) and Site of Special Scientific Interest (SSSI) legislation. Under the WFD, the Environment Agency currently class the Ecological Quality of the River Cober (both WFD waterbodies: Upper and Lower catchment) and Carminowe as ‘Moderate’. The predominant failing elements across these 3 WFD waterbodies are related to high nutrient levels in the water (phosphate and diatoms) and increased metals (copper and zinc). Improvement of all failing elements is required in order to reach ‘Good’ Ecological Quality for both the River and the Lake; the current timescale for this is by 2027.

2017 Cober Catchment Management Plan
54
The Lake also fails to reach the targets required for the SSSI, with its condition being currently defined by Natural England as ‘unfavourable no change’. The elements and reasons for its failure include the poor diversity and low abundance of aquatic plants, the inappropriate water levels and water pollution (from both point and diffuse sources, including waste water treatment works and agriculture). The Environment Agency, Natural England, the National Trust, Cornwall Council and local Colleges and Universities are working toward these common goals in partnership as the Lake and Lower Cober Group. The group has three working themes:
1. Water Levels: Improve management of water levels in Loe Pool and the River Cober
floodplain.
2. Research & Monitoring: Promote ecological, and broader limnological, research studies
and monitoring of Loe Pool.
3. Management: Improve management of Loe Pool, its margins and the River Cober flood
plain to increase flora, fauna and natural processes.
In 2017 - 2027 the work of the Lake and Lower Cober Group will focus on the following items and be jointly led on by the National Trust and Natural England: 1. Water Levels: Improve management of water levels in Loe Pool and the River Cober floodplain.
Measure Lead
Annual 0.1: Continue to review the EA’s water level monitoring data.
All
2017 – 2019
1.3. Complete Loe Valley carr “leaky dam” project and continue to monitor impacts. Consider future projects
NT
2019 - 2022
2.1: Implement and monitor impacts of revised WLMP, modifying the
plan as necessary to further objectives. 2.1: Work in collaboration with the EA's National Capital Programme
Management Services (NCPMS) over the implementation of Helston’s Flood Alleviation Scheme (FAS). 2.2: Agree, develop and begin implementation of a revised Water Level
Management Plan (WLMP) that will deliver larger seasonal fluctuations, in order to work towards SSSI, WFD and the Forum’s own objectives for Loe Pool (in coordination with FAS).
All All NE & NT
2022 - 2027
2. Research & Monitoring: Promote ecological, and broader limnological, research studies and monitoring of Loe Pool and Lower Cober floodplain
Measure Lead
Annual
0.1: Work with the Community Group to increase work experience
placements and research opportunities with local schools, colleges and UoE. 0.2: Continue to work on the Strapwort re-introduction and monitoring
project. 0.3: Input to the LPF Research Agenda, to be collated and distributed
by the Community Group to UoE academics. 0.4 Monitor water levels along Lower Cober and within Loe Valley carr using equipment put in as part of carr rehabilitation project
All NT & WWCT UoE NT

2017 Cober Catchment Management Plan
55
2017 - 2019
1.1: Feasibility study of lake targets. CSM and UoE specialists 1.2: Direct liaison with Neil Wood (CSM) re possible projects for 2017,
including: i) Willow Carr NVC survey; ii) field by field survey of soil condition around Pool; iii) turbity and temperature analysis of Loe Pool to establish whether out of catchment water inputs are inhibiting lake rehabilitation. 1.3: In collaboration with the Community Group, disseminate publicly interesting information from Adrian Spalding's book on Sandhill Rustic Moth’s. 1.4: Drone mapping of pool and margins. 1.5: Further research and development of fish management plan and
bio manipulation for Loe Pool; plan to enrol a fresh water biologist from UoE Cornwall Campus to guide rehabilitation process and inform on realistic targets.
CSM All NT & NE NE & ESI NE & NT
2019 - 2022
2.1: Investigate SWW and RNAS Culdrose CSO’s/storm drains. SWW
investigation should include looking at the infrastructure connection between Helston CSO and SWW’s storm overflow tanks. 2.2. Conduct Macrophyte monitoring survey, both transect and grapple
methods, every 5 years. CSM Turbity analysis to inform when conduct Macrophyte survey.
EA EA NT & NE
2022 - 2027
3.1: Liaison with Neil Wood (CSM) re possible CSM projects: i) further work on Helston tip including impacts of removal on hydrology and flooding;
3. Management: Improve management of Loe Pool and the River Cober flood plain to increase flora, fauna and natural processes
Measure Lead
Annual
0.1: Seek to maintain and improve flow connections between the Cober
and the Willow Carr through maintenance of leaky dams and further measures as deemed appropriate following monitoring of impacts (see Water Levels section above) 0.2 Carry out invasive species control as needed to prevent spread including Himalyan Balsam, Skunk Cabbage, and Parrot’s feather
NT NT
2017 - 2019
1.1: Continue to support Strapwort reintroduction project through
planting and site management. Work with Community Group to promote success of project via online media. 1.2: Develop and implement Carminowe Creek grazing scheme in
liaision with NT tenant (to include strapwort re-introduction site). 1.3: Follow up fish survey recommendation to install fish exclusion
zones in Carminowe Creek (initially by seeking further advice on potential value)
NT NT NE
2019 - 2022
2.1: Plans being developed, and funding in place (from UST &
Catchment Partnership Action Fund), for restoration of Weeth tributary stream including the sure-ing up of the slurry pits. 2.2 Develop & seek to implement plans for fish exclusion zones in
Carminowe Creek if deemed worthwhile at this stage.
CWT NT/NE
2022 - 2027
3.1:
Table 16: Lake and Lower Cober Group working objectives
2017 Cober Catchment Management Plan
56
4.3: Catchment Group
The Catchment Group are working to deliver 4 of the 4 LPF Objectives, namely:
1. Water Quality: To bring about a change in Loe Pool from an algae-dominated turbid
water state to a macrophyte-dominated clear water state, characteristic of mesotrophy. 2. Water Levels: To restore hydrological function throughout the river catchment, in order to bring sustainable flood management. To instate natural seasonal fluctuations in lake water levels, to create conditions for a more diverse shoreline and submerged flora. 3. Nature Conservation: To maximise the biodiversity value of Loe Pool, and enhance the biodiversity value of its catchment. 4. Community Involvement: To interest and engage individuals and the local community
in the management of Loe Pool and its catchment; and to raise the profile of the Loe Pool project, both locally and further afield.
While the Catchment Group is working towards the delivery of all elements to the Objectives, the particular focus for the Group is upstream water quality and quantity. The Group purpose is to influence land management across the River Cober catchment; aiming to improve soil water retention and to reduce diffuse sources of nutrients and agrochemicals. These activities will contribute to reducing flood risk in Helston, and improving the ecology of the River Cober and Loe Pool. From 2014 the Catchment Group also incorporates the Loe Pool Forum Point Sources Group. As such the Group is working to improve the discharges from: i) SWW waste water treatment works; ii) RNAS Culdrose waste treatment works; and iii) private sewerage (e.g. small treatment plants and septic tanks) within the catchment. The group has four working themes:
1) Research & Monitoring: Increase understanding of the sources of the nutrient and
sediment load into Loe Pool, tributary flows, and areas of upstream water storage. 2) Discharge Permits: Reduce nutrient inputs from point sources within the catchment. 3) Diffuse Pollution: Undertake evidence-based action on farm holdings and domestic
properties within the catchment. 4) Flood Alleviation: Work upstream on flow attenuation features, and seek to influence (and add value to) the Helston Flood Alleviation Scheme
With the start of the new SWW-funded ‘Upstream Thinking’ (UsT) catchment initiative for the Cober, Cornwall Wildlife Trust (which delivers the project) has joined Natural England, the Environment Agency, South West Water, the MoD, Kelda Services, and the Rural Payments Agency to work toward these common goals in partnership as the Loe Pool Catchment Group. In 2016-27 the work of the Catchment Group will focus on the following: 1. Monitoring and Research: Increase understanding of the sources of the nutrient and sediment load into Loe Pool, tributary flows, and areas of upstream water storage.
Measure Lead
Annual
0.1: Utilise evidence from the EA WFD Catchment Walkover Survey. 0.2: Utilise SWW Trenear raw-water data in Group and external risk mapping projects. 0.3: Utilise UST baseline and ongoing monitoring data. 0.4: Continue to ‘pathway check’ the ‘Rolling Ball’ model maps, and use to improve group understanding of runoff risks and bespoke management options. 0.5: Research and analysis into the agricultural economy within the catchment
boundary.
All UsT All All UoE

2017 Cober Catchment Management Plan
57
2017 - 2019
1.1: Further monitoring of diffuse pollution sources to be conducted in
partnership with SWW UST project (2015-2020). CWT
2019 - 2022
2.1: Work towards a better understanding of the load septic tanks represent
as a nutrient source. Private sewerage is still thought to be a significant issue for Cober catchment; further study/action to be included within SWW UST project.
All
2022 - 2027
3.1: Monitor sediment loading to Loe Pool. CSM
2. Discharge Permits: Reduce nutrient inputs from point sources within the catchment
Measure Lead
Annual
0.1: Ongoing compliance and watching brief on discharge permits. 0.2: Continue to monitor flow and nutrients in Carminowe Stream. Assess
whether further tightening of the existing permit standards at Culdrose WWTW is feasible and/or required.
EA EA
2017 - 2019
1.1: Environment Agency, South West Water and Kelda to work together to
explore potential to get WWTW P discharge to less than 1mgl-1, and potentially also less chemicals used by 2018.
EA
2019 - 2022
2.1:
2022 - 2027
3.1:
3. Diffuse Pollution: Undertake evidence-based action on farm holdings and domestic properties within the catchment.
Annual
0.1: Continue to employ evidence from the EA WFD Catchment Walkover Survey (report available) to guide farm engagements and action. 0.2: Environment Agency to continue to sharing nutrient data with Upstream
Thinking project. This will ensure, as far as possible, action is taken to address known sources of nutrients within the catchment. 0.3: Take a broad approach to raise awareness of the water quality issues,
with both landowners and the broader community across the catchment. This will include: i) Engaging with landowners; ii) Agricultural training days on soil/water/nutrient management, held within catchment, with input from Forum; iii) Working with the Loe Pool Community Group to help inform their community engagement with regard to catchment-scale working; to deliver healthy wetlands, rivers and lake. 0.4: Hold regular meetings of all farm advisers who are working in the
catchment (NE advisers, EA Environment Officers, and Cornwall Wildlife Trust UsT farm advisers); to take a co-ordinated and effective approach to address sediment, nutrient, manures and pesticide sources across the catchment. Repeat 2014 ‘wet day out’ annually for knowledge sharing and development.
All All UsT & NE All
2017 - 2019
1.1:
2019 - 2022
2.1:
2022 – 2027
3.1:

2017 Cober Catchment Management Plan
58
4. Flood Alleviation: Work upstream on flow attenuation features and seek to influence, and add value to, the Helston Flood Alleviation Scheme
Measure Lead
Annual 0.1: Work to ensure the Flood Defence Review gives full recognition to the important role land management in the Cober catchment has on the flood risk to Helston.
All
2017 - 2019
1.1: Farm advisers to tailor their advice and funded capital-works to increase
the potential for water storage capacity on farmed land within the catchment. CWT, NE & EA
2019 - 2022
2.1: Identify target farms where water storage, (e.g. wetland creation), is
going to be most effective, and co-ordinate funding for delivery of advice and appropriate intervention through CSF, UsT and NELMS targets.
CWT, NE & EA
2022 – 2027
3.1: Engage with Highway Agency and Council on road runoff issues. All
Table 17: Catchment Group working objectives
4.4: Community Group
The Community Group is primarily working towards the delivery of the LPF Community Involvement Objective 4.
4. Community Involvement and Communication: To interest and engage individuals and
the local community in the management of Loe Pool and its catchment and to raise the profile of the Loe Pool Project, both locally and further afield.
Under this Objective the Community group have three working themes;
1) Communication: Communicate and promote the work of LPF to the local community, visitors and professional networks.
2) Educational Action: Reduce domestic pollution in the catchment through educational
action 3) Engagement: Collaborate with local stakeholders and UoE researchers on catchment
focused projects.
The National Trust and University of Exeter will take lead on this work and in 2017 - 2027 will focus on:
1. Communication: communicate and promote the work of LPF to the local community, visitors and professional networks
Measure Lead
Annual
0.1: Maintenance and development of the www.loepool.org website. The primary purpose of this site is to serve as an informational resource. The secondary purpose is to serve as an outlet for LPF news on catchment management and progress towards targets. 0.2: Use social media to drive interest in Penrose and Loe Pool amongst visitors and the local community. Post regular updates on the LPF website and Twitter, NT Facebook site, NT Blog and NT Penrose website. 0.3: Ensure LPF provides regular press releases and local media coverage, at least 6 times per annum. 0.4: Face-to-face communication from the Trust’s Penrose Ranger team with visitors and the local community promoting the ‘Bringing the Pool back to life’ theme.
UoE NT & UoE UoE NT
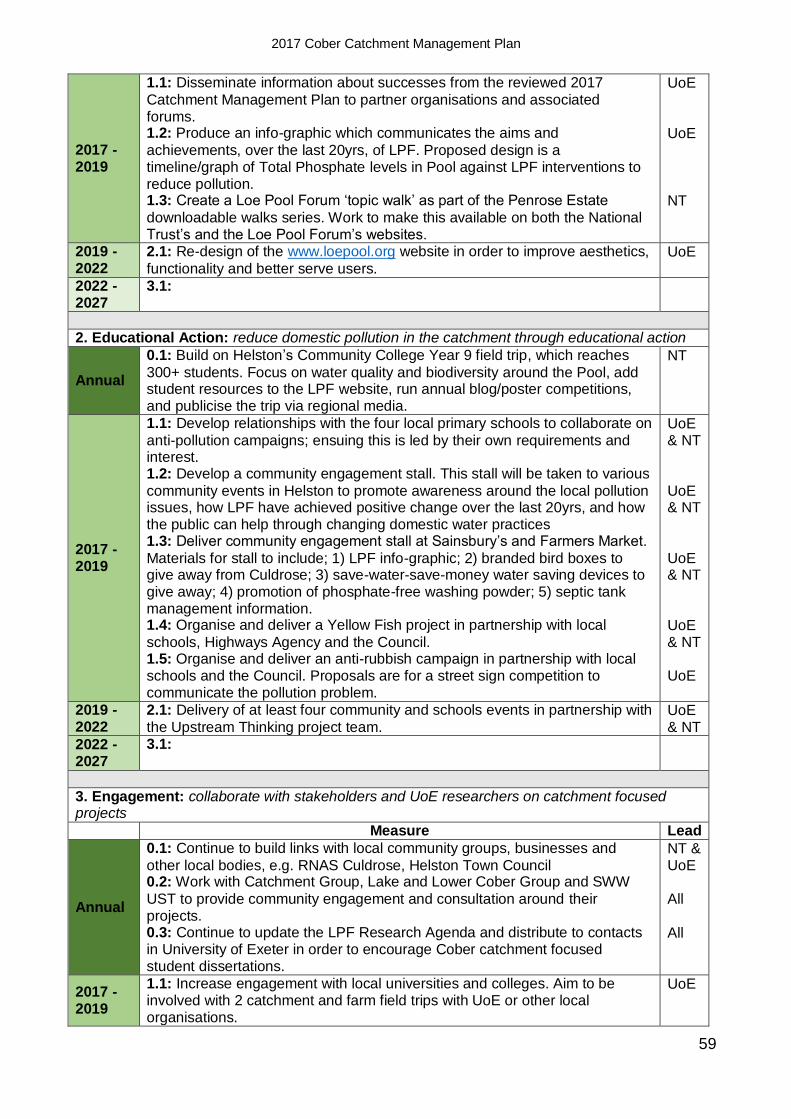
2017 Cober Catchment Management Plan
59
2017 - 2019
1.1: Disseminate information about successes from the reviewed 2017
Catchment Management Plan to partner organisations and associated forums. 1.2: Produce an info-graphic which communicates the aims and
achievements, over the last 20yrs, of LPF. Proposed design is a timeline/graph of Total Phosphate levels in Pool against LPF interventions to reduce pollution. 1.3: Create a Loe Pool Forum ‘topic walk’ as part of the Penrose Estate
downloadable walks series. Work to make this available on both the National Trust’s and the Loe Pool Forum’s websites.
UoE UoE NT
2019 - 2022
2.1: Re-design of the www.loepool.org website in order to improve aesthetics,
functionality and better serve users. UoE
2022 - 2027
3.1:
2. Educational Action: reduce domestic pollution in the catchment through educational action
Annual
0.1: Build on Helston’s Community College Year 9 field trip, which reaches
300+ students. Focus on water quality and biodiversity around the Pool, add student resources to the LPF website, run annual blog/poster competitions, and publicise the trip via regional media.
NT
2017 - 2019
1.1: Develop relationships with the four local primary schools to collaborate on
anti-pollution campaigns; ensuing this is led by their own requirements and interest. 1.2: Develop a community engagement stall. This stall will be taken to various
community events in Helston to promote awareness around the local pollution issues, how LPF have achieved positive change over the last 20yrs, and how the public can help through changing domestic water practices 1.3: Deliver community engagement stall at Sainsbury’s and Farmers Market.
Materials for stall to include; 1) LPF info-graphic; 2) branded bird boxes to give away from Culdrose; 3) save-water-save-money water saving devices to give away; 4) promotion of phosphate-free washing powder; 5) septic tank management information. 1.4: Organise and deliver a Yellow Fish project in partnership with local
schools, Highways Agency and the Council. 1.5: Organise and deliver an anti-rubbish campaign in partnership with local schools and the Council. Proposals are for a street sign competition to communicate the pollution problem.
UoE & NT UoE & NT UoE & NT UoE & NT UoE
2019 - 2022
2.1: Delivery of at least four community and schools events in partnership with
the Upstream Thinking project team. UoE & NT
2022 - 2027
3.1:
3. Engagement: collaborate with stakeholders and UoE researchers on catchment focused projects
Measure Lead
Annual
0.1: Continue to build links with local community groups, businesses and
other local bodies, e.g. RNAS Culdrose, Helston Town Council 0.2: Work with Catchment Group, Lake and Lower Cober Group and SWW
UST to provide community engagement and consultation around their projects. 0.3: Continue to update the LPF Research Agenda and distribute to contacts in University of Exeter in order to encourage Cober catchment focused student dissertations.
NT & UoE All All
2017 - 2019
1.1: Increase engagement with local universities and colleges. Aim to be involved with 2 catchment and farm field trips with UoE or other local organisations.
UoE
2017 Cober Catchment Management Plan
60
1.2: Develop internship placement opportunities as part of the new work
placement module at UoE Centre for Geography Environment and Society. 1.3: Investigate support options for public engagement from Helston Council
UoE
2019 - 2022
2.1: Engagement with Helston Town Council in order to update on LPF progress and enquire about future collaborations. 2.2: Develop a sustainable financial plan for the LPF Coordinator role.
UoE & NT NT
2022 – 2027
3.1:
Table 18: Community Group working objectives
4.5: Research Agenda Central to the catchment based approach is collaborative working between environmental agencies and research bodies. As such LPF has been working to support UoE on mutually beneficial research projects. Since 2015 LPF have been updating and circulating a research agenda (see Figure 18) to UoE research managers. This has been extremely productive and LPF plan to continue, and expand, its calls for Cober catchment focused research in 2018. Dr Tim Walker ([email protected]) is the contact for interested researchers and students.
Themes
Issues
Questions
Risk Perceptions
Implementing the recommendations from the PAA (2014) hydrological survey of the Willow Carr; i.e. re-connecting the river Cober to the Willow Carr floodplain.
1. Helston community perceptions of re-wetting the Willow Carr. Community desires for public access to Carr and its amenity value are unknown.
Fisheries
Further research following ECON Fisheries Survey Report (2015). Key unanswered questions (listed at back of survey report)
1. Fish migration patterns from lake to river 2. Origin of roach and perch into Pool 3. How will climate change affect the trout 4. What factors are affecting macrophyte recovery
Water Pollution
Tellus SW project which is releasing results about radioactivity measurements in the South West. An interpretation of this data for the Cober catchment would be very useful for the Upstream Thinking Project.
1. Can radon levels in the Releath stream be addressed through agricultural change and land management?
Catchment Management
In partnership with South West Water Upstream Thinking project
1. Understanding the relationship between flow attenuation features in a catchment and how they can benefit pollution risk, as well as flood risk. 2. Mapping pollutant pathways through catchments as a means to targeting work or investment. 3. Quantifying change in water quality parameters and attributing to interventions on farms. 4. Modelling water quality improvements based on improved land management.
Vegetation & Biodiversity
Vegetation survey in the Willow Carr 1. Map extent of vegetation in Willow Carr 2. Species Identification
Hydrology
Data and analysis of ground saturation and relationship to pollution risk
1. Baseline data on ground saturation around Loe Pool. 2. Match HLS options to data 3. Will land management affect ground saturation and pollution risk? 4. Comparison with Rolling Ball hydrological model
Land use
Understanding land use in the catchment is critical for knowing where high runoff risk areas are and how to prioritise management interventions
Analysis of agricultural economy and a land use map of the Cober is needed What is the past, current and likely future land use geography in the Cober catchment? Utilisation of the Tellus South West project
Biodiversity Knowing where areas of high biodiversity is critical for on the ground environmental officers guiding farmers on land
A parish biodiversity and habitat audit is needed See Tellus South West project

2017 Cober Catchment Management Plan
61
management
Soil and Contaminant Movement
How soil and containments reach the water course is dependent on local land use, geology and rainfall. Better understanding of local conditions would be useful for LPF and identifying high risk areas and practices.
How does soil and containments move through the Cober catchment? One high risk tributary is Penrose stream. A study which compares current loading to the study by Brey Utilities (contact National Trust Penrose for details) is one suggestion for a project.
Figure 24: LPF Research Agenda
5.0: References

2017 Cober Catchment Management Plan
62
ASAI, M., LANGER, V., FREDERIKSEN, P. & JACOBSEN, B. H. 2014. Livestock farmer perceptions of successful collaborative arragements for manure exchange: A study in Denmark. Agricultural Systems, 128, 55-65.
AYRE, M. & NETTLE, R. 2015. Doing integration in catchment management research: Insights into a dynamic learning process. Environmental Science & Policy, 47, 18-
31. BLACKSTOCK, K., INGRAM, J., BURTON, R., BROWN, K. & SLEE, B. 2010.
Understanding and influencing behaviour change by farmers to improve water quality. Science of the Total Environment, 408, 5631-5638.
BROWN, A. G., M. LONSDALE, K. PRINGLE, P 2011. Managing adaptation: linking theory and practice. Oxford: UK Climate Impacts Programme.
CHON, H., OHANDJA, D. & VOULVOULIS, N. 2012. A risk-based approach to prioritise catchments for diffuse metal pollution management. Science of the Total Environment, 437, 42-52.
COMMITTEE, N. C. 2015. The State of Natural Capital - Protecting and Improving Natural Capital for Prosperity and Wellbeing. Third report to the Economic Affairs Committee.
CRILLY, D. The Catchment Based Approach - Pilot Phase. Catchment Delivery Conference, 2011 London. Environment Agency.
CWT 2005. Cornwall life project database. In: TRUST, C. W. (ed.). Truro. DEFRA 2013. Catchment Based Approach: Improving the quality of our water
environment. A policy framework to encourage the wider adoption of an integrated Catchment Based Approach to improving the quality of our water environment. In: DEPARTMENT OF ENVIRONMENT, F. A. R. A. (ed.). London.
DINSDALE, J. 2009. Loe Pool Catchment Management Project Review. www.loepoolforum.org: Loe Pool Forum.
DINSDALE, J. & WILSON, H. 2002. Loe Pool Catchment Management Project Review. www.loepoolforum.org: Loe Pool Forum.
EA 2007. The unseen threat to water quality - Diffuse water pollution in England and Wales. Bristol: Environment Agency.
EA 2011. Extending the catchment-based approach: How the Environment Agency will support and assist others. In: CRILLY, D. (ed.). online: Environment Agency.
EA 2012. West Cornwall Catchment Flood Management Plan - Summary Report June 2012. Exeter: Environment Agency.
EA 2015. Loe Pool Phosphate Loading Analysis. In: HAMBROOK, D. (ed.). unpublished: Integrated Environment Planning Team.
EA. 2016a. Cober and Lizard - WFD Classification Data [Online]. http://environment.data.gov.uk/catchment-planning/OperationalCatchment/3094. [Accessed 12/11/16 2016].
EA 2016b. Loe Pool Water Level Management Plan. In: AGENCY, W. P. B. J. H. L. F. T. C. D. A. O. T. E. (ed.).
ECON 2015. Fisheries Survey & Review to inform a Fish Management Plan for Loe Pool SSSI. Ecological Consultancy Limited.
FREDERIKSEN, P. & MAENPAA, M. 2007. Analysing and synthesising European legislation in relation to water. In: FREDERIKSEN, P. & MAENPAA, M. (eds.) A Watersketch Report under WP1. Denmark: National Environmental Research Institute,.
GOV.UK. 2017a. Countryside Stewardship [Online]. Available: https://www.gov.uk/government/collections/countryside-stewardship-get-paid-for-environmental-land-management.
GOV.UK. 2017b. Cross compliance [Online]. Available: https://www.gov.uk/government/collections/cross-compliance.
2017 Cober Catchment Management Plan
63
GWCT. 2017. Countryside Stewardship [Online]. Game and Wildlife Conservation Trust. Available: http://www.gwct.org.uk/farming/advice/stewardship-schemes/countryside-stewardship/.
HARPER, D. 1992. Eutrophication of Freshwaters: Principles, Problems and Restoration, London, Chapman and Hall.
JNCC 2011. UK Biodiversity Action Plan - Priority Habitat Descriptions. Joint Nature Conservation Committee.
LANE, S. N., BROOKES, C. J., HEATHWAITE, L. A. & REANEY, S. 2006. Surveillant Science: Challenges for the Management of Rural Environments Emerging from the New Generation Diffuse Pollution Models. Journal of Agricultural Economics, 57, 239-257.
MAY, L., PLACE, C., O’MALLEY, M. & SPEARS, B. 2015. The impact of phosphorus inputs from small discharges on designated freshwater sites. Natural England Commissioned Reports.
PAA 2014. Hydrological study of the Carr to inform management of Loe Valley Pool and Carr SSSI. In: TRUST, N. (ed.). Penny Anderson Associates
PATTERSON, J. J., SMITH, C. & BELLAMY, J. 2013. Understanding enabling capacities for managing the ‘wicked problem’ of nonpoint source water pollution in catchments: A conceptual framework. Journal of Environmental Management, 128, 441-452.
PETERSEN, T., KLAUER, B. & MANSTETTEN, R. 2009. The environment as a challenge for governmental responsibility — The case of the European Water Framework Directive. Ecological Economics, 68, 2058-2065.
PRETTY, J. & SMITH, D. J. 2004. Social capital in biodiversity conservation and management. Conservation Biology, 18, 2682-2701.
SAMUEL&SON. 2014. CAP Reform – NELMS has a new name. Countryside Stewardship scheme is announced [Online]. Available: http://www.samuelandson.co.uk/news-information/cap-reform-nelms-has-a-new-name-countryside-stewardship-scheme-is-announced/.
STAZYK, E. C. 2006. The Historical development of national non-point source pollution abatement efforts and the role of federalism. Akron: University of Akron.
SWW. 2015. New Upstream Thinking programme to protect rivers [Online]. https://www.southwestwater.co.uk/index.cfm?articleid=12703. 2017].
WILLOWS, R. I. & CONNELL, R. K. 2003. Climate adaptation: risk, uncertainty and decision-making. UKCIP technical report. Oxford: UKCIP.
WILSON, H. & DINSDALE, J. 1998. Loe Pool Catchment Management Project. Final Report. Report to the Loe Pool Management Forum. Bodmin, Cornwall: Environment Agency.
6.0: Appendix The following Appendix includes all the important information which was too detailed for the main document body.

2017 Cober Catchment Management Plan
64
6.1: Tributary Loading Analysis
The tables below show the PO4 % load to Loe Pool from its tributaries are listed alongside interpretation by the EA Analysis and Reporting Team. The interpretation is based on quantitative analysis of the expected (relative to catchment area and flow) and actual calculated load in each sub catchment. It is important to note that when comparing datasets there will be natural variability due to variations in weather patterns in different time periods. The variation between the CWT data and the EA routine monitoring data, for example, is due to the fact that there are more samples in the EA dataset and they are spread over the whole year rather than a few sampling runs in the winter as with the CWT data.
Tributary
2015- 2016 % P04 Load. samples Oct 2015 to March 2016
(CWT, 2016)
EA Analysis and Reporting Team Interpretation
Lowertown br - inflow to Loe Pool
41%
Excluding Mellangoose stream and Penventon trib - contribution probably due to urban drainage/CSOs and Helston STW (has P stripping but still contributes some PO4), but not excessive for size of sub catchment
Lowerton br - Coverack br
4%
Coverack br - Trenear br
-1%29
Trib Bodilly Stream DS Releath Farm
3%
Bodilly Stream US Releath Trib
-7%30
River Cober US Trenear Br
26% Not excessive for size of sub catchment
Mellangoose stream prior to Cober
11% Not excessive for size of sub catchment
Bodilly stream DS Bolitho
18% This is a tiny stretch so 18% contribution to overall loadings in the Cober is large.
Trib of Cober from Penvention Farm
1% Tiny sub catchment so this value is slightly higher than expected for the size of catchment
Table 19: PO4 % load to Cober; samples October 2015 to March 2016 (CWT, 2016)
Tributary
PO4 load to Loe Pool (EA routine monitoring Jan
2015 – Dec 2016)
EA Analysis and Reporting Team Interpretation
% load from the stretch d/s Helston
STW to inflow to Loe Pool
2% reduction compared to 2012-14 due to less rainfall and pollution from Penventon Farm?
% load from Helston STW storm overflow
and pond outflow opposite Helston
STW
31% Pond fed from Penventon Farm? Evidence suggests Helston STW storm overflow rarely spills.
29
The – (minus) sign here means there was a very slightly lower load at the downstream sampling point than the upstream in this stretch, indicating that on average this stretch was not a source but a, very minor, sink for PO4. Could be due to dilution from incoming (low PO4) tribs or due to dropout in slow moving stretches or online ponds (eg the boating lake) (JD, 2016). 30
The – (minus) sign here is because the upstream sampling point (Bodilly Stream d/s Bolitho) had such a high load; being just downstream of a significant PO4 source. By the time it gets to Bodilly Stream, u/s of Releath trib, the load has decreased due to dilution from increased flow (JD, 2016)

2017 Cober Catchment Management Plan
65
% load from Helston STW final effluent
29% Calculated from Helston STW final effluent data.
% load from us Helston STW to St
Johns Bridge
1%
% load from St Johns Bridge - Lowertown
Bridge
16% Urban drainage in Helston? Not from CSOs as they are downstream of here.
% load from Lowertown Briddge -
Trenear Bridge
13% Includes Releath Stream (farm issues on this trip but load not excessive for size of catchment).
% load from Trenear Bridge - Chy
Bridge/Burras Bridge
0%
%load upstream Chy Bridge
2%
%load upstream Burras Bridge
6% Slightly more than expected for size of catchment. Farm issues just upstream.
Table 20: PO4 load to Loe Pool (EA routine monitoring Jan 2015 – Oct 2016)
Tributary
2015- 2016 %
P04 Load.
samples Oct
2015 to March
2016 (CWT,
2016)
EA Analysis and Reporting Team Interpretation
Carminowe Creek US
Culdrose STW 19%
Slightly higher contribution than expected for the size of sub
catchment - possibly diffuse runoff from fertiliser applications
on cropping fields.
Trib Carminowe Creek
DS Carminowe Farm 10%
Larger contribution than expected for the relatively small size
of sub catchment
Trib Carminowe Creek
DS Lamarth Farm 2%
Little Content Stream
between up and
downstream
Goonhusband
36% A very large contribution for such as small stretch - likely to
be from Higher Pentire cottages
Little Content Stream
U/S Lower
Goonhusband
7% As expected for size of sub catchment
Carminowe creek inflow
to Loe Pool to upstream
Culdrose STW
23%
Significantly higher than expected contribution for the size of
sub-catchment (excludes Little Content Stream, Carminowe
and Burnuik tribs and upstream Culdrose STW). Source is
likely to be Culdrose STW (despite P stripping the FE still
contains enough PO4 to adversely affect water quality)
Trib Carminowe Creek
DS Burnuick Farm 3% Slightly above expected for the size of sub catchment.
Table 21: PO4 Load to Carminowe Creek (CWT, 2016)
Tributary
% PO4 load to Carminowe Creek (EA
routine
EA Analysis and Reporting Team Interpretation

2017 Cober Catchment Management Plan
66
monitoring Jan 2015 – Dec
2016):
%load from Higher Pentire
trib
17% substantially more than expected for the size of catchment
%load from Culdrose STW
31% This is Carminowe Creek at inflow to Loe Pool minus Little Content Stream and upstream Culdrose STW and may include other minor sources (Carminowe and Burnuik Farms). Substantially higher than expected for the size of catchment.
%load from Little Content Stream
27%
%load from us Culdrose STW
24% Slightly higher than expected for size of catchment - diffuse field runoff from cropping?
Table 22: PO4 load to Carminowe (EA, 2016)
6.2: WFD Reasons for failure The reasons for WFD failure of water bodies in the Cober catchment are listed in the table below. More information about the WFD classification for the Cober can be found at: http://environment.data.gov.uk/catchment-planning/OperationalCatchment/3094
Water body
Classification Year
Classification Status
Activity Pressure
Tier 1 Pressure
Tier 2 Pressure Tier
3
Carminowe Creek
2015 Poor Mixed agricultural Phosphate
Carminowe Creek
2015 Poor Unsewered domestic sewage
Phosphate
Carminowe Creek
2015 Poor Sewage discharge (continuous)
Phosphate
Lower River Cober
2015 Does not support good
Surface water abstraction
Abstraction and flow
Lower River Cober
2014 Moderate Mixed agricultural Nutrients Phosphate Phosphate
Lower River Cober
2014 Moderate Sewage discharge (continuous)
Nutrients Phosphate Phosphate
Lower River Cober
2014 Moderate Flood protection - structures
Morphology Not applicable
Physical modification
Lower River Cober
2014 Moderate Farm infrastructure
Ammonia
Lower River Cober
2014 Moderate Sewage discharge (continuous)
Ammonia
Lower River Cober
2014 High Abandoned mine Chemicals
Lower River Cober
2014 High Abandoned mine Chemicals
Lower River Cober
2014 High Natural mineralisation
Chemicals
Lower River Cober
2014 High Natural mineralisation
Chemicals
Lower River
2014 High Natural mineralisation
Chemicals
2017 Cober Catchment Management Plan
67
Cober
Lower River Cober
2014 High Natural mineralisation
Chemicals
Lower River Cober
2014 Good Flood protection - structures
Morphology Not applicable
Physical modification
The Loe 2014 Moderate Mixed agricultural Nutrients Phosphate Phosphate
The Loe 2014 Moderate Sewage discharge (continuous)
Nutrients Phosphate Phosphate
The Loe 2014 Moderate Sewage discharge (continuous)
Nutrients Phosphate Phosphate
The Loe 2014 Moderate Sewage discharge (continuous)
Nutrients Phosphate Phosphate
The Loe 2015 Moderate or less
Other (not in list) Flood protection Physical modification
The Loe 2015 Does not support good
Surface water abstraction
Abstraction and flow
The Loe 2014 Poor Sewage discharge (continuous)
Nutrients Phosphate Phosphate
The Loe 2014 Poor Sewage discharge (continuous)
Nutrients Phosphate Phosphate
The Loe 2014 Poor Sewage discharge (continuous)
Nutrients Phosphate Phosphate
The Loe 2014 Poor Mixed agricultural Nutrients Phosphate Phosphate
The Loe 2014 Poor Farm infrastructure
Phosphate
The Loe 2014 Poor Sewage discharge (continuous)
Phosphate
The Loe 2014 Poor Sewage discharge (continuous)
Phosphate
The Loe 2014 Poor Unsewered domestic sewage
Phosphate
The Loe 2014 Poor Mixed agricultural Nutrients Phosphate Phosphate
The Loe 2014 Poor Sewage discharge (continuous)
Nutrients Phosphate Phosphate
The Loe 2014 Poor Sewage discharge (continuous)
Nutrients Phosphate Phosphate
The Loe 2014 Poor Sewage discharge (continuous)
Nutrients Phosphate Phosphate
Upper River Cober
2013 Moderate Abandoned mine Specific pollutants
Copper Chemicals
Upper River Cober
2013 Moderate Abandoned mine Specific pollutants
Copper Chemicals
Upper River Cober
2015 Does not support good
Surface water abstraction
Abstraction and flow
Upper River Cober
2014 Moderate Abandoned mine Chemicals
Upper River Cober
2014 Moderate Abandoned mine Chemicals
Upper River Cober
2014 Moderate Natural mineralisation
Chemicals
Table 23: WFD reasons for failure of water bodies in the Cober catchment
6.3: ELS and HLS Options Since 2010 there have been 22 agreements set up under Environmental Stewardship. Each agreement will run for either 5 years if Entry Level or 10 years if Higher Level. The last of these agreements was started in 2013 and so will expire in 2023 as it was Higher

2017 Cober Catchment Management Plan
68
Level agreement. The following table lists the specific Options which will be delivered over the next 10 years.
Option Option area (ha) Option length (m) Total lifetime cost (payment options
only)
Total lifetime cost (points =
£)
EB1 - Hedgerow management for landscape (on both sides of a hedge)
15,424.00 3,382
EB11 - Stone wall protection and maintenance
725.00
109
EB12 - Earth bank management (on both sides)
23,189.00
3,247
EB13 - Earth bank management (on one side)
14,846.00
1,040
EB2 - Hedgerow management for landscape (on one side of a hedge)
35,488.40
3,807
EB3 - Hedgerow management for landscape and wildlife
6,573.00
2,761
EB4 - Stone faced hedge bank management on both sides
58,568.00
9,370
EB5 - Stone faced hedge bank management on one side
52,137.00
4,171
EE6 - 6m buffer strips on intensive grassland
1.33
452
EF6 - Over-wintered stubbles
9.25
1,110
EJ5 - In-field grass areas
1.41
639
EJ9 - 12m buffer strips for watercourses on cultivated land
0.30
120
EK1 - Take field corners out of management: outside SDA & ML
0.07
28
EK2 - Permanent grassland with low inputs: outside SDA & ML
90.21
7,673
EK3 - Permanent grassland with very low inputs: outside SDA & ML
25.24
3,790
EK4 - Manage rush pastures: outside SDA & ML
7.98
1,198
EK5 - Mixed stocking
2.75
25
HC12 - Maintenance of 10.90 19,620.00

2017 Cober Catchment Management Plan
69
wood pasture and parkland
HC15 - Maintenance of successional areas and scrub
14.34
14,130.18
HC20 - Restoration of traditional orchards
0.26
650.00
HC8 - Restoration of woodland
24.32
22,309.12
HD2 - Take archaeological features out of cultivation
4.01
16,601.40
HD3 - Low depth, non-inversion cultivation on archaeological features
8.22
4,438.80
HE2 - 4 m buffer strips on cultivated land
1.73
6,228.00
HF15 - Reduced herbicide cereal crops followed by overwintered stubble
16.00
28,080.01
HF2 - Wild bird seed mixture
3.00
12,150.00
HF20NR - Cultivated fallow plots or margins for arable plants
0.79
3,128.40
HF6 - Overwintered stubble
12.00
14,400.00
HG7 - Low input spring cereal to retain or re-create an arable mosaic
16.00
20,986.30
HJ3 - Reversion to unfertilised grassland to prevent erosion/run-off
3.75
9,450.00
HJ6 - Preventing erosion or run-off from intensively managed grassland
4.70
13,160.00
HK15 - Maintenance of grassland for target features
44.77
56,241.51
HK16 - Restoration of grassland for target features
1.70
1,988.96
HK3 - Permanent grassland with very low inputs
10.46
14,120.70
HK6 - Maintenance of species-rich, semi-natural grassland
6.53
13,060.22
HK7 - Restoration of species-rich, semi-natural grassland
8.51
14,164.41
HN8CW - Educational access - base payment
8,000.00
HN9CW - Educational access - payment per visit
7,700.00
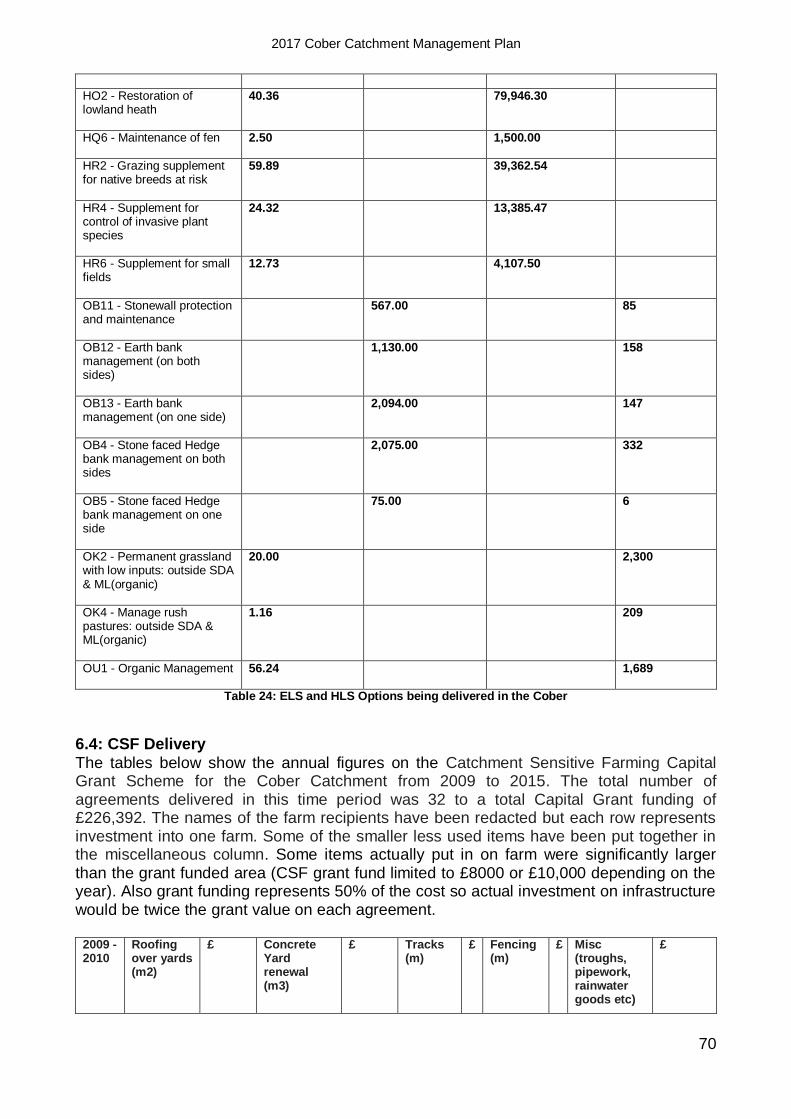
2017 Cober Catchment Management Plan
70
HO2 - Restoration of lowland heath
40.36
79,946.30
HQ6 - Maintenance of fen
2.50
1,500.00
HR2 - Grazing supplement for native breeds at risk
59.89
39,362.54
HR4 - Supplement for control of invasive plant species
24.32
13,385.47
HR6 - Supplement for small fields
12.73
4,107.50
OB11 - Stonewall protection and maintenance
567.00
85
OB12 - Earth bank management (on both sides)
1,130.00
158
OB13 - Earth bank management (on one side)
2,094.00
147
OB4 - Stone faced Hedge bank management on both sides
2,075.00
332
OB5 - Stone faced Hedge bank management on one side
75.00
6
OK2 - Permanent grassland with low inputs: outside SDA & ML(organic)
20.00
2,300
OK4 - Manage rush pastures: outside SDA & ML(organic)
1.16
209
OU1 - Organic Management
56.24
1,689
Table 24: ELS and HLS Options being delivered in the Cober
6.4: CSF Delivery
The tables below show the annual figures on the Catchment Sensitive Farming Capital Grant Scheme for the Cober Catchment from 2009 to 2015. The total number of agreements delivered in this time period was 32 to a total Capital Grant funding of £226,392. The names of the farm recipients have been redacted but each row represents investment into one farm. Some of the smaller less used items have been put together in the miscellaneous column. Some items actually put in on farm were significantly larger than the grant funded area (CSF grant fund limited to £8000 or £10,000 depending on the year). Also grant funding represents 50% of the cost so actual investment on infrastructure would be twice the grant value on each agreement.
2009 -2010
Roofing over yards (m2)
£ Concrete Yard renewal (m3)
£ Tracks (m)
£ Fencing (m)
£ Misc (troughs, pipework, rainwater goods etc)
£

2017 Cober Catchment Management Plan
71
1 297 8000
2 216 8000
3 168 7560
4 288 8000
5 216 8000
Total 897 31560 288 8000 0 0 0 0 0 0
Total grant 39560
Table 25: 2009 – 2010 CSF Capital Grants delivered in the Cober Catchment
2010 - 2011
Roofing over yards (m2)
£ Concrete Yard renewal (m3)
£ Tracks (m)
£ Fencing (m)
£ Misc (troughs, pipework, rainwater goods etc)
£
1 360 8000
2 225 8000
Total 585 16000 0 0 0 0 0 0 0 0
Total grant
16000
Table 26: 2010 – 2011 CSF Capital Grants delivered in the Cober Catchment
2011/12
Roofing over yards (m3)
£ Concrete Yard renewal (m3)
£ Tracks (m)
£ Fencing (m)
£ Misc (troughs, pipework, rainwater goods etc)
1 450 10000
2 297 10000
3 225 9450 85
4 120 5040 £120.45
5 40 £1,000.00
450 £1,125.00
£508.00
6 250 10000
Total 772 29450
40 1000 120 5040 450 1125 713.45
Total grant
37328.45
Table 27: 2011 – 2012 CSF Capital Grants delivered in the Cober Catchment
2012/13
Roofing over yards (m3)
£ Concrete Yard renewal (m3)
£ Tracks (m)
£ Fencing (m)
£ Misc (troughs, pipework, rainwater goods etc)
1 350 10000 £500.00
2 50 £1,250.00
£2,190.00

2017 Cober Catchment Management Plan
72
3 1700 5000 5000
4 250 10000 260 6500 £161.00
5 124 5208 150 3750
6 430 10000
7 335 8,375.00 209 £522.50
8 480 10000
9 2650
Total 124 5208 965 22125 639 10522.5 0 0 2650
Total grant 40505.5
Table 28: 2012 – 2013 CSF Capital Grants delivered in the Cober Catchment
2013/14 Roofing over yards (m3)
£ Concrete Yard renewal (m3)
£ Tracks (m)
£ Fencing (m)
£ Misc (troughs, pipework, rainwater goods etc)
£
1 455 10000
2 330 10000
3 1400 10000
4 300 10000
5 200 8000 120 2000
6 300 10000
7 150 3570 175 420
8 500 10000
9 135 5670 150 3570
10 160 4000 150 6500
Total 435 15670 960 21140 325 6920 0 0 0 0
Total grant 43730
Table 29: 2013 – 2014 CSF Capital Grants delivered in the Cober Catchment
2014/15 Roofing over yards (m3)
£ Concrete Yard renewal (m3)
£ Tracks (m)
£ Fencing (m)
£ Misc (troughs, pipework, rainwater goods etc)
1 518 10000
2 300 10000
3 371 10000 1200
Total 889 20000 0 0 300 10000 0 0 1200
Total grant
31200
Table 30: 2014 – 2015 CSF Capital Grants delivered in the Cober Catchment

2017 Cober Catchment Management Plan
73
2015/16 Roofing over yards (m3)
£ Concrete Yard renewal (m3)
£ Tracks (m)
£ Fencing (m)
£ Misc (troughs, pipework, rainwater goods etc)
1 117 £7,254.00
30 £814.20
2 988 10000
Total 117 7254 1018 10814.2 0 0 0 0 0 0
Total grant
18068
Table 31: 2015-2016 CSF Capital Grants delivered in the Cober Catchment

2017 Cober Catchment Management Plan
74
6.5: Helston Flood Alleviation Scheme Explanation Posters
Figure 25: Poster 1) Why is the scheme needed?

2017 Cober Catchment Management Plan
75
Figure 26: Poster 2) What options have been considered?

2017 Cober Catchment Management Plan
76
Figure 27: Poster 3) The chosen scheme for Loe Pool

2017 Cober Catchment Management Plan
77
Figure 28: Poster 4) Environmental benefits of the scheme

2017 Cober Catchment Management Plan
78
Figure 29: Poster 5) Safety management and timings of works

2017 Cober Catchment Management Plan
79
Figure 30: Poster 6) The chosen scheme for the River Cober