coca cola enterprises annual reports 2006
TRANSCRIPT

2006 ANNUAL REPORT

BUSINESS DESCRIPTIONWe are the world’s largest marketer, producer, and distributor of Coca-Cola products.
In 2006, we distributed more than 2 billion physical cases of our products, or
42 billion bottles and cans, representing 19 percent of The Coca-Cola Company’s
worldwide volume.
We operate in 46 U.S. states and Canada; our territory encompasses approximately
81 percent of the North American population. In addition, we are the exclusive
Coca-Cola bottler for all of Belgium, continental France, Great Britain, Luxembourg,
Monaco, and the Netherlands.
We employ 74,000 people, operate 444 facilities, 55,000 vehicles, and 2.4 million
vending machines, beverage dispensers, and coolers.
Our stock is traded on the New York Stock Exchange under the “CCE” symbol.
TABLE OF CONTENTS
Financial Highlights…fold-out Letter to Our Shareowners…1 A Case For Change…5 Financials…25 Shareowner Information…Inside Back Cover
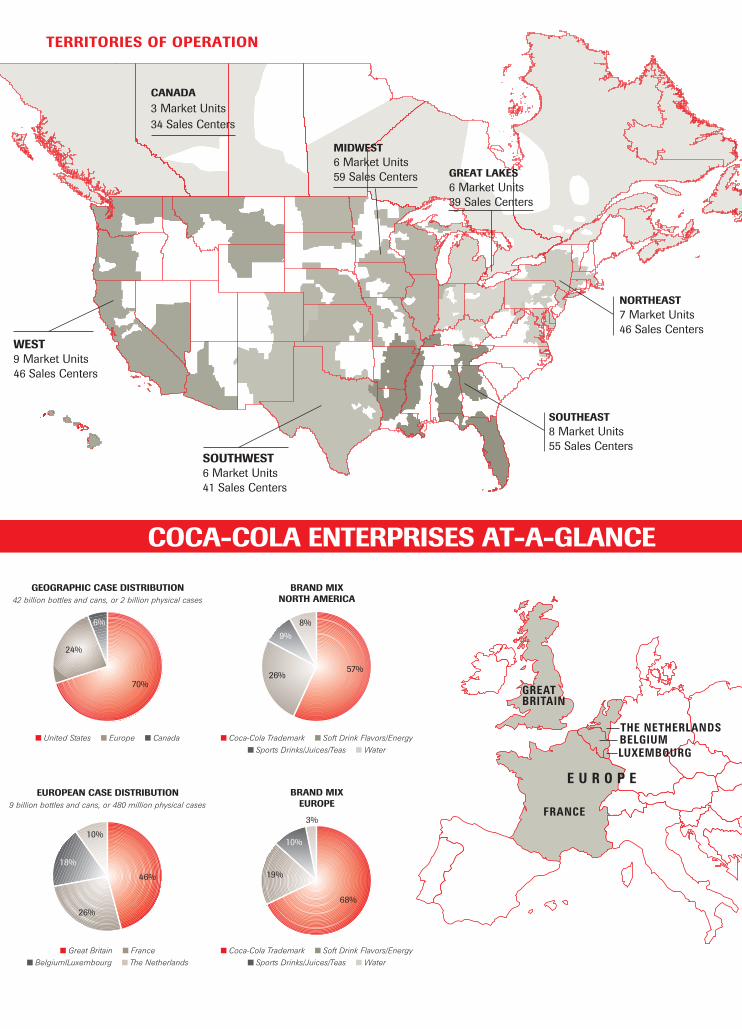
COCA-COLA ENTERPRISES AT-A-GLANCE
TERRITORIES OF OPERATION
CANADA3 Market Units34 Sales Centers
SOUTHEAST8 Market Units55 Sales Centers
NORTHEAST7 Market Units46 Sales Centers
MIDWEST6 Market Units59 Sales Centers GREAT LAKES
6 Market Units39 Sales Centers
WEST9 Market Units46 Sales Centers
SOUTHWEST6 Market Units41 Sales Centers
EUROPEAN CASE DISTRIBUTION9 billion bottles and cans, or 480 million physical cases
Great Britain France
BelgiumlLuxembourg The Netherlands
United States Europe Canada
GEOGRAPHIC CASE DISTRIBUTION42 billion bottles and cans, or 2 billion physical cases
6%
70%
24%
46%
26%
10%
18%
BRAND MIXNORTH AMERICA
E U R O P E
FRANCE
GREATBRITAIN
THE NETHERLANDS
LUXEMBOURGBELGIUM
8%
26%57%
9%
BRAND MIXEUROPE
68%
19%
3%
10%
Coca-Cola Trademark Soft Drink Flavors/Energy
Sports Drinks/Juices/Teas Water
Coca-Cola Trademark Soft Drink Flavors/Energy
Sports Drinks/Juices/Teas Water

(in millions except per share data) 2006 2005 2004 2003
As Reported
Net Operating Revenue $ 19,804 $ 18,743 $ 18,190 $ 17,330
Operating (Loss) Income $ (1,495) $ 1,431 $ 1,436 $ 1,577
Net (Loss) Income to Common Shareowners $ (1,143) $ 514 $ 596 $ 674
Diluted (Loss) Earnings per Common Share(a) $ (2.41) $ 1.08 $ 1.26 $ 1.46
Total Market Value(b) $ 9,795 $ 9,083 $ 9,792 $ 9,967
(a) Per share data calculated prior to rounding into millions.(b) As of December 31, based on common shares issued and outstanding.
FINANCIAL HIGHLIGHTSCoca-Cola Enterprises Inc.
PER CAPITA POPULATION CONSUMPTION (a) EMPLOYEES FACILITIES (b)
North American Territories 265M 298 64,000 396
European Territories 147M 172 10,000 48
Total Company 412M 253 74,000 444
(a) Number of 8-ounce servings consumed per person per year.
(b) Facilities include 18 production, 12 distribution, 320 sales/distribution, and 46 combination sales and production plants in
North America, and 3 production plants, 33 sales/distribution, and 12 combination plants in Europe.

Letter to Our Shareowners
In early 2006, I was honored by the confidence of this company’s board of directors as they named me Coca-Cola Enterprises’ president and chief executive officer. It is truly a privilege to lead this great company and its outstanding people. Since assuming the position in May, I have talked and met with literally thousands of our employees throughout our company, listening to their ideas and concerns while learning first hand of their optimism for CCE and our business. I also shared their excitement as our company celebrated its 20th anniversary, and was inspired by their pride in working for Coca-Cola Enterprises. This period of discovery has confirmed my long-held respect for CCE, formed during my more than 20 years in the beverage business as a customer of the company, a competitor, and an industry partner. As I worked with and competed with CCE, I recognized that CCE is the standard-bearer for the world’s greatest brand, Coca-Cola, in two of the most important markets in the world, North America and Europe. Today, looking at CCE from the inside, it is even clearer that the benefits of the Coca-Cola brand represent a tremendous asset and competitive advantage, strengthened by the talent and dedication of CCE people. We have an exceptional organization with powerful scale and reach. Every day, we directly interact with millions of cus-tomers who benefit from our extraordinary brands, unmatched distribution system, and the skills and talents of our people. These employees, with the right tools and strategies, create a team that will consistently deliver the highest possible levels of day-to-day execution in the marketplace. This commanding com-bination gives me great optimism as we make strategic, long-term business improvements that will allow us to excel in a dynamic, changing market environment. Long term, these improvements
will allow us to achieve greater overall performance and consis-tency in our financial results. This growth and consistency are imperative if CCE is to achieve our most important goal: driving shareowner value. Ultimately, achieving this objective requires fulfilling our vision for this company: to be the best beverage sales and customer service company. Reaching this vision will require a total, dedi-cated effort from every level of our company and world-class capabilities in revenue growth management, sales and cus-tomer service, and supply chain management. To guide this effort, our leadership team has identified three strategic priorities:
• Strengthen our brand portfolio by growing the value of our existing brands and significantly expand our product portfolio;
• Transform our go-to-market model and improve efficiency and effectiveness;
• Establish a winning, inclusive culture as we attract, develop, and retain a talented, diverse workforce.
As we work toward our vision for CCE, these priorities will drive our decisions and actions in the months and years ahead. In fact, we have already started the important work of integrating them into our day-to-day operations.
A Strategic Priority:Strengthen Our Brand PortfolioAmid the constant discussion of the many challenges we face in our business today, it is extremely important to remember that we work in a growing industry. In fact, we expect the non-alcoholic ready-to-drink category in North America to grow an average of 2½ percent over the next three years, and, in Europe, we expect even stronger overall category growth.
1
John F. BrockPresident and Chief Executive Officer
A CASE FOR CHANGE

2
Letter to Our Shareowners
This growth represents a clear opportunity, but if we are to seize our share – more than our share – we must carefully adjust our product portfolio to match the sources of that growth. Our portfolio remains heavily dependent on carbonated soft drinks (CSDs); however, over the next five years, a huge portion of volume growth in the nonalcoholic ready-to-drink category will come from water, teas and coffees, and other noncarbonated beverages. This dichotomy creates a significant challenge. Carbonated beverages remain highly profitable and vital to our company; in fact, our brands constitute the strongest CSD portfolio in the world. The answer is to seek ways to improve the growth potential of our CSD portfolio while strategically broadening our presence in faster-growing beverage groups. This requires building a strong market position in every beverage category in which we choose to compete, with a number one or strong number two market share. Achieving this goal is a difficult, challenging proposition but an achievable one, given our resources and renewed focus. We will reach this leadership posi-tion by leveraging the strength of our powerful partnership with The Coca-Cola Company, which shares our dedication to product portfolio expansion and to competing more fully for every beverage purchase. We have established a clear pro-cess to identify new opportunities and to develop or acquire the brands and products needed to respond to those opportunities. The Coca-Cola Company demonstrated its commitment early in 2007 with the announcement that it would acquire FUZE Beverages LLC, a maker of enhanced juices and teas. This acquisition supports other innovation in the growing tea category, such as the expanded Nestea line, the new Enviga green tea, and premium Gold Peak teas.
A Strategic Priority: Transform Our Go-to-Market ModelFor more than 100 years, since the earliest days of bottling, we and our predecessor bottlers have delivered Coca-Cola directly to our customers and merchandised it on their shelves. Direct store delivery, or DSD, is a business model that has worked remarkably well and, even today, remains the fastest and most powerful method of distributing a vast majority of our products. Our DSD system offers several key advantages. It affords us continuous contact with our customers, giving us the ability to seize in-store placement opportunities every day. The unmatched speed and reach of our DSD system facilitates rapid entry into new categories, and is essential in establishing new products and implementing creative advertising approaches. For our customers, our DSD brands turn frequently and offer attractive margins with the advantage of virtually no retailer labor cost.
However, shifts in consumer demand for increasingly specialized products, coupled with a rapidly evolving retail environment, have created new distribution realities that we cannot ignore. The proliferation of brands, packages, and products demands that we take a fresh look at how we bring each of our products to market. For example, the number of SKUs in our system has grown more than 50 percent since 2000. As a result, it is imperative that we find the best, most efficient distribution channel for each brand and package while meeting customer needs. We have already moved forward in testing and implementing new delivery opportunities, challenging old norms and seeking new ways to improve distribution. Last year, we began distribution
tests with Wal-Mart and Valero, a large convenience store operator. These projects demonstrate our commitment to evolv-ing our go-to-market model to meet the demands of a changing marketplace. Over time, distribution innovation offers signifi-cant potential, and we will continue to seek opportunities that make sense for our customers and for CCE, even as we remain
committed to DSD for a majority of our products. As we refine DSD, we also will seek to drive improved efficiency and effectiveness in a variety of ways. Perhaps our most important opportunity is to drive greater consistency in our operations, regardless of geography. The CCE of today was created through a series of acquisitions and mergers, bringing together bottlers that shared a commitment to the basic ele-ments of success in our business: superior customer service and unequaled marketplace execution. By design, we operated these bottlers as decentralized, local businesses with a variety of operating practices and strategies, many of which continue to influence our day-to-day business. Through customer-focused standardization in our practices, from job functions to route management, from plant operations to merchandising, we will enhance effectiveness and create greater productivity across the organization. For example, through a new program, Customer Centered Excellence (C.C.E.), we are implementing a host of initiatives to improve both our operating performance and our customer service. Also, we are moving forward with faster water production lines, more produc-tive selling systems for our customers, more productive delivery vehicles, and synergistic delivery and warehouse practices. These and other initiatives under way represent only the beginning of a firm commitment to develop more effective, efficient operating methods and in turn, create sustainable profit growth. Rest assured, we are looking at our business with a renewed focus and a commitment to enhance performance over the long term.
“…Creating enduring growth requires fulfilling our vision for this company: to be the best beverage sales and customer service company.”

3
A Strategic Priority: Establish a Winning, Inclusive CultureAs I met with many of our employees during my initial travels across the system, one clear fact emerged – at every level, our people are skilled, knowledgeable, and committed to the success of Coca-Cola Enterprises. There is a culture of com-peting and winning in the marketplace that is inspiring. My job, and the job of every manager within this com-pany, is to ensure that our people have the tools they need to utilize their skills and abilities as effectively as possible. With the right tools and the right products, our people will win in the marketplace. We have a large and powerful sales and customer service system with many advantages, but we have not tapped its full potential. By developing clear, concise job responsibilities, with goals that are clearly understood, and by improving communi-cation to share best practices, we will create improved customer satisfaction and generate increased productivity. As we improve our efficiency and strive to enhance our working environment, some jobs will change and responsibilities will adjust. Within successful organizations, this process of change is a vital element of their ability to meet the demands of con-stantly evolving marketplace conditions. Ultimately, our reorganization efforts will reduce our employee base by 3,500 posi-tions. This is a difficult but essential step toward creating a stronger, more responsive organization that remains well positioned to seize the opportunities ahead. As we evolve into a high-performing company, we will do so with a strong commitment to diversity and inclusion. These ele-ments are the heart of a winning organization, and it is essential that we do not have artificial limits or ceilings for our people.
A Look Back at 2006 and Ahead to 2007In reviewing our performance, in 2006 we achieved comparable earnings per share ( EPS ) of $1.30, up 5½ percent from the prior year, and comparable operating income of $1.5 billion, up 5½ percent.* We attained these earnings levels even as we managed through the challenges of soft CSD trends across nearly all of our territories and a rising cost environment. The year was char-acterized by a resurgence of our business in Europe, with strong, balanced volume and pricing growth, and results in North America that were slightly below our initial expectations. We also began to feel the impact of a rising cost environ-ment, as cost of goods sold per case rose 3½ percent* for the year. These cost trends will rise to unprecedented levels in 2007 and continue to affect our business throughout the year.
Challenges in North AmericaIn North America, unexpected softness in the retail category late in the year, coupled with price increases to cover rising costs, created downward pressure on volume. For the full year, North American volume grew ½ percent.* We maintained con-sistency in our pricing plans, though competitive pressures in the water segment, coupled with a decline in higher-margin immediate consumption sales, created a negative mix effect and limited overall net pricing per case growth to 2½ percent* for the full year. Despite these challenging operating conditions, there were strong brand performances in North America. For example, Coca-Cola Zero lapped its successful introduction with strong growth in 2006, including year-over-year growth of more than 25 percent in the second half of the year. The introduction of Vault early in the year proved highly successful with 20-ounce volume well above plan, giving us a strong point of distinction in convenience and immediate con-sumption channels in the highly popular citrus soda category.
In addition, our energy drink portfolio, anchored by the Full Throttle and Rockstar brands, continued to achieve outstand-ing growth and achieved a share gain of 3 points for the year. As we look ahead to 2007 in North America, we anticipate another year of strong innovation, with additional Vault flavors, an important addition to the Diet
Coke family, expanded distribution of Enviga teas, and the beginning of our U.S. distribution of 34-ounce bottles of AriZona teas. Continued innovation remains essential to our ability to reignite North American growth, and we are counting on The Coca-Cola Company to drive this program through internal development and acquisition. For the full year, we anticipate difficult operating conditions as we deal with an unprecedented cost environment and ongo-ing shifts in consumer demand. Longer term, we continue to believe in the growth opportunities of the North American mar-ket. By executing against our key priorities, with a more balanced portfolio, a more normal cost environment, and improved service and efficiency, we will be poised to achieve significant operating improvement in the years ahead.
Renewed Growth in EuropeBuilt on a strategy of “playing to our strengths,” Europe reversed a pattern of declines and achieved balanced growth in 2006. Volume increased 3½ percent for the year, with net pricing per case growth of 1½ percent.* This is a very positive accomplish-ment and a testament to the dedication of all of our European managers and employees.
“We have a large and powerful sales and customer service system with many advantages, but we have not tapped its full potential.”

4
Letter to Our Shareowners
There were several key factors in this performance. Our European team executed flawlessly in support of World Cup activities, creating benefits that extended well beyond the tournament itself. We also successfully introduced a “three-cola” strategy in Great Britain and Belgium with the introduction of Coca-Cola Zero, which outperformed our expectations in a variety of ways. Volume was well above plan, and the brand brought many consumers back to the CSD category. In fact, this fall, one large retailer found that 30 percent of Coca-Cola Zero buyers had not made a purchase in the soft drink catego-ry within the prior 12 weeks of purchasing Coca-Cola Zero. In addition, the development of “boost zones” in France helped drive higher-margin immediate consumption growth of 5 percent for the year. The boost zone concept, which grew to more than 60 such zones last year, continues to be suc-cessful, and we will expand the concept to each of our territories in 2007. Boost zones, World Cup activation, the benefits of favor-able summer weather, product innovation, and new packaging regulations that increased consumer options in the Netherlands helped create strong renewed growth in continental Europe. Each territory – Belgium, France, and the Netherlands – achieved strong volume and pricing growth and solid profit performance, with total continental European volume growth of 6 percent. We are encouraged by this renewed growth and the momentum it creates for 2007. Our results in Great Britain – a territory that represents nearly half of our European business – reflects different market conditions. Volume in Great Britain remained soft, despite the benefits of Coca-Cola Zero, reflecting persis-tent weakness in CSDs. For the year, Great Britain volume grew 1 percent. We will seize market opportunities with the introduc-tion of boost zones and gain the benefits of additional product innovation. However, we anticipate continued difficult market conditions in Great Britain in 2007. A key to our success throughout Europe remains a stronger, more balanced brand and product portfolio. CSDs represent approximately 90 percent of our total portfolio even though the CSD share of the total nonalcoholic beverage category in Europe is less than 35 percent. Our goal is to move quickly to establish a strong position in categories that offer the highest value, as demonstrated by our agreement to expand distribution of Capri Sun juice drinks in pouches beyond Great Britain to France. We also continue to review additional opportunities in grow-ing categories.
Making the Transition: The Road AheadAs we look forward, CCE faces several challenging business conditions that will affect our short-term results and make 2007 a year of transition as we work to implement new strate-gies and initiatives. To evaluate our progress, we believe four key metrics – revenue growth, EPS, operating income, and return on invested capital – provide the clearest view of our success and will form the basis of our guidance going forward. Looking at these metrics for the long term, we believe our business can generate annual revenue growth of 4 per-cent to 5 percent each year, operating income growth of 5 percent to 6 percent, high single-digit earnings per share growth, and improve return on invested capital by approxi-mately 30 basis points or more annually. While we will not realize these levels in 2007, principally due to the high level of raw material cost increases, we expect to realize growth in these ranges beginning in 2008. This view reflects our confidence, and I want to leave you with a few key reasons for that confidence.
First, it is important to remember that we operate in a growing business – refreshment beverages – with significant opportunities. Our task is to capitalize on our strengths and evolve our resources to capture them, in part by creating a brand portfolio that is capable of generating the growth and financial consistency that we require. Second, we will achieve improved efficiency and effectiveness with a firm
commitment to the needs of our customers and with an open mind about how we operate our business day-to-day. And last, we have a strong, talented team that is anxious to win in the marketplace. We will support them by creating the structure that allows them to do their best, and by giving them the tools, products, and strategies they need. Our resources are exceptional. We have powerful brands, the industry’s strongest distribution system, and a dedicated and talented workforce. We are poised to seize the opportu-nities ahead, and I look forward to sharing our progress with you soon.
John F. Brock President and Chief Executive Officer
“Our resources are exceptional. We have powerful brands, the industry’s strongest distribution system, and a dedicated and talented workforce. We are poised to seize the opportuni-ties ahead…”

A CASE FOR CHANGE

Coca-Cola Enterprises Inc.
FROM NEW TASTES

TO STRONGER CATEGORY LEADERSHIP

8
Coca-Cola Enterprises Inc.
ZERO ZEROWHEN
ZERO PLUS ZEROEQUALS BRAND SUCCESS

Grow the Value of Existing Brands and Expand Our Portfolio
Coca-Cola Enterprises has established a clear goal as we grow the value of our existing brands and expand
our product portfolio: we will be number one or strong number two in every nonalcoholic ready-to-drink
(NARTD) beverage category in which we compete.
This strategy will enable us to confront ongoing market challenges that have limited the growth of our
CSD brands and products in North America and Europe, particularly Great Britain. These challenges – created
by changing consumer tastes and an evolving retail environment – reflect continuing NARTD growth in water,
juices, and other noncarbonated beverages. We will seize our share of this growth by achieving our goal and
creating better balance in our portfolio.
To accomplish our objective, we will work with The Coca-Cola Company to seek opportunities for
new brands and products. The Coca-Cola Company shares our passion for innovation, as demonstrated
by the early 2007 announcement of its intent to acquire FUZE Beverages LLC, a maker of enhanced teas
and fruit juices.
In addition, The Coca-Cola Company’s ability to create great brands in emerging categories is our most
important resource for brand and product diversification. The success of the Full Throttle energy drink is a
solid example of the power of our partnership. In early 2005, we held a small share of the high-margin
energy drink category. Today, anchored by Full Throttle and supported by a distribution agreement for
Rockstar, our energy drink portfolio is poised to assume the number two position in the category.
As we enhance our portfolio, we will also work closely with The Coca-Cola Company to reinvigorate our
core CSD brands, which remain large and profitable. For example, in 2006, we achieved significant success
with Coca-Cola Zero, successfully lapping strong introductory volume in North America and contributing to
renewed volume growth in Great Britain. Overall, Coca-Cola Zero has been a clear success, and we will
expand the brand into all of our European territories in 2007.
9
CCE’S TOP 5 BRANDSNorth America: Coca-Cola classic, Diet Coke, Sprite, Dasani, POWERADE
Europe: Coca-Cola, Diet Coke/Coca-Cola light, Fanta, Schweppes, Sprite

Coca-Cola Enterprises Inc.
FROM THE TRADITIONAL
10

11
TO THE INNOVATIVE

12
NEW WAYSNEW WAYSTO MARKET
THE WORLD’SGREATESTBRANDS
13
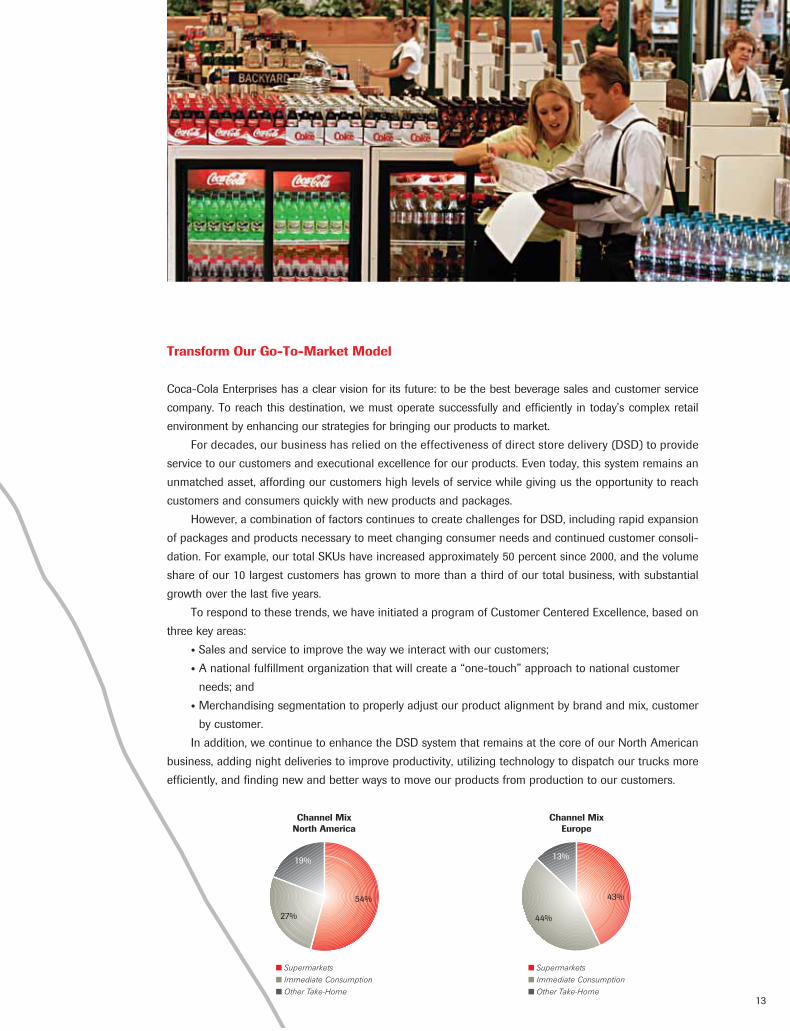
Transform Our Go-To-Market Model
Coca-Cola Enterprises has a clear vision for its future: to be the best beverage sales and customer service
company. To reach this destination, we must operate successfully and efficiently in today’s complex retail
environment by enhancing our strategies for bringing our products to market.
For decades, our business has relied on the effectiveness of direct store delivery (DSD) to provide
service to our customers and executional excellence for our products. Even today, this system remains an
unmatched asset, affording our customers high levels of service while giving us the opportunity to reach
customers and consumers quickly with new products and packages.
However, a combination of factors continues to create challenges for DSD, including rapid expansion
of packages and products necessary to meet changing consumer needs and continued customer consoli-
dation. For example, our total SKUs have increased approximately 50 percent since 2000, and the volume
share of our 10 largest customers has grown to more than a third of our total business, with substantial
growth over the last five years.
To respond to these trends, we have initiated a program of Customer Centered Excellence, based on
three key areas:
• Sales and service to improve the way we interact with our customers;
• A national fulfillment organization that will create a “one-touch” approach to national customer
needs; and
• Merchandising segmentation to properly adjust our product alignment by brand and mix, customer
by customer.
In addition, we continue to enhance the DSD system that remains at the core of our North American
business, adding night deliveries to improve productivity, utilizing technology to dispatch our trucks more
efficiently, and finding new and better ways to move our products from production to our customers.
Supermarkets
Immediate Consumption
Other Take-Home
Channel MixEurope
43%
44%
13%
Supermarkets
Immediate Consumption
Other Take-Home
Channel MixNorth America
27%
19%
54%

Coca-Cola Enterprises Inc.
FROM GREAT IDEAS

TO GREATER EFFICIENCY
16
Coca-Cola Enterprises Inc.
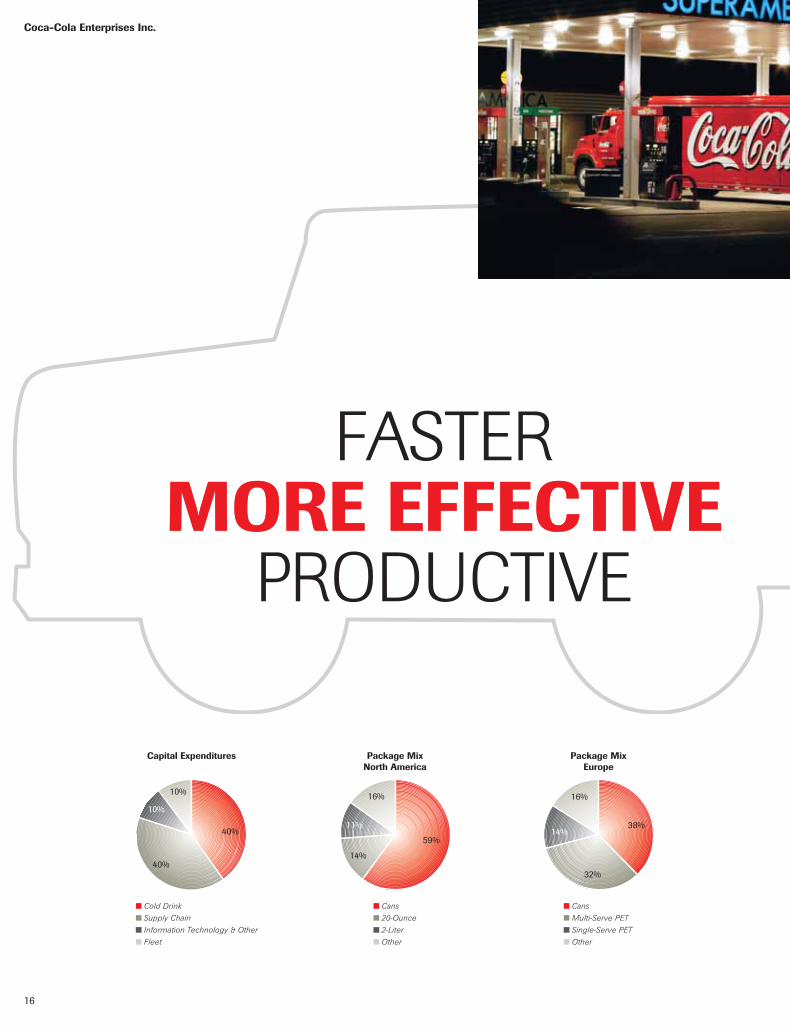
Cold Drink
Supply Chain
Information Technology & Other
Fleet
Capital Expenditures
40%
40%
10%
10%
Cans
Multi-Serve PET
Single-Serve PET
Other
Package MixEurope
16%
32%
14%38%
Cans
20-Ounce
2-Liter
Other
Package MixNorth America
16%
14%
11%
59%
MORE EFFECTIVEFASTER
MORE EFFECTIVEPRODUCTIVE

17
Improve Efficiency and Effectiveness
At its start, Coca-Cola Enterprises was formed from dozens of once-independent bottlers, each with their
own operating philosophy, standards, and business personality.
For years, we sought to maintain the local nature of these bottlers, reflecting customer needs at that
time. With today’s changing retail environment, however, these local characteristics limit customer service
effectiveness and operating efficiency. This creates one of our single largest opportunities as we work to
maximize efficiency and effectiveness throughout the company.
A key first step is to apply common standards to practices and procedures, even at the local level. The
goal is to create a more efficient supply chain and order fulfillment system that drives improved cus-
tomer service and provides consistent, standardized execution; a clear category focus; and consistent
core processes.
One example is a redesigned cold drink structure that improves service to smaller customers through
a Customer Development Center while allowing our sales representatives to increase their focus on growth
initiatives. Other initiatives are targeting operating efficiency, such as the new North American Equipment
Services team that will centralize cold drink equipment preparation and repair, creating savings through
improved inventory control and space utilization.
Our European business has already begun implementing a Pan-European approach to each operating
function of our company, from production to purchasing, as we seek to drive improved effectiveness by
fully leveraging the strength of the Coca-Cola system in Europe. In 2006, we also completed targeted, local
reorganizations that enable our operational structure to better match marketplace needs.
As we move forward, we will continue to challenge the long-held beliefs of our business as we strive to
reach the highest levels of efficiency and effectiveness. Much work has been done, yet significant opportunity
still remains.

Coca-Cola Enterprises Inc.
FROM EACH INDIVIDUAL

TO ONE WINNING INCLUSIVE CULTURE

Coca-Cola Enterprises Inc.
20
EXPERTS
TURNINGEMPLOYEES
INTO EXPERTS

21
Attract, Develop, and Retain a Talented and Diverse Workforce
At the core of our efforts to drive sustained, profitable growth are our employees, people who, with hard
work and dedication, manage customer relationships and create new and better ways to sell, produce,
and deliver our brands.
As we work to achieve world-class capabilities in customer service and efficiency, it is essential that
we establish a winning, inclusive culture and attract, develop, and retain a highly skilled and diverse work-
force. A key element of this effort is to make certain our employees have the tools and training needed
to fully utilize their skills and abilities. We will also continue to improve communication to enhance our
ability to share best practices and ideas as we simplify and standardize job responsibilities and operating
practices across our territories.
This improved coordination will create greater synergy at each level of our operations and improve
the skills of highly talented people. It will also enhance career options for our employees by making their
skills and knowledge more useful throughout our company. Ultimately, we will drive improved services for
our customers and further strengthen our marketplace execution, a cornerstone of our company’s success.
At the heart of our effort to train, equip, and develop our employees is a firm, unwavering commitment
to diversity and inclusion. A workforce that represents our local communities and celebrates the contribu-
tion of each individual is an essential element of our long-term success. Everywhere we operate, we strive
to make certain our employment policies and practices ensure equal opportunity and fair treatment.

Coca-Cola Enterprises Inc.

Building Corporate Responsibility and Sustainability
Our focus on corporate responsibility and sustainability (CRS) is integral to our company’s strategic priority
to improve efficiency and effectiveness and improve overall business performance. CRS improves CCE’s
ability to create value and helps to support sustainable development in the communities where our busi-
nesses operate. By concentrating on the core areas of corporate governance, workplace, marketplace,
community, and environment, we gain insight and knowledge to identify the gaps and opportunities.
We are striving to better understand and address the impacts that our business has on the communities
in which we operate. Our focus in our communities includes water stewardship, sustainable packaging
and recycling, energy and climate change, health and wellness, diversity management, and building an
inclusive culture. We are committed to working collaboratively with business, government, and communi-
ties to address these environmental and social challenges.
For example, to help address the growing issue of childhood obesity, we support groundbreaking
public-private partnerships. In the U.S., we partnered with the Alliance for a Healthier Generation and
the American Beverage Association to develop guidelines restricting the calorie content of beverages in
schools. We supported a similar initiative in Canada, while in Europe, through the framework of the EU
platform for diet, physical activity, and health, CCE was part of the industry leadership who committed to
self-regulatory measures and monitoring.
We’ve only just begun this journey, and we recognize that to be successful, CRS must be integrated
throughout our business operations. A cross-functional advisory council comprised of senior managers
from Europe and North America now guides our progress in embedding CRS into our business, and is
overseen by the Corporate Responsibility and Sustainability Committee of our board of directors.
We hold ourselves accountable for our social, ethical, and environmental performance and will strive
to measure our results. We are in the process of working toward setting targets, monitoring, and reporting
our performance transparently. By doing so, we hope to meet the rising expectations from our stakehold-
ers and ensure the long-term success of Coca-Cola Enterprises.
23
FROM STRONG BUSINESS PRACTICES TO BETTER COMMUNITIES

BOARD OF DIRECTORS
l. to r. Seated: Gary P. Fayard, Lowry F. Kline, Paula R. Reynolds, Irial Finan, Fernando Aguirre
Standing: John Brock, Summerfield (Skeeter) K. Johnston, III, Donna A. James, Marvin J. Herb, James E. Copeland, Jr., L. Phillip Humann, Calvin Darden, J. Trevor Eyton
FERNANDO AGUIRRE 1,7
Chairman, Chief Executive Officer, and President Chiquita Brands International, Inc.
JOHN F. BROCK 3,4
President and Chief Executive OfficerCoca-Cola Enterprises Inc.
JAMES E. COPELAND, JR. 1,2,7
Former Chief Executive Officer Deloitte & Touche USA, LLP and Deloitte Touche Tohmatsu
CALVIN DARDEN 3,6,7
Former Senior Vice President, U.S. Operations United Parcel Service, Inc. (UPS)
J. TREVOR EYTON 1,2,6
DirectorBrookfield Asset ManagementSenatorThe Senate of Canada
GARY P. FAYARD 3
Executive Vice President and Chief Financial Officer The Coca-Cola Company
IRIAL FINAN 4,5
Executive Vice President and President of Bottling Investments and Supply ChainThe Coca-Cola Company
MARVIN J. HERB 2,5,6
ChairmanHERBCO L.L.C.
L. PHILLIP HUMANN 4,5,6
ChairmanSunTrust Banks, Inc.
DONNA A. JAMES 1,2
President Landon Associates
SUMMERFIELD (SKEETER) K. JOHNSTON, III 1,3,5
Investor
LOWRY F. KLINE 4
ChairmanCoca-Cola Enterprises Inc.
PAULA R. REYNOLDS 2,6,7
President and Chief Executive OfficerSafeco Corporation
(1) Affiliated Transaction Committee(2) Audit Committee(3) Corporate Responsibility and
Sustainability Committee(4) Executive Committee (5) Finance Committee(6) Governance and Nominating
Committee(7) Human Resources and
Compensation Committee
CORPORATE GOVERNANCECoca-Cola Enterprises is committed to upholding the highest standards of corporate governance. Full information about our governance objectives and policies, as well as our board of directors, committee charters, and other data, is available on our website, www.cokecce.com under “Corporate Governance.”
24

(Exact name of registrant as specified in its charter) Delaware 58-0503352 (State of Incorporation) (IRS Employer Identification Number)
2500 Windy Ridge Parkway, Atlanta, Georgia 30339(Address of Principal Executive Offices, including Zip Code)
(770) 989-3000(Registrant’s telephone number, including area code)
Securities registered pursuant to Section 12(b) of the Act:
Title of each Class Name of each exchange on which registered
Common Stock, par value $1.00 per share New York Stock Exchange
Securities registered pursuant to Section 12(g) of the Act:None
Indicate by check mark if the registrant is a well-known seasoned issuer, as defined in Rule 405 of the Securities Act. Yes No
Indicate by check mark if the registrant is not required to file reports pursuant to Section 13 or Section 15(d) of the Securities Exchange Act. Yes No
Indicate by check mark whether the registrant (1) has filed all reports to be filed by Section 13 or 15(d) of the Securities Exchange Act of 1934 during the preceding 12 months (or for such shorter period that the registrant was required to file such reports), and (2) has been subject to such filing requirements for the past 90 days. Yes No
Indicate by check mark if disclosure of delinquent filers pursuant to Item 405 of Regulation S-K is not contained herein, and will not be contained, to the best of the registrant’s knowledge, in definitive proxy or information statements incorporatedby reference in Part III of this Form 10-K or any amendment to this Form 10-K.
Indicate by check mark whether the registrant is a large accelerated filer, an accelerated filer, or a nonaccelerated filer. See definition of “accelerated filer and large accelerated filer” in Rule 12b-2 of the Exchange Act. (Check one):
Large accelerated filer Accelerated filer Nonaccelerated filer
Indicate by check mark whether the registrant is a shell company (as defined in Rule 12b-2 of the Securities Exchange Act). Yes No
The aggregate market value of the registrant’s common stock held by nonaffiliates of the registrant as of June 30, 2006 (assuming, for the sole purpose of this calculation, that all directors and executive officers of the registrant are “affiliates”) was $5,583,408,424 (based on the closing sale price of the registrant’s common stock as reported on the New York Stock Exchange).
There were 479,858,723 shares of common stock outstanding as of January 26, 2007.
DOCUMENTS INCORPORATED BY REFERENCEPortions of the registrant’s Proxy Statement for the Annual Meeting of Shareowners to be held on April 24, 2007 are
incorporated by reference in Part III.
United States Securities and Exchange Commission
Washington, DC 20549
FORM 10-KAnnual Report Pursuant to Section 13 or 15(d) of the Securities Exchange Act of 1934
for the fiscal year ended December 31, 2006
Transition Report Pursuant to Section 13 or 15(d) of the Securities Exchange Act of 1934 for the transition period from ________ to ________.
Commission File Number: 01-09300
2 Coca-Cola Enterprises Inc. – 2006 Form 10-K
TABLE OF CONTENTS
Part I. Page
ITEM 1. Business 3 Introduction 3 Relationship with The Coca-Cola Company 3 Territories 3 Products 3 Marketing 4 Raw Materials 5 North American Beverage Agreements 6 European Beverage Agreements 9 Competition 10 Employees 11 Governmental Regulation 11 Financial Information on Industry Segments and Geographic Areas 13 For More Information About Us 13
Executive Officers of the Registrant 13
ITEM 1A. Risk Factors 16
ITEM 1B. Unresolved Staff Comments 16
ITEM 2. Properties 16
ITEM 3. Legal Proceedings 16
ITEM 4. Submission of Matters to a Vote of Security Holders 17
Part II. ITEM 5. Market for Registrant’s Common Equity, Related Stockholder Matters and Issuer Purchases of Equity Securities 18
ITEM 6. Selected Financial Data 19
ITEM 7. Management’s Discussion and Analysis of Financial Condition and Results of Operations 20
ITEM 7A. Quantitative and Qualitative Disclosures About Market Risk 36
ITEM 8. Financial Statements and Supplementary Data 37
ITEM 9. Changes in and Disagreements with Accountants on Accounting and Financial Disclosure 66
ITEM 9A. Controls and Procedures 66
ITEM 9B. Other Information 66
Part III. ITEM 10. Directors and Executive Officers and Corporate Governance 67
ITEM 11. Executive Compensation 67
ITEM 12. Security Ownership of Certain Beneficial Owners and Management and Related Stockholder Matters 67
ITEM 13. Certain Relationships and Related Transactions and Director Independence 67
ITEM 14. Principal Accountant Fees and Services 67
Part IV. ITEM 15. Exhibits and Financial Statement Schedules 68
SIGNATURES 73

Coca-Cola Enterprises Inc. – 2006 Form 10-K 3
Part IITEM 1. BUSINESS
IntroductionCOCA-COLA ENTERPRISES INC. AT A GLANCE
• Markets, sells, manufactures, and distributes nonalcoholic beverages
• Serves a market of approximately 412 million consumers throughout North America, Great Britain, continental France, Belgium, the Netherlands, Luxembourg, and Monaco
• Is the world’s largest Coca-Cola bottler• Represents approximately 19% of total Coca-Cola
product volume worldwide
We were incorporated in Delaware in 1944 by The Coca-Cola Company, and we have been a publicly traded company since 1986. At December 31, 2006, The Coca-Cola Company owned approximately 35% of our common stock.
Our bottling territories in North America and Europe contained approximately 412 million people at the end of 2006. We sold approximately 42 billion bottles and cans (or 2 billion physical cases) throughout our territories in 2006. Products licensed to us through The Coca-Cola Company and its affi liates and its joint ventures represented about 93% of this volume.
We have perpetual bottling rights within the United States for products with the name “Coca-Cola.” For substantially all other products within the United States, and all products else-where, the bottling rights have stated expiration dates. Some of these agreements are currently the subject of temporary extensions, as we negotiate defi nitive agreements with The Coca-Cola Company for renewal periods. For all bottling rights granted by The Coca-Cola Company with stated expiration dates, we believe our interdependent relationship with The Coca-Cola Company and the substantial cost and disruption to that company that would be caused by nonrenewals of these licenses ensure that they will be renewed upon expiration. The terms of these licenses are discussed in more detail in the sections of this report entitled “North American Beverage Agreements” and “European Beverage Agreements.”
References in this report to “we,” “our,” or “us” refer to Coca-Cola Enterprises Inc. and its subsidiaries and divisions, unless the context requires otherwise.
Relationship with The Coca-Cola Company The Coca-Cola Company is our largest shareowner. Two
of our thirteen directors are executive offi cers of The Coca-Cola Company.
We conduct our business primarily under agreements with The Coca-Cola Company. These agreements give us the exclu-sive right to produce, market, and distribute beverage products of The Coca-Cola Company in authorized containers in specifi ed territories. These agreements provide The Coca-Cola Company with the ability, in its sole discretion, to establish prices, terms of payment, and other terms and conditions for our purchase of concentrates and syrups from The Coca-Cola Company. See “North American Beverage Agreements” and “European Beverage Agreements.” Other signifi cant transactions and agreements with The Coca-Cola Company include arrange-ments for cooperative marketing, advertising expenditures, purchases of sweeteners, strategic marketing initiatives, and, from time to time, acquisitions of bottling territories.
We and The Coca-Cola Company continue to expand all aspects of our respective operations to ensure that we are operating in the most effi cient and effective way possible. This analysis includes our supply chains, information services, and sales organizations. In addition, our objective is to simplify our relationship and to better align our mutual economic interests, which would free up system resources to reinvest against our brands and to drive growth.
Territories Our bottling territories in North America are located in 46 states of the United States, the District of Columbia, the United States Virgin Islands, and all ten provinces of Canada. At December 31, 2006, these territories contained approximately 265 million people, representing about 79% of the population of the United States and 98% of the population of Canada.
Our bottling territories in Europe consist of Belgium, conti-nental France, Great Britain, Luxembourg, Monaco, and the Netherlands. The aggregate population of these territories was approximately 147 million at December 31, 2006.
During 2006, the revenue split between our North American and European operations was 72% and 28%, respectively. Great Britain contributed approximately 45% of European net operating revenues in 2006.
Products Our top fi ve brands in North America in 2006:
• Coca-Cola classic • Diet Coke • Sprite • Dasani • POWERade
Our top fi ve brands in Europe in 2006: • Coca-Cola • Diet Coke/Coca-Cola light• Fanta • Schweppes • Sprite
We manufacture most of our fi nished product from syrups and concentrates that we buy from The Coca-Cola Company and other licensors.
We deliver most of our product directly to retailers for sale to the ultimate consumers, but for some products, in some territo-ries, we distribute through wholesalers who deliver to retailers.
During 2006, our package mix (based on wholesale physical case volume) was as follows:
• In North America: 59.5% cans 14.0% 20-ounce 11.0% 2-liter 15.5% other
• In Europe: 38.0% cans 32.5% multi-serve PET (1-liter and greater) 13.5% single-serve PET 16.0% other

4 Coca-Cola Enterprises Inc. – 2006 Form 10-K
MarketingPROGRAMS
We rely extensively on advertising and sales promotions in marketing our products. The Coca-Cola Company and the other beverage companies that supply concentrates, syrups, and fi nished products to us make advertising expenditures in all major media to promote sales in the local areas we serve. We also benefi t from national advertising programs conducted by The Coca-Cola Company and other beverage companies. Certain of the marketing expenditures by The Coca-Cola Company and other beverage companies are made pursuant to annual arrangements.
We and The Coca-Cola Company engage in a variety of marketing programs to promote the sale of products of The Coca-Cola Company in territories in which we operate. The amounts to be paid under the programs are determined annually and periodically as the programs progress. The Coca-Cola Company is under no obligation to participate in the programs or continue past levels of funding in the future. The amounts paid and terms of similar programs may differ with other licensees. Marketing support funding programs granted to us provide fi nancial support, principally based on product sales, to offset a portion of the costs to us of the programs.
Global Marketing Fund. Under its Global Marketing Fund, The Coca-Cola Company pays us $61.5 million annually through December 31, 2014, as support for marketing activities. The term of the fund will automatically be extended for successive ten-year periods thereafter unless either party gives written notice of termination. The marketing activities to be funded will be agreed upon each year as part of the annual joint planning process and will be incorporated into the annual marketing plans of both companies. The Coca-Cola Company may terminate this fund for the balance of any year in which we fail to timely complete the marketing plans or are unable to execute the elements of these plans, when the ability to prevent such failures are within our reasonable control.
Cold Drink Equipment Programs. We and The Coca-Cola Company (or its affi liates) are parties to Cold Drink Equipment Purchase Partnership programs covering certain of our territo-ries in the United States, Canada, and Europe. The agreements establishing the terms and conditions of these programs have been amended several times – most recently in January 2002, August 2004, February 2005, and December 2005.
Under the January 2002 amendments and restatements, we committed to place 1,200,174 cumulative units of vending equipment in the United States over the period 1999 – 2008; 242,665 units in Canada over the period 1998 – 2008; and 396,867 units in Europe over the period 1998 – 2008.
In the August 2004 amendments, the placement of certain vending equipment in the United States and Canada was deferred from 2004 and 2005 to 2009 and 2010. In exchange for these amendments, we agreed to pay The Coca-Cola Company a total of $15 million, including $1.5 million in 2004, $3 million annually in 2005 through 2008, and $1.5 million in 2009.
In the February 2005 amendment, our European obligations were amended to measure equipment obligations on an annual Europe-wide basis, rather than on a quarterly country-by-country basis, and to alter the mix between coolers and venders. In addition, certain coolers count more than one unit in determin-ing whether we meet our obligations.
In the December 2005 amendments and restatements of our agreements for the United States and Canada, we moved to a system of “credits” based upon the type of equipment placed (or enhancements to units), based upon expected gross profi t contribution. These credits would be applied against annual units required to be placed. The amendments also provided that no violation of the programs will occur upon a shortfall in any year in attaining the required number of credits, so long as the shortfall does not exceed 20% of the required credits, a compensating payment is made to The Coca-Cola Company or its affi liate, and the shortfall is corrected in the following year. The December 2005 amendments were effec-tive as of January 1, 2005.
Under the Cold Drink Equipment Purchase Partnership programs, we are committed to purchase approximately 1.8 million cumulative units of vending equipment through 2010. The agreements specify the number of venders and manual equipment that must be purchased by us in each year during the term of the agreement. Our failure to achieve the required number of credits in any year will not be a violation of the United States or Canadian agreements, provided the condi-tions described in the December 2005 amendments are met.
If we fail to meet our minimum purchase requirements for any calendar year, we will meet with The Coca-Cola Company to mutually develop a reasonable solution/alternative based on marketplace developments, mutual assessment and agreement relative to the continuing availability of profi table placement opportunities, and continuing participation in the market planning process between the two companies. The program can be terminated if no agreement about the short-fall is reached, and the shortfall is not remedied by the end of the fi rst quarter of the succeeding calendar year. The pro-gram can also be terminated if the agreement is otherwise breached by us and not resolved within 90 days after notice from The Coca-Cola Company. Upon termination, certain funding amounts previously paid to us would be repaid to The Coca-Cola Company, plus interest at one percent per month from the date of initial funding. However, provided that we have partially performed, such repayment obligation shall be reduced to such lesser amount as The Coca-Cola Company shall reasonably determine will be adequate to deliver the fi nancial returns that would have been received by The Coca-Cola Company had all equipment placement commitments been fully performed, and had the vending volume reasonably anticipated by The Coca-Cola Company been achieved. We would be excused from any failure to perform under the program that is occasioned by any cause beyond our reasonable control.
Equipment purchased by us is to be kept in place at cus-tomer locations for at least 12 years from date of purchase, with certain exceptions.
We are required to establish, maintain, and publish for our employees a “fl avor set standard” applicable to all venders and units of manual equipment we own, requiring a certain percentage of the products dispensed to be products of The Coca-Cola Company.
For 12 years following the purchase of equipment, we are required to report to The Coca-Cola Company whether equip-ment purchased under the program has generated, on average, a specifi ed minimum weekly volume and/or gross profi t for The Coca-Cola Company during the preceding twelve months. If we are in material breach of any of our agreements with respect to the production and sale of products of The Coca-Cola

Coca-Cola Enterprises Inc. – 2006 Form 10-K 5
Company during the term of the agreement, or if we attempt to terminate any of those agreements absent breach by The Coca-Cola Company, then The Coca-Cola Company may termi-nate the program and recover all money paid to us under the agreement. In the event of a partial performance, the amount to be repaid would be reduced to an amount that is adequate (in The Coca-Cola Company’s reasonable determination) to deliver the fi nancial returns that would have been received by The Coca-Cola Company had all equipment placement commit-ments been fully performed, and had reasonably anticipated throughputs and/or gross profi t for The Coca-Cola Company been achieved.
We received approximately $1.2 billion in payments under the programs during the period 1994 through 2001. No addi-tional amounts are due.
No refunds of amounts previously earned have ever been paid under these programs, and we believe the probability of a partial refund of amounts previously earned under the pro-grams is remote. We believe we would in all cases resolve any matters that might arise regarding these programs. We and The Coca-Cola Company have amended prior agreements to refl ect, where appropriate, modifi ed goals, and we believe that we can continue to resolve any differences that might arise over our performance requirements under the cold drink equip-ment programs, as evidenced by our amendments to the North American programs in 2004 and 2005, discussed above.
Transition Support Funding for Herb Coca-Cola. The Coca-Cola Company has agreed to provide support payments for the marketing of certain of its brands in the territories of Hondo Incorporated and Herbco Enterprises, Inc. acquired by us in July 2001. We received $14 million in 2006 and will receive $14 million annually through 2008, and $11 million in 2009. Payments received and earned under this agreement are not refundable to The Coca-Cola Company.
SEASONALITY
Sales of our products are seasonal, with the second and third calendar quarters accounting for higher sales volumes than the fi rst and fourth quarters. Sales in the European bottling territories are more volatile because of the higher sensitivity of European consumption to weather conditions.
LARGE CUSTOMERS
Approximately 54% of our North American bottle and can volume and approximately 43% of our European bottle and can volume are sold through the supermarket channel. The supermarket industry is in the process of consolidating, and a few chains control a signifi cant amount of the volume. The loss of one or more chains as a customer could have a mate-rial adverse effect upon our business, but we believe that any such loss in North America would be unlikely, because of our products’ proven ability to bring retail traffi c into the super-market and the resulting benefi ts to the store, and because we are the only source for our bottle and can products within our exclusive territories. Within the European Union, however, our customers can order from any other Coca-Cola bottler within the EU, some of which may have lower prices than our European bottlers. No customer accounted for 10% or more of our consolidated revenue in 2006, although 2006 sales to Wal-Mart Stores Inc. and its affi liated companies exceeded 10% of our North American revenues.
Raw Materials In addition to concentrates, sweeteners, juices, and fi nished product, we purchase carbon dioxide, PET preforms, glass and plastic bottles, cans, closures, post-mix (fountain syrup) packaging — such as plastic bags in cardboard boxes — and other packaging materials. We generally purchase our raw materials, other than concentrates, syrups, mineral waters, and sweeteners, from multiple suppliers. The beverage agreements with The Coca-Cola Company provide that all authorized containers, closures, cases, cartons and other packages, and labels for the products of The Coca-Cola Company must be purchased from manufacturers approved by The Coca-Cola Company.
High fructose corn syrup is the principal sweetener used by us in the United States and Canada for beverage products, other than low-calorie products, of The Coca-Cola Company and other cross-franchise brands. Sugar (sucrose) was also used as a sweetener in Canada during 2006. During 2006, substantially all of our requirements for sweeteners in the United States were supplied through purchases by us from The Coca-Cola Company. In Europe, the principal sweetener is sugar from sugar beets, purchased from multiple suppli-ers. We do not separately purchase low-calorie sweeteners, because sweeteners for low-calorie beverage products are contained in the syrup or concentrate we purchase.
We currently purchase most of our requirements for plastic bottles in North America from manufacturers jointly owned by us and other Coca-Cola bottlers, one of which is a production cooperative in which we participate. We are the majority share-owner of Western Container Corporation, a major producer of plastic bottles. In Europe, we produce most of our plastic bottle requirements using preforms purchased from various merchant suppliers. We believe that ownership interests in certain sup-pliers, participation in cooperatives, and the self-manufacture of certain packages serve to reduce or manage costs.
We, together with all other bottlers of Coca-Cola in the United States, are a member of the Coca-Cola Bottlers’ Sales & Services Company LLC (“CCBSS”), which combines the pur-chasing volumes for goods and supplies of multiple Coca-Cola bottlers to achieve effi ciencies in purchasing. CCBSS currently participates in procurement activities with other large Coca-Cola bottlers worldwide. Through its Customer Business Solutions group, CCBSS also consolidates North American sales infor-mation for national customers.
We do not use any materials or supplies that are currently in short supply, although the supply and price of specifi c materials or supplies are periodically adversely affected by strikes, weather conditions, governmental controls, national emergencies, and price or supply fl uctuations of their raw material components.
We anticipate signifi cant increases in the cost of certain raw materials during 2007, principally high fructose corn syrup (“HFCS”) and aluminum used in our cans. In addition, we believe that the HFCS cost increases may continue into 2008.
In recent years, there has been consolidation among sup-pliers of certain of our raw materials. This reduction in the number of competitive sources of supply can have an adverse effect upon our ability to negotiate the lowest costs and, in light of our relatively small in-plant raw material inventory levels, has the potential for causing interruptions in our supply of raw materials.
6 Coca-Cola Enterprises Inc. – 2006 Form 10-K
North American Beverage Agreements POWERADE LITIGATION
Certain aspects of the United States beverage agreements described in this report are affected by the proposed settle-ment of the Ozarks Coca-Cola/Dr. Pepper Bottling Companyand the Coca-Cola Bottling Company United lawsuits discussed later in this report in Part I, Item 3 (“Legal Proceedings”). Approved alternative route to market projects undertaken by us, The Coca-Cola Company, and other bottlers of Coca-Cola would, in some instances, permit delivery into the territories of all bottlers (in exchange for compensation in most circum-stances) despite the terms of the United States beverage agreements making such territories exclusive.
PRICING
Pursuant to the North American beverage agreements, The Coca-Cola Company establishes the prices charged to us for concentrates for beverages bearing the trademark “Coca-Cola” or “Coke” (the “Coca-Cola Trademark Beverages”), Allied Beverages (as defi ned below), noncarbonated beverages, and post-mix. The Coca-Cola Company has no rights under the United States beverage agreements to establish the resale prices at which we sell our products.
DOMESTIC COLA AND ALLIED BEVERAGE AGREEMENTS
IN THE UNITED STATES WITH THE COCA-COLA COMPANY
We purchase concentrates from The Coca-Cola Company and produce, market, and distribute our principal nonalcoholic beverage products within the United States under two basic forms of beverage agreements with The Coca-Cola Company: beverage agreements that cover the Coca-Cola Trademark Beverages (the “Cola Beverage Agreements”), and beverage agreements that cover other carbonated and some noncar-bonated beverages of The Coca-Cola Company (the “Allied Beverages” and “Allied Beverage Agreements”) (referred to collectively in this report as the “Domestic Cola and Allied Beverage Agreements”), although in some instances we dis-tribute carbonated and noncarbonated beverages without a written agreement. We are a party to one Cola Beverage Agreement and to various Allied Beverage Agreements for each territory. In this “North American Beverage Agreements” section, unless the context indicates otherwise, a reference to us refers to the legal entity in the United States that is a party to the beverage agreements with The Coca-Cola Company.
COLA BEVERAGE AGREEMENTS IN THE UNITED STATES
WITH THE COCA-COLA COMPANY
Exclusivity. The Cola Beverage Agreements provide that we will purchase our entire requirements of concentrates and syrups for Coca-Cola Trademark Beverages from The Coca-Cola Company at prices, terms of payment, and other terms and conditions of supply determined from time to time by The Coca-Cola Company at its sole discretion. We may not pro-duce, distribute, or handle cola products other than those of The Coca-Cola Company. We have the exclusive right to dis-tribute Coca-Cola Trademark Beverages for sale in authorized containers within our territories. The Coca-Cola Company may determine, at its sole discretion, what types of containers are authorized for use with products of The Coca-Cola Company.
Transshipping. We may not sell Coca-Cola Trademark Beverages outside our territories.
Our Obligations. We are obligated: (a) to maintain such plant and equipment, staff and distribu-
tion, and vending facilities as are capable of manufac-turing, packaging, and distributing Coca-Cola Trademark Beverages in accordance with the Cola Beverage Agreements and in suffi cient quantities to satisfy fully the demand for these beverages in our territories;
(b) to undertake adequate quality control measures prescribed by The Coca-Cola Company;
(c) to develop and to stimulate the demand for Coca-Cola Trademark Beverages in our territories;
(d) to use all approved means and spend such funds on advertising and other forms of marketing as may be reasonably required to satisfy that objective; and
(e) to maintain such sound fi nancial capacity as may be reasonably necessary to assure our performance of our obligations to The Coca-Cola Company.
We are required to meet annually with The Coca-Cola Company to present our marketing, management, and adver-tising plans for the Coca-Cola Trademark Beverages for the upcoming year, including fi nancial plans showing that we have the consolidated fi nancial capacity to perform our duties and obligations to The Coca-Cola Company. The Coca-Cola Company may not unreasonably withhold approval of such plans. If we carry out our plans in all material respects, we will be deemed to have satisfi ed our obligations to develop, stimulate, and satisfy fully the demand for the Coca-Cola Trademark Beverages and to maintain the requisite fi nancial capacity. Failure to carry out such plans in all material respects would constitute an event of default that, if not cured within 120 days of written notice of the failure, would give The Coca-Cola Company the right to terminate the Cola Beverage Agreements. If we, at any time, fail to carry out a plan in all material respects in any geographic segment of our territory, and if such failure is not cured within six months after written notice of the failure, The Coca-Cola Company may reduce the territory covered by that Cola Beverage Agreement by eliminat-ing the portion of the territory in which such failure has occurred.
Acquisition of Other Bottlers. If we acquire control, directly or indirectly, of any bottler of Coca-Cola Trademark Beverages in the United States, or any party controlling a bottler of Coca-Cola Trademark Beverages in the United States, we must cause the acquired bottler to amend its agreement for the Coca-Cola Trademark Beverages to conform to the terms of the Cola Beverage Agreements.
Term and Termination. The Cola Beverage Agreements are perpetual, but they are subject to termination by The Coca-Cola Company upon the occurrence of an event of default by us. Events of default with respect to each Cola Beverage Agreement include:
(a) production or sale of any cola product not authorized by The Coca-Cola Company;
(b) insolvency, bankruptcy, dissolution, receivership, or the like;
(c) any disposition by us of any voting securities of any bottling company without the consent of The Coca-Cola Company; and
(d) any material breach of any of our obligations under that Cola Beverage Agreement that remains unresolved for 120 days after written notice by The Coca-Cola Company.

Coca-Cola Enterprises Inc. – 2006 Form 10-K 7
If any Cola Beverage Agreement is terminated because of an event of default, The Coca-Cola Company has the right to terminate all other Cola Beverage Agreements we hold.
In addition, each Cola Beverage Agreement provides that The Coca-Cola Company has the right to terminate that Cola Beverage Agreement if a person or affi liated group (with spec-ifi ed exceptions) acquires or obtains any contract or other right to acquire, directly or indirectly, benefi cial ownership of more than 10% of any class or series of our voting securities. However, The Coca-Cola Company has agreed with us that this provision will not apply with respect to the ownership of any class or series of our voting securities, although it applies to the voting securities of each bottling company subsidiary.
The provisions of the Cola Beverage Agreements that make it an event of default to dispose of any Cola Beverage Agreement or voting securities of any bottling company sub-sidiary without the consent of The Coca-Cola Company and that prohibit the assignment or transfer of the Cola Beverage Agreements are designed to preclude any person not accept-able to The Coca-Cola Company from obtaining an assignment of a Cola Beverage Agreement or from acquiring any of our voting securities of our bottling subsidiaries. These provisions prevent us from selling or transferring any of our interest in any bottling operations without the consent of The Coca-Cola Company. These provisions may also make it impossible for us to benefi t from certain transactions, such as mergers or acquisitions that might be benefi cial to us and our shareown-ers, but which are not acceptable to The Coca-Cola Company.
ALLIED BEVERAGE AGREEMENTS IN THE
UNITED STATES WITH THE COCA-COLA COMPANY
The Allied Beverages are beverages of The Coca-Cola Company, its subsidiaries, and joint ventures that are either carbonated beverages, but not Coca-Cola Trademark Beverages, or are certain noncarbonated beverages, such as Hi-C fruit drinks. The Allied Beverage Agreements contain provisions that are similar to those of the Cola Beverage Agreements with respect to transshipping, authorized containers, planning, quality con-trol, transfer restrictions, and related matters but have certain signifi cant differences from the Cola Beverage Agreements.
Exclusivity. Under the Allied Beverage Agreements, we have exclusive rights to distribute the Allied Beverages in authorized containers in specified territories. Like the Cola Beverage Agreements, we have advertising, marketing, and promotional obligations, but without restriction for most brands as to the marketing of products with similar flavors, as long as there is no manufacturing or handling of other products that would imitate, infringe upon or cause confusion with, the products of The Coca-Cola Company. The Coca-Cola Company has the right to discontinue any or all Allied Beverages, and we have a right, but not an obligation, under each of the Allied Beverage Agreements (except under the Allied Beverage Agreements for Hi-C fruit drinks) to elect to market any new beverage intro-duced by The Coca-Cola Company under the trademarks covered by the respective Allied Beverage Agreements.
Term and Termination. Each Allied Beverage Agreement has a term of ten or fi fteen years and is renewable by us for an additional ten or fi fteen years at the end of each term. Renewal is at our option. We currently intend to renew substantially all the Allied Beverage Agreements as they expire. The Allied
Beverage Agreements are subject to termination in the event we default. The Coca-Cola Company may terminate an Allied Beverage Agreement in the event of: (i) insolvency, bankruptcy, dissolution, receivership, or the like; (ii) termination of our Cola Beverage Agreement by either party for any reason; or (iii) any material breach of any of our obligations under the Allied Beverage Agreement that remains uncured after required prior written notice by The Coca-Cola Company.
NONCARBONATED BEVERAGE AGREEMENTS IN THE
UNITED STATES WITH THE COCA-COLA COMPANY
We purchase and distribute certain noncarbonated beverages such as isotonics and juice drinks in finished form from The Coca-Cola Company, or its designees or joint ventures, and produce, market, and distribute Dasani water, pursuant to the terms of marketing and distribution agreements (the “Noncarbonated Beverage Agreements”). The Noncarbonated Beverage Agreements contain provisions that are similar to the Domestic Cola and Allied Beverage Agreements with respect to authorized containers, planning, quality control, transfer restrictions, and related matters but have certain signifi cant differences from the Domestic Cola and Allied Beverage Agreements.
Exclusivity. Unlike the Domestic Cola and Allied Beverage Agreements, which grant us exclusivity in the distribution of the covered beverages in our territory, the Noncarbonated Beverage Agreements grant exclusivity but permit The Coca-Cola Company to test market the noncarbonated bev-erage products in the territory, subject to our right of first refusal to do so, and to sell the noncarbonated beverages to commissaries for delivery to retail outlets in the territory where noncarbonated beverages are consumed on-premise, such as restaurants. The Coca-Cola Company must pay us certain fees for lost volume, delivery, and taxes in the event of such commissary sales. Also, under the Noncarbonated Beverage Agreements, we may not sell other beverages in the same product category.
Pricing. The Coca-Cola Company, at its sole discretion, establishes the pricing we must pay for the noncarbonated beverages or, in the case of Dasani, the concentrate, but has agreed, under certain circumstances for some products, to give the benefi t of more favorable pricing if such pricing is offered to other bottlers of Coca-Cola products.
Term. Each of the Noncarbonated Beverage Agreements has a term of ten or fi fteen years and is renewable by us for an additional ten years at the end of each term. Renewal is at our option. We currently intend to renew substantially all of the Noncarbonated Beverage Agreements as they expire.
MARKETING AND OTHER SUPPORT IN THE
UNITED STATES FROM THE COCA-COLA COMPANY
The Coca-Cola Company has no obligation under the Domestic Cola and Allied Beverage Agreements and Noncarbonated Beverage Agreements to participate with us in expenditures for advertising, marketing, and other support. However, it contributed to such expenditures and undertook independent advertising and marketing activities, as well as cooperative advertising and sales promotion programs in 2006. See “Marketing — Programs.”

8 Coca-Cola Enterprises Inc. – 2006 Form 10-K
POST-MIX SALES AND MARKETING AGREEMENTS IN THE
UNITED STATES WITH THE COCA-COLA COMPANY
We have a distributorship appointment that ends on December 31, 2007 to sell and deliver the post-mix products of The Coca-Cola Company. The appointment is terminable by either party for any reason upon ten days’ written notice. Under the terms of the appointment, we are authorized to dis-tribute such products to retailers for dispensing to consumers within the United States. Unlike the Domestic Cola and Allied Beverage Agreements, there is no exclusive territory, and we face competition not only from sellers of other such products but also from other sellers of such products (including The Coca-Cola Company). In 2006, we sold and/or delivered such post-mix products in all of our major territories in the United States. Depending on the territory, we are involved in the sale, distribution, and marketing of post-mix syrups in differing degrees. In some territories, we sell syrup on our own behalf, but the primary responsibility for marketing lies with The Coca-Cola Company. In other territories, we are responsible for marketing post-mix syrup to certain segments of the business.
BEVERAGE AGREEMENTS IN THE UNITED STATES WITH OTHER LICENSORS
The beverage agreements in the United States between us and other licensors of beverage products and syrups contain restrictions generally similar in effect to those in the Domestic Cola and Allied Beverage Agreements as to use of trademarks and trade names, approved bottles, cans and labels, sale of imitations, and causes for termination. Those agreements generally give those licensors the unilateral right to change the prices for their products and syrups at any time in their sole discretion. Some of these beverage agreements have limited terms of appointment and, in most instances, prohibit us from dealing in products with similar fl avors in certain territories. Our agreements with subsidiaries of Cadbury Schweppes plc, which represented in 2006 approximately 7% of the beverages sold by us in the United States and the Caribbean, provide that the parties will give each other at least one year’s notice prior to terminating the agreement for any brand, and pay certain fees in some circumstances. Also, we have agreed that we would not cease distributing Dr Pepper brand products prior to December 31, 2010, or Canada Dry, Schweppes, or Squirt brand products prior to December 31, 2010. The termination provisions for Dr Pepper renew for fi ve-year periods; those for the other Cadbury brands renew for three-year periods.
We distribute Rockstar beverages under a subdistribution agreement with The Coca-Cola Company that has terms and conditions similar in many respects to the Allied Beverage Agreements. The Rockstar subdistribution agreement has a four-year term, does not cover all our territory in the United States, and permits certain other sellers of Rockstar beverages in the territory to continue distribution. We purchase Rockstar beverages from Rockstar, Inc. and pay certain fees to The Coca-Cola Company.
In 2007, we will begin the distribution of AriZona Tea in the United States. We have the exclusive rights to distribute cer-tain AriZona brands and packages in certain channels in certain territories for fi ve years, with options to renew. We have addi-tional rights of fi rst refusal for any additional fl avors of the same package in the United States.
CANADIAN BEVERAGE AGREEMENTS WITH THE COCA-COLA COMPANY
Our bottler in Canada produces, markets, and distributes Coca-Cola Trademark Beverages, Allied Beverages, and non-carbonated beverages of The Coca-Cola Company and Coca-Cola
Ltd., an affi liate of The Coca-Cola Company (“Coca-Cola Beverage Products”), in its territories pursuant to license agreements and arrangements with Coca-Cola Ltd., and in cer-tain cases, with The Coca-Cola Company (“Canadian Beverage Agreements”). The Canadian Beverage Agreements are similar to the Domestic Cola and Allied Beverage Agreements with respect to authorized containers, planning, quality control, transshipping, transfer restrictions, termination, and related matters but have certain signifi cant differences from the Domestic Cola and Allied Beverage Agreements.
Exclusivity. The Canadian Beverage Agreement for Coca-Cola Trademark Beverages gives us the exclusive right to distribute Coca-Cola Trademark Beverages in our territories in bottles authorized by Coca-Cola Ltd. We are also authorized on a nonexclusive basis to sell, distribute, and produce canned, pre-mix, and post-mix Coca-Cola Trademark Beverages in such territories. At present, there are no other authorized producers or distributors of canned, pre-mix, or post-mix Coca-Cola Trademark Beverages in our territories, and we have been advised by Coca-Cola Ltd. that there are no pres-ent intentions to authorize any such producers or distributors in the future. In general, the Canadian Beverage Agreement for Coca-Cola Trademark Beverages prohibits us from pro-ducing or distributing beverages other than the Coca-Cola Trademark Beverages unless Coca-Cola Ltd. has given us written notice that it approves the production and distribu-tion of such beverages.
Pricing. Coca-Cola Ltd., an affi liate of The Coca-Cola Company, supplies the concentrates for the Coca-Cola Trademark Beverages and may establish and revise at any time the price of concentrates, the payment terms, and the other terms and conditions under which we purchase concentrates for the Coca-Cola Trademark Beverages. Unlike other beverage agreements in other parts of the world, Coca-Cola Ltd. may, in its sole discretion, establish maximum prices at which the Coca-Cola Trademark Beverages may be sold by us to our retailers. Coca-Cola Ltd. may also establish maximum retail prices for such beverages, and we are required to use our best efforts to maintain such maximum retail prices. We may not require a deposit on any container used by us for the sale of the Coca-Cola Trademark Beverages unless we are required by law or approved by Coca-Cola Ltd., and, if a deposit is required, such deposit may not exceed the greater of the minimum deposit required by law or the deposit approved by Coca-Cola Ltd.
Term. The Canadian Beverage Agreements for Coca-Cola Trademark Beverages expire on July 28, 2007, with provisions to renew for two additional terms of ten years each, pro-vided generally that we have complied with and continue to be capable of complying with their provisions. We are working with Coca-Cola Ltd. and The Coca-Cola Company to reach new agreements that will meet mutually acceptable objectives. We believe that our interdependent relationship with The Coca-Cola Company and the substantial cost and disruption to that company that would be caused by nonre-newals ensure that these agreements will be renewed upon expiration. Our authorizations to produce, distribute, and sell pre-mix and post-mix Coca-Cola Trademark Beverages may be terminated by either party on 90 days’ written notice.

Coca-Cola Enterprises Inc. – 2006 Form 10-K 9
Marketing and Other Support. Coca-Cola Ltd. has no obligation under the Canadian Beverage Agreements to participate with us in expenditures for advertising, marketing, and other support. However, it contributed to such expenditures and undertook independent advertising and marketing activities, as well as cooperative advertising and sales promotion programs in 2006. See “Marketing — Programs.”
Other Coca-Cola Beverage Products. Our license agreements and arrangements with Coca-Cola Ltd., and in certain cases, with The Coca-Cola Company, for the Coca-Cola Beverage Products other than Coca-Cola Trademark Beverages are on terms generally similar to those contained in the license agree-ment for the Coca-Cola Trademark Beverages.
BEVERAGE AGREEMENTS IN CANADA WITH OTHER LICENSORS
We have several license agreements and arrangements with other licensors, including license agreements with subsidiaries of Cadbury Schweppes plc having terms expiring on July 27, 2007 and in December 2036, each being renewable for succes-sive fi ve-year terms until terminated by either party. We are working with Cadbury Schweppes to reach a new agreement that will meet mutually acceptable objectives for the agreement due to expire on July 27, 2007. Given the potential disruption and cost to the system that would be caused by a nonrenewal, it is expected that new agreements will be reached prior to the expiration date. These beverage agreements generally give us the exclusive right to produce and distribute authorized bev-erages in authorized packaging in specifi ed territories. These beverage agreements also generally provide fl exible pricing for the licensors, and in many instances, prohibit us from dealing in beverages confusing with, or imitative of, the authorized beverages. These agreements contain restrictions generally similar to those in the Canadian Beverage Agreements regard-ing the use of trademarks, approved bottles, cans and labels, sales of imitations, and causes for termination. We have exclu-sive rights throughout Canada for the distribution of Rockstar beverages, which began in 2005. In 2006, we began distribution of AriZona Teas in Canada. We have the exclusive rights to distribute certain AriZona brands and packages for fi ve years, with options to renew. We have additional rights of fi rst refusal for any additional AriZona brands and packages.
European Beverage Agreements EUROPEAN BEVERAGE AGREEMENTS WITH THE COCA-COLA COMPANY
Our bottlers in Belgium, continental France, Great Britain, Monaco, and the Netherlands and our distributor in Luxembourg (the “European Bottlers”) operate in their respective territories under bottler and distributor agreements with The Coca-Cola Company and The Coca-Cola Export Corporation (the “European Beverage Agreements”). The European Beverage Agreements have certain signifi cant differences, described below, from the beverage agreements in North America.
We believe that the European Beverage Agreements are substantially similar to other agreements between The Coca-Cola Company and other European bottlers of Coca-Cola Trademark Beverages and Allied Beverages.
Exclusivity. Subject to the European Supplemental Agreement, described below in this report, and certain minor exceptions, our European Bottlers have the exclusive rights granted by The Coca-Cola Company in their territories to sell the beverages covered by their respective European Beverage Agreements in
glass bottles, plastic bottles, and/or cans. The covered bever-ages include Coca-Cola Trademark Beverages, Allied Beverages, noncarbonated beverages, and certain beverages not sold in the United States. The Coca-Cola Company has retained the rights, under certain circumstances, to produce and sell, or authorize third parties to produce and sell, the beverages in any other manner or form within the territories. The Coca-Cola Company has granted our European Bottlers a nonexclusive authorization to package and sell post-mix and/or pre-mix beverages in their territories.
Transshipping. Our European Bottlers are prohibited from making sales of the beverages outside of their territories, or to anyone intending to resell the beverages outside their territories, without the consent of The Coca-Cola Company, except for sales arising out of an unsolicited order from a cus-tomer in another member state of the European Economic Area or for export to another such member state. The European Beverage Agreements also contemplate that there may be instances in which large or special buyers have operations transcending the boundaries of the territories, and in such instances, our European Bottlers agree not to oppose, with-out valid reason, any additional measures deemed necessary by The Coca-Cola Company to improve sales and distribution to such customers. Certain of our European territories, Great Britain in particular, are susceptible to transshipping from bottlers located in other countries where costs are lower. Transshipped product adversely affects our bottlers’ sales, and the trend has become material to our European sales.
Pricing. The European Beverage Agreements provide that the sales of concentrate, beverage base, juices, mineral waters, and other goods to our European Bottlers are at prices which are set from time to time by The Coca-Cola Company in its sole discretion.
Term and Termination. The European Beverage Agreements expired July 26, 2006 for Belgium, continental France, and the Netherlands; February 10, 2007 for Great Britain; and will expire January 30, 2008 for Luxembourg, unless terminated earlier as provided therein. If our European Bottlers have complied fully with the agreements during the initial term, are “capable of the continued promotion, development, and exploitation of the full potential of the business,” and request an extension of the agreement, an additional ten-year term may be granted at the sole discretion of The Coca-Cola Company.
In December 2005, we requested extensions of our agree-ments for Belgium, continental France, and the Netherlands, and in September 2006 we made a similar request for Great Britain. The agreements have been extended by The Coca-Cola Company on a temporary basis until August 10, 2007 for Great Britain, and until July 26, 2007 for Belgium, France, and the Netherlands. The Coca-Cola Company has taken the position that it would like to put in place a new form of agreement, and we have contended that we are entitled to extensions of the existing agreements. We intend to resolve these questions. We believe that our interdependent relationship with The Coca-Cola Company and the substantial cost and disruption to that company that would be caused by nonrenewals ensure that these contractual issues will be resolved.
In February 2007, we requested an extension of the Luxembourg agreement for an additional term of ten years.

10 Coca-Cola Enterprises Inc. – 2006 Form 10-K
The Coca-Cola Company is given the right to terminate the European Beverage Agreements before the expiration of the stated term upon the insolvency, bankruptcy, nationalization, or similar condition of our European Bottlers or the occurrence of a default under the European Beverage Agreements which is not remedied within 60 days of written notice of the default by The Coca-Cola Company. The European Beverage Agreements may be terminated by either party in the event foreign exchange is unavailable or local laws prevent perfor-mance. They also terminate automatically, after a certain lapse of time, if any of our European Bottlers refuse to pay a beverage base price increase for the beverage “Coca-Cola.” The post-mix and pre-mix authorizations are terminable by either party with 90 days’ prior written notice.
EUROPEAN SUPPLEMENTAL AGREEMENT WITH THE COCA-COLA COMPANY
In addition to the European Beverage Agreements described above, our European Bottlers (excluding the Luxembourg distributor), The Coca-Cola Company, and The Coca-Cola Export Corporation are parties to a supplemental agreement (the “European Supplemental Agreement”) with regard to our European Bottlers’ rights pursuant to the European Beverage Agreements. The European Supplemental Agreement permits our European Bottlers to prepare, package, distribute, and sell the beverages covered by any of our European Bottlers’ European Beverage Agreements in any other territory of our European Bottlers, provided that we and The Coca-Cola Company have reached agreement upon a business plan for such beverages. The European Supplemental Agreement may be terminated, either in whole or in part by territory, by The Coca-Cola Company at any time with 90 days’ prior written notice.
MARKETING AND OTHER SUPPORT IN EUROPE
FROM THE COCA-COLA COMPANY
The Coca-Cola Company has no obligation under the European Beverage Agreements to participate with us in expenditures for advertising, marketing, and other support. However, it con-tributed to such expenditures and undertook independent advertising and marketing activities, as well as cooperative advertising and sales promotion programs in 2006. See “Marketing — Programs.”
BEVERAGE AGREEMENTS IN EUROPE WITH OTHER LICENSORS
The beverage agreements between us and other licensors of beverage products and syrups generally give those licensors the unilateral right to change the prices for their products and syrups at any time in their sole discretion. Some of these beverage agreements have limited terms of appointment and, in most instances, prohibit us from dealing in products with similar fl avors. Those agreements contain restrictions generally similar in effect to those in the European Beverage Agreements as to the use of trademarks and trade names, approved bot-tles, cans and labels, sale of imitations, planning, and causes for termination. As a condition to Cadbury Schweppes plc’s sale of its 51% interest in the British bottler to us in February 1997, we entered into agreements concerning certain aspects of the Cadbury Schweppes products distributed by the British bottler (the “Cadbury Schweppes Agreements”). These agreements impose obligations upon us with respect to the marketing, sale, and distribution of Cadbury Schweppes prod-ucts within the British bottler’s territory. These agreements further require the British bottler to achieve certain agreed-upon growth rates for Cadbury Schweppes brands and grant
certain rights and remedies to Cadbury Schweppes if these rates are not met. These agreements also place some limita-tions upon the British bottler’s ability to discontinue Cadbury Schweppes brands, and recognize the exclusivity of certain Cadbury Schweppes brands in their respective fl avor categories. The British bottler is given the fi rst right to any new Cadbury Schweppes brands introduced in the territory. These agree-ments run through 2012 and are automatically renewed for a ten-year term thereafter unless terminated by either party. In 1999, The Coca-Cola Company acquired the Cadbury Schweppes beverage brands in, among other places, the United Kingdom. The Cadbury Schweppes beverage brands were not acquired in any other countries in which our European Bottlers operate. Some Cadbury Schweppes beverage brands were acquired by assignment and others by purchase of the entity owning the brand; both methods are referred to as “assignments” for purposes of this section. Pursuant to the acquisition, Cadbury Schweppes assigned the Cadbury Schweppes Agreements to an affi liate of The Coca-Cola Company. The assignment did not cause a substantive modifi cation of the terms and conditions of the Cadbury Schweppes Agreements.
CompetitionThe nonalcoholic beverage category of the commercial bev-erages industry in which we compete is highly competitive. We face competitors that differ not only between our North American and European territories, but also within individual markets in these territories. Moreover, competition exists not only in this category but also between the nonalcoholic and alcoholic categories.
Marketing, breadth of product offering, new product and package innovations, and pricing are signifi cant factors affect-ing our competitive position, but the consumer and customer goodwill associated with our products’ trademarks is our most favorable factor. Other competitive factors include distribution and sales methods, merchandising productivity, customer service, trade and community relationships, the management of sales and promotional activities, and access to manufac-turing and distribution. Management of cold drink equipment, including vending and cooler merchandising equipment, is also a competitive factor. We face strong competition by companies that produce and sell competing products to a consolidating retail sector where buyers are able to choose freely between our products and those of our competitors.
In 2006, our sales represented approximately 13% of total nonalcoholic beverage sales in our North American territories and approximately 8% of total nonalcoholic beverage sales in our European territories. Sales of our products compared to combined alcoholic and nonalcoholic beverage products in our territories would be signifi cantly less.
Our competitors include the local bottlers of competing products and manufacturers of private label products. For example, we compete with bottlers of products of PepsiCo, Inc., Cadbury Schweppes plc, Nestle S.A., Groupe Danone, Kraft Foods Inc., and private label products including those of certain of our customers. In certain of our territories, we sell products we compete against in other territories; however, in all our territories our primary business is the marketing, sale, manufacture, and distribution of products of The Coca-Cola Company. Our primary competitor in each terri-tory may vary, but within North America, our predominant competitors are The Pepsi Bottling Group, Inc. and Pepsi Americas, Inc.

Coca-Cola Enterprises Inc. – 2006 Form 10-K 11
EmployeesAt December 31, 2006, we employed approximately 74,000 people – about 10,200 of whom worked in our European territories.
Approximately 18,800 of our employees in North America in 164 different employee units are covered by collective bargaining agreements, and essentially all of our employees in Europe are covered by local labor agreements. These bar-gaining agreements expire at various dates over the next seven years – including 33 agreements in North America expiring in 2007 – but we believe that we will be able to renegotiate subsequent agreements upon satisfactory terms.
Governmental Regulation PACKAGING
Anti-litter measures have been enacted in the United States in California, Connecticut, Delaware, Hawaii, Iowa, Maine, Massachusetts, Michigan, New York, Oregon, and Vermont. Some of these measures prohibit the sale of certain beverages, whether in refi llable or nonrefi llable containers, unless a deposit is charged by the retailer for the container. The retailer or redemption center refunds all or some of the deposit to the customer upon the return of the container. The containers are then returned to the bottler, which, in most jurisdictions, must pay the refund and, in certain others, must also pay a handling fee. In California, a levy is imposed on beverage containers to fund a waste recovery system. In the past, similar legislation has been proposed but not adopted elsewhere, although we anticipate that additional jurisdictions may enact such laws. Massachusetts requires the creation of a deposit transaction fund by bottlers and the payment to the state of balances in that fund that exceed three months of deposits received, net of deposits repaid to customers and interest earned. Michigan also has a statute requiring bottlers to pay to the state unclaimed container deposits.
In Canada, soft drink containers are subject to waste management measures in each of the ten provinces. Seven provinces have forced deposit schemes, of which three have half-back deposit systems whereby a deposit is collected from the consumer and one-half of the deposit amount is returned upon redemption. In Manitoba, a levy is imposed only on bev-erage containers to fund a multi-material (Blue Box) recovery system. Prince Edward Island requires all soft drink beverages to be sold in refi llable containers. In Ontario, a new funding formula has been approved by the provincial government under the Waste Diversion Act in which industries will be responsi-ble for 50% of the costs of the waste managed in the curbside recycling system (Blue Box), and municipalities will account for the remaining 50% of the costs. Other regulations in Ontario, which are currently not being enforced by the government, require that sales by a bottler of soft drink beverages in refi ll-able containers must meet a minimum percentage of total sales of soft drink beverages by such bottler in refi llable and nonrefi llable containers within that bottler’s sales areas. It is acknowledged that there is widespread industry noncompli-ance with such regulations.
The European Commission has issued a packaging and packing waste directive which has been incorporated into the national legislation of the European Union member states. At least 50% of our packages, by weight, distributed in the EU must be recovered and at least 15% must be recycled. The legislation sets targets for the recovery and recycling of household, commercial, and industrial packaging waste and
imposes substantial responsibilities upon bottlers and retailers for implementation.
We have taken actions to mitigate the adverse effects resulting from legislation concerning deposits, restrictive packaging, and escheat of unclaimed deposits which impose additional costs on us. We are unable to quantify the impact on current and future operations which may result from such legislation if enacted or enforced in the future, but the impact of any such legislation might be signifi cant if widely enacted and enforced.
BEVERAGES IN SCHOOLS
We have witnessed increased public policy challenges regarding the sale of our beverages in schools, particularly elementary, middle, and high schools. The issue of soft drinks in schools in the United States fi rst achieved visibility in 1999 when a California state legislator proposed a restriction on the sale of soft drinks in local school districts. In 2004, Texas passed state-wide restrictions on the sale of soft drinks and other foods in schools; in 2005, California, Kentucky, and New Jersey passed additional statewide restrictions. Similar regulations have been enacted in a small number of local communities. At December 31, 2006, a total of 29 states had regulations restricting the sale of soft drinks and other foods in schools. Many of these restrictions have existed for many years in connection with subsidized meal programs in schools. The focus has more recently turned to the growing health, nutri-tion, and obesity concerns of today’s youth. The impact of restrictive legislation, if widely enacted, could have a negative effect on our brands, image, and reputation. In 2005, we adopted the Beverage Industry School Vending Policy recom-mended by the American Beverage Association (“ABA”). In 2006, we worked with the ABA to develop new U.S. school beverage guidelines through a partnership with the Alliance for a Healthier Generation, which is a joint initiative of the William J. Clinton Foundation and the American Heart Association. The Alliance was established to limit portion sizes and reduce the number of calories for food and beverage offerings during the school day. These new guidelines strengthen the current ABA school vending policy, and we are implementing them with new and existing contracts with schools. This policy responds to issues regarding the sale of certain of our beverages in schools, and provides for recommended beverage availability in elementary, middle, and high schools. In 2006, our sales to schools covered by the ABA policy represented approximately 1.5% of our total sales volume in the United States.
In 2006, in Canada, we worked with Refreshments Canada, the Canadian beverage industry association, and established similar guidelines for schools as in the United States. In 2006, sales in elementary, middle, and high schools represented approximately 1.3% of our total sales volume in Canada.
On certain college campuses, our sales of bottled and canned Coca-Cola products have been boycotted or discontinued because of a controversy alleging crimes against union leaders and workers at a Coca-Cola bottler in Colombia. The Coca-Cola Company has denied any involvement in the claimed incidents, but the allegations have been taken up by outside groups who have called for the boycott or removal of Coca-Cola products sold on college campuses. This has occurred at several large campuses within our territories in the United States and Canada. We have no responsibility for the Colombian bottling operations, which have never been part of our territories. If the Colombian allegations remain unresolved, the boycott or removal of our products from other college campuses could occur.

12 Coca-Cola Enterprises Inc. – 2006 Form 10-K
Effective September 1, 2005, vending machines for food and beverages were banned from all public and private schools in France. There is increasing pressure in the other European countries, notably Belgium and Great Britain, to restrict the availability of carbonated soft drink products, especially in secondary schools, through regulatory intervention.
EXCISE AND VALUE ADDED TAXES
Excise taxes on sales of soft drinks have been in place in various states in the United States for several years. The jurisdictions in which we operate that currently impose such taxes are Arkansas, the city of Chicago, Tennessee, Virginia, Washington, and West Virginia. To our knowledge, no similar legislation has been enacted in any other markets served by us. Proposals have been introduced in certain states and locali-ties that would impose a special tax on beverages sold in nonrefi llable containers as a means of encouraging the use of refi llable containers. However, we are unable to predict whether such additional legislation will be adopted.
Value added tax on soft drinks ranges from 3% to 17.5% within our bottling territories in Canada and the EU. In addition, excise taxes on sales of soft drinks are in place in Belgium, France, and the Netherlands. The existence and level of this indirect taxation on the sale of soft drinks is now a matter of legal and public debate given the need for further tax harmo-nization within the European Union.
INCOME TAXES
Our tax fi lings for various periods are subjected to audit by tax authorities in most jurisdictions where we conduct business. These audits may result in assessments of additional taxes that are subsequently resolved with the authorities or through the courts. Currently, there are assessments involving certain of our subsidiaries, including one of our Canadian subsidiaries, that may not be resolved for many years. We believe we have substantial defenses to questions being raised and would pursue all legal remedies before an unfavorable outcome would result. We believe we have adequately provided for any ultimate amounts that would result from these proceedings where it is probable we will pay some amounts and the amounts can be estimated; however, it is too early to predict a fi nal out-come in some of these matters.
CALIFORNIA LEGISLATION
A California law requires that any person who exposes another to a carcinogen or a reproductive toxicant must provide a warn-ing to that effect. Because the law does not defi ne quantitative thresholds below which a warning is not required, virtually all manufacturers of food products are confronted with the pos-sibility of having to provide warnings due to the presence of trace amounts of defi ned substances. Regulations implementing the law exempt manufacturers from providing the required warning if it can be demonstrated that the defi ned substances occur naturally in the product or are present in municipal water used to manufacture the product. We have assessed the impact of the law and its implementing regulations on our beverage products and have concluded that none of our products currently require a warning under the law.
ENVIRONMENTAL REGULATIONS
Substantially all of our facilities are subject to laws and regulations dealing with above-ground and underground fuel storage tanks and the discharge of materials into the environ-ment. Compliance with these provisions has not had, and we
do not expect such compliance to have, any material effect upon our capital expenditures, net income, fi nancial condition, or competitive position. Our beverage manufacturing opera-tions do not use or generate a signifi cant amount of toxic or hazardous substances. We believe that our current practices and procedures for the control and disposition of such wastes comply with applicable law. In the United States, we have been named as a potentially responsible party in connection with certain landfi ll sites where we may have been a de mini-mis contributor. Under current law, our potential liability for cleanup costs may be joint and several with other users of such sites, regardless of the extent of our use in relation to other users. However, in our opinion, our potential liability is not signifi cant and will not have a materially adverse effect on our Consolidated Financial Statements.
We have adopted a plan for the testing, repair, and removal, if necessary, of underground fuel storage tanks at our bottlers in North America; this plan includes any necessary remediation of tank sites and the abatement of any pollutants discharged. Our plan extends to the upgrade of wastewater handling facili-ties, and any necessary remediation of asbestos-containing materials found in our facilities. We had capital expenditures of approximately $2.9 million in 2006 pursuant to this plan, and we estimate that our capital expenditures will be approx-imately $2.8 million in 2007 and $2.7 million in 2008 pursuant to this plan. In our opinion, any liabilities associated with the items covered by such plan will not have a materially adverse effect on our Consolidated Financial Statements.
TRADE REGULATION
Our business, as the exclusive manufacturer and distributor of bottled and canned beverage products of The Coca-Cola Company and other manufacturers within specifi ed geographic territories, is subject to antitrust laws of general applicability. Under the Soft Drink Interbrand Competition Act, applicable to the United States, the exercise and enforcement of an exclu-sive contractual right to manufacture, distribute, and sell a soft drink product in a geographic territory is presumptively lawful if the soft drink product is in substantial and effective interbrand competition with other products of the same class in the market. We believe that such substantial and effective competition exists in each of the exclusive geographic terri-tories in the United States in which we operate.
The treaty establishing the EU precludes restrictions of the free movement of goods among the member states. As a result, unlike our Domestic Cola and Allied Beverage Agreements, the European Beverage Agreements grant us exclusive bottling territories subject to the exception that other EU and/or European Economic Area bottlers of Coca-Cola Trademark Beverages and Allied Beverages can, in response to unsolicited orders, sell such products in our EU territories. See “European Beverage Agreements.”
MISCELLANEOUS REGULATIONS
The production, distribution, and sale of many of our products are subject to the United States Federal Food, Drug, and Cosmetic Act; the Occupational Safety and Health Act; the Lanham Act; various federal, state, provincial and local envi-ronmental statutes and regulations; and various other federal, state, provincial and local statutes in the United States, Canada and Europe that regulate the production, packaging, sale, safety, advertising, labeling, and ingredients of such products, and our operations in many other respects.

Coca-Cola Enterprises Inc. – 2006 Form 10-K 13
Financial Information on Industry Segments and Geographic Areas For fi nancial information on industry segments and operations in geographic areas, see Note 15 of the Notes to our Consolidated Financial Statements.
For More Information About Us FILINGS WITH THE SEC As a public company, we regularly fi le reports and proxy statements with the Securities and Exchange Commission. These reports are required by the Securities Exchange Act of 1934 and include:
• annual reports on Form 10-K (such as this report); • quarterly reports on Form 10-Q; • current reports on Form 8-K; and • proxy statements on Schedule 14A.
Anyone may read and copy any of the materials we fi le with the SEC at the SEC’s Public Reference Room at 100 F Street, NE, Washington DC, 20549; information on the operation of the Public Reference Room may be obtained by calling the SEC at 1-800-SEC-0330. The SEC maintains an internet site that con-tains our reports, proxy and information statements, and our other SEC fi lings; the address of that site is http://www.sec.gov.
We make our SEC fi lings (including any amendments) available on our own internet site as soon as reasonably practicable after we have fi led with or furnished to the SEC. Our internet address is http://www.cokecce.com. All of these fi lings are available on our website free of charge.
The information on our website is not incorporated by reference into this annual report on Form 10-K.
CORPORATE GOVERNANCE
We have a Code of Business Conduct for our employees, our offi cers, and members of our board of directors. This group includes, without limitation, our chief executive offi cer, our chief fi nancial offi cer, and our chief accounting offi cer, and is, therefore, the “code of ethics” applicable to each such offi cer, as required in the SEC’s Regulation S-K, Item 406. A copy of the code is posted on our website, http://www.cokecce.com. If we amend or grant any waivers of the code that are applicable to our directors or our execu-tive offi cers – which we do not anticipate doing – we have committed that we will post these amendments or waivers on our website under “Corporate Governance.”
Our website also contains additional information about our corporate governance policies, such as:
• Board of Directors Guidelines on Signifi cant Corporate Governance Issues
• Board committee charters • Certifi cate of incorporation • Bylaws
Any of these items are available in print to any shareowner who requests them. Requests should be sent to the corporate secretary at Coca-Cola Enterprises Inc., Post Offi ce Box 723040, Atlanta, Georgia 31139-0040.
EXECUTIVE OFFICERS OF THE REGISTRANTSet forth below is information as of February 9, 2007 regarding our executive offi cers:
Name Age Principal Occupation During the Past Five YearsJohn F. Brock 58 President and Chief Executive Offi cer of Coca-Cola Enterprises Inc. since April 2006. From February 2003 until December 2005, he
was Chief Executive Offi cer of InBev, S.A., a global brewer; and from March 1999 until December 2002, he was Chief Operating Offi cer of Cadbury Schweppes plc, an international beverage and confectionery company.
John J. Culhane 61 Executive Vice President and General Counsel of Coca-Cola Enterprises since December 2004. He had been Senior Vice President and General Counsel since February 2004. Before that he served as Special Counsel to Coca-Cola Enterprises from October 2001 until his appointment as interim General Counsel in January 2004. From 1998 until October 2001, he was General Counsel and Corporate Secretary of Coca-Cola Hellenic Bottling Company S.A., one of the world’s largest bottlers, having territories in Greece, Ireland, Nigeria, and Eastern Europe. Prior to that he was General Counsel of the Coca-Cola North America division of The Coca-Cola Company.
William W. Douglas III 46 Senior Vice President and Chief Financial Offi cer since June 2005. He was Vice President, Controller, and Principal Accounting Offi cer from July 2004 to June 2005. Before that, since February 2000, he had been Chief Financial Offi cer of Coca-Cola Hellenic Bottling Company S.A.
Shaun B. Higgins 57 Executive Vice President and President, European Group since June 2005, before that Executive Vice President and Chief Financial Offi cer from August 2004 until June 2005; Senior Vice President and Chief Strategy and Planning Offi cer from February 2004 to August 2004 and prior to that he had been Senior Vice President, Chief Planning Offi cer from February 2003 until February 2004.He was Vice President and President of our European Group from October 1999 to February 2003.
Charles D. Lischer 38 Vice President, Controller and Chief Accounting Offi cer since June 2005. Prior to that, he had been with the accounting fi rm of Deloitte & Touche in various capacities since July 1999, becoming a partner in August 2004.
Terrance M. Marks 46 Executive Vice President and President, North American Business Unit since February 2006. Prior to that, since January 2005, he had been Senior Vice President and President, North American Business Unit. He was Vice President and Chief Revenue Offi cer for North America from October 2003 until January 2005, and Vice President and Chief Financial Offi cer for our Eastern North America Group from 1999 until October 2003.
Vicki R. Palmer 53 Executive Vice President, Financial Services and Administration since January 2004. She had been Senior Vice President, Treasurer and Special Assistant to the Chief Executive Offi cer from December 1999 until January 2004.
Our offi cers are elected annually by the board of directors for terms of one year or until their successors are elected and qualifi ed, subject to removal by the board at any time.

14 Coca-Cola Enterprises Inc. – 2006 Form 10-K
ITEM 1A. RISK FACTORS
Set forth below are some of the risks and uncertainties that, if they were to occur, could materially and adversely affect our busi-ness, or that could cause our actual results to differ materially from the results contemplated by the forward-looking statements contained in this report and the other public statements we make.
Forward-looking statements include, but are not limited to: • Projections of revenues, income, earnings per share,
capital expenditures, dividends, capital structure, or other fi nancial measures;
• Descriptions of anticipated plans or objectives of our management for operations, products, or services;
• Forecasts of performance; and • Assumptions regarding any of the foregoing.
Forward-looking statements involve matters which are not historical facts. Because these statements involve anticipated events or conditions, forward-looking statements often include words such as “anticipate,” “believe,” “estimate,” “expect,” “intend,” “plan,” “project,” “target,” “can,” “could,” “may,” “should,” “will,” “would” or similar expressions. Do not unduly rely on forward-looking statements. They represent our expec-tations about the future and are not guarantees. Forward-looking statements are only as of the date they are made and they might not be updated to refl ect changes as they occur after the forward-looking statements are made.
For example, forward-looking statements include our expectations regarding:
• earnings per diluted common share; • operating income growth;• volume growth; • net price per case growth; • cost of goods per case growth; • concentrate cost increases from The Coca-Cola Company; • capital expenditures; and • developments in accounting standards.
Risks and UncertaintiesWE MAY NOT BE ABLE TO SUCCESSFULLY
RESPOND TO CHANGES IN THE MARKETPLACE.We operate in the highly competitive beverage industry and face strong competition from other general and specialty beverage companies. Our response to continued and increased customer and competitor consolidations and marketplace competition may result in lower than expected net pricing of our products. Our ability to gain or maintain share of sales or gross margins may be limited by the actions of our competitors, who may have advantages in setting their prices because of lower cost of raw materials. Competitive pressures in the markets in which we operate may cause channel and product mix to shift away from more profi table channels and packages. If we are unable to maintain or increase our volume in higher-margin products and in packages sold through higher-margin channels (e.g. immediate consumption), our pricing and gross margins could be adversely affected. Our efforts to improve pricing may result in lower than expected volume.
CONCERNS ABOUT HEALTH AND WELLNESS COULD
REDUCE THE DEMAND FOR SOME OF OUR PRODUCTS.Health and wellness trends throughout the marketplace have resulted in a decreased demand for regular soft drinks and an increased desire for more diet and low-calorie products, water, isotonics, energy drinks, coffee-fl avored beverages, and
teas. Our failure to offset the decline in sales of our regular soft drinks and to provide the types of products that some of our customers may prefer could adversely affect our busi-ness and fi nancial results.
OUR BUSINESS SUCCESS MAY BE DEPENDENT UPON
OUR RELATIONSHIP WITH THE COCA-COLA COMPANY.Under the express terms of our license agreements with The Coca-Cola Company:
• There are no limits on the prices The Coca-Cola Company may charge us for concentrate.
• Much of the marketing and promotional support is at the discretion of The Coca-Cola Company. Programs currently in effect or under discussion contain requirements, or are subject to conditions, established by The Coca-Cola Company that we may be unable to achieve or satisfy, as the case may be. The terms of the product licenses from The Coca-Cola Company contain no express obligation on its part to participate in future programs or continue past levels of payments into the future.
• Apart from our perpetual rights in the United States to brands carrying the trademarks “Coke” or “Coca-Cola,” our other license agreements state that they are for fi xed terms, and most of them are renewable only at the dis-cretion of The Coca-Cola Company at the conclusion of their current terms.
• We must obtain approval from The Coca-Cola Company to acquire any independent bottler of Coca-Cola or to dispose of one of our Coca-Cola bottling territories.
We have infrastructure programs in place with The Coca-Cola Company. Should we not be able to satisfy the requirements of those programs, and we are unable to agree on an alterna-tive solution, The Coca-Cola Company may be able to seek a partial refund of amounts previously paid.
Disagreements with The Coca-Cola Company concerning other business issues may lead The Coca-Cola Company to act adversely to our interests with respect to the relationships described above.
OUR BUSINESS IN EUROPE IS VULNERABLE TO PRODUCT
BEING IMPORTED FROM OUTSIDE OUR TERRITORIES,WHICH ADVERSELY AFFECTS OUR SALES.The rules of the European Economic Area allow bottlers from other member states to fi ll unsolicited orders within any other member state. As a result, our bottlers in higher-cost countries, particularly Great Britain, lose sales within their territories to other bottlers of Coca-Cola located within another member state.
INCREASES IN COSTS OR LIMITATION OF SUPPLIES OF
RAW MATERIALS COULD HURT OUR FINANCIAL RESULTS.If there are increases in the costs of raw materials, ingredients, or packaging materials, such as fuel, aluminum, high fructose corn syrup, and PET (plastic) or other cost items and we are unable to pass the increased costs on to our customers in the form of higher prices, our fi nancial results could be adversely affected. We primarily use supplier pricing agreements and derivative fi nancial instruments to manage the volatility and mar-ket risk with respect to certain commodities. Generally, these hedging instruments establish the purchase price for these commodities in advance of the time of delivery. As such, it is possible that these hedging instruments may lock us into prices that are ultimately higher than the actual market price at the time of delivery.

Coca-Cola Enterprises Inc. – 2006 Form 10-K 15
In North America, we had a supplier pricing agreement for a majority of our aluminum purchases that capped the price we paid for aluminum at 85 cents per pound. This pricing agree-ment and related price cap expired on December 31, 2006. We have implemented certain hedging strategies, including enter-ing into fi xed pricing agreements, in order to mitigate some of our exposure to price fl uctuations in 2007. The agreements entered into to date, though, are at rates higher than our expired price cap. In Europe, we did not have fi xed pricing agreements with respect to our aluminum purchases during 2006 and, there-fore, our aluminum purchases were at market prices. In addition, some of our cans in Europe are made from steel, rather than aluminum. Considering that our 2006 aluminum purchases in Europe were at market prices, and the available alternative to aluminum cans, and based upon the current price of aluminum, we do not foresee a signifi cant increase in our cost of sales in Europe during 2007 as a result of the cost of aluminum.
If suppliers of raw materials, ingredients, packaging materials, or other cost items, such as fuel, are affected by strikes, weather conditions, governmental controls, national emergen-cies, natural disasters, or other events, and we are unable to obtain the materials from an alternate source, our cost of sales, revenues, and ability to manufacture and distribute product could be adversely affected.
MISCALCULATION OF OUR NEED FOR INFRASTRUCTURE
INVESTMENT COULD IMPACT OUR FINANCIAL RESULTS.Projected requirements of our infrastructure investments may differ from actual levels if our volume growth is not as we anticipate. Our infrastructure investments are generally long-term in nature and, therefore, it is possible that investments made today may not generate our expected return due to future changes in the marketplace. Signifi cant changes from our expected returns on cold drink equipment, fl eet, tech-nology, and supply chain infrastructure investments could adversely affect our fi nancial results.
UNEXPECTED CHANGES IN INTEREST OR CURRENCY EXCHANGE RATES,OR OUR DEBT RATING COULD HARM OUR FINANCIAL POSITION.Changes from our expectations for interest and currency exchange rates can have a material impact on our fi nancial results. We may not be able to completely mitigate the effect of signifi cant interest rate or currency exchange rate changes. Changes in our debt rating could have a material adverse effect on our interest costs and fi nancing sources. Our debt rating can be materially infl uenced by capital management activities of The Coca-Cola Company and/or changes in the debt rating of The Coca-Cola Company.
UNEXPECTED RESOLUTIONS OF LEGAL CONTINGENCIES
COULD IMPACT OUR FINANCIAL RESULTS.Changes from expectations for the resolution of outstanding legal claims and assessments could have a material impact on our fi nancial results. Our failure to abide by laws, orders, or other legal commitments could subject us to fi nes, penal-ties, or other damages.
LEGISLATIVE CHANGES THAT AFFECT OUR DISTRIBUTION AND PACKAGING
COULD REDUCE DEMAND FOR OUR PRODUCTS OR INCREASE OUR COSTS.Our business model is dependent on the availability of our various products and packages in multiple channels and locations to better satisfy the needs of our customers. Laws that restrict our ability to distribute products in schools and other venues, as well as laws that require deposit liabilities
for certain types of packages or those that limit our ability to design new packages, could negatively impact fi nancial results.
ADDITIONAL TAXES COULD HARM OUR FINANCIAL RESULTS.Our tax fi lings are subjected to audit by tax authorities in most jurisdictions where we conduct business. These audits may result in assessments of additional taxes that are subsequently resolved with the authorities or through the courts. Currently, there are assessments involving certain of our subsidiaries, including one of our Canadian subsidiaries, which may not be resolved for many years. An assessment of additional taxes resulting from these audits could have a material impact on our fi nancial results.
ADVERSE WEATHER CONDITIONS COULD
LIMIT THE DEMAND FOR OUR PRODUCTS.Our sales are infl uenced to some extent by weather conditions in the markets in which we operate. In particular, cold weather in Europe during the summer months may have a temporary negative impact on the demand for our products and contrib-ute to lower sales, which could have an adverse effect on our fi nancial results.
GLOBAL OR REGIONAL CATASTROPHIC EVENTS COULD
IMPACT OUR BUSINESS AND FINANCIAL RESULTS.Our business can be affected by large-scale terrorist acts, especially those directed against the United States or other major industrialized countries; the outbreak or escalation of armed hostilities; major natural disasters; or widespread out-breaks of infectious disease such as avian infl uenza. Such events in the geographic regions in which we do business could have a material impact on our sales volume, cost of raw materials, earnings, and fi nancial condition.
DISAGREEMENTS AMONG BOTTLERS COULD PREVENT US FROM
ACHIEVING OUR BUSINESS GOALS.Disagreements among members of the Coca-Cola system could complicate negotiations and planning with customers and other business partners and adversely affect our ability to fully implement our business plans and achieve expected levels of revenue from the execution of those plans.
IF WE ARE UNABLE TO RENEW COLLECTIVE BARGAINING AGREEMENTS ON
SATISFACTORY TERMS OR WE EXPERIENCE STRIKES OR WORK STOPPAGES,OUR BUSINESS AND FINANCIAL RESULTS COULD BE NEGATIVELY IMPACTED.Approximately 39 percent of our employees are covered by collective bargaining agreements or local agreements. These bargaining agreements expire at various dates over the next seven years, including 33 agreements in North America in 2007. The inability to renegotiate subsequent agreements on satis-factory terms could result in work interruptions or stoppages, which could adversely affect our fi nancial results. The terms and conditions of existing or renegotiated agreements could also increase the cost to us, or otherwise affect our ability, to fully implement operational changes to enhance our effi ciency.
INACCURATE ESTIMATES OR ASSUMPTIONS USED TO PREPARE
OUR CONSOLIDATED FINANCIAL STATEMENTS COULD LEAD TO
UNEXPECTED FINANCIAL RESULTS.Our Consolidated Financial Statements and accompanying Notes include estimates and assumptions made by manage-ment that affect reported amounts. Actual results could differ materially from those estimates.
16 Coca-Cola Enterprises Inc. – 2006 Form 10-K
During 2006, we recorded a $2.9 billion non-cash impairment charge to reduce the carrying amount of our North American franchise license intangible assets to their estimated fair value based upon the results of our annual impairment test of these assets. The fair values calculated in our annual impairment tests were determined using discounted cash fl ow models involving several assumptions. These assumptions include, but are not limited to, anticipated growth rates by geographic region, our long-term anticipated growth rate, the discount rate, and estimates of capital charges. If, in the future, the estimated fair value of our North American franchise rights were to decline further due to changes in our assumptions or a decline in our operating results, it would be necessary to record an additional non-cash impairment charge. Furthermore, future structural changes or divestitures could result in an additional non-cash impairment charge. For additional infor-mation about our franchise license intangible assets and the related non-cash impairment charge, refer to Note 1 of the Notes to Consolidated Financial Statements.
PRODUCT LIABILITY CLAIMS BROUGHT AGAINST US OR
PRODUCT RECALLS COULD NEGATIVELY AFFECT OUR
BUSINESS, FINANCIAL RESULTS, AND BRAND IMAGE.We may be liable if the consumption of our products causes injury or illness. We may also be required to recall products if they become contaminated or are damaged or mislabeled. A signifi cant product liability or other product-related legal judgment against us or a widespread recall of our products could negatively impact our business, fi nancial results, and brand image.
TECHNOLOGY FAILURES COULD DISRUPT OUR
OPERATIONS AND NEGATIVELY IMPACT OUR BUSINESS.We increasingly rely on information technology systems to process, transmit, and store electronic information. For example, our production and distribution facilities, inventory management, and driver handheld devices all utilize information technology to maximize effi ciencies and minimize costs. Furthermore, a signifi cant portion of the communications between our per-sonnel, customers, and suppliers depends on information technology. Like all companies, our information technology systems may be vulnerable to a variety of interruptions due to events beyond our control, including, but not limited to, natural disasters, terrorist attacks, telecommunications fail-ures, computer viruses, hackers, and other security issues. We have technology security initiatives and disaster recovery plans in place to mitigate our risk to these vulnerabilities, but these measures may not be adequate or implemented prop-erly to ensure that our operations are not disrupted.
WE MAY NOT FULLY REALIZE THE EXPECTED COST
SAVINGS AND/OR OPERATING EFFICIENCIES FROM
OUR RESTRUCTURING AND TRANSITION PROGRAMS.We have implemented, and plan to continue to implement, restructuring and transition programs to support the implemen-tation of key strategic initiatives designed to achieve long-term sustainable growth. These programs are intended to maximize our operating effectiveness and effi ciency and to reduce our cost. We cannot be assured that we will achieve the targeted benefi ts under these programs or that the benefi ts, even if achieved, will be adequate to achieve long-term sustainable growth. In addition, the implementation of key elements of these programs, such as employee job reductions, may have an adverse impact on our business, particularly in the near-term.
ITEM 1B. UNRESOLVED STAFF COMMENTS Not applicable.
ITEM 2. PROPERTIES Our principal properties include our corporate offi ces, North American and European business unit headquarters offi ces, our production facilities, and our sales and distribution centers.
At December 31, 2006, we occupied:• 79 beverage production facilities (76 owned, the others
leased) 21 of which were solely production facilities; and 58 of which were combination production/distribution
• 365 principal distribution facilities (269 owned, the others leased)
One of our facilities is subject to a lien to secure indebted-ness, with an aggregate principal balance of approximately $3.6 million at December 31, 2006.
Three of our leased facilities are under industrial revenue bonds issued by local development authorities, having an approximate principal balance of $24 million at December 31, 2006. Under these leases, the property is deeded to us at the end of the term for a nominal amount.
Our principal properties cover approximately 44.9 million square feet in the aggregate. We believe that our facilities are generally suffi cient to meet our present operating needs.
At December 31, 2006, we operated approximately 55,000 vehicles of all types. Of this number, approximately 9,500 vehicles were leased; the rest were owned. We owned approximately 2.4 million coolers, beverage dispensers, and vending machines at the end of 2006.
During 2006, our capital expenditures were approximately $882 million.
ITEM 3. LEGAL PROCEEDINGS We have been named as a “potentially responsible party” (“PRP”) at several federal and state “Superfund” sites.
• In 1994, we were named a PRP at the Waste Disposal Engineering site in Andover, Minnesota, a former landfi ll. The claim against us is approximately $110,000; however, if this site is a “qualifi ed landfi ll” under Minnesota law, the entire cost of remediation may be paid by the state without any contribution from any PRP.
• In 1999, we acquired all of the stock of CSL of Texas, Inc. (“CSL”), which owns an 18.4 acre tract on Holleman Drive, College Station, Texas that was contaminated by prior industrial users of the property. Cleanup is to be performed under the Texas Voluntary Cleanup Program overseen by the Texas Commission on Environmental Quality and is estimated to cost $2 to $4 million. We believe we are entitled to reimbursement for our costs from CSL’s former shareholders.
• In 2001, we were named as one of several thousand PRPs at the Beede Waste Oil Superfund site in Plaistow, New Hampshire, which had operated from the 1920s until 1994 in the business of waste oil reprocessing and related activities. In 1990, our facility in Waltham, Massachusetts sent waste oil and contaminated soil to the site in the course of removing an underground storage tank and remediating the surrounding property. The EPA and the state of New Hampshire have spent almost $26 million on the investigation and initial cleanup of the site, and the remaining cost to complete the cleanup has been estimated to be approximately $60 million. Settling small volume PRPs have contributed over $30 million towards

Coca-Cola Enterprises Inc. – 2006 Form 10-K 17
the site costs. In December 2006, the remaining PRPs, including us, entered into a consent decree with the EPA to take over the cleanup. Our share of the cleanup costs is estimated at $400,000 to $700,000.
• In October 2002, the City of Los Angeles fi led a complaint against eight named and ten unnamed defendants seek-ing cost recovery, contribution, and declaratory relief for alleged contamination that occurred over a period of decades at various boat yards in the Port of Los Angeles. The cleanup cost at the Port may run into the millions of dollars. Our subsidiary, BCI Coca-Cola Bottling Company of Los Angeles, was named as a defendant as the alleged successor to the liabilities of a company called Pacifi c American Industries, Inc., which was the parent of a com-pany called San Pedro Boat Works that operated a boat works business at the port from 1969 until 1974. We fi led an answer to the complaint in March 2003 denying liability. The facts are still being investigated, but discovery has been delayed because of the criminal indictment of one of the other defendants, and because of court-ordered mediation.
• We have been named at another 38 federal, and another ten state, “Superfund” sites. However, with respect to those sites, we have concluded, based upon our investigations, either (i) that we were not responsible for depositing haz-ardous waste and therefore will have no further liability; (ii) that payments to date would be suffi cient to satisfy our liability; or (iii) that our ultimate liability, if any, for such site would be less than $100,000.
In 2000, in a case styled Harmar Bottling Company, et al. vs. The Coca-Cola Company, et al., we and The Coca-Cola Company were found by a Texas jury to be jointly liable in a combined amount of $15.2 million to fi ve plaintiffs, each a distributor of competing beverage products. These distributors sued alleging that we and The Coca-Cola Company engaged in anticompeti-tive marketing practices. The trial court’s verdict was upheld by the Texas Court of Appeals in July 2003, but in October 2006, the Texas Supreme Court reversed the court of appeals and either dismissed or rendered judgment in our favor on the claims that were the subject of the appeal. The plaintiffs have fi led a motion for rehearing, but the Texas Supreme Court has not ruled on their motion. The claims of the three remaining plaintiffs in this case remain to be tried. We intend to vigor-ously defend against an unfavorable outcome in these claims and have not recorded any additional amounts for potential awards related to these additional claims.
We and our California subsidiary have been sued by several current and former employees over alleged violations of state wage and hour rules. In a matter combined in a consolidated class action proceeding styled In re BCI Overtime Cases pend-ing in San Bernardino Superior Court (the fi rst consolidated suit was fi led July 18, 2001), plaintiffs allege that certain hourly employees were required to work off the clock. The parties have agreed to settle this matter, as well as a smaller accom-panying suit, for a total of $14 million, inclusive of claims, attorneys’ fees and costs of administration. The settlement has been preliminarily approved by the court. Other similar suits have been resolved and have been, or soon will be, dismissed. In the remaining California class action, Costanza, et al. vs. BCI Coca-Cola Bottling Company of Los Angeles, et al., in the Superior Court of the State of California for the County of Los Angeles — Civil Central West, Case No. BC 351382, plaintiffs sued on behalf of a putative class of certain exempt super-visory employees who claim to have been misclassifi ed as
exempt employees and thus seek overtime pay and other related damages, including but not limited to penalties, interest, and attorneys’ fees. Our subsidiary is vigorously defending the suit, and at present it is not possible to predict the outcome.
On February 7, 2007, the United States District Court for the Northern District of Georgia, Atlanta Division, dismissed the purported class action lawsuit styled In re Coca-Cola Enterprises Inc. Securities Litigation, Civil Action File No. 1:06-CV-0275-TWT (fi led originally as Argento Trading Company, et al, vs. Coca-Cola Enterprises Inc. et al. on February 7, 2006). The lawsuit had alleged that we engaged in “channel stuffi ng” with customers and raised certain insider trading claims. The order of dismissal gives the plaintiffs 30 days to fi le an amended complaint.
International Brotherhood of Teamsters vs. The Coca-Cola Company et al. Case No. CA1927-N, was fi led February 7, 2006 in the Delaware Court of Chancery. That case, and other “copycat” lawsuits, raised allegations virtually identical to the ones in the original Argento case, some raising derivative claims under Delaware state law and others bringing claims under the Employees’ Retirement Income Security Act. The Delaware cases have been consolidated as In re Coca-Cola Enterprises Inc. Shareholders Litigation, Consolidated C.A. No. 127-N in the Court of Chancery of the State of Delaware in and for New Castle County, the Georgia derivative suits have been consolidated as In Re: Coca-Cola Enterprises Inc. Derivative Litigation, in the United States District Court for the Northern District of Georgia, Master Docket No. 1:06-CV-0467-TWT, and the ERISA cases have been consolidated as In re Coca-Cola Enterprises Inc. ERISA Litigation, Master File No. 1:06-CV-0953-TWT, in the United States District Court for the Northern District of Georgia, Atlanta Division. We have asked each court to dismiss these lawsuits.
On February 8, 2007, some of the parties reached a conditional settlement in both Ozarks Coca-Cola/Dr. Pepper Bottling Company, et al. vs. The Coca-Cola Company and Coca-Cola Enterprises, in the United States District Court for the Northern District of Georgia, Atlanta Division, Civil Action File No. 1:06-cv-0853 and Coca-Cola Bottling Company United, Inc. et al vs. The Coca-Cola Company and Coca-Cola Enterprises,in the Circuit Court of Jefferson County, Alabama, Civil Action No. CV-2006-00916-HSL. These lawsuits were fi led in 2006, alleging breach of contract and breach of duty and other related claims arising out of our plan to offer warehouse delivery of POWERade to a specifi c customer within our territory. Under the terms of the proposed settlement, following full approval by all parties, the cases will be dismissed without prejudice to their being fi led again, and there will be a two-year test (through 2008) of (1) national warehouse delivery of brands of The Coca-Cola Company into the exclusive territory of almost every bottler of Coca-Cola in the United States, even nonpar-ties to the litigation, in exchange for compensation in most circumstances, and (2) limits on local warehouse delivery within the parties’ territories. The proposed settlement does not require any payment by the defendants to the plaintiffs.
There are various other lawsuits and claims pending against us, including claims for injury to persons or property. We believe that such claims are covered by insurance with fi nancially responsible carriers or adequate provisions for losses have been recognized by us in our Consolidated Financial Statements. In our opinion, the losses that might result from such litigation arising from these claims will not have a materially adverse effect on our Consolidated Financial Statements.
ITEM 4. SUBMISSION OF MATTERS TO A VOTE OF SECURITY HOLDERS Not applicable.

18 Coca-Cola Enterprises Inc. – 2006 Form 10-K
PART II ITEM 5. MARKET FOR REGISTRANT’S COMMON EQUITY, RELATED STOCKHOLDER MATTERS AND ISSUER PURCHASES OF EQUITY SECURITIES
Listed and Traded: New York Stock Exchange
Traded: Boston, Chicago, National, Pacifi c, and Philadelphia Exchanges
Common shareowners of record as of January 26, 2007: 15,780
Stock Prices2006 High LowFourth Quarter $ 21.33 $ 19.53Third Quarter 22.49 20.06Second Quarter 20.95 18.83First Quarter 20.93 18.94
2005 High LowFourth Quarter $ 20.53 $ 18.52Third Quarter 23.92 19.01Second Quarter 22.81 19.10First Quarter 23.36 20.22
DividendsRegular quarterly dividends were paid in the amount of $0.04 per share from July 1, 1998 until March 30, 2006, at which time they were raised to the current amount, $0.06 per share.
The information under the heading “Equity Compensation Plan Information” in our proxy statement for the annual meet-ing of our shareowners to be held April 24, 2007 (our “2007 Proxy Statement”) is incorporated into this report by reference.
Share Repurchases The following table presents information with respect to our repurchases of common stock of the Company made during the fourth quarter of 2006: Total Number of Shares Maximum Number of Shares Total Number of Average Price Purchased As Part of Publicly that May Yet Be Purchased Period Shares Purchased(A) Paid per Share Announced Plans or Programs Under the Plans or Programs
September 30, 2006 through October 27, 2006 – – None 33,283,579October 28, 2006 through November 24, 2006 – – None 33,283,579November 25, 2006 through December 31, 2006 7,673 $20.895 None 33,283,579Total 7,673 $20.895 None 33,283,579
(A) The number of shares reported as repurchased are attributable to shares surrendered to Coca-Cola Enterprises Inc. by employees in payment of tax obligations related to the vesting of restricted shares or distributions from our Stock Deferral Plan.
Share Performance Comparison of Five-Year Cumulative Total Return
Date Coca-Cola Enterprises Peer Set S&P 500 Comp-LTD
12/31/2001 100.00 100.00 100.00 12/31/2002 115.56 92.93 77.89 12/31/2003 117.32 107.06 100.23 12/31/2004 112.64 105.93 111.13 12/31/2005 104.40 112.82 114.47 12/31/2006 112.51 129.66 132.50
Coca-Cola Enterprises Peer Set S&P 500 Comp-LTD
The graph shows the cumulative total return to our shareowners beginning as of December 31, 2001 and for each year of the fi ve years ended December 31, 2006, in comparison to the cumulative returns of the S&P Composite 500 Index and to an index of peer group companies we selected. The peer group consists of The Coca-Cola Company, PepsiCo, Inc., Coca-Cola Bottling Co. Consolidated, Cadbury Beverages plc, PepsiAmericas, Inc., and The Pepsi Bottling Group, Inc. The graph assumes $100 invested on December 31, 2000 in our common stock and in each index, with the subsequent reinvestment of dividends on a quarterly basis.
$50
$75
$100
$125
$150
200620052004200320022001

Coca-Cola Enterprises Inc. – 2006 Form 10-K 19
ITEM 6. SELECTED FINANCIAL DATA
Fiscal Year (in millions, except per share data) 2006 2005 2004 2003 2002
Operations SummaryNet operating revenues(A) $ 19,804 $ 18,743 $ 18,190 $ 17,330 $ 16,058Cost of sales(A) 11,986 11,185 10,771 10,165 9,458Gross profi t 7,818 7,558 7,419 7,165 6,600Selling, delivery, and administrative expenses(A) 6,391 6,127 5,983 5,588 5,236Franchise impairment charge 2,922 – – – –Operating (loss) income (1,495) 1,431 1,436 1,577 1,364Interest expense, net 633 633 619 607 662Other nonoperating income (expense), net 10 (8) 1 2 3(Loss) income before income taxes (2,118) 790 818 972 705Income tax (benefi t) expense(B) (975) 276 222 296 211Net (loss) income (1,143) 514 596 676 494Preferred stock dividends — — — 2 3Net (loss) income applicable to common shareowners $ (1,143) $ 514 $ 596 $ 674 $ 491
Other Operating DataDepreciation and amortization $ 1,012 $ 1,044 $ 1,068 $ 1,022 $ 965Capital asset investments 882 902 949 1,099 1,029
Average Common Shares OutstandingBasic 475 471 465 454 449Diluted 475 476 473 461 458
Per Share Data Basic net (loss) income per common share $ (2.41) $ 1.09 $ 1.28 $ 1.48 $ 1.09Diluted net (loss) income per common share (2.41) 1.08 1.26 1.46 1.07Dividends declared per share 0.18 0.22 0.16 0.16 0.16Closing stock price 20.42 19.17 20.85 21.87 21.72
Year-End Financial PositionProperty, plant, and equipment, net $ 6,698 $ 6,560 $ 6,913 $ 6,794 $ 6,393Franchise license intangible assets, net 11,452 13,832 14,517 14,171 13,450Total assets 23,225 25,357 26,461 25,700 24,375Total debt 10,022 10,109 11,130 11,646 12,023Shareowners’ equity 4,526 5,643 5,378 4,365 3,347
Acquisitions were made in all years except 2005 and 2004. These acquisitions were included in our Consolidated Financial Statements from the respective acquisition date and did not signifi cantly affect our operating results in any one fi scal period.
(A) Amounts refl ect the adoption of Emerging Issues Task Force (“EITF”) No. 02-16, “Accounting by a Customer (Including a Reseller) for Cash Consideration Received from a Vendor” on January 1, 2003. Upon adoption, we reclassifi ed the following amounts in our Consolidated Statement of Operations for the year ended December 31, 2002 as reductions in cost of sales: (1) $882 million of direct marketing support from The Coca-Cola Company (“TCCC”) and other licensors previously included in net operating revenues and (2) $77 million of cold drink equipment placement funding from TCCC previously included as a reduction in selling, delivery, and administrative (“SD&A”) expenses. We also reclassifi ed to net operating revenues $51 million of net payments received from TCCC for dispensing equipment repair services. These amounts were previously included in SD&A expenses.
(B) Income tax (benefi t) expense in 2006 included a $1.1 billion income tax benefi t related to a $2.9 billion non-cash franchise impairment charge recorded in 2006. For additional information about the non-cash franchise impairment charge, refer to Note 1 of the Notes to Consolidated Financial Statements. Income tax (benefi t) expense in 2005 included a $128 million income tax provision related to the repatriation of non-U.S. earnings. Income tax (benefi t) expense also included the impact of favorable tax law changes and/or tax rate changes of $80 million in 2006, $40 million in 2005, $20 million in 2004, $16 million in 2002, and unfavorable tax rate changes of $23 million in 2003. Additionally, income tax (benefi t) expense included benefi ts related to the revaluation of various income tax obligations of approximately $15 million in 2006, $27 million in 2005, $25 million in 2003, and $4 million in 2002. Our 2003 income tax benefi t (expense) also included a $6 million benefi t related to other tax adjustments in 2003.

20 Coca-Cola Enterprises Inc. – 2006 Form 10-K
ITEM 7. MANAGEMENT’S DISCUSSION AND ANALYSIS OF FINANCIAL CONDITION AND RESULTS OF OPERATIONS
The following Management’s Discussion and Analysis of Financial Condition and Results of Operations (“MD&A”) should be read in conjunction with the Consolidated Financial Statements and accompanying Notes in this Form 10-K.
OverviewBUSINESS
We are the world’s largest marketer, producer, and distributor of bottle and can nonalcoholic beverages. We market, produce, and distribute our bottle and can products to customers and consumers through license territories in 46 states in the United States, the District of Columbia, the United States Virgin Islands, and the 10 provinces of Canada (collectively referred to as “North America”). We are also the sole licensed bottler for products of The Coca-Cola Company (“TCCC”) in Belgium, continental France, Great Britain, Luxembourg, Monaco, and the Netherlands (collectively referred to as “Europe”).
We operate in the highly competitive beverage industry and face strong competition from other general and specialty bev-erage companies. We, along with other beverage companies, are affected by a number of factors including, but not limited to, cost to manufacture and distribute products, economic conditions, consumer preferences, local and national laws and regulations, fuel prices, and weather patterns.
LICENSEE OF THE COCA-COLA COMPANY
Our fi nancial success is greatly impacted by our relationship with TCCC. Our collaborative efforts with TCCC are necessary in order to create new brands, to market our products more effectively, to fi nd ways to maximize effi ciency, and to profi t-ably grow the entire Coca-Cola system.
FINANCIAL RESULTS
During 2006, we had a net loss of $1.1 billion or $2.41 per common share, compared to net income of $514 million or $1.08 per diluted common share in 2005.
The following items of signifi cance impacted our 2006 fi nancial results:
• a $2.9 billion ($1.8 billion net of tax, or $3.80 per common share) non-cash impairment charge to reduce the carrying amount of our North American franchise license intangible assets to their estimated fair value based upon the results of our annual impairment test of these assets;
• charges totaling $66 million ($44 million net of tax, or $0.09 per common share) related to restructuring activities, primarily in Europe;
• a $35 million ($22 million net of tax, or $0.05 per common share) increase in compensation expense related to the adoption of Statement of Financial Accounting Standards (“SFAS”) No. 123R, “Share-Based Payment” (“SFAS 123R”) on January 1, 2006;
• expenses totaling $14 million related to the settlement of litigation ($8 million net of tax, or $0.02 per common share); and
• a tax benefi t totaling $95 million ($0.20 per common share) as a result of net favorable tax items, primarily for state tax law changes, Canadian federal and provincial tax rate changes, and the revaluation of various income tax obligations.
The following items of signifi cance impacted our 2005 fi nancial results:
• a $53 million ($33 million net of tax, or $0.07 per diluted common share) decrease in our cost of sales from the receipt of proceeds related to the settlement of litigation against suppliers of high fructose corn syrup (“HFCS”);
• charges totaling $80 million ($50 million net of tax, or $0.11 per diluted common share) related to restructuring activities, primarily in North America and at our corporate headquarters;
• charges totaling $28 million ($17 million net of tax, or $0.03 per diluted common share) primarily related to asset write-offs associated with damage caused by Hurricanes Katrina, Rita, and Wilma;
• an $8 million ($5 million net of tax, or $0.01 per diluted common share) net loss resulting from the early extinguish-ment of certain debt obligations in conjunction with the repatriation of non-U.S. earnings;
• a $128 million ($0.27 per diluted common share) income tax provision related to the repatriation of non-U.S. earnings; and
• a tax benefi t totaling $67 million ($0.14 per diluted common share) as a result of net favorable tax items, primarily for state tax rate changes, and the revaluation of various income tax obligations.
REVENUE AND VOLUME GROWTH
During 2006, our consolidated bottle and can net price per case grew 2.0 percent, while our volume increased 1.0 percent. In North America, we experienced moderate bottle and can net price per case improvement of 2.5 percent and limited volume growth of 0.5 percent. Our volume growth was limited due to weak carbonated soft drink (“CSD”) category trends and downward pressure attributable to higher price increases that were implemented to cover rising raw material costs. Our increased pricing was offset partially by negative mix, which resulted from competitive pricing pressures in the water category and a decline in higher-margin immediate consumption sales. Our volume results were once again impacted by a shifting consumer preference for diet and lower-calorie beverages, as evidenced by a 2.5 percent decline in our sugared CSD portfolio. We continued to benefi t from recent product innovation, which drove higher volumes in several high-growth and high-margin categories, such as isotonics and energy drinks.
In Europe, we achieved balanced volume and pricing growth, which included a 3.5 percent increase in volume and a 1.5 per-cent increase in bottle and can net price per case. These results were driven by the strong execution of a number of operating and sales initiatives, including World Cup activation and “boost zones” in France, which helped drive higher immediate con-sumption growth. In our continental European territories we experienced renewed CSD growth, which resulted in a volume increase of 6.0 percent. Our results in Great Britain, which represents nearly half of our European business, were not as strong due to continued marketplace challenges, including persistent CSD category weakness and diffi cult retail trends.

Coca-Cola Enterprises Inc. – 2006 Form 10-K 21
COST OF SALES
The cost environment across all of our territories continued to be challenging during 2006, particularly in North America, where our year-over-year bottle and can ingredient and pack-aging cost per case increased 4.0 percent. This increase was driven by higher cost associated with package mix shifts, a moderate increase in the cost of concentrate, and increased conversion costs due to higher energy prices. We also expe-rienced increases in the cost of certain materials, particularly aluminum, PET (plastic), and HFCS. During 2007, we expect our cost of sales per case to increase signifi cantly due to double-digit growth in the cost of aluminum and HFCS.
OPERATING EXPENSES
The benefi t of ongoing operating expense initiatives allowed us to successfully control the growth of our underlying oper-ating expenses during 2006. We intend to remain diligent in our efforts to manage our operating expenses during 2007 in order to maintain the fl exibility needed to deal with the expected challenges of a diffi cult raw material cost environment.
FRANCHISE IMPAIRMENT CHARGE
During 2006, we recorded a $2.9 billion ($1.8 billion net of tax, or $3.80 per common share) non-cash impairment charge to reduce the carrying amount of our North American franchise license intangible assets to their estimated fair value based upon the results of our annual impairment test of these assets. If, in the future, the estimated fair value of our North American franchise rights were to decline further, it would be necessary to record an additional non-cash impairment charge. The decline in the estimated fair value of our North American franchise intangible assets refl ects the negative impact of several contributing factors, which resulted in a reduction in the forecasted cash fl ows and growth rates used to estimate fair value. These factors include, but are not limited to, (1) an extraordinary increase in raw material costs expected in 2007, driven by signifi cant increases in the cost of aluminum and HFCS; (2) a challenging marketplace environment including continued weakness in the CSD category and increased pric-ing pressures in several high-growth categories, such as water; and (3) increased interest rates contributing to a higher discount rate and capital charge. Furthermore, the business and mar-ketplace environments in which we currently operate differ signifi cantly from the historical environments that drove the business cases used to value and record the acquisition of certain of our North American franchise rights. Accordingly, for certain acquisitions we have been unable to attain the forecasted growth projections that were used to value the franchise rights at the time they were acquired. For additional information about our franchise license intangible assets and the related non-cash impairment charge, refer to Note 1 of the Notes to Consolidated Financial Statements.
OUR STRATEGIC PRIORITIES
In order to remain focused on implementing a strategic, long-term business plan that will position our organization to excel in a dynamic and changing market environment, we have identifi ed three priorities that are essential to our transfor-mation. The following is a summary of the key initiatives that we believe will help drive our future performance:
• Strengthen Our Brand PortfolioWe must continue to strengthen our position in each beverage category by growing the value of our existing brands, while at the same time strategically broadening our presence in fast growing beverage groups. Our current portfolio remains heavily dependent on CSD products; however, over the next fi ve years, most volume growth in the nonalcoholic ready-to-drink category will come from water, juices and juice drinks, and other noncarbonated beverages. While carbonated beverages remain profi table and vital to our success, the broadening of our presence in faster growing beverage groups is necessary. Essential to our future growth is leveraging our powerful relationship with TCCC, which itself is dedicated to expanding its prod-uct portfolio and competing more fully for every beverage purchase. TCCC demonstrated its commitment early in 2007 with the announcement that it would acquire FUZE Beverages LLC, a maker of enhanced juices and teas. This acquisition supports other innovation in the growing tea category, such as the expanded Nestea line, the new Enviga green tea, premium Gold Peak teas, and our expanded relationship with AriZona tea.
• Transform Our Go-to-Market Model and Improve Efficiency and EffectivenessWe must be fl exible to transform our go-to-market model in order to improve customer service and in-store execution while embracing the most effective distribution channels for each of our products. Our direct store delivery (“DSD”) model remains the fastest and most powerful method of distributing the vast majority of our products. Among other advantages, our DSD model allows us to (1) remain in con-tinuous contact with our customers, giving us the ability to seize in-store placement opportunities, and (2) rapidly estab-lish new products in emerging categories. However, shifts in consumer demand for increasingly specialized products, coupled with a rapidly evolving retail environment, have created new distribution realities that cannot be ignored. The proliferation of brands, packages, and products neces-sitates that we take a fresh look at how we bring each of our products to market. During 2006, we moved forward in testing new delivery opportunities, including warehouse delivery of certain products to Wal-Mart and Valero, a large convenience store operator. These projects demonstrate our commitment to evolving our go-to-market model to meet the demands of a changing marketplace. As we refi ne our DSD model, we must also seek oppor-tunities to improve our effi ciency and effectiveness. This includes driving improved consistency and best practices across our organization. In recent years, we have made sig-nifi cant strides in this area, including redesigning our North American business model, reorganizing certain aspects of our operations in Europe, and consolidating certain admin-istrative, fi nancial, and accounting functions for North America

22 Coca-Cola Enterprises Inc. – 2006 Form 10-K
into a single shared services center. We believe, however, that additional efforts to enhance our effi ciency could yield even greater productivity across our organization. Accordingly, we are implementing a host of initiatives to improve our oper-ating performance. For example, we are moving forward with faster water production lines, more productive selling systems for our customers, more productive delivery vehicles, and synergistic delivery and warehouse practices. These, and other initiatives underway, represent only the beginning of our commitment to develop more effi cient operating meth-ods in order to enhance our performance over the long-term.
• Commitment to Our PeopleOur people are the key to our success. As such, we must attract, develop, and retain a highly talented and diverse work-force in order to further establish a winning and inclusive cul-ture. In order to ensure that our people are able to fully utilize their skills and abilities we must provide them with the right tools and right products to win in the marketplace. By develop-ing clear, concise job responsibilities, with goals that are clearly understood, and by improving communication to make certain we share best practices effectively, we will create improved customer satisfaction and generate increased productivity.
Operations ReviewThe following table summarizes our Consolidated Statements of Operations data as a percentage of net operating revenues for the years ended December 31, 2006, 2005, and 2004:
2006 2005 2004
Net operating revenues 100.0% 100.0% 100.0%Cost of sales 60.5 59.7 59.2
Gross profi t 39.5 40.3 40.8Selling, delivery, and administrative expenses 32.3 32.7 32.9Franchise impairment charge 14.8 0.0 0.0
Operating (loss) income (7.6) 7.6 7.9Interest expense, net 3.2 3.4 3.4
(Loss) income before income taxes (10.8) 4.2 4.5Income tax (benefi t) expense (5.0) 1.5 1.2
Net (loss) income (5.8)% 2.7% 3.3%
The following table summarizes our operating (loss) income by operating segment for the years ended December 31, 2006, 2005, and 2004 (in millions; percentages rounded to the nearest ½ percent):
2006 2005 2004
Amount Percent of Total Amount Percent of Total Amount Percent of Total
North America $(1,711) (114.5)% $1,175 82.0% $1,184 82.5%Europe 718 48.0 730 51.0 737 51.5Corporate (502) (33.5) (474) (33.0) (485) (34.0)
Consolidated $(1,495) 100.0% $1,431 100.0% $1,436 100.0%
2006 VERSUS 2005During 2006, we had an operating loss of $1.5 billion compared to operating income of $1.4 billion in 2005. The following table summarizes the signifi cant components of the change in our 2006 operating (loss) income (in millions; percentages rounded to the nearest ½ percent): Change Percent Amount of Total
Changes in operating (loss) income: Impact of bottle and can price, cost, and mix on gross profi t $ 35 2.5% Impact of bottle and can volume on gross profi t 88 6.0 Impact of Jumpstart funding on gross profi t 57 4.0 Net impact of acquired bottler 7 0.5 Selling, delivery, and administrative expenses (175) (12.5) Change in accounting for share-based payment awards (35) (2.5) Franchise impairment charge in 2006 (2,922) (204.0) Net impact of restructuring charges in 2006 and 2005 14 1.0 Legal settlements in 2006 (14) (1.0) Hurricane related asset write-offs in 2005 28 2.0 HFCS litigation settlement proceeds in 2005 (53) (3.5) Asset sale in 2005 (8) (0.5) Currency exchange rate changes 15 1.0 Other changes 37 2.5
Change in operating (loss) income $ (2,926) (204.5)%
2005 VERSUS 2004Operating income decreased $5 million, or 0.5 percent, in 2005 to $1.4 billion. The following table summarizes the signifi cant components of the change in our 2005 operating income (in millions; percentages rounded to the nearest ½ percent):
Change Percent Amount of Total
Changes in operating income: Impact of bottle and can price, cost, and mix on gross profi t $ 28 2.0% Impact of bottle and can volume on gross profi t 35 2.5 Impact of bottle and can selling day shift on gross profi t (44) (3.0) Selling, delivery, and administrative expenses (22) (1.5) Restructuring charges in 2005 (80) (5.5) Hurricane related asset write-offs in 2005 (28) (2.0) HFCS litigation settlement proceeds in 2005 53 3.5 Asset sale in 2005 8 0.5 New concentrate pricing structure in 2004 41 3.0 Currency exchange rate changes – 0.0 Other changes 4 0.0
Change in operating income $ (5) (0.5)%
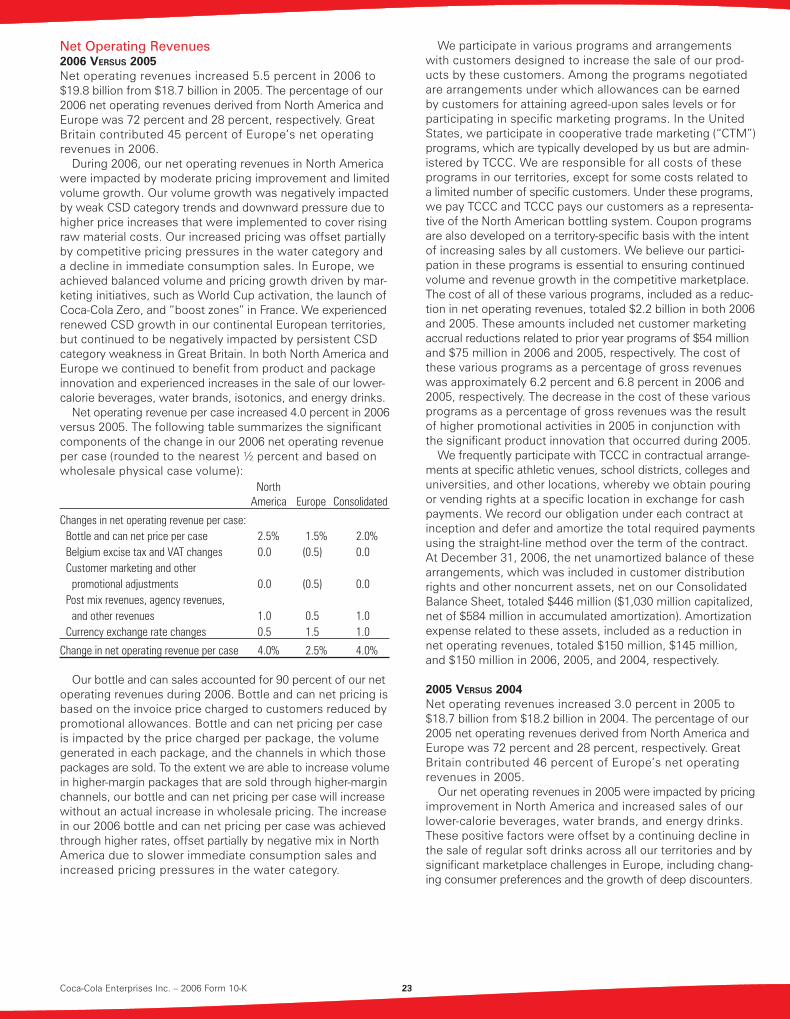
Coca-Cola Enterprises Inc. – 2006 Form 10-K 23
Net Operating Revenues2006 VERSUS 2005Net operating revenues increased 5.5 percent in 2006 to $19.8 billion from $18.7 billion in 2005. The percentage of our 2006 net operating revenues derived from North America and Europe was 72 percent and 28 percent, respectively. Great Britain contributed 45 percent of Europe’s net operating revenues in 2006.
During 2006, our net operating revenues in North America were impacted by moderate pricing improvement and limited volume growth. Our volume growth was negatively impacted by weak CSD category trends and downward pressure due to higher price increases that were implemented to cover rising raw material costs. Our increased pricing was offset partially by competitive pricing pressures in the water category and a decline in immediate consumption sales. In Europe, we achieved balanced volume and pricing growth driven by mar-keting initiatives, such as World Cup activation, the launch of Coca-Cola Zero, and “boost zones” in France. We experienced renewed CSD growth in our continental European territories, but continued to be negatively impacted by persistent CSD category weakness in Great Britain. In both North America and Europe we continued to benefi t from product and package innovation and experienced increases in the sale of our lower-calorie beverages, water brands, isotonics, and energy drinks.
Net operating revenue per case increased 4.0 percent in 2006 versus 2005. The following table summarizes the signifi cant components of the change in our 2006 net operating revenue per case (rounded to the nearest ½ percent and based on wholesale physical case volume): North
America Europe Consolidated
Changes in net operating revenue per case: Bottle and can net price per case 2.5% 1.5% 2.0% Belgium excise tax and VAT changes 0.0 (0.5) 0.0 Customer marketing and other promotional adjustments 0.0 (0.5) 0.0 Post mix revenues, agency revenues, and other revenues 1.0 0.5 1.0 Currency exchange rate changes 0.5 1.5 1.0
Change in net operating revenue per case 4.0% 2.5% 4.0%
Our bottle and can sales accounted for 90 percent of our net operating revenues during 2006. Bottle and can net pricing is based on the invoice price charged to customers reduced by promotional allowances. Bottle and can net pricing per case is impacted by the price charged per package, the volume generated in each package, and the channels in which those packages are sold. To the extent we are able to increase volume in higher-margin packages that are sold through higher-margin channels, our bottle and can net pricing per case will increase without an actual increase in wholesale pricing. The increase in our 2006 bottle and can net pricing per case was achievedthrough higher rates, offset partially by negative mix in North America due to slower immediate consumption sales and increased pricing pressures in the water category.
We participate in various programs and arrangements with customers designed to increase the sale of our prod-ucts by these customers. Among the programs negotiated are arrangements under which allowances can be earned by customers for attaining agreed-upon sales levels or for participating in specifi c marketing programs. In the United States, we participate in cooperative trade marketing (“CTM”) programs, which are typically developed by us but are admin-istered by TCCC. We are responsible for all costs of these programs in our territories, except for some costs related to a limited number of specifi c customers. Under these programs, we pay TCCC and TCCC pays our customers as a representa-tive of the North American bottling system. Coupon programs are also developed on a territory-specifi c basis with the intent of increasing sales by all customers. We believe our partici-pation in these programs is essential to ensuring continued volume and revenue growth in the competitive marketplace. The cost of all of these various programs, included as a reduc-tion in net operating revenues, totaled $2.2 billion in both 2006 and 2005. These amounts included net customer marketing accrual reductions related to prior year programs of $54 million and $75 million in 2006 and 2005, respectively. The cost of these various programs as a percentage of gross revenues was approximately 6.2 percent and 6.8 percent in 2006 and 2005, respectively. The decrease in the cost of these various programs as a percentage of gross revenues was the result of higher promotional activities in 2005 in conjunction with the signifi cant product innovation that occurred during 2005.
We frequently participate with TCCC in contractual arrange-ments at specifi c athletic venues, school districts, colleges and universities, and other locations, whereby we obtain pouring or vending rights at a specifi c location in exchange for cash payments. We record our obligation under each contract at inception and defer and amortize the total required payments using the straight-line method over the term of the contract. At December 31, 2006, the net unamortized balance of these arrangements, which was included in customer distribution rights and other noncurrent assets, net on our Consolidated Balance Sheet, totaled $446 million ($1,030 million capitalized, net of $584 million in accumulated amortization). Amortization expense related to these assets, included as a reduction in net operating revenues, totaled $150 million, $145 million, and $150 million in 2006, 2005, and 2004, respectively.
2005 VERSUS 2004Net operating revenues increased 3.0 percent in 2005 to $18.7 billion from $18.2 billion in 2004. The percentage of our 2005 net operating revenues derived from North America and Europe was 72 percent and 28 percent, respectively. Great Britain contributed 46 percent of Europe’s net operating revenues in 2005.
Our net operating revenues in 2005 were impacted by pricing improvement in North America and increased sales of our lower-calorie beverages, water brands, and energy drinks. These positive factors were offset by a continuing decline in the sale of regular soft drinks across all our territories and by signifi cant marketplace challenges in Europe, including chang-ing consumer preferences and the growth of deep discounters.

24 Coca-Cola Enterprises Inc. – 2006 Form 10-K
Net operating revenue per case increased 3.0 percent in 2005 versus 2004. The following table summarizes the sig-nifi cant components of the change in our 2005 net operating revenue per case (rounded to the nearest ½ percent and based on wholesale physical case volume):
NorthAmerica Europe Consolidated
Changes in net operating revenue per case: Bottle and can net price per case 3.0% 1.0% 2.0% Belgium excise tax and VAT changes 0.0 0.5 0.0 Customer marketing and other promotional adjustments (0.5) 0.5 0.0 Post mix revenues, agency revenues, and other revenues 1.0 0.0 0.5 Currency exchange rate changes 0.5 0.0 0.5
Change in net operating revenue per case 4.0% 2.0% 3.0%
Our bottle and can sales accounted for 90 percent of our net operating revenues during 2005. The increase in our 2005 bottle and can net pricing per case was primarily achieved with rate increases, but also refl ected additional mix benefi t associated with the growth of our immediate consumption business and increased sales of higher-margin products, such as energy drinks.
The cost of various customer programs and arrangements designed to increase the sale of our products by these cus-tomers totaled $2.2 billion and $1.9 billion in 2005 and 2004, respectively. These amounts included net customer marketing accrual reductions related to prior year programs of $75 mil-lion and $71 million in 2005 and 2004, respectively. The cost of these various programs as a percentage of gross revenues was approximately 6.8 percent and 6.2 percent in 2005 and 2004, respectively. The increase in the cost of these various programs as a percentage of gross revenues was the result of higher promotional activities in 2005 in conjunction with the signifi cant product innovation that occurred during 2005.
Cost of Sales2006 VERSUS 2005Cost of sales increased 7.0 percent in 2006 to $12.0 billion from $11.2 billion in 2005. Cost of sales per case increased 5.5 percent in 2006 versus 2005. The following table summa-rizes the signifi cant components of the change in our 2006 cost of sales per case (rounded to the nearest ½ percent and based on wholesale physical case volume):
NorthAmerica Europe Consolidated
Changes in cost of sales per case: Bottle and can ingredient and packaging costs 4.0% 2.0% 3.5% Belgium excise tax and VAT changes 0.0 (0.5) 0.0 HFCS litigation settlement proceeds in 2005 0.5 0.0 0.5 Bottle and can marketing credits and Jumpstart funding (1.0) 0.0 (1.0) Costs related to post mix, agency, and other revenues 2.0 0.5 1.5 Currency exchange rate changes 0.5 1.5 1.0
Change in cost of sales per case 6.0% 3.5% 5.5%
The cost environment across all of our territories continued to be challenging during 2006, particularly in North America, where our year-over-year bottle and can ingredient and pack-aging cost per case increased 4.0 percent. This increase was driven by higher costs associated with package mix shifts, a moderate increase in the cost of concentrate, and increased conversion costs due to higher energy prices. We also expe-rienced increases in the cost of certain materials, particularly aluminum, PET (plastic), and HFCS. During 2006, our cost of sales benefi ted from the recognition of increased Jumpstart income due to higher cold drink equipment placements under our amended Jumpstart agreements with TCCC (programs with TCCC designed to promote the placement of cold drink equipment) and the rollout of our energy drink portfolio.
We have implemented a project in the Netherlands to tran-sition from the production and sale of refi llable PET (plastic) bottles to the production and sale of non-refi llable PET (plastic) bottles. The transition commenced in 2004 and was completed in the fi rst quarter of 2006. The increased packaging fl exibility has led to increased sales in the Netherlands by offering added variety and convenience to consumers. The transition resulted in (1) accelerated depreciation for certain machinery and equip-ment, plastic crates, and refi llable plastic bottles; (2) costs for removing current production lines; (3) termination and severance costs; (4) training costs; (5) external warehousing costs; and (6) operational ineffi ciencies. The expenses related to this project totaled approximately $27 million, offset partially by $8 million in gains related to the forfeiture of customer deposits and the sale of refi llable PET (plastic) bottles and crates. We recognized $11 million and $16 million of these expenses during 2005 and 2004, respectively, and recorded the $8 million in gains during 2006.
2005 VERSUS 2004Cost of sales increased 4.0 percent in 2005 to $11.2 billion from $10.8 billion in 2004. Cost of sales per case increased 4.0 percent in 2005 versus 2004. The following table summa-rizes the signifi cant components of the change in our 2005 cost of sales per case (rounded to the nearest ½ percent and based on wholesale physical case volume):
NorthAmerica Europe Consolidated
Changes in cost of sales per case: Bottle and can ingredient and packaging costs 5.0% 1.5% 3.5% Belgium excise tax and VAT changes 0.0 0.5 0.0 HFCS litigation settlement proceeds in 2005 (0.5) 0.0 (0.5) New concentrate pricing structure in 2004 (0.5) 0.0 0.0 Bottle and can marketing credits and Jumpstart funding (0.5) (0.5) (0.5) Costs related to post mix, agency, and other revenues 1.5 0.5 1.0 Currency exchange rate changes 0.5 (0.5) 0.5
Change in cost of sales per case 5.5% 1.5% 4.0%

Coca-Cola Enterprises Inc. – 2006 Form 10-K 25
The increase in our bottle and can ingredient and packaging costs during 2005 was primarily the result of increases in the cost of certain materials, particularly PET (plastic), aluminum, and fuel. We also experienced a moderate increase in the cost of concentrate. The increased costs we experienced in North America were due, in part, to the impact of the hurricanes.
Volume2006 Versus 2005The following table summarizes the change in our 2006 bottle and can volume versus 2005, as adjusted to refl ect the impact of an acquisition completed in 2006 as if that acquisition were completed in 2005 (no acquisitions were made in 2005; sell-ing days were the same in 2006 and 2005; rounded to the nearest ½ percent): North
America Europe Consolidated
Change in volume 1.0% 3.5% 1.5% Impact of acquisition (0.5) 0.0 (0.5)
Change in volume, adjusted for acquisition 0.5% 3.5% 1.0%
North America comprised 76 percent and 77 percent of our consolidated bottle and can volume during 2006 and 2005, respectively. Great Britain contributed 46 percent and 47 per-cent of our European bottle and can volume in 2006 and 2005, respectively. In 2006 and 2005, our sales represented approxi-mately 13 percent of the total nonalcoholic beverage sales in our North American territories and approximately 8 percent of total nonalcoholic beverage sales in our European territories.
BrandsThe following table summarizes our 2006 bottle and can volume results by major brand category, as adjusted to refl ect the impact of an acquisition completed in 2006 as if that acquisi-tion were completed in 2005 (no acquisitions were made in 2005; selling days were the same in 2006 and 2005; rounded to the nearest ½ percent): Percent Change of Total
North America: Coca-Cola trademark (3.0)% 57.5% Soft-drink fl avors and energy 4.0 26.0 Juices, isotonics, and other 1.5 8.5 Water 19.0 8.0
Total 0.5% 100.0%
Europe: Coca-Cola trademark 4.5% 68.5% Soft-drink fl avors and energy (1.0) 19.5 Juices, isotonics, and other 5.0 9.5 Water 13.5 2.5
Total 3.5% 100.0%
Consolidated: Coca-Cola trademark (1.0)% 60.0% Soft-drink fl avors and energy 3.0 24.5 Juices, isotonics, and other 2.5 8.5 Water 18.5 7.0
Total 1.0% 100.0%
The overall performance of our product portfolio in 2006 and 2005 continued to be impacted by trends in the marketplace, which refl ect a consumer preference for diet and lower-calorie beverages and an increased demand for specialized beverage choices. In order to capitalize on these trends, we have con-tinued to focus our product and package innovation on diet and light brands, water brands, teas, and sports and energy drinks.
In North America, the sales volume of our Coca-Colatrademark products decreased 3.0 percent during 2006. Our regular Coca-Cola trademark products decreased 4.0 percent, while our diet Coca-Cola trademark products declined 2.0 per-cent. The decrease in our regular Coca-Cola trademark products was primarily attributable to lower sales of Coca-Cola classic, Coca-Cola with Lime, and Vanilla Coca-Cola, offset partially by sales of Black Cherry Vanilla Coke, which was introduced during the fi rst quarter of 2006. The decline in our diet Coca-Cola trademark products was primarily driven by lower sales of Diet Coke, Diet Coke with Lime, and Diet Vanilla Coca-Cola. These decreases were partially offset by a substantial increase in the year-over-year sales of Coca-Cola Zero, which was launched in the second quarter of 2005, and sales of Diet Black Cherry Vanilla Coke, which was introduced during the fi rst quarter of 2006.
Our soft-drink fl avors and energy volume in North America increased 4.0 percent during 2006. This increase was primarily driven by the performance of our energy portfolio, including Full Throttle and Rockstar, the introduction of Vault and Vault Zero during the fi rst and second quarters of 2006, respectively, and higher sales of our Fresca products. These increases were offset partially by a year-over-year decline in the sale of Sprite and Sprite Remix products.
Our juices, isotonics, and other volume increased 1.5 percent in North America during 2006. This increase was primarily attributable to POWERade volume growth, offset partially by a decrease in the sale of Minute Maid products. We also introduced Gold Peak, a premium iced tea beverage, during the third quarter of 2006. Our water brands continued to per-form well in North America, increasing 19.0 percent during 2006. This performance was primarily driven by higher Dasani sales volume.
In Europe, the sales volume of our Coca-Cola trademark prod-ucts increased 4.5 percent during 2006. Our regular Coca-Cola trademark products increased 4.0 percent, driven primarily by higher sales of Coca-Cola. Our zero-sugar Coca-Cola trade-mark products increased 5.0 percent, which was primarily attributable to sales of Coca-Cola Zero, which was introduced in Great Britain and Belgium during the second and third quarters of 2006, respectively. Our soft-drink fl avors and energy volume in Europe decreased 1.0 percent during 2006, while our juices, isotonics, and other volume increased 5.0 per-cent. The increase in our juices, isotonics, and other volume was primarily driven by volume growth in our sports drinks, POWERade and Aquarius. Our overall volume results in Europe were positively impacted during 2006 by marketing initiatives, such as World Cup activation, the launch of Coca-Cola Zero, and “boost zones” in France.

26 Coca-Cola Enterprises Inc. – 2006 Form 10-K
PackagesThe following table summarizes our 2006 bottle and can volume results by major package category, as adjusted to refl ect the impact of an acquisition completed in 2006 as if that acquisition were completed in 2005 (no acquisitions were made in 2005; selling days were the same in 2006 and 2005; rounded to the nearest ½ percent): Percent Change of Total
North America: Cans (0.5)% 59.5% 20-ounce (0.5) 14.0 2-liter (4.0) 11.0 Other (includes 500 ml and 32-ounce) 9.5 15.5
Total 0.5% 100.0%
Europe: Cans 4.0% 38.0% Multi-serve PET (1-liter and greater) 3.5 32.5 Single-serve PET 4.0 13.5 Other 3.0 16.0
Total 3.5% 100.0%
2005 VERSUS 2004The following table summarizes the change in our 2005 bottle and can volume versus 2004, as adjusted to refl ect the impact of two fewer selling days in 2005 versus 2004 (no acquisitions were made in 2005 or 2004; rounded to the nearest ½ percent):
NorthAmerica Europe Consolidated
Change in volume 0.5% (2.5)% 0.0% Impact of selling day shift 0.5 0.5 0.5
Change in volume, adjusted for selling day shift 1.0% (2.0)% 0.5%
North America comprised 77 percent and 76 percent of our consolidated bottle and can volume during 2005 and 2004, respectively. Great Britain contributed 47 percent of our European bottle and can volume in 2005 and 2004. In 2005 and 2004, our sales represented approximately 13 percent of the total nonalcoholic beverage sales in our North American territories and approximately 8 percent of total nonalcoholic beverage sales in our European territories.
BrandsThe following table summarizes our 2005 bottle and can volume results by major brand category, as adjusted to refl ect the impact of two fewer selling days in 2005 versus 2004 (no acquisitions were made in 2005 or 2004; rounded to the nearest ½ percent): Percent Change of Total
North America: Coca-Cola trademark (1.5)% 59.5% Soft-drink fl avors and energy 2.5 25.0 Juices, isotonics, and other 2.5 8.5 Water 24.0 7.0
Total 1.0% 100.0%
Europe: Coca-Cola trademark (1.5)% 68.0% Soft-drink fl avors and energy (6.5) 20.5 Juices, isotonics, and other 9.0 9.5 Water (4.0) 2.0
Total (2.0)% 100.0%
Consolidated: Coca-Cola trademark (1.5)% 61.5% Soft-drink fl avors and energy 0.5 24.0 Juices, isotonics, and other 4.0 8.5 Water 21.0 6.0
Total 0.5% 100.0%
In North America, the sales volume of our Coca-Cola trademark products decreased 1.5 percent during 2005. Our regular Coca-Cola trademark products decreased 3.0 per-cent, while our diet Coca-Cola trademark products increased 1.0 percent. The decrease in our regular Coca-Cola trademark products was primarily attributable to lower sales of Coca-Cola classic, Coca-Cola C2, and Vanilla Coca-Cola, offset partially by the sale of Coca-Cola with Lime, which was introduced during the fi rst quarter of 2005. The increase in our diet Coca-Cola trademark products was primarily driven by signifi cant prod-uct innovation during the second quarter of 2005, which included the introduction of Coca-Cola Zero and Diet Coke Sweetened with Splenda®. The positive impact of these new products was partially offset by a decrease in the sale of regular Diet Coke.
Our soft-drink fl avors and energy volume in North America increased 2.5 percent during 2005. This increase was primarily driven by higher sales of Fresca and Fanta products, along with the introduction of two new energy drinks, Full Throttle and Rockstar, during the fi rst and second quarters of 2005, respec-tively. These increases were offset partially by a year-over-year decline in the sale of Sprite and Sprite Remix products.
Coca-Cola Enterprises Inc. – 2006 Form 10-K 27
Our juices, isotonics, and other volume increased 2.5 percent in North America during 2005. This increase was primarily attrib-utable to a 27.5 percent increase in POWERade, which included the introduction of POWERade Option, a reduced calorie sports drink, during the third quarter of 2005. This increase was offset partially by declines in the sale of Minute Maid products and Nestea. Our water brands increased 24.0 percent in North America during 2005 due to a signifi cant increase in the sale of Dasani and the introduction of Dasani fl avored waters beginning in the second quarter of 2005.
In Europe, the sales volume of our Coca-Cola trademark products decreased 1.5 percent during 2005. Our regular Coca-Cola trademark products decreased 3.0 percent, driven primarily by lower sales of Coca-Cola and Vanilla Coca-Cola. Our zero-sugar Coca-Cola trademark products increased 1.0 per-cent, which was primarily attributable to sales of Coca-Cola Light with Lime, offset partially by a decline in the sales of Coca-Cola Light with Lemon. Our soft-drink fl avors and energy volume in Europe decreased 6.5 percent during 2005, due to a signifi cant decline in the sale of Fanta products.
PackagesThe following table summarizes our 2005 bottle and can volume results by major package category, as adjusted to refl ect the impact of two fewer selling days in 2005 versus 2004 (no acquisitions were made in 2005 or 2004; rounded to the nearest ½ percent): Percent Change of Total
North America: Cans (1.0)% 60.0% 20-ounce 2.5 14.5 2-liter (6.0) 11.0 Other (includes 500 ml and 32-ounce) 17.5 14.5
Total 1.0% 100.0%Europe: Cans (1.5)% 38.0% Multi-serve PET (1-liter and greater) (5.0) 32.5 Single-serve PET 2.0 13.5 Other 1.0 16.0
Total (2.0)% 100.0%
Selling, Delivery, and Administrative Expenses2006 VERSUS 2005Selling, delivery, and administrative (“SD&A“) expenses increased $264 million, or 4.5 percent, to $6.4 billion in 2006. The fol-lowing table summarizes the signifi cant components of the change in our 2006 SD&A expenses (in millions; percentages rounded to the nearest ½ percent):
Change Percent Amount of Total
Changes in SD&A expenses: Administrative expenses $ 26 0.5% Delivery and merchandise expenses 55 1.0 Selling and marketing expenses 100 1.5 Depreciation and amortization (31) (0.5) Expenses of acquired bottler 31 0.5 Change in accounting for share-based payment awards 35 0.5 Net impact of restructuring charges in 2006 and 2005 (14) 0.0 Legal settlements in 2006 14 0.0 Hurricane related asset write-offs in 2005 (26) (0.5) Asset sale in 2005 8 0.0 Currency exchange rate changes 41 1.0 Other expenses 25 0.5
Change in SD&A expenses $ 264 4.5%
SD&A expenses as a percentage of net operating revenues was 32.3 percent and 32.7 percent in 2006 and 2005, respec-tively. The decrease in our SD&A expenses as a percentage of net operating revenues during 2006 was primarily the result of (1) a continued focus on controlling the growth of our operating expenses; (2) lower restructuring charges; and (3) the absence of hurricane related asset write-offs. These items were partially offset by higher employee com-pensation expense due to the adoption of SFAS 123R and legal settlement expense.
During 2006 and 2005, we recorded restructuring charges totaling $66 million and $80 million, respectively. These charges were primarily related to (1) workforce reductions associated with the reorganization of our North American operations into six United States business units and Canada; (2) the reorganiza-tion of certain aspects of our operations in Europe; (3) changes in our executive management; and (4) the elimination of certain corporate headquarters positions. The reorganization of our North American operations (1) has resulted in a simplifi ed and fl atter organizational structure; (2) has helped facilitate a closer interaction between our front-line employees and our cus-tomers; and (3) will provide long-term cost savings through improved administrative and operating effi ciencies. Similarly, the reorganization of certain aspects of our operations in Europe has helped improve operating effectiveness and effi -ciency while enabling our front-line employees to better meet the needs of our customers.

28 Coca-Cola Enterprises Inc. – 2006 Form 10-K
In February 2007, we announced a restructuring program to support the implementation of key strategic initiatives designed to achieve long-term sustainable growth. This restructuring program will impact certain aspects of our North American and European operations as well as our corporate headquarters. Through this restructuring program we will (1) enhance stan-dardization in our operating structure and business practices; (2) create a more effi cient supply chain and order fulfi llment structure; and (3) improve customer service in North America through the implementation of a new selling system for smaller customers. These restructuring activities are expected to result in a charge of approximately $300 million, including transition costs, and a net job reduction of approximately 5 percent of our total workforce, or approximately 3,500 positions. The majority of the expense is expected to be recognized in 2007 and 2008.
On January 1, 2006, we adopted SFAS 123R, which requires the grant-date fair value of all share-based payment awards, including employee share options, to be recorded as employee compensation expense over the requisite service period. We applied the modifi ed prospective transition method when we adopted SFAS 123R and, therefore, did not restate any prior periods. During 2006, we recorded incremental compensation expense totaling $35 million as a result of adopting SFAS 123R. If our share-based payment awards had been accounted for under SFAS 123R during 2005, our compensation expense would have been approximately $48 million higher. For addi-tional information about the adoption of SFAS 123R, refer to Note 11 of the Notes to Consolidated Financial Statements.
During 2005, we recorded charges totaling $28 million related to damage caused by Hurricanes Katrina, Rita, and Wilma. These charges were primarily for (1) the write-off of damaged or destroyed fi xed assets; (2) the estimated costs to retrieve and dispose of non-usable vending equipment; and (3) the loss of inventory. Approximately $26 million of the charges were included in SD&A and $2 million was recorded in cost of sales.
2005 VERSUS 2004SD&A expenses increased $144 million, or 2.5 percent, to $6.1 billion in 2005. The following table summarizes the signifi -cant components of the change in our 2005 SD&A expenses (in millions; percentages rounded to the nearest ½ percent):
Change Percent Amount of Total
Changes in SD&A expenses: Administrative expenses $ (16) (0.5)% Delivery and merchandise expenses 35 0.5 Selling and marketing expenses 14 0.5 Restructuring charges in 2005 80 1.5 Hurricane related asset write-offs in 2005 26 0.5 Asset sale in 2005 (8) 0.0 Currency exchange rate changes 24 0.5 Other expenses (11) (0.5)
Change in SD&A expenses $ 144 2.5%
SD&A expenses as a percentage of net operating revenues was 32.7 percent and 32.9 percent in 2005 and 2004, respec-tively. During 2005, we were able to control the growth of our underlying operating expenses, as we realized cost savings associated with our ongoing operating expense initiatives. Our SD&A expenses were also impacted by the restructuring charges that were recorded during the year and the asset write-offs associated with hurricane damage.
Franchise Impairment ChargeDuring 2006, we recorded a $2.9 billion ($1.8 billion net of tax, or $3.80 per common share) non-cash impairment charge to reduce the carrying amount of our North American franchise license intangible assets to their estimated fair value based upon the results of our annual impairment test. For additional information about our franchise license intangible assets and the related non-cash impairment charge, refer to Note 1 of the Notes to Consolidated Financial Statements.
Interest Expense2006 VERSUS 2005Interest expense, net totaled $633 million in 2006 and 2005. During 2006, we experienced higher interest rates, offset partially by a lower average outstanding debt balance. Our 2005 interest expense, net included a net charge totaling $8 million resulting from the early extinguishment of certain debt obligations in conjunction with the repatriation of non-U.S. earnings. At December 31, 2006, approximately 83 percent of our debt portfolio was comprised of fi xed-rate debt and 17 per-cent was fl oating-rate debt. Our weighted average cost of debt was 5.9 percent in 2006 versus 5.7 percent in 2005. Our average outstanding debt balance in 2006 was $10.4 billion as compared to $10.8 billion in 2005.
2005 VERSUS 2004Interest expense, net increased 2.5 percent in 2005 to $633 mil-lion from $619 million in 2004. During 2005, we recorded a net charge totaling $8 million resulting from the early extin-guishment of certain debt obligations in conjunction with the repatriation of non-U.S. earnings. We also experienced higher interest rates, partially offset by a lower average outstanding debt balance. At December 31, 2005, approximately 86 percent of our debt portfolio was comprised of fi xed-rate debt and 14 percent was fl oating-rate debt. Our weighted average cost of debt was 5.7 percent in 2005 versus 5.3 percent in 2004. Our average outstanding debt balance in 2005 was $10.8 billion as compared to $11.4 billion in 2004.
Income Tax Expense2006 VERSUS 2005Our effective tax rate was a benefi t of 46 percent and a provision of 35 percent for 2006 and 2005, respectively. Our 2006 rate included (1) an $80 million (10 percentage point decrease in our effective tax rate) tax benefi t, primarily for state tax law changes and Canadian federal and provincial tax rate changes and (2) a $15 million (2 percentage point decrease in our effective tax rate) tax benefi t related to the revaluation of various income tax obligations. Our 2006 rate

Coca-Cola Enterprises Inc. – 2006 Form 10-K 29
also included a $1.1 billion (63 percentage point decrease in our effective tax rate) income tax benefi t related to a $2.9 billion non-cash franchise impairment charge. For additional informa-tion about the non-cash franchise impairment charge, refer to Note 1 of the Notes to Consolidated Financial Statements. Our 2005 rate included (1) a $40 million (5 percentage point decrease in our effective tax rate) tax benefi t, primarily for state tax rate changes and (2) a $27 million (3 percentage point decrease in our effective tax rate) tax benefi t related to the revaluation of various income tax obligations. Our 2005 rate also included a $128 million (16 percentage point increase in our effective tax rate) income tax provision related to the repatriation of $1.6 billion in previously undistributed non-U.S. earnings and basis. This repatriation was completed in con-nection with the American Jobs Creation Act of 2004, which contained, among other things, a repatriation provision that provided a special, one-time tax deduction of 85 percent of certain non-U.S. earnings that were repatriated prior to December 31, 2005, provided certain criteria were met. For additional information about the repatriation, refer to Note 10 of the Notes to Consolidated Financial Statements.
2005 VERSUS 2004Our effective tax rate was a provision of 35 percent and 27 per-cent for 2005 and 2004, respectively. Our 2005 rate included (1) a $128 million (16 percentage point increase in our effective tax rate) income tax provision related to the repatriation of non-U.S. earnings; (2) a $40 million (5 percentage point decrease in our effective tax rate) tax benefi t, primarily for state tax rate changes; and (3) a $27 million (3 percentage point decrease in our effective tax rate) tax benefi t related to the revaluation of various income tax obligations. Our 2004 rate included tax rate reductions totaling $20 million (2 percentage point decrease in our effective rate) due to the benefi t of favorable tax rate changes, primarily in Europe.
Relationship with The Coca-Cola CompanyWe are a marketer, producer, and distributor principally of Coca-Cola products with approximately 93 percent of our sales volume consisting of sales of TCCC products. Our license arrangements with TCCC are governed by licensing territory agreements. TCCC owned approximately 35 percent of our outstanding shares as of December 31, 2006. For information about our transactions with TCCC during 2006, 2005, and 2004, refer to Note 3 of the Notes to Consolidated Financial Statements.
Liquidity and Cash Flow ReviewLIQUIDITY AND CAPITAL RESOURCES
Our sources of capital include, but are not limited to, cash fl ows from operations, the issuance of public or private placement debt, bank borrowings, and the issuance of equity securities. We believe that available short-term and long-term capital resources are suffi cient to fund our capital expenditures, benefi t plan contributions, working capital requirements, scheduled debt payments, interest payments, income tax obligations, dividends to our shareowners, any contemplated acquisitions, and share repurchases.
The following table summarizes our availability under debt and credit facilities as of December 31, 2006 and 2005 (in millions): 2006 2005
Amounts available for borrowing: Amounts available under committed domestic and international credit facilities (A) $ 1,940 $ 2,297Amounts available under public debt facilities: (B)
Shelf registration statement with the U.S. Securities and Exchange Commission 3,221 3,221 Euro medium-term note program 1,514 1,557
Total amounts available under public debt facilities 4,735 4,778
Total amounts available $ 6,675 $ 7,075
(A) Amounts are shown net of outstanding commercial paper totaling $998 million and $593 million as of December 31, 2006 and 2005, respectively, since these facilities serve as a backstop to our commercial paper programs. At December 31, 2006 and 2005, there were no outstanding borrowings under our committed credit facilities. Our primary committed facility matures in 2009 and is a $2.5 billion revolving credit facility with a syndicate of 26 banks.
(B) Amounts available under each of these public debt facilities and the related costs to borrow are subject to market conditions at the time of borrowing.
We satisfy seasonal working capital needs and other fi nancing requirements with short-term borrowings under our commer-cial paper programs, bank borrowings, and various lines of credit. At December 31, 2006 and 2005, we had approximately $998 million and $593 million, respectively, outstanding in commercial paper. During 2007, we plan to repay a portion of the outstanding borrowings under our commercial paper programs and short-term credit facilities with operating cash fl ow and intend to refi nance the remaining outstanding borrow-ings. As shown in the preceding table, at December 31, 2006, we had approximately $1.9 billion available for borrowing under committed domestic and international credit facilities.
CREDIT RATINGS AND COVENANTS
Our credit ratings are periodically reviewed by rating agencies. Currently, our long-term ratings from Moody’s, Standard and Poor’s, and Fitch are A2, A, and A, respectively. In February 2007, Moody’s placed our long-term rating on review for a possible downgrade. Changes in our operating results, cash fl ows, or fi nancial position could impact the ratings assigned by the various rating agencies. Should our credit ratings be adjusted downward, we may incur higher costs to borrow, which could have a material impact on our Consolidated Financial Statements.
Our credit facilities and outstanding notes and debentures contain various provisions that, among other things, require us to limit the incurrence of certain liens or encumbrances in excess of defi ned amounts. Additionally, our credit facilities require us to maintain a defi ned net debt to total capital ratio. We were in compliance with these requirements as of December 31, 2006. These requirements currently are not, and it is not anticipated they will become, restrictive to our liquidity or capital resources.

30 Coca-Cola Enterprises Inc. – 2006 Form 10-K
SUMMARY OF CASH ACTIVITIES
2006Our principal sources of cash consisted of (1) those derived from operations of $1.6 billion; (2) proceeds from the issuance of debt and net issuance of commercial paper totaling $1.1 billion; and (3) proceeds from the disposal of capital assets totaling $50 million. Our primary uses of cash were for (1) debt payments of $1.6 billion; (2) capital asset investments of $882 million; (3) the acquisition of Central Coca-Cola Bottling, Inc for $106 mil-lion; and (4) dividend payments totaling $114 million.
2005Our principal sources of cash consisted of (1) those derived from operations of $1.6 billion; (2) proceeds from the issuance of debt totaling $1.5 billion; (3) proceeds from the settlement of our interest rate swap agreements totaling $46 million; and (4) proceeds from the disposal of capital assets totaling $48 mil-lion. Our primary uses of cash were for (1) debt payments of $1.8 billion; (2) net payments on commercial paper of $599 mil-lion; (3) capital asset investments of $902 million; and (4) dividend payments totaling $76 million.
2004Our principal sources of cash consisted of (1) those derived from operations of $1.6 billion; (2) proceeds from the issuance of debt totaling $558 million; and (3) proceeds from the exercise of employee share options totaling $181 million. Our primary uses of cash were for (1) debt payments of $1.3 billion; (2) capi-tal asset investments of $949 million; and (3) dividend payments totaling $76 million.
OPERATING ACTIVITIES
2006 VERSUS 2005Our net cash derived from operating activities decreased $29 million in 2006 to $1.6 billion. This decrease was primarily the result of (1) working capital changes and (2) the receipt of $53 million in proceeds from the settlement of litigation against suppliers of HFCS during 2005. These items were partially off-set by a $61 million decrease in our pension and postretirement benefi t plan contributions. For additional information about the changes in our assets and liabilities, refer to our Financial Position discussion below.
2005 VERSUS 2004Our net cash derived from operating activities increased $1 mil-lion in 2005 to $1.6 billion. This increase was primarily driven by favorable changes in our assets and liabilities. For additional information about the changes in our assets and liabilities, refer to our Financial Position discussion below.
INVESTING ACTIVITIES
2006 VERSUS 2005Our capital asset investments decreased $20 million in 2006 to $882 million and represented the principal use of cash for investing activities. The following table summarizes our capi-tal asset investments for the years ended December 31, 2006 and 2005 (in millions): 2006 2005
Supply chain infrastructure improvements $ 376 $ 420Cold drink equipment 349 283Fleet purchases 85 78Information technology and other capital investments 72 121
Total capital asset investments $ 882 $ 902
Our investment in cold drink equipment increased in 2006 as compared to 2005, due to the higher equipment placements under our amended Jumpstart agreements with TCCC and the rollout of our energy drink portfolio.
2005 VERSUS 2004Our capital asset investments decreased $47 million in 2005 to $902 million and represented the principal use of cash for investing activities. The following table summarizes our capi-tal asset investments for the years ended December 31, 2005 and 2004 (in millions): 2005 2004
Supply chain infrastructure improvements $ 420 $ 395Cold drink equipment 283 343Fleet purchases 78 98Information technology and other capital investments 121 113
Total capital asset investments $ 902 $ 949
FINANCING ACTIVITIES
2006 VERSUS 2005Our net cash used in fi nancing activities decreased $233 million in 2006 to $571 million from $804 million in 2005. The follow-ing table summarizes our issuances of debt, payments on debt, and our net issuances on commercial paper for the year ended December 31, 2006 (in millions):
Issuances of Debt Maturity Date Rate Amount
£175 million British pound sterling note May 2009 5.25% $ 325British revolving credit facilities Uncommitted –(A) 127Belgian revolving credit facilities Uncommitted –(A) 97French revolving credit facilities Uncommitted –(A) 147
Total issuances of debt, excluding commercial paper 696Net issuances of commercial paper 387
Total issuances of debt $ 1,083
Payments on Debt Maturity Date Rate Amount
$250 million U.S. dollar note September 2006 2.50% $ (250)$450 million U.S. dollar note August 2006 5.38 (450)£175 million British pound sterling note May 2006 4.13 (330)British revolving credit facilities Uncommitted –(A) (254)Belgian revolving credit facilities Uncommitted –(A) (90)French revolving credit facilities Uncommitted –(A) (201)Other payments – – (42)
Total payments on debt $ (1,617)
(A) These credit facilities and notes carry variable interest rates.
During 2006 and 2005, we made dividend payments on our common stock totaling $114 million and $76 million, respectively. In December 2005, we increased our quarterly dividend 50 percent from $0.04 per common share to $0.06 per common share.

Coca-Cola Enterprises Inc. – 2006 Form 10-K 31
2005 VERSUS 2004Our net cash used in fi nancing activities increased $172 million in 2005 to $804 million from $632 million in 2004. The following table summarizes our issuances of debt, payments on debt, and our net payments on commercial paper for the year ended December 31, 2005 (in millions):
Issuances of Debt Maturity Date Rate Amount
550 million Euro note (A) June 2007 –(B) $ 651350 million Euro note (A) December 2008 3.13% 414British revolving credit facilities Uncommitted –(B) 180French revolving credit facilities Uncommitted –(B) 283Other issuances – – 13
Total issuances of debt $ 1,541
Payments on Debt Maturity Date Rate Amount
$500 million U.S. dollar note (C) May 2007 5.25% $ (505)$300 million U.S. dollar note (C) September 2009 7.13 (183)$550 million U.S. dollar note (C) August 2011 6.13 (279)$250 million U.S. dollar note January 2005 8.00 (250)French revolving credit facilities Uncommitted –(B) (308)British revolving credit facilities Uncommitted –(B) (151)Other payments – – (80)
Total payments on debt, excluding commercial paper (1,756)Net payments on commercial paper (599)
Total payments on debt $ (2,355)
(A) These notes were issued in conjunction with the repatriation of non-U.S. earnings that occurred in December 2005. For additional information about the repatriation, refer to Note 10 of the Notes to Consolidated Financial Statements.
(B) These credit facilities and notes carry variable interest rates.(C) These notes were extinguished or partially extinguished in conjunction with the repatriation of
non-U.S. earnings that occurred in December 2005. As a result of these extinguishments, we recorded a net loss of $8 million ($5 million net of tax), which is included in interest expense, net on our Consolidated Statement of Operations.
Financial PositionASSETS
2006 VERSUS 2005Trade accounts receivable increased $287 million, or 16 percent, to $2.1 billion at December 31, 2006. This increase was pri-marily the result of higher year-over-year December sales, a slight increase in our average days sales outstanding, and currency exchange rate changes.
Customer distribution rights and other noncurrent assets, net decreased $211 million, or 21 percent, to $781 million at December 31, 2006. This decrease was primarily the result of a reduction in our pension assets due to the adoption of SFAS No. 158, “Employers’ Accounting for Defi ned Benefi t Pension and Other Postretirement Plans — An Amendment of FASB Statements No. 87, 88, 106, and 132R” (“SFAS 158”). For additional information about the adoption of SFAS 158, refer to Note 9 of the Notes to Consolidated Financial Statements.
Franchise intangible assets, net decreased $2.4 billion, or 17 percent, to $11.5 billion at December 31, 2006. This decrease was primarily the result of a $2.9 billion non-cash impairment charge to reduce the carrying amount of our North American franchise license intangible assets to their estimated fair value. This decrease was offset partially by currency exchange rate changes.
2005 VERSUS 2004Trade accounts receivable decreased $82 million, or 4.5 per-cent, to $1.8 billion at December 31, 2005. This decrease was primarily the result of currency exchange rate changes and a decrease in our average days sales outstanding, offset partially by the termination of our sale of accounts receivable program in January 2005. At December 31, 2004, approximately $58 mil-lion of our accounts receivable were sold under this program.
Inventories increased $23 million, or 3.0 percent, to $786 million at December 31, 2005 from $763 million at December 31, 2004. This increase was primarily the result of higher cost of goods on hand, offset partially by lower levels of inventory and currency exchange rate changes.
LIABILITIES AND SHAREOWNERS’ EQUITY
2006 VERSUS 2005Accounts payable and accrued expenses increased $93 mil-lion to $2.7 billion at December 31, 2006. This increase was primarily the result of currency exchange rate changes, offset partially by a decrease in accrued taxes, which were higher as of December 31, 2005 due to the repatriation of non-U.S. earnings.
Our total debt decreased $87 million to $10.0 billion at December 31, 2006. This decrease was the result of cash repayments on debt exceeding debt issuances by approxi-mately $534 million, offset partially by a $377 million increase resulting from currency exchange rate changes, a $42 million increase from capital lease additions, and a $28 million increase from other debt related changes.
In 2006, currency exchange rate changes resulted in a net gain recognized in comprehensive income of $183 million. This amount consisted of a $211 million gain in currency translation adjustments offset by the impact of net investment hedges of $28 million.
2005 VERSUS 2004Accounts payable and accrued expenses decreased $69 million to $2.6 billion at December 31, 2005. This decrease was primarily the result of currency exchange rate changes, offset partially by an increase in our accrued taxes related to the repatriation.
Amounts payable to TCCC increased $89 million to $180 million at December 31, 2005 from $91 million at December 31, 2004. Our balance payable to TCCC was higher due to the timing of payments, including those related to CTM programs.
Our total debt decreased $1.0 billion to $10.1 billion at December 31, 2005 from $11.1 billion at December 31, 2004. This decrease was the result of cash repayments on debt exceeding new debt issuances by approximately $814 million and a $208 million decrease resulting from currency exchange rate changes.
In 2005, currency exchange rate changes resulted in a net loss recognized in comprehensive income of $249 million. This amount consisted of a $303 million loss in foreign cur-rency translation adjustments offset by the impact of net investment hedges of $54 million.

32 Coca-Cola Enterprises Inc. – 2006 Form 10-K
CONTRACTUAL OBLIGATIONS AND OTHER COMMERCIAL COMMITMENTS
The following table summarizes our signifi cant contractual obligations and commercial commitments as of December 31, 2006 (in millions):
Payments due by Period Contractual Obligations 2007 2008 2009 2010 2011 Thereafter Total
Debt, excluding capital leases (A) $ 777 $ 1,358 $ 2,476 $ 266 $ 298 $ 4,691 $ 9,866Capital leases (B) 27 21 20 19 19 50 156Operating leases (C) 127 113 103 97 84 256 780Purchase agreements (D) 827 – – – – – 827Customer contract arrangements (E) 141 76 56 40 26 26 365Other purchase obligations (F) 160 11 – – – – 171
Total contractual obligations $ 2,059 $ 1,579 $ 2,655 $ 422 $ 427 $ 5,023 $ 12,165
Amount of Commitment Expiration by PeriodOther Commercial Commitments 2007 2008 2009 2010 2011 Thereafter Total
Affi liate guarantees (G) $ 6 $ 9 $ 22 $ 16 $ 59 $ 121 $ 233Standby letters of credit (H) 293 4 – – – – 297
Total commercial commitments $ 299 $ 13 $ 22 $ 16 $ 59 $ 121 $ 530
(A) These amounts represent our debt maturities, as adjusted to refl ect the long-term classifi cation of certain of our borrowings due in the next 12 months, as a result of our intent and ability to refi nance these borrowings. These amounts exclude contractually required interest payments. For additional information about our debt, refer to Note 6 of the Notes to Consolidated Financial Statements.
(B) These amounts represent our minimum capital lease payments, net of interest payments totaling $31 million. For additional information about our capital leases, refer to Note 6 of the Notes to Consolidated Financial Statements.
(C) These amounts represent our minimum operating lease payments due under non-cancelable operating leases with initial or remaining lease terms in excess of one year as of December 31, 2006. For additional information about our operating leases, refer to Note 7 of the Notes to Consolidated Financial Statements.
(D) These amounts represent non-cancelable purchase agreements with various suppliers that are enforceable and legally binding and that specify a fi xed or minimum quantity that we must purchase. All purchases made under these agreements are subject to standard quality and performance criteria. We have excluded amounts related to agreements that require us to purchase a certain percentage of our future raw material needs from a specifi c supplier, since these agreements do not specify a fi xed or minimum quantity requirement.
(E) These amounts represent our obligation under customer contract arrangements for pouring or vending rights in specifi c athletic venues, school districts, or other locations. For additional information about these arrangements, refer to Note 1 of the Notes to Consolidated Financial Statements.
(F) These amounts represent outstanding purchase obligations primarily related to capital expenditures. We have not included amounts related to our requirement to purchase and place specifi ed numbers of venders/coolers or other cold drink equipment each year through 2010 under our Jumpstart Programs with TCCC. We are unable to estimate these amounts due to the varying costs for equipment placements.For additional information about our Jumpstart Programs, refer to Note 3 of the Notes to Consolidated Financial Statements.
(G) We guarantee debt and other obligations of certain third parties. In North America, we guarantee the repayment of debt owed by a PET (plastic) bottle manufacturing cooperative. We also guarantee the repayment of debt owed by a vending partnership in which we have a limited partnership interest. At December 31, 2006, the maximum amount of our guarantee was $257 million, of which $233 million was outstanding. For additional information about these affi liate guarantees, refer to Note 8 of the Notes to Consolidated Financial Statements.
(H) We had letters of credit outstanding totaling $297 million at December 31, 2006, primarily for self-insurance programs. For additional information about these letters of credit, refer to Note 8 of the Notes to Consolidated Financial Statements.
BENEFIT PLAN CONTRIBUTIONS
The following table summarizes the contributions made to our pension and other postretirement benefi t plans for the years ended December 31, 2006 and 2005, as well as our projected contributions for the year ending December 31, 2007 (in millions): Actual Projected 2006 2005 2007
Pension – U.S. $ 137 $ 204 $ 105Pension – Non-U.S. 77 70 81Other Postretirement 21 22 23
Total contributions $ 235 $ 296 $ 209
We fund our U.S. pension plans at a level to maintain, within established guidelines, the IRS-defi ned 90 percent current liability funded status. At January 1, 2006, the date of the most recent actuarial valuation, all U.S. funded defi ned benefi t pension plans refl ected current liability funded status equal to or greater than 90 percent. Our primary Canadian plan does not require contributions at this time. Contributions to our primary Great Britain plan are based on a percentage of employees’ pay.
For additional information about our pension and other postretirement benefi t plans, refer to Note 9 of the Notes to Consolidated Financial Statements.
OFF-BALANCE SHEET ARRANGEMENTS
We have identifi ed the manufacturing cooperatives and the purchasing cooperative in which we participate as variable interest entities (“VIEs”). Our variable interests in these coop-eratives include an equity investment in each of the entities and certain debt guarantees. Our maximum exposure as a result of our involvement in these entities is approximately $265 million, including our equity investments and debt guar-antees. The largest of these cooperatives, of which we have determined we are not the primary benefi ciary, represents greater than 95 percent of our maximum exposure. We have been purchasing PET (plastic) bottles from this cooperative since 1984 and our fi rst equity investment was made in 1988. For additional information about these entities, refer to Note 8 of the Notes to Consolidated Financial Statements.
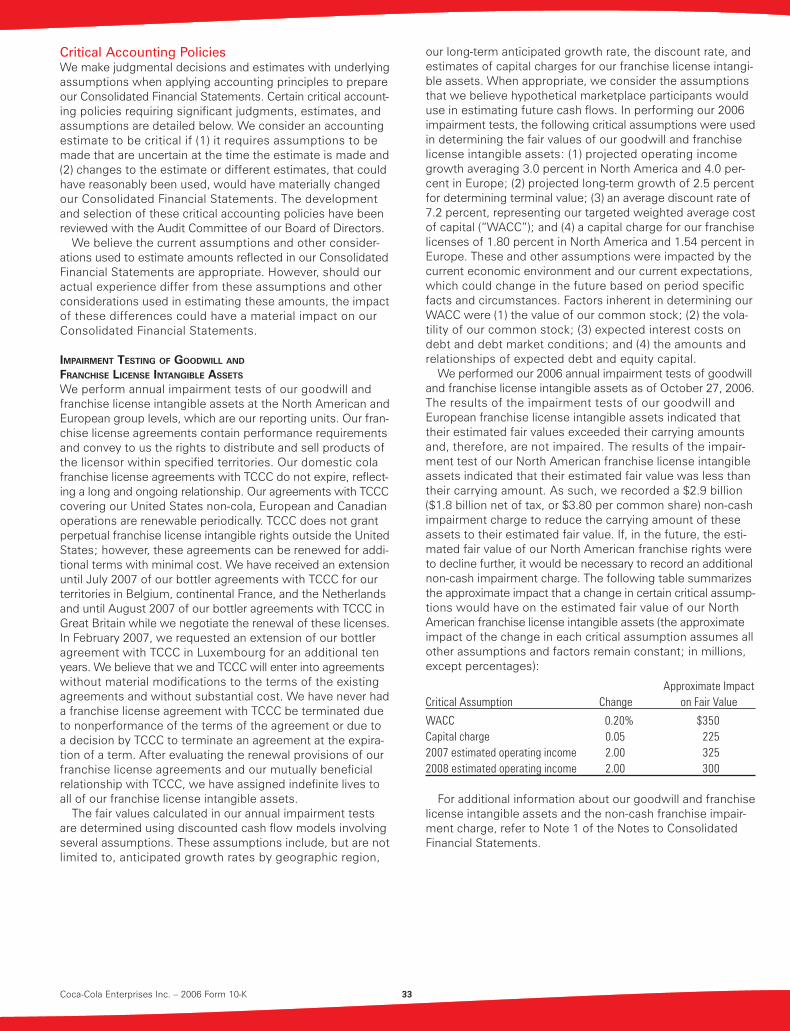
Coca-Cola Enterprises Inc. – 2006 Form 10-K 33
Critical Accounting PoliciesWe make judgmental decisions and estimates with underlying assumptions when applying accounting principles to prepare our Consolidated Financial Statements. Certain critical account-ing policies requiring signifi cant judgments, estimates, and assumptions are detailed below. We consider an accounting estimate to be critical if (1) it requires assumptions to be made that are uncertain at the time the estimate is made and (2) changes to the estimate or different estimates, that could have reasonably been used, would have materially changed our Consolidated Financial Statements. The development and selection of these critical accounting policies have been reviewed with the Audit Committee of our Board of Directors.
We believe the current assumptions and other consider-ations used to estimate amounts refl ected in our Consolidated Financial Statements are appropriate. However, should our actual experience differ from these assumptions and other considerations used in estimating these amounts, the impact of these differences could have a material impact on our Consolidated Financial Statements.
IMPAIRMENT TESTING OF GOODWILL AND
FRANCHISE LICENSE INTANGIBLE ASSETS
We perform annual impairment tests of our goodwill and franchise license intangible assets at the North American and European group levels, which are our reporting units. Our fran-chise license agreements contain performance requirements and convey to us the rights to distribute and sell products of the licensor within specifi ed territories. Our domestic cola franchise license agreements with TCCC do not expire, refl ect-ing a long and ongoing relationship. Our agreements with TCCC covering our United States non-cola, European and Canadian operations are renewable periodically. TCCC does not grant perpetual franchise license intangible rights outside the United States; however, these agreements can be renewed for addi-tional terms with minimal cost. We have received an extension until July 2007 of our bottler agreements with TCCC for our territories in Belgium, continental France, and the Netherlands and until August 2007 of our bottler agreements with TCCC in Great Britain while we negotiate the renewal of these licenses. In February 2007, we requested an extension of our bottler agreement with TCCC in Luxembourg for an additional ten years. We believe that we and TCCC will enter into agreements without material modifi cations to the terms of the existing agreements and without substantial cost. We have never had a franchise license agreement with TCCC be terminated due to nonperformance of the terms of the agreement or due to a decision by TCCC to terminate an agreement at the expira-tion of a term. After evaluating the renewal provisions of our franchise license agreements and our mutually benefi cial relationship with TCCC, we have assigned indefi nite lives to all of our franchise license intangible assets.
The fair values calculated in our annual impairment tests are determined using discounted cash fl ow models involving several assumptions. These assumptions include, but are not limited to, anticipated growth rates by geographic region,
our long-term anticipated growth rate, the discount rate, and estimates of capital charges for our franchise license intangi-ble assets. When appropriate, we consider the assumptions that we believe hypothetical marketplace participants would use in estimating future cash fl ows. In performing our 2006 impairment tests, the following critical assumptions were used in determining the fair values of our goodwill and franchise license intangible assets: (1) projected operating income growth averaging 3.0 percent in North America and 4.0 per-cent in Europe; (2) projected long-term growth of 2.5 percent for determining terminal value; (3) an average discount rate of 7.2 percent, representing our targeted weighted average cost of capital (“WACC”); and (4) a capital charge for our franchise licenses of 1.80 percent in North America and 1.54 percent in Europe. These and other assumptions were impacted by the current economic environment and our current expectations, which could change in the future based on period specifi c facts and circumstances. Factors inherent in determining our WACC were (1) the value of our common stock; (2) the vola-tility of our common stock; (3) expected interest costs on debt and debt market conditions; and (4) the amounts and relationships of expected debt and equity capital.
We performed our 2006 annual impairment tests of goodwill and franchise license intangible assets as of October 27, 2006. The results of the impairment tests of our goodwill and European franchise license intangible assets indicated that their estimated fair values exceeded their carrying amounts and, therefore, are not impaired. The results of the impair-ment test of our North American franchise license intangible assets indicated that their estimated fair value was less than their carrying amount. As such, we recorded a $2.9 billion ($1.8 billion net of tax, or $3.80 per common share) non-cash impairment charge to reduce the carrying amount of these assets to their estimated fair value. If, in the future, the esti-mated fair value of our North American franchise rights were to decline further, it would be necessary to record an additional non-cash impairment charge. The following table summarizes the approximate impact that a change in certain critical assump-tions would have on the estimated fair value of our North American franchise license intangible assets (the approximate impact of the change in each critical assumption assumes all other assumptions and factors remain constant; in millions, except percentages):
Approximate ImpactCritical Assumption Change on Fair Value
WACC 0.20% $350Capital charge 0.05 2252007 estimated operating income 2.00 3252008 estimated operating income 2.00 300
For additional information about our goodwill and franchise license intangible assets and the non-cash franchise impair-ment charge, refer to Note 1 of the Notes to Consolidated Financial Statements.

34 Coca-Cola Enterprises Inc. – 2006 Form 10-K
PENSION PLAN VALUATIONS
We sponsor a number of defi ned benefi t pension plans cov-ering substantially all of our employees in North America and Europe. Several critical assumptions are made in determining our pension plan liabilities and related pension expense. We believe the most critical of these assumptions are the discount rate and the expected long-term return on assets (“EROA”). Other assumptions we make are related to employee demo-graphic factors such as rate of compensation increases, mortality rates, retirement patterns and turnover rates.
We determine the discount rate primarily by reference to rates of high-quality, long-term corporate bonds that mature in a pattern similar to the expected payments to be made under the plans. Decreasing our discount rate (5.7 percent for the year ended December 31, 2006) by 0.5 percent would increase our 2007 pension expense by approximately $42 million.
The EROA is based on long-term expectations given current investment objectives and historical results. We utilize a com-bination of active and passive fund management of pension plan assets in order to maximize pension returns within established risk parameters. We periodically revise asset allocations, where appropriate, to improve returns and manage risk. Pension expense in 2007 would increase by approximately $13 million if the EROA were 0.5 percent lower (8.3 percent for the year ended December 31, 2006).
As a result of asset losses and the decline of discount rates in recent years, our unrecognized losses now exceed the defi ned corridor of losses. This causes our pension expense to be higher, since the excess losses must be amortized to expense until such time as, for example, increases in asset values and/or discount rates result in a reduction in unrecog-nized losses to a point where they do not exceed the defi ned corridor. Our 2006 pension expense was approximately $15 mil-lion higher than our 2005 pension expense and we expect our 2007 pension expense to be approximately $22 million lower than our 2006 expense as a result of the amortization of our excess losses. Unrecognized losses, net of gains, totaling $727 million and $990 million were deferred through December 31, 2006 and 2005, respectively.
For additional information about our pension plans, refer to Note 9 of the Notes to Consolidated Financial Statements.
TAX ACCOUNTING
We recognize valuation allowances when we believe that it is more likely than not that some or all of our deferred tax assets will not be realized. Deferred tax assets associated with U.S. federal and state and non-U.S. net operating loss and tax credit carryforwards totaled $231 million at December 31, 2006. We believe the majority of our deferred tax assets will be realized because of the reversal of certain signifi cant timing differences and anticipated future taxable income from operations. However, valuation allowances of approximately $78 million have been provided against a portion of our U.S. state and non-U.S. carry-forwards. For additional information about our income taxes and tax accounting, refer to Note 10 of the Notes to Consolidated Financial Statements.
COLD DRINK EQUIPMENT PLACEMENT FUNDING
We participate in programs with TCCC designed to promote the placement of cold drink equipment (“Jumpstart Programs”). We recognize the majority of support payments received from TCCC under the Jumpstart Programs as we place cold drink equipment. A small portion of the support payments are recog-nized on a straight-line basis over the 12-year period beginning after equipment is placed. Approximately $500 is recognized for each credit that is earned. Our principal requirement under these programs is the placement of equipment. If, for exam-ple, we are unable to earn 10,000 credits for placing units of equipment projected to be placed in a given year, we would reduce our recognition in income of deferred cash receipts from TCCC by $5 million in that year. Should we not satisfy certain provisions of the programs, the agreements provide for the parties to meet to work out a mutually agreeable solution. Should the parties be unable to agree on alternative solutions, TCCC would be able to seek a partial refund. No refunds of amounts previously earned have ever been paid under the programs and we believe the probability of a partial refund of amounts previously earned under the programs is remote. We believe we would in all cases resolve any matters that might arise regarding these programs that could potentially result in a refund of amounts previously earned. At December 31, 2006, $219 million in support payments were deferred under the Jumpstart Programs.
We believe the most critical assumptions related to the accounting for these programs are (1) the probability of our compliance with the placement and gross profi t requirements, as amended, and (2) the probability of TCCC asserting their refund rights. For additional information about our Jumpstart Programs, refer to Note 3 of the Notes to Consolidated Financial Statements.
MARKETING PROGRAMS AND
SALES INCENTIVES WITH CUSTOMERS
We participate in various programs and arrangements with customers designed to increase the sale of our products by these customers. Among the programs negotiated are arrange-ments under which allowances can be earned by customers for attaining agreed-upon sales levels or for participating in specifi c marketing programs. In the United States, we par-ticipate in CTM programs, which are typically developed by us but are administered by TCCC. We are responsible for all costs of these programs in our territories, except for some costs related to a limited number of specifi c customers. Under these programs, we pay TCCC and TCCC pays our customers as a representative for the North American bottling system. Coupon programs are also developed on a territory-specifi c basis with the intent of increasing sales by all customers. We believe our participation in these programs is essential to ensuring continued volume and revenue growth in the com-petitive marketplace. The costs of all these various programs, included as a reduction in net operating revenues, totaled approximately $2.2 billion in 2006 and 2005 and $1.9 billion in 2004, respectively. These amounts are net of customer marketing accrual reductions related to prior year programs of $54 million, $75 million, and $71 million in 2006, 2005, and 2004, respectively.
Coca-Cola Enterprises Inc. – 2006 Form 10-K 35
Under customer programs and arrangements that require sales incentives to be paid in advance, we amortize the amount paid over the period of benefi t or contractual sales volume. When incentives are paid in arrears, we accrue the estimated amount to be paid based upon expected customer performance and estimated sales volume. These estimates are determined using historical customer experience and other factors, which require signifi cant judgment. Actual amounts paid can differ from these estimates.
ContingenciesFor information about our contingencies, including outstand-ing legal cases, refer to Note 8 of the Notes to Consolidated Financial Statements.
WorkforceAt December 31, 2006, we had approximately 74,000 employees, including 10,200 in Europe. Approximately 18,800 of our employees in North America are covered by collective bargaining agreements in 164 different employee units and essentially all of our employees in Europe are covered by local agreements. These bargaining agreements expire at various dates over the next seven years, including 33 agreements in North America in 2007. We believe that we will be able to renegotiate subsequent agreements on satisfactory terms.
Recently Issued StandardsIn September 2006, the Financial Accounting Standards Board (“FASB”) issued SFAS No. 157, “Fair Value Measurements” (“SFAS 157”). SFAS 157 defi nes fair value, establishes a frame-work for measuring fair value in accordance with generally accepted accounting principles, and expands disclosures about fair value measurements. SFAS 157 is effective January 1, 2008. We are in the process of evaluating the impact that SFAS 157 will have on our Consolidated Financial Statements.
In June 2006, the FASB issued FASB Interpretation No. 48, “Accounting for Uncertainty in Income Taxes — an interpretation of FASB Statement No. 109” (“FIN 48”). FIN 48 clarifi es the accounting for uncertainty in income taxes by prescribing a recognition threshold and measurement attribute for the fi nancial statement recognition and measurement of a tax position taken or expected to be taken in a tax return. The interpretation also provides guidance on derecognition, clas-sifi cation, interest and penalties, accounting in interim periods, and disclosure. FIN 48 is effective January 1, 2007. We are in the process of evaluating the impact that FIN 48 will have on our Consolidated Financial Statements.
In February 2006, the FASB issued SFAS No. 155, “Accounting for Certain Hybrid Financial Instruments” (“SFAS 155”), which amends SFAS No. 133, “Accounting for Derivative Instruments and Hedging Activities” (“SFAS 133”) and SFAS No. 140, “Accounting for Transfers and Servicing of Financial Assets and Extinguishments of Liabilities” (“SFAS 140”). SFAS 155 simplifi es the accounting for certain derivatives embedded in other fi nancial instruments by allowing them to be accounted for as a whole if the holder elects to account for the whole instru-ment on a fair value basis. SFAS 155 also clarifi es and amends certain other provisions of SFAS 133 and SFAS 140. SFAS 155 is effective for all fi nancial instruments acquired, issued or subject to a remeasurement event occurring after January 1, 2007. We do not expect the adoption of SFAS 155 to have a
material impact on our Consolidated Financial Statements.
ITEM 7A. QUANTITATIVE AND QUALITATIVE DISCLOSURES ABOUT MARKET RISK
Current Trends and UncertaintiesINTEREST RATE, CURRENCY, AND COMMODITY
PRICE RISK MANAGEMENT
Interest Rates. Interest rate risk is present with both fi xed and fl oating-rate debt. We are exposed to interest rate risk in international currencies because of our intent to fi nance the purchase and cash fl ow requirements of our international subsidiaries with local borrowings. Interest rates in these markets typically differ from those in the United States. Interest rate swap agreements and other risk management instruments are used, at times, to manage our fi xed/fl oating debt profi le. At December 31, 2006, approximately 83 percent of our debt portfolio was comprised of fi xed-rate debt and 17 percent was fl oating-rate debt. We did not have any outstanding interest rate swap agreements as of December 31, 2006.
We estimate that a one percent change in the interest costs of fl oating-rate debt outstanding at December 31, 2006 would change interest expense on an annual basis by approximately $17 million. This amount is determined by calculating the effect of a hypothetical interest rate change on our fl oating-rate debt. This estimate does not include the effects of other possible occurrences such as actions to mitigate this risk or changes in our fi nancial structure.
Currency Exchange Rates. Our European operations represented approximately 28 percent of our consolidated net operating revenues during 2006 and approximately 30 percent of our consolidated long-lived assets at December 31, 2006. Our Canadian operations represented approximately 6 percent of our consolidated net operating revenues during 2006 and approximately 9 percent of our consolidated long-lived assets at December 31, 2006. We are exposed to translation risk because our operations in Canada and Europe are in local currency and must be translated into U.S. dollars. As currency exchange rates fl uctuate, translation of the income statements of international businesses into U.S. dollars affects the com-parability of revenues and expenses between years. We hedge a portion of our net investments in international subsidiaries with non-U.S. currency denominated debt at the parent com-pany level. Our revenues are denominated in each international subsidiary’s local currency; thus, we are not exposed to cur-rency transaction risk on our revenues. We are exposed to currency transaction risk on certain purchases of raw mate-rials and certain obligations of our international subsidiaries.
We currently use currency forward agreements and option contracts to hedge a certain portion of the aforementioned raw material purchases. These forward agreements and option contracts are scheduled to expire in 2007. For the years ended December 31, 2006, 2005, and 2004, the result of a hypotheti-cal 10 percent adverse movement in currency exchange rates applied to the hedging agreements and underlying exposures would not have had a material effect on our Consolidated Financial Statements.

36 Coca-Cola Enterprises Inc. – 2006 Form 10-K
Commodity Price Risk. The competitive marketplace in which we operate may limit our ability to recover increased costs through higher prices. As such, we are subject to market risk with respect to commodity price fl uctuations. We manage our exposure to this risk primarily through the use of supplier pricing agreements, which enable us to establish the purchase prices for certain commodities. We also, at times, use deriva-tive fi nancial instruments to manage our exposure to this risk.
AluminumDuring 2006, we had a supplier pricing agreement for a majority of our North American aluminum purchases that capped the price we paid for aluminum at 85 cents per pound. This pricing agreement and related price cap expired on December 31, 2006. We have implemented certain hedging strategies, including entering into fi xed pricing agreements, in order to mitigate some of our exposure to market price fl uctuations in 2007. The agreements entered into to date, though, are at rates higher than our expired price cap. Including the effect of the pricing agreements entered into to date, we estimate that a 10 percent increase in the market price per pound of aluminum over the current market price would increase our cost of sales during the twelve months ended December 31, 2007 by approximately $45 million (based on our 2006 volume levels).
PET (plastic)The cost of PET resin, which is a major cost component of our PET bottles, is variable and based on market prices. We currently do not have hedging instruments to mitigate our exposure to fl uctuations in the market price of resin and, therefore, are subject to market changes. We estimate that a 10 percent increase in the market price of resin over the cur-rent market price would increase our cost of sales during the twelve months ended December 31, 2007 by approximately $55 million (based on our 2006 volume levels).
High Fructose Corn Syrup (“HFCS”)We have entered into pricing agreements with our supplier of HFCS to mitigate our exposure to market price fl uctuations in 2007. Including the effect of these pricing agreements, a 10 percent increase in the market price of HFCS over the cur-rent market price would not have a material impact on our cost of sales during the twelve months ended December 31, 2007.
Vehicle FuelDuring 2006, we began using derivative instruments to hedge a portion of our vehicle fuel purchases in North America. The majority of these derivative instruments were designated as cash fl ow hedges related to the future purchases of vehicle fuel. Including the effect of these hedges, a 10 percent increase in the market price of fuel over the current market price would not have a material impact on our operating expenses during the twelve months ended December 31, 2007.

Coca-Cola Enterprises Inc. – 2006 Form 10-K 37
ITEM 8. FINANCIAL STATEMENTS AND SUPPLEMENTARY DATA
Audited Financial Statements
Report of Management MANAGEMENT’S RESPONSIBILITY FOR THE FINANCIAL STATEMENTS
Management is responsible for the preparation and fair presen-tation of the fi nancial statements included in this annual report. The fi nancial statements have been prepared in accordance with U.S. generally accepted accounting principles and refl ect management’s judgments and estimates concerning effects of events and transactions that are accounted for or disclosed.
INTERNAL CONTROL OVER FINANCIAL REPORTING
Management is also responsible for establishing and main-taining effective internal control over fi nancial reporting. The Company’s internal control over fi nancial reporting includes those policies and procedures that (1) pertain to the mainte-nance of records that, in reasonable detail, accurately and fairly refl ect the transactions and dispositions of the assets of the Company; (2) provide reasonable assurance that trans-actions are recorded as necessary to permit preparation of fi nancial statements in accordance with U.S. generally accepted accounting principles, and that receipts and expenditures of the Company are being made only in accordance with autho-rizations of management and directors of the Company; and (3) provide reasonable assurance regarding prevention or timely detection of unauthorized acquisition, use, or disposition of the Company’s assets that could have a material effect on the fi nancial statements. Management recognizes that there are inherent limitations in the effectiveness of any internal control over fi nancial reporting, including the possibility of human error and the circumvention or overriding of internal control. Accordingly, even effective internal control over fi nancial reporting can provide only reasonable assurance with respect to fi nancial statement preparation. Further, because of changes in conditions, the effectiveness of internal control over fi nan-cial reporting may vary over time.
In order to ensure that the Company’s internal control over fi nancial reporting is effective, management regularly assesses such controls and did so most recently as of December 31, 2006. This assessment was based on criteria for effective internal control over fi nancial reporting described in Internal Control — Integrated Framework issued by the Committee of Sponsoring Organizations of the Treadway Commission. Based on this assessment, management believes the Company maintained effective internal control over fi nancial reporting as of December 31, 2006. Ernst & Young LLP, the Company’s independent registered public accounting fi rm, has issued an attestation report on management’s assessment of the Company’s internal control over fi nancial reporting as of December 31, 2006.
AUDIT COMMITTEE’S RESPONSIBILITY
The Board of Directors, acting through its Audit Committee, is responsible for the oversight of the Company’s accounting policies, fi nancial reporting, and internal control. The Audit Committee of the Board of Directors is comprised entirely of outside directors who are independent of management. The Audit Committee is responsible for the appointment and compensation of our independent registered public account-ing fi rm and approves decisions regarding the appointment or removal of our Vice President of Internal Audit. It meets periodically with management, the independent registered public accounting fi rm, and the internal auditors to ensure that they are carrying out their responsibilities. The Audit Committee is also responsible for performing an oversight role by reviewing and monitoring the fi nancial, accounting, and auditing procedures of the Company in addition to reviewing the Company’s fi nancial reports. Our independent registered public accounting fi rm and our internal auditors have full and unlimited access to the Audit Committee, with or without man-agement, to discuss the adequacy of internal control over fi nancial reporting, and any other matters which they believe should be brought to the attention of the Audit Committee.
WILLIAM W. DOUGLAS III
Senior Vice President and
Chief Financial Offi cer
JOHN F. BROCK
President and Chief Executive Offi cer
Atlanta, GeorgiaFebruary 13, 2007
CHARLES D. LISCHER
Vice President, Controller, and
Chief Accounting Offi cer

Report of Independent Registered Public Accounting Firm on Financial Statements
The Board of Directors and Shareowners of Coca-Cola Enterprises Inc.
We have audited the accompanying consolidated balance sheets of Coca-Cola Enterprises Inc. as of December 31, 2006 and 2005, and the related consolidated statements of opera-tions, shareowners’ equity, and cash fl ows for each of the three years in the period ended December 31, 2006. Our audits also included the fi nancial statement schedule listed in the Index at Item 15(a). These fi nancial statements and schedule are the responsibility of the Company’s management. Our responsibility is to express an opinion on these fi nancial state-ments and schedule based on our audits.
We conducted our audits in accordance with the standards of the Public Company Accounting Oversight Board (United States). Those standards require that we plan and perform the audit to obtain reasonable assurance about whether the fi nancial statements are free of material misstatement. An audit includes examining, on a test basis, evidence supporting the amounts and disclosures in the fi nancial statements. An audit also includes assessing the accounting principles used and signifi cant estimates made by management, as well as evalu-ating the overall fi nancial statement presentation. We believe that our audits provide a reasonable basis for our opinion.
In our opinion, the consolidated fi nancial statements referred to above present fairly, in all material respects, the consolidated fi nancial position of Coca-Cola Enterprises Inc. at December 31, 2006 and 2005, and the consolidated results of its operations and its cash fl ows for each of the three years in the period ended December 31, 2006, in conformity with U.S. generally accepted accounting principles. Also, in our opinion, the related fi nancial statement schedule, when considered in relation to the basic fi nancial statements taken as a whole, presents fairly in all material respects the information set forth therein.
As discussed in Notes 2, 9, 11, and 13 in 2006 the Company adopted Statement of Financial Accounting Standards (“SFAS”) No. 123 (revised), “Share-Based Payment” and the recogni-tion provisions of SFAS No. 158, “Employers’ Accounting for Defi ned Benefi t Pension and Other Postretirement Plans.”
We also have audited, in accordance with the standards of the Public Company Accounting Oversight Board (United States), the effectiveness of Coca-Cola Enterprises Inc.’s internal control over fi nancial reporting as of December 31, 2006, based on criteria established in Internal Control — Integrated Framework issued by the Committee of Sponsoring Organizations of the Treadway Commission and our report dated February 13, 2007 expressed an unqualifi ed opinion thereon.
Atlanta, GeorgiaFebruary 13, 2007
38 Coca-Cola Enterprises Inc. – 2006 Form 10-K

Report of Independent Registered Public Accounting Firm on Internal Control Over Financial Reporting
The Board of Directors and Shareowners of Coca-Cola Enterprises Inc.
We have audited management’s assessment, included in the Internal Control Over Financial Reporting section of the accompanying Report of Management, that Coca-Cola Enterprises Inc. maintained effective internal control over fi nancial reporting as of December 31, 2006, based on criteria established in Internal Control — Integrated Framework issued by the Committee of Sponsoring Organizations of the Treadway Commission (the COSO criteria). Coca-Cola Enterprises Inc.’s management is responsible for maintain-ing effective internal control over fi nancial reporting and for its assessment of the effectiveness of internal control over fi nancial reporting. Our responsibility is to express an opinion on management’s assessment and an opinion on the effec-tiveness of the Company’s internal control over fi nancial reporting based on our audit.
We conducted our audit in accordance with the standards of the Public Company Accounting Oversight Board (United States). Those standards require that we plan and perform the audit to obtain reasonable assurance about whether effective internal control over fi nancial reporting was maintained in all material respects. Our audit included obtaining an understand-ing of internal control over fi nancial reporting, evaluating man-agement’s assessment, testing and evaluating the design and operating effectiveness of internal control, and performing such other procedures as we considered necessary in the circumstances. We believe that our audit provides a reason-able basis for our opinion.
A company’s internal control over fi nancial reporting is a process designed to provide reasonable assurance regard-ing the reliability of fi nancial reporting and the preparation of fi nancial statements for external purposes in accordance with generally accepted accounting principles. A company’s internal control over fi nancial reporting includes those policies and procedures that (1) pertain to the maintenance of records that, in reasonable detail, accurately and fairly refl ect the
transactions and dispositions of the assets of the company; (2) provide reasonable assurance that transactions are recorded as necessary to permit preparation of fi nancial statements in accordance with generally accepted accounting principles, and that receipts and expenditures of the company are being made only in accordance with authorizations of management and directors of the company; and (3) provide reasonable assur-ance regarding prevention or timely detection of unauthorized acquisition, use, or disposition of the company’s assets that could have a material effect on the fi nancial statements.
Because of its inherent limitations, internal control over fi nancial reporting may not prevent or detect misstatements. Also, projections of any evaluation of effectiveness to future periods are subject to the risk that controls may become inad-equate because of changes in conditions, or that the degree of compliance with the policies or procedures may deteriorate.
In our opinion, management’s assessment that Coca-Cola Enterprises Inc. maintained effective internal control over fi nancial reporting as of December 31, 2006, is fairly stated, in all material respects, based on the COSO criteria. Also, in our opinion, Coca-Cola Enterprises Inc. maintained, in all mate-rial respects, effective internal control over fi nancial reporting as of December 31, 2006, based on the COSO criteria.
We also have audited, in accordance with the standards of the Public Company Accounting Oversight Board (United States), the consolidated balance sheets of Coca-Cola Enterprises Inc. as of December 31, 2006 and 2005, and the related consoli-dated statements of operations, shareowners’ equity, and cash fl ows for each of the three years in the period ended December 31, 2006 and our report dated February 13, 2007 expressed an unqualifi ed opinion thereon.
Atlanta, GeorgiaFebruary 13, 2007
Coca-Cola Enterprises Inc. – 2006 Form 10-K 39

40 Coca-Cola Enterprises Inc. – 2006 Form 10-K
Coca-Cola Enterprises Inc. Consolidated Statements of Operations
Year ended December 31, (in millions, except per share data) 2006 2005 2004Net operating revenues $ 19,804 $ 18,743 $ 18,190Cost of sales 11,986 11,185 10,771Gross profi t 7,818 7,558 7,419Selling, delivery, and administrative expenses 6,391 6,127 5,983Franchise impairment charge 2,922 – –Operating (loss) income (1,495) 1,431 1,436Interest expense, net 633 633 619Other nonoperating income (expense), net 10 (8) 1(Loss) income before income taxes (2,118) 790 818Income tax (benefi t) expense (975) 276 222Net (loss) income $ (1,143) $ 514 $ 596Basic net (loss) income per share $ (2.41) $ 1.09 $ 1.28Diluted net (loss) income per share $ (2.41) $ 1.08 $ 1.26Dividends declared per share $ 0.18 $ 0.22 $ 0.16Basic weighted average common shares outstanding 475 471 465Diluted weighted average common shares outstanding 475 476 473Income (expense) from transactions with The Coca-Cola Company – Note 3: Net operating revenues $ 614 $ 574 $ 547 Cost of sales (5,124) (4,877) (4,906) Selling, delivery, and administrative expenses 16 41 (5)
The accompanying Notes to Consolidated Financial Statements are an integral part of these statements.

Coca-Cola Enterprises Inc. – 2006 Form 10-K 41
Coca-Cola Enterprises Inc. Consolidated Balance Sheets
December 31, (in millions, except share data) 2006 2005ASSETS
Current:Cash and cash equivalents $ 184 $ 107Trade accounts receivable, less allowances of $50 and $40, respectively 2,089 1,802Inventories 792 786Current deferred income tax assets 230 313Prepaid expenses and other current assets 396 387 Total current assets 3,691 3,395Property, plant, and equipment, net 6,698 6,560Goodwill 603 578Franchise license intangible assets, net 11,452 13,832Customer distribution rights and other noncurrent assets, net 781 992 Total assets $ 23,225 $ 25,357
LIABILITIES AND SHAREOWNERS’ EQUITY
Current:Accounts payable and accrued expenses $ 2,732 $ 2,639Amounts payable to The Coca-Cola Company, net 218 180Deferred cash receipts from The Coca-Cola Company 64 83Current portion of debt 804 944 Total current liabilities 3,818 3,846Debt, less current portion 9,218 9,165Retirement and insurance programs and other long-term obligations 1,423 1,300Deferred cash receipts from The Coca-Cola Company, less current 169 255Long-term deferred income tax liabilities 4,057 5,106Amounts payable to The Coca-Cola Company, net 14 42
Shareowners’ Equity:Common stock, $1 par value – Authorized – 1,000,000,000 shares; Issued – 487,564,031 and 481,827,242 shares, respectively 488 482Additional paid-in capital 3,068 2,943Reinvested earnings 940 2,170Accumulated other comprehensive income 143 162Common stock in treasury, at cost – 7,873,661 and 8,031,660 shares, respectively (113) (114) Total shareowners’ equity 4,526 5,643Total liabilities and shareowners’ equity $ 23,225 $ 25,357
The accompanying Notes to Consolidated Financial Statements are an integral part of these statements.

42 Coca-Cola Enterprises Inc. – 2006 Form 10-K
Coca-Cola Enterprises Inc. Consolidated Statements of Cash Flows
Year ended December 31, (in millions) 2006 2005 2004Cash Flows from Operating Activities:Net (loss) income $ (1,143) $ 514 $ 596Adjustments to reconcile net (loss) income to net cash derived from operating activities: Depreciation and amortization 1,012 1,044 1,068 Franchise impairment charge 2,922 – – Net change in customer distribution rights 35 29 18 Share-based compensation expense 63 30 23 Deferred funding income from The Coca-Cola Company (105) (47) (50) Deferred income tax (benefi t) expense (1,073) 78 124 Pension expense less than retirement plan contributions (10) (87) (113)Changes in assets and liabilities, net of acquisition amounts: Trade accounts and other receivables (173) (30) (21) Inventories 46 (48) (2) Prepaid expenses and other assets 24 (26) 29 Accounts payable and accrued expenses (19) 264 57 Other changes, net 11 (102) (111)Net cash derived from operating activities 1,590 1,619 1,618
Cash Flows from Investing Activities: Capital asset investments (882) (902) (949) Capital asset disposals, $9 million from The Coca-Cola Company in 2005 50 48 24 Acquisition of bottling operations, net of cash acquired (106) – – Other investing activities (14) – – Net cash used in investing activities (952) (854) (925)
Cash Flows from Financing Activities: Increase (decrease) in commercial paper, net 387 (599) 172 Issuances of debt 696 1,541 386 Payments on debt (1,617) (1,756) (1,295) Dividend payments on common stock (114) (76) (76) Exercise of employee share options 73 40 181 Interest rate swap settlements and other fi nancing activities 4 46 –Net cash used in fi nancing activities (571) (804) (632)Net effect of currency exchange rate changes on cash and cash equivalents 10 (9) 14Net Change in Cash and Cash Equivalents 77 (48) 75Cash and Cash Equivalents at Beginning of Year 107 155 80
Cash and Cash Equivalents at End of Year $ 184 $ 107 $ 155
Supplemental Noncash Investing and Financing Activities: Acquisition of bottling operations: Fair value of assets acquired $ 162 $ – $ – Fair value of liabilities assumed (56) – – Cash paid, net of cash acquired $ 106 $ – $ – Capital lease additions $ 42 $ 36 $ 53 Interest paid, net of amounts capitalized 607 630 583 Income taxes paid, net 187 137 108
The accompanying Notes to Consolidated Financial Statements are an integral part of these statements.
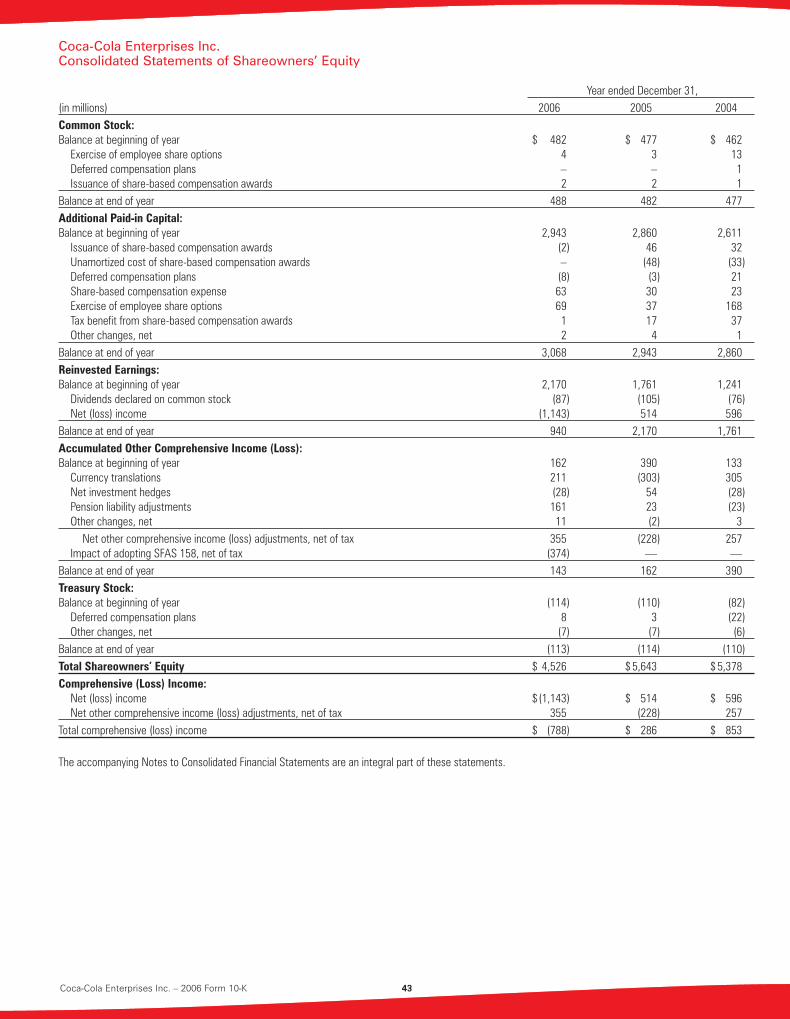
Coca-Cola Enterprises Inc. – 2006 Form 10-K 43
Coca-Cola Enterprises Inc. Consolidated Statements of Shareowners’ Equity
Year ended December 31, (in millions) 2006 2005 2004Common Stock: Balance at beginning of year $ 482 $ 477 $ 462 Exercise of employee share options 4 3 13 Deferred compensation plans – – 1 Issuance of share-based compensation awards 2 2 1Balance at end of year 488 482 477Additional Paid-in Capital:Balance at beginning of year 2,943 2,860 2,611 Issuance of share-based compensation awards (2) 46 32 Unamortized cost of share-based compensation awards – (48) (33) Deferred compensation plans (8) (3) 21 Share-based compensation expense 63 30 23 Exercise of employee share options 69 37 168 Tax benefi t from share-based compensation awards 1 17 37 Other changes, net 2 4 1Balance at end of year 3,068 2,943 2,860Reinvested Earnings:Balance at beginning of year 2,170 1,761 1,241 Dividends declared on common stock (87) (105) (76) Net (loss) income (1,143) 514 596Balance at end of year 940 2,170 1,761Accumulated Other Comprehensive Income (Loss):Balance at beginning of year 162 390 133 Currency translations 211 (303) 305 Net investment hedges (28) 54 (28) Pension liability adjustments 161 23 (23) Other changes, net 11 (2) 3 Net other comprehensive income (loss) adjustments, net of tax 355 (228) 257 Impact of adopting SFAS 158, net of tax (374) — —Balance at end of year 143 162 390Treasury Stock:Balance at beginning of year (114) (110) (82) Deferred compensation plans 8 3 (22) Other changes, net (7) (7) (6)Balance at end of year (113) (114) (110)Total Shareowners’ Equity $ 4,526 $ 5,643 $ 5,378Comprehensive (Loss) Income: Net (loss) income $ (1,143) $ 514 $ 596 Net other comprehensive income (loss) adjustments, net of tax 355 (228) 257Total comprehensive (loss) income $ (788) $ 286 $ 853
The accompanying Notes to Consolidated Financial Statements are an integral part of these statements.

44 Coca-Cola Enterprises Inc. – 2006 Form 10-K
Coca-Cola Enterprises Inc.
Notes to Consolidated Financial Statements
NOTE 1 SIGNIFICANT ACCOUNTING POLICIES
BusinessCoca-Cola Enterprises Inc. (“CCE,” “we,” “our,” or “us”) is the world’s largest marketer, producer, and distributor of bottle and can nonalcoholic beverages. We market, produce, and distrib-ute our bottle and can products to customers and consumers through license territories in 46 states in the United States, the District of Columbia, the United States Virgin Islands, and the 10 provinces of Canada (collectively referred to as “North America”). We are also the sole licensed bottler for products of The Coca-Cola Company (“TCCC”) in Belgium, continental France, Great Britain, Luxembourg, Monaco, and the Nether-lands (collectively referred to as “Europe”).
We operate in the highly competitive beverage industry and face strong competition from other general and specialty bev-erage companies. We, along with other beverage companies, are affected by a number of factors including, but not limited to, cost to manufacture and distribute products, economic conditions, consumer preferences, local and national laws and regulations, fuel prices, and weather patterns.
Basis of Presentation and ConsolidationOur Consolidated Financial Statements include all entities that we control by ownership of a majority voting interest as well as variable interest entities for which we are the primary bene-fi ciary. All signifi cant intercompany accounts and transactions are eliminated in consolidation. Our fi scal year ends on December 31. For interim quarterly reporting convenience, we report on the Friday closest to the end of the quarterly calendar period. There were the same number of selling days in 2006 and 2005 and there were two fewer selling days in 2005 versus 2004.
Use of EstimatesOur Consolidated Financial Statements and accompanying Notes are prepared in accordance with U.S. generally accepted accounting principles and include estimates and assumptions made by management that affect reported amounts. Actual results could differ materially from those estimates.
ReclassificationsWe have reclassifi ed certain amounts in our prior years’ Consolidated Financial Statements to conform to our current presentation.
Revenue RecognitionWe recognize net operating revenues from the sale of our products when we deliver the products to our customers and, in the case of full service vending, when we collect cash from vending machines. We earn service revenues for equipment maintenance and production when services are completed.
Shipping and Handling Costs Shipping and handling costs related to the movement of fi nished goods from manufacturing locations to our sales distribution centers are included in cost of sales on our Consolidated Statements of Operations. Shipping and han-dling costs incurred to move fi nished goods from our sales distribution centers to customer locations are included in selling, delivery, and administrative (“SD&A”) expenses on our Consolidated Statements of Operations and totaled approxi-mately $1.6 billion in 2006, 2005, and 2004. Our customers do not pay us separately for shipping and handling costs.
Cash and Cash EquivalentsCash and cash equivalents include all highly liquid investments with maturity dates of less than three months when purchased. The fair value of our cash and cash equivalents approximate the amounts shown in our Consolidated Balance Sheets due to their short-term nature.
Credit Risk and Trade Accounts Receivable AllowanceWe sell our products to retailers, wholesalers, and other cus-tomers and extend credit, generally without requiring collateral, based on our evaluation of the customer’s fi nancial condition. While we have a concentration of credit risk in the retail sector, this risk is mitigated due to our large number of geographically dispersed customers. Potential losses on receivables are dependent on each individual customer’s fi nancial condition and sales adjustments granted after the balance sheet date. We carry our trade accounts receivable at net realizable value. Typically, our accounts receivable are collected in fewer than 40 days and do not bear interest. We monitor our exposure to losses on receivables and maintain allowances for potential losses or adjustments. We determine these allowances by (1) evaluating the aging of our receivables; (2) analyzing our history of sales adjustments; and (3) reviewing our high-risk customers. Past due receivable balances are written-off when our internal collection efforts have been unsuccessful in col-lecting the amount due.
InventoriesWe value our inventories at the lower of cost or market. Cost is determined using the fi rst-in, fi rst-out (“FIFO”) method. The following table summarizes our inventories as of December 31, 2006 and 2005 (in millions):
2006 2005Finished goods $495 $483Raw materials and supplies 297 303Total inventories $792 $786

Coca-Cola Enterprises Inc. – 2006 Form 10-K 45
Property, Plant, and EquipmentProperty, plant, and equipment are recorded at cost. Major property additions, replacements, and betterments are capi-talized, while maintenance and repairs that do not extend the useful life of an asset are expensed as incurred. Depreciation is recorded using the straight-line method over the respective estimated useful lives of our assets. Our cold drink equipment and containers, such as reusable crates, shells, and bottles, are depreciated using the straight-line method over the esti-mated useful life of each group of equipment, as determined using the group-life method. Under this method, we do not recognize gains or losses on the disposal of individual units of equipment when the disposal occurs in the normal course of business. We capitalize the costs of refurbishing our cold drink equipment and depreciate those costs over the estimated period until the next scheduled refurbishment or until the equip-ment is retired. Leasehold improvements are amortized using the straight-line method over the shorter of the remaining lease term or the estimated useful life of the improvement. The major-ity of our depreciation and amortization expense is recorded in SD&A expenses; however, a portion is recorded as cost of sales. For tax purposes, we use other depreciation methods (gener-ally, accelerated depreciation methods), where appropriate.
Our interests in assets acquired under capital leases are included in property, plant, and equipment and primarily relate to fl eet assets and certain buildings. Amounts due under capital leases are recorded as liabilities and are included in our total debt (refer to Note 6).
We assess the recoverability of the carrying amount of our property, plant, and equipment when events or changes in circumstances indicate that the carrying amount of an asset or asset group may not be recoverable. If we determine that the carrying amount of an asset or asset group is not recov-erable based upon the expected undiscounted future cash fl ows of the asset or asset group, we record an impairment loss equal to the excess of the carrying amount over the esti-mated fair value of the asset or asset group.
We capitalize certain development costs associated with internal use software, including external direct costs of mate-rials and services and payroll costs for employees devoting time to a software project. Costs incurred during the preliminary project stage, as well as costs for maintenance and training, are expensed as incurred. During 2006 and 2005, we capitalized $23 million and $35 million, respectively, related to our multi-year effort to redesign our business processes and implement the SAP software platform.
The following table summarizes our property, plant, and equipment as of December 31, 2006 and 2005 (in millions):
2006 2005 Useful LifeLand $ 492 $ 470 n/aBuilding and improvements 2,425 2,209 20 to 40 yearsCold drink equipment 5,676 5,388 5 to 13 yearsFleet 1,685 1,610 5 to 20 yearsMachinery, equipment, and containers 3,500 3,300 3 to 20 yearsFurniture and offi ce equipment 1,112 1,066 3 to 10 yearsProperty, plant, and equipment 14,890 14,043Less: accumulated depreciation and amortization 8,465 7,756 6,425 6,287Construction in process 273 273Property, plant, and equipment, net $ 6,698 $ 6,560
Goodwill and Franchise License Intangible AssetsWe do not amortize our goodwill and franchise license intan-gible assets. Instead, we test these assets for impairment annually (as of the last fi scal day of October), or more frequently if events or changes in circumstances indicate they may be impaired. We perform our impairment tests of goodwill and franchise license intangible assets at the North American and European group levels, which are our reporting units.
The impairment test for our goodwill involves comparing the fair value of a reporting unit to its carrying amount, including goodwill. If the carrying amount of the reporting unit exceeds its fair value, a second step is required to measure the good-will impairment loss. This step compares the implied fair value of the reporting unit’s goodwill to the carrying amount of that goodwill. If the carrying amount of the reporting unit’s goodwill exceeds the implied fair value of the goodwill, an impairment loss is recognized in an amount equal to the excess. The impair-ment test for our franchise license intangible assets involves comparing the estimated fair value of franchise license intangi-ble assets for a reporting unit, as determined using discounted future cash fl ows, to its carrying amount to determine if a write-down to fair value is required. The fair values calculated in our annual impairment tests are determined using dis-counted cash fl ow models involving several assumptions. These assumptions include, but are not limited to, anticipated growth rates by geographic region, our long-term anticipated growth rate, the discount rate, and estimates of capital charges for our franchise license intangible assets. When appropriate, we consider the assumptions that we believe hypothetical market-place participants would use in estimating future cash fl ows.
We performed our 2006 annual impairment tests of good-will and franchise license intangible assets as of October 27, 2006. The results of the impairment tests of our goodwill and European franchise license intangible assets indicated that their estimated fair values exceeded their carrying amounts and, therefore, are not impaired. The results of the impairment test of our North American franchise license intangible assets indi-cated that their estimated fair value was less than their carrying amount. As such, we recorded a $2.9 billion ($1.8 billion net of tax, or $3.80 per common share) non-cash impairment charge to reduce the carrying amount of these assets to their esti-mated fair value. If, in the future, the estimated fair value of our North American franchise rights were to decline further, it would be necessary to record an additional non-cash impair-ment charge. The decline in the estimated fair value of our North American franchise intangible assets refl ects the negative impact of several contributing factors, which resulted in a reduc-tion in the forecasted cash fl ows and growth rates used to estimate fair value. These factors include, but are not limited to, (1) an extraordinary increase in raw material costs expected in 2007, driven by signifi cant increases in the cost of aluminum and HFCS; (2) a challenging marketplace environment includ-ing continued weakness in the CSD category and increased pricing pressures in several high-growth categories, such as water; and (3) increased interest rates contributing to a higher discount rate and capital charge. Furthermore, the business and marketplace environments in which we currently operate differ signifi cantly from the historical environments that drove the business cases used to value and record the acquisition of certain of our North American franchise rights. Accordingly, for certain acquisitions we have been unable to attain the forecasted growth projections that were used to value the franchise rights at the time they were acquired.

46 Coca-Cola Enterprises Inc. – 2006 Form 10-K
The following table summarizes the change in our franchise license intangible assets for the year ended December 31, 2006 (in millions):
North America Europe ConsolidatedBalance at December 31, 2005 $10,367 $3,465 $13,832 Acquisition 81 – 81 Impairment charge (2,922) – (2,922) Other adjustments (A) 5 456 461Balance at December 31, 2006 $ 7,531 $3,921 $11,452
(A) These other adjustments primarily relate to non-U.S. currency translation adjustments.
Our franchise license agreements contain performance requirements and convey to us the rights to distribute and sell products of the licensor within specifi ed territories. Our domes-tic cola franchise license agreements with TCCC do not expire, refl ecting a long and ongoing relationship. Our agreements with TCCC covering our U.S. non-cola, European, and Canadian operations are periodically renewable. TCCC does not grant perpetual franchise license intangible rights outside the U.S.; however, these agreements can be renewed for additional terms with minimal cost. We believe and expect that these and other renewable licensor agreements will be renewed at each expiration date and, therefore, are essentially perpetual. We have received an extension until July 2007 of our bottler agreements with TCCC for our territories in Belgium, continental France, and the Netherlands and until August 2007 of our bot-tler agreements with TCCC in Great Britain while we negotiate the renewal of these licenses. In February 2007, we requested an extension of our bottler agreement with TCCC in Luxembourg for an additional ten years. We believe that we and TCCC will enter into agreements without material modifi cations to the terms of the existing agreements and without substantial cost. We have never had a franchise license agreement with TCCC be terminated due to nonperformance of the terms of the agree-ment or due to a decision by TCCC to terminate an agreement at the expiration of a term. After evaluating the renewal pro-visions of our franchise license agreements and our mutually benefi cial relationship with TCCC, we have assigned indefi nite lives to all of our franchise license intangible assets.
Investments in Marketable Equity SecuritiesWe record our investments in marketable equity securities at fair value. Changes in the fair value of securities classifi ed as available for sale are recorded in accumulated other compre-hensive income on our Consolidated Balance Sheets, unless we determine that an unrealized loss is other than temporary. If we determine that an unrealized loss is other than tempo-rary, we recognize the loss in earnings (refer to Note 13).
Rabbi TrustWe maintain a self-directed non-qualifi ed deferred compensa-tion plan structured as a rabbi trust for certain executives and other highly compensated employees. Under the plan, partici-pants may elect to defer receipt of a portion of their annual compensation. Amounts deferred under the plan are invested at the direction of the employee into various mutual funds and
stocks, including our common stock. The investment assets of the trust, which exclude shares of our common stock, are included in our Consolidated Balance Sheets. The amount of compensation deferred under the plan is credited to each participant’s deferral account and a deferred compensation liability is recorded in our Consolidated Balance Sheets. This liability equals the recorded asset and represents our obliga-tion to distribute the funds to the participants. The investment assets of the trust are classifi ed as trading securities and, accordingly, changes in their fair values are recorded in our Consolidated Statements of Operations.
Risk Management ProgramsIn general, we are self-insured for the costs of workers’ com-pensation, casualty, and health and welfare claims. We use commercial insurance for casualty and workers’ compensa-tion claims to reduce the risk of catastrophic losses. Workers’ compensation and casualty losses are estimated through actuarial procedures of the insurance industry and by using industry assumptions, adjusted for our specifi c expectations based on our claim history. Our workers’ compensation liability is discounted using estimated weighted average risk-free interest rates that correspond with expected payment dates.
Income TaxesWe recognize deferred tax assets and liabilities for the expected future tax consequences of temporary differences between the fi nancial statement carrying amounts and the tax bases of our assets and liabilities. We establish valuation allowances if we believe that it is more likely than not that some or all of our deferred tax assets will not be realized (refer to Note 10).
Non-U.S. Currency TranslationAssets and liabilities of our international operations are translated from local currencies into U.S. dollars at currency exchange rates in effect at the end of a fi scal period. Gains and losses from the translation of non-U.S. entities are included in accumulated other comprehensive income on our Consolidated Balance Sheets. Revenues and expenses are translated at average monthly currency exchange rates. Transaction gains and losses arising from currency exchange rate fl uctuations on transactions denominated in a currency other than the local functional currency are included in other nonoperating income (expense), net on our Consolidated Statements of Operations.
Fair Values of Financial Instruments and DerivativesThe fair values of our cash and cash equivalents, accounts receivable, and accounts payable approximate their carrying amounts due to their short-term nature. The fair values of our debt instruments are calculated based on debt with similar maturities and credit quality and current market interest rates (refer to Note 6). The estimated fair values of our derivative instruments are calculated based on market rates. These values represent the estimated amounts we would receive or pay to terminate agreements, taking into consideration current mar-ket rates. Market conditions and counterparty creditworthiness can also factor into the values received or paid should there be an actual unwinding of any of these agreements (refer to Note 5).

Coca-Cola Enterprises Inc. – 2006 Form 10-K 47
Derivative Financial InstrumentsWe, at times, use interest rate swap agreements and other fi nancial instruments to manage the fl uctuation of interest rates on our debt portfolio. We also use currency swap agreements, forward agreements, options, and other fi nancial instruments to minimize the impact of currency exchange rate changes on our nonfunctional currency cash fl ows and to protect the value of our net investments in non-U.S. operations. All derivative fi nancial instruments are recorded at fair value on our Consoli-dated Balance Sheets. We do not use derivative fi nancial instruments for trading or speculative purposes.
Interest rate swap agreements designated as fair value hedges are used, at times, to mitigate our exposure to changes in the fair value of fi xed-rate debt resulting from fl uctuations in interest rates. Effective changes in the fair value of these hedges are recognized as adjustments to the carrying values of the related hedged liabilities. Any changes in the fair value of these hedges that are the result of ineffectiveness are recognized immediately in interest expense, net on our Consolidated Statements of Operations.
Cash fl ow hedges are used to mitigate our exposure to changes in cash fl ows attributable to currency and commodity price fl uctuations associated with certain forecasted transac-tions, including our raw material purchases and vehicle fuel purchases. Effective changes in the fair value of these cash fl ow hedging instruments are recognized in accumulated other comprehensive income on our Consolidated Balance Sheets. The effective changes are then recognized in the period that the forecasted purchases or payments are made in the expense line item on our Consolidated Statements of Operations that is consistent with the nature of the underlying hedged item. Any changes in the fair value of these cash fl ow hedges that are the result of ineffectiveness are recognized immediately in the expense line item on our Consolidated Statements of Operations that is consistent with the nature of the underlying hedged item.
We enter into certain non-U.S. currency denominated borrow-ings as net investment hedges of our international subsidiaries. Changes in the carrying value of these borrowings arising from currency exchange rate changes are recognized in accumu-lated other comprehensive income on our Consolidated Balance Sheets to offset the change in the carrying value of the net investment being hedged.
We also, at times, enter into derivative instruments that are designed to hedge a risk, but are not designated as hedging instruments. Changes in the fair value of these instruments are recognized in the expense item on our Consolidated Statements of Operations that is consistent with the nature of the hedged risk.
We are exposed to counterparty credit risk on all of our derivative fi nancial instruments. Because the amounts are recorded at fair value, the full amount of our exposure is the carrying value of these instruments. We only enter into deriv-ative transactions with well established fi nancial institutions, so we believe our risk is minimal. We do not require collateral under these agreements.
Customer Marketing Programs and Sales Incentives We participate in various programs and arrangements with customers designed to increase the sale of our products by these customers. Among the programs negotiated are arrange-ments under which allowances can be earned by customers for attaining agreed-upon sales levels or for participating in specifi c marketing programs. In the United States, we partici-pate in cooperative trade marketing (“CTM”) programs, which are typically developed by us but are administered by TCCC. We are responsible for all costs of these programs in our ter-ritories, except for some costs related to a limited number of specifi c customers. Under these programs, we pay TCCC and TCCC pays our customers as a representative for the North American bottling system. Coupon programs are also devel-oped on a territory-specifi c basis with the intent of increasing sales by all customers. We believe our participation in these programs is essential to ensuring continued volume and rev-enue growth in the competitive marketplace. The costs of all these various programs, included as a reduction in net oper-ating revenues, totaled $2.2 billion in 2006 and 2005 and $1.9 billion in 2004.
Under customer programs and arrangements that require sales incentives to be paid in advance, we amortize the amount paid over the period of benefi t or contractual sales volume. When incentives are paid in arrears, we accrue the estimated amount to be paid based upon expected customer performance and estimated sales volume.
We frequently participate with TCCC in contractual arrange-ments at specifi c athletic venues, school districts, colleges and universities, and other locations, whereby we obtain pouring or vending rights at a specifi c location in exchange for cash payments. We record our obligation under each contract at inception and defer and amortize the total required payments using the straight-line method over the term of the contract. At December 31, 2006, the net unamortized balance of these arrangements, which was included in customer distribution rights and other noncurrent assets, net on our Consolidated Balance Sheet, totaled $446 million ($1,030 million capitalized, net of $584 million in accumulated amortization). Amortization expense related to these assets, included as a reduction in net operating revenues, totaled $150 million, $145 million, and $150 million in 2006, 2005, and 2004, respectively. The follow-ing table summarizes the estimated future amortization expense related to these assets as of December 31, 2006 (in millions):
Years ending December 31, Amortization Expense2007 $1292008 1012009 722010 512011 35Thereafter 58Total future amortization expense $446
At December 31, 2006, the liability associated with these arrangements totaled $365 million, $141 million of which is included in accounts payable and accrued expenses on our Consolidated Balance Sheet, and $224 million is included in other long-term obligations on our Consolidated Balance Sheet. Cash payments on these obligations totaled $115 million, $116 million, and $132 million in 2006, 2005, and 2004,

48 Coca-Cola Enterprises Inc. – 2006 Form 10-K
respectively. The following table summarizes the estimated future payments required under these arrangements as of December 31, 2006 (in millions):
Years ending December 31, Future Payments2007 $1412008 762009 562010 402011 26Thereafter 26Total future payments $365
For presentation purposes, the net change in customer distribution rights on our Consolidated Statements of Cash Flows is presented net of cash payments made under these arrangements.
For additional information about our transactions with TCCC, refer to Note 3.
Licensor Support Arrangements We participate in various funding programs supported by TCCC or other licensors, whereby we receive funds from the licensors to support customer marketing programs or other arrangements that promote the sale of the licensors’ products. Under these programs, certain costs incurred by us are reim-bursed by the applicable licensor. Payments from TCCC and other licensors for marketing programs and other similar arrangements to promote the sale of products are classifi ed as a reduction in cost of sales, unless we can overcome the presumption that the cash consideration is a reduction in the price of the vendor’s products. These payments are recognized either in the period in which payments are specifi ed or on a per unit basis as product is sold. Payments for volume-based marketing programs are recognized as product is sold and payments for programs covering a specifi c period are recog-nized on a straight-line basis over the specifi ed period. Support payments from licensors received in connection with market or infrastructure development are classifi ed as a reduction in cost of sales.
For additional information about our transactions with TCCC, refer to Note 3.
NOTE 2NEW ACCOUNTING STANDARDS
Recently Issued StandardsIn September 2006, the Financial Accounting Standards Board (“FASB”) issued Statement of Financial Accounting Standards (“SFAS”) No. 157, “Fair Value Measurements” (“SFAS 157”). SFAS 157 defi nes fair value, establishes a framework for measuring fair value in accordance with generally accepted accounting principles, and expands disclosures about fair value measurements. SFAS 157 is effective January 1, 2008. We are in the process of evaluating the impact that SFAS 157 will have on our Consolidated Financial Statements.
In June 2006, the FASB issued FASB Interpretation No. 48, “Accounting for Uncertainty in Income Taxes - an interpretation of FASB Statement No. 109” (“FIN 48”). FIN 48 clarifi es the accounting for uncertainty in income taxes by prescribing a recognition threshold and measurement attribute for the fi nan-cial statement recognition and measurement of a tax position
taken or expected to be taken in a tax return. The interpretation also provides guidance on derecognition, classifi cation, interest and penalties, accounting in interim periods, and disclosure. FIN 48 is effective January 1, 2007. We are in the process of evaluating the impact that FIN 48 will have on our Consolidated Financial Statements.
In February 2006, the FASB issued SFAS No. 155, “Accounting for Certain Hybrid Financial Instruments” (“SFAS 155”), which amends SFAS No. 133, “Accounting for Derivative Instruments and Hedging Activities” (“SFAS 133”) and SFAS No. 140, “Accounting for Transfers and Servicing of Financial Assets and Extinguishments of Liabilities” (“SFAS 140”). SFAS 155 simpli-fi es the accounting for certain derivatives embedded in other fi nancial instruments by allowing them to be accounted for as a whole if the holder elects to account for the whole instrument on a fair value basis. SFAS 155 also clarifi es and amends cer-tain other provisions of SFAS 133 and SFAS 140. SFAS 155 is effective for all fi nancial instruments acquired, issued or sub-ject to a remeasurement event occurring after January 1, 2007. We do not expect the adoption of SFAS 155 to have a material impact on our Consolidated Financial Statements.
Recently Adopted StandardsIn September 2006, the FASB issued SFAS No. 158, “Employers’ Accounting for Defi ned Benefi t Pension and Other Postretire-ment Plans – An Amendment of FASB Statements No. 87, 88, 106, and 132R” (“SFAS 158”). SFAS 158 requires companies to(1) fully recognize, as an asset or liability, the overfunded or underfunded status of defi ned pension and other postretire-ment benefi t plans; (2) recognize changes in the funded status through other comprehensive income in the year in which the changes occur; (3) measure the funded status of defi ned pension and other postretirement benefi t plans as of the date of the company’s fi scal year-end; and (4) provide enhanced disclosures. The provisions of SFAS 158 are effec-tive for our year ended December 31, 2006, except for the requirement to measure the funded status of retirement benefi t plans as of our fi scal year-end, which is effective for the year ended December 31, 2008. For additional informa-tion about the impact of SFAS 158 on our defi ned pension and other postretirement benefi t plans, refer to Note 9.
In May 2005, the FASB issued SFAS No. 154, “Accounting Changes and Error Corrections” (“SFAS 154”). SFAS 154 replaces APB Opinion No. 20, “Accounting Changes,” (“APB 20”) and SFAS No. 3, “Reporting Accounting Changes in Interim Financial Statements.” The statement requires a voluntary change in accounting principle to be applied retrospectively to all prior period fi nancial statements so that those fi nancial statements are presented as if the current accounting princi-ple had always been applied. APB 20 previously required most voluntary changes in accounting principle to be recognized by including in net income of the period of change the cumulative effect of changing to the new accounting principle. In addition, SFAS 154 carries forward, without change, the guidance contained in APB 20 for reporting a correction of an error in previously issued fi nancial statements and a change in accounting estimate. SFAS 154 was effective January 1, 2006 and did not have a material impact on our Consolidated Financial Statements.
In December 2004, the FASB issued SFAS No. 123R, “Share-Based Payment” (“SFAS 123R”), which revised SFAS 123, “Accounting for Stock-Based Compensation” (“SFAS 123”), and superseded APB Opinion No. 25, “Accounting for Stock
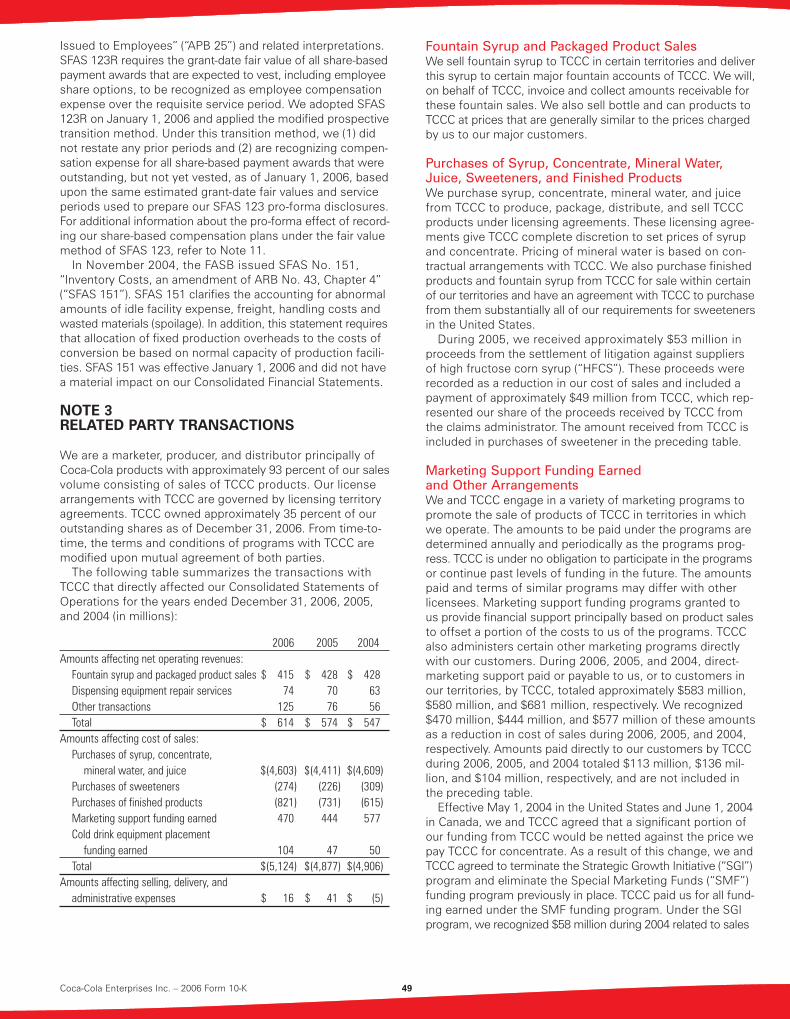
Coca-Cola Enterprises Inc. – 2006 Form 10-K 49
Issued to Employees” (“APB 25”) and related interpretations. SFAS 123R requires the grant-date fair value of all share-based payment awards that are expected to vest, including employee share options, to be recognized as employee compensation expense over the requisite service period. We adopted SFAS 123R on January 1, 2006 and applied the modifi ed prospective transition method. Under this transition method, we (1) did not restate any prior periods and (2) are recognizing compen-sation expense for all share-based payment awards that were outstanding, but not yet vested, as of January 1, 2006, based upon the same estimated grant-date fair values and service periods used to prepare our SFAS 123 pro-forma disclosures. For additional information about the pro-forma effect of record-ing our share-based compensation plans under the fair value method of SFAS 123, refer to Note 11.
In November 2004, the FASB issued SFAS No. 151, “Inventory Costs, an amendment of ARB No. 43, Chapter 4” (“SFAS 151”). SFAS 151 clarifi es the accounting for abnormal amounts of idle facility expense, freight, handling costs and wasted materials (spoilage). In addition, this statement requires that allocation of fi xed production overheads to the costs of conversion be based on normal capacity of production facili-ties. SFAS 151 was effective January 1, 2006 and did not have a material impact on our Consolidated Financial Statements.
NOTE 3RELATED PARTY TRANSACTIONS
We are a marketer, producer, and distributor principally of Coca-Cola products with approximately 93 percent of our sales volume consisting of sales of TCCC products. Our license arrangements with TCCC are governed by licensing territory agreements. TCCC owned approximately 35 percent of our outstanding shares as of December 31, 2006. From time-to-time, the terms and conditions of programs with TCCC are modifi ed upon mutual agreement of both parties.
The following table summarizes the transactions with TCCC that directly affected our Consolidated Statements of Operations for the years ended December 31, 2006, 2005, and 2004 (in millions):
2006 2005 2004Amounts affecting net operating revenues: Fountain syrup and packaged product sales $ 415 $ 428 $ 428 Dispensing equipment repair services 74 70 63 Other transactions 125 76 56 Total $ 614 $ 574 $ 547Amounts affecting cost of sales: Purchases of syrup, concentrate, mineral water, and juice $(4,603) $(4,411) $(4,609) Purchases of sweeteners (274) (226) (309) Purchases of fi nished products (821) (731) (615) Marketing support funding earned 470 444 577 Cold drink equipment placement funding earned 104 47 50 Total $(5,124) $(4,877) $(4,906)Amounts affecting selling, delivery, and administrative expenses $ 16 $ 41 $ (5)
Fountain Syrup and Packaged Product SalesWe sell fountain syrup to TCCC in certain territories and deliver this syrup to certain major fountain accounts of TCCC. We will, on behalf of TCCC, invoice and collect amounts receivable for these fountain sales. We also sell bottle and can products to TCCC at prices that are generally similar to the prices charged by us to our major customers.
Purchases of Syrup, Concentrate, Mineral Water, Juice, Sweeteners, and Finished ProductsWe purchase syrup, concentrate, mineral water, and juice from TCCC to produce, package, distribute, and sell TCCC products under licensing agreements. These licensing agree-ments give TCCC complete discretion to set prices of syrup and concentrate. Pricing of mineral water is based on con-tractual arrangements with TCCC. We also purchase fi nished products and fountain syrup from TCCC for sale within certain of our territories and have an agreement with TCCC to purchase from them substantially all of our requirements for sweeteners in the United States.
During 2005, we received approximately $53 million in proceeds from the settlement of litigation against suppliers of high fructose corn syrup (“HFCS”). These proceeds were recorded as a reduction in our cost of sales and included a payment of approximately $49 million from TCCC, which rep-resented our share of the proceeds received by TCCC from the claims administrator. The amount received from TCCC is included in purchases of sweetener in the preceding table.
Marketing Support Funding Earned and Other ArrangementsWe and TCCC engage in a variety of marketing programs to promote the sale of products of TCCC in territories in which we operate. The amounts to be paid under the programs are determined annually and periodically as the programs prog-ress. TCCC is under no obligation to participate in the programs or continue past levels of funding in the future. The amounts paid and terms of similar programs may differ with other licensees. Marketing support funding programs granted to us provide fi nancial support principally based on product sales to offset a portion of the costs to us of the programs. TCCC also administers certain other marketing programs directly with our customers. During 2006, 2005, and 2004, direct-marketing support paid or payable to us, or to customers in our territories, by TCCC, totaled approximately $583 million, $580 million, and $681 million, respectively. We recognized $470 million, $444 million, and $577 million of these amounts as a reduction in cost of sales during 2006, 2005, and 2004, respectively. Amounts paid directly to our customers by TCCC during 2006, 2005, and 2004 totaled $113 million, $136 mil-lion, and $104 million, respectively, and are not included in the preceding table.
Effective May 1, 2004 in the United States and June 1, 2004 in Canada, we and TCCC agreed that a signifi cant portion of our funding from TCCC would be netted against the price we pay TCCC for concentrate. As a result of this change, we and TCCC agreed to terminate the Strategic Growth Initiative (“SGI”) program and eliminate the Special Marketing Funds (“SMF”) funding program previously in place. TCCC paid us for all fund-ing earned under the SMF funding program. Under the SGI program, we recognized $58 million during 2004 related to sales

50 Coca-Cola Enterprises Inc. – 2006 Form 10-K
and volume growth through the termination date of the pro-gram. This amount is included in the total amounts recognized in marketing support funding earned in the preceding table.
In conjunction with the above changes, we and TCCC agreed to establish a Global Marketing Fund (“GMF”), effective May 1, 2004, under which TCCC is paying us $61.5 million annually through December 31, 2014, as support for marketing activi-ties. The term of the agreement will automatically be extended for successive ten-year periods thereafter unless either party gives written notice to terminate the agreement. The market-ing activities to be funded under this agreement will be agreed upon each year as part of the annual joint planning process and will be incorporated into the annual marketing plans of both companies. TCCC may terminate this agreement for the balance of any year in which we fail to timely complete the marketing plans or are unable to execute the elements of those plans, when such failure is within our reasonable control. We received $61.5 million in conjunction with the GMF in 2006 and 2005, and a prorata amount of $41.5 million during 2004. These amounts are included in the total amounts recognized in marketing support funding earned in the preceding table.
Effective January 1, 2007 in Great Britain, we and TCCC agreed that a signifi cant portion of our funding from TCCC as well as certain other arrangements with TCCC related to the purchase of concentrate would be netted against the price we pay TCCC for concentrate. As a result of this change, we expect to forgo approximately $3 million in marketing funding from TCCC in the fi rst quarter of 2007, due to the fact that our marketing funding was previously based on sales volume.
We participate in CTM programs in the United States administered by TCCC. We are responsible for all costs of the programs in our territories, except for some costs related to a limited number of specifi c customers. Under these programs, we pay TCCC and TCCC pays our customers as a representa-tive of the Coca-Cola North American bottling system. Amounts paid under CTM programs to TCCC for payment to our cus-tomers are included as a reduction in net operating revenues and totaled $276 million, $243 million, and $224 million in 2006, 2005, and 2004, respectively. These amounts are not included in the preceding table.
We have an agreement with TCCC under which TCCC pro-vides support payments for the marketing of certain brands of TCCC in the Herb territories acquired in 2001. Under the terms of this agreement, we received $14 million in 2006, 2005, and 2004, and will receive $14 million annually through 2008 and $11 million in 2009. Payments received under this agreement are not refundable to TCCC. These amounts are included in the total amounts recognized in marketing support funding earned in the preceding table.
Cold Drink Equipment Placement Funding EarnedWe participate in programs with TCCC designed to promote the placement of cold drink equipment (“Jumpstart Programs”). Under the Jumpstart Programs, as amended, we agree to (1) purchase and place specifi ed numbers of venders/coolers or cold drink equipment each year through 2010; (2) maintain the equipment in service, with certain exceptions, for a minimum period of 12 years after placement; (3) maintain and stock the equipment in accordance with specifi ed standards for market-ing TCCC products; (4) report to TCCC during the period the equipment is in service whether, on average, the equipment
purchased under the programs has generated a stated mini-mum sales volume of TCCC products; and (5) achieve for TCCC a certain gross profi t on TCCC products sold through energy coolers. We have agreed to relocate equipment if it is not generating suffi cient volume to meet minimum requirements. Movement of the equipment is required only if it is determined that, on average, suffi cient volume is not being generated and it would help to ensure our performance under the programs.
In December 2005, we and TCCC amended our Jumpstart agreements in North America to move to a system of “credits,” whereby we earn credit toward our annual purchase and place-ment requirements (expressed as “total credits”) based upon the type of equipment placed and the expected gross profi t contribution of the equipment. The amended agreements also provide that no violation of the Jumpstart Programs will occur even if we do not attain the required number of credits in any given year, so long as (1) the shortfall does not exceed 20 per-cent of the required credits for that year; (2) a compensating payment is made to TCCC or its affi liate; (3) the shortfall is corrected in the following year; and (4) we meet all specifi ed credit requirements by the end of 2010. The amended Jump-start agreements were effective January 1, 2005.
During 2004, we and TCCC amended our Jumpstart agree-ments in North America to defer the placement of certain vending equipment from 2004 and 2005 to 2009 and 2010. In exchange for this amendment, we agreed to pay TCCC $1.5 million in 2004, $3.0 million annually in 2005 through 2008 and $1.5 million in 2009. Additionally, we and TCCC amended our Jumpstart agreement in Europe to (1) consolidate country-specifi c placement requirements; (2) redefi ne the defi nition of a placement for certain large coolers; and (3) extend the agreement through 2009.
Should we not satisfy the provisions of the Jumpstart Programs, the agreements provide for the parties to meet to work out a mutually agreeable solution. Should the parties be unable to agree on alternative solutions, TCCC would be able to seek a partial refund. No refunds of amounts previously earned have ever been paid under the programs and we believe the probability of a partial refund of amounts previously earned under the programs is remote. We believe we would in all cases resolve any matters that might arise regarding these programs. We and TCCC have amended prior agree-ments to refl ect, where appropriate, modifi ed goals and we believe that we can continue to resolve any differences that might arise over our performance requirements under the Jumpstart Programs.
We received approximately $1.2 billion in Jumpstart support payments from TCCC during the period 1994 through 2001. There are no additional amounts payable to us from TCCC under these programs. We recognize the majority of support payments received from TCCC as we place cold drink equip-ment. A small portion of the support payments are recognized on a straight-line basis over the 12-year period beginning after equipment is placed. We recognized a total of $104 million, $47 million, and $50 million as a reduction to cost of sales during 2006, 2005, and 2004, respectively. The increase in recognized Jumpstart funding in 2006 as compared to 2005 and 2004 refl ects higher equipment placements in 2006 under our amended Jumpstart agreements with TCCC and the roll-out of our energy drink portfolio.

Coca-Cola Enterprises Inc. – 2006 Form 10-K 51
At December 31, 2006, $219 million in support payments were deferred under the Jumpstart Programs. Approximately $200 million of this amount is expected to be recognized dur-ing the period 2007 through 2010 as equipment is placed and approximately $19 million is expected to be recognized over the 12-year period after the equipment is placed. We have allocated the support payments to equipment units based on per unit funding amounts. The amount allocated to the requirement to place equipment is the balance remaining after determining the potential cost of moving the equipment after initial placement. The amount allocated to the potential cost of moving equipment after initial placement is deter-mined based on an estimate of the units of equipment that could potentially be moved and an estimate of the cost to move that equipment.
Other TransactionsOther transactions with TCCC include the sale of bottle preforms, management fees, offi ce space leases, and purchases of point-of-sale and other advertising items.
During 2004, we recalled the Dasani water brand in Great Britain because of bromate levels exceeding British regulatory standards. We received $32 million from TCCC during 2004 as reimbursement for recall costs. We recognized this reim-bursement as an offset to the related costs of the recall. This amount is not included in the preceding table.
NOTE 4ACCOUNTS PAYABLE AND ACCRUED EXPENSES
The following table summarizes our accounts payable and accrued expenses as of December 31, 2006 and 2005 (in millions):
2006 2005Trade accounts payable $ 877 $ 744Accrued marketing costs 660 597Accrued compensation and benefi ts 385 362Accrued interest costs 178 179Accrued taxes 189 275Accrued self-insurance obligations 181 194Other accrued expenses 262 288Accounts payable and accrued expenses $2,732 $2,639
NOTE 5DERIVATIVE FINANCIAL INSTRUMENTS
Interest Rate Swap AgreementsIn December 2005, we settled all of our outstanding fi xed-to-fl oating interest rate swaps with an aggregate notional amount of $1.4 billion. These swaps were previously designated as fair value hedges of fi xed-rate debt instruments due August 15, 2006, May 15, 2007, September 30, 2009, and August 15, 2011. As a result of the settlement, we received $46 million, which represented the fair value of the hedges on the date of set-tlement. This amount included $4 million that was previously recognized as adjustments to interest expense under the terms of the swap agreements. Accordingly, the fair value adjustments
to the previously hedged debt instruments totaled $42 million at the time of settlement. We recognized $23 million of this amount as part of the loss on the extinguishment of a portion of the previously hedged debt instruments and are recognizing $19 million as a reduction to interest expense over the remain-ing term of the previously hedged debt instruments. We extinguished the debt instruments in conjunction with the repatriation of non-U.S. earnings that occurred in December 2005 (refer to Note 10).
Cash Flow HedgesCash fl ow hedges are used to mitigate our exposure to changes in cash fl ows attributable to currency and commodity price fl uctuations associated with certain forecasted transactions, including our raw material purchases and vehicle fuel pur-chases. During 2006, 2005, and 2004, there was no material ineffectiveness related to the change in the fair value of these hedges.
At December 31, 2006, our cash fl ow hedges related to the currency price fl uctuations with the purchase of raw materials included hedge assets with a fair value of $0.3 million, which was recorded in prepaid expenses and other current assets on our Consolidated Balance Sheet, and hedge liabilities with a fair value of $0.2 million, which was recorded in accounts payable and accrued expenses on our Consolidated Balance Sheet. Unrealized net of tax losses of $0.2 million related to these hedges was included in accumulated other comprehen-sive income on our Consolidated Balance Sheet. We expect these losses to be reclassifi ed into cost of sales within the next 12 months as the forecasted purchases are made. At December 31, 2005, our cash fl ow hedges related to the pur-chase of raw materials included hedge assets with a fair value of $1.1 million, which was recorded in prepaid expenses and other current assets on our Consolidated Balance Sheet. Unrealized net of tax gains of $0.5 million related to these hedges was included in accumulated other comprehensive income on our Consolidated Balance Sheet. These gains were reclassifi ed into cost of sales during 2006 as the fore-casted purchases were made.
During 2006, we began using derivative instruments to hedge a portion of our vehicle fuel purchases in North America. The majority of these derivative instruments were designated as cash fl ow hedges related to the future purchase of vehicle fuel. At December 31, 2006, these cash fl ow hedges included hedge assets with a fair value of $2.9 million, which were recorded in prepaid expenses and other current assets on our Consolidated Balance Sheet, and hedge liabilities with a fair value of $2.2 million, which were recorded in accounts payable and accrued expenses on our Consolidated Balance Sheet. There were no unrealized gains or losses related to these hedges as of December 31, 2006.
Net Investment HedgesWe enter into certain non-U.S. currency denominated borrow-ings as net investment hedges of our international subsidiaries. During 2006, 2005, and 2004, we recorded a net of tax loss of $28 million, a net of tax gain of $54 million, and a net of tax loss of $28 million, respectively, in accumulated other comprehensive income on our Consolidated Balance Sheets, related to these hedges.

52 Coca-Cola Enterprises Inc. – 2006 Form 10-K
Future MaturitiesThe following table summarizes our debt maturities and capital lease obligations as of December 31, 2006, as adjusted to refl ect the long-term classifi cation of certain of our borrowings due in the next 12 months as a result of our intent and ability to refi nance these borrowings (in millions):
Years ending December 31, Debt Maturities
2007 $ 7772008 1,3582009 2,4762010 2662011 298Thereafter 4,691Debt, excluding capital leases $ 9,866
Years ending December 31, Capital Leases
2007 $ 272008 212009 202010 192011 19Thereafter 50Present value of minimum capital lease payments (A) 156Total debt $ 10,022
(A) Amounts due under capital lease are net of interest payments totaling $31 million.
At December 31, 2006 and 2005, approximately $1.4 billion and $849 million, respectively, of borrowings due in the next 12 months, including commercial paper, were classifi ed as long-term on our Consolidated Balance Sheets as a result of our intent and our ability to refi nance these borrowings on a long-term basis. If we are unable to refi nance these borrowings with similar obligations we would refi nance the borrowings through amounts available under committed domestic and international credit facilities. The $1.4 billion is included in our 2009 maturities in the preceding table, which corresponds to the scheduled expiration of our primary com-mitted domestic credit facility discussed below.
NOTE 6DEBT AND CAPITAL LEASES
The following table summarizes our debt as of December 31, 2006 and 2005 (in millions, except rates):
2006 2005
Principal Principal Balance Rates(A) Balance Rates(A)
U.S. dollar commercial paper $ 689 5.3% $ 156 3.9%Euro and pound sterling commercial paper 161 5.1 236 2.4Canadian dollar commercial paper 148 4.3 201 3.4U.S. dollar notes due 2007–2037 (B) 1,791 5.3 2,496 5.0Euro and pound sterling notes due 2007–2021 (C) 2,887 5.1 2,563 4.6Canadian dollar notes due 2009 129 5.9 129 5.9U.S. dollar debentures due 2012–2098 3,783 7.4 3,783 7.4U.S. dollar zero coupon notes due 2020 (D) 209 8.4 193 8.4Various non-U.S. currency debt and credit facilities 22 – 172 –Capital lease obligations (E) 156 – 132 –Other debt obligations 47 – 48 –
Total debt (F) 10,022 10,109
Less: current portion of debt 804 944
Debt, less current portion $ 9,218 $ 9,165
(A) These rates represent the weighted average interest rates or effective interest rates on the balances outstanding.(B) In August 2006, a $450 million, 5.38 percent note matured. In September 2006, a $250 million, 2.50 percent note matured. In connection with the maturing of these notes, we increased our borrowings
under our U.S. dollar commercial paper program.(C) In May 2006, a £175 million British pound sterling, 4.13 percent note (U.S. $330 million) matured. In connection with the maturing of this note, we issued a new £175 million British pound sterling, 5.25 percent
note (U.S. $325 million) due May 2009. (D) These amounts are shown net of unamortized discounts of $420 million and $436 million as of December 31, 2006 and December 31, 2005, respectively.(E) These amounts represent the present value of our minimum capital lease payments as of December 31, 2006 and 2005, respectively.(F) The total fair value of our debt was $10.8 billion and $11.1 billion at December 31, 2006 and 2005, respectively.

Coca-Cola Enterprises Inc. – 2006 Form 10-K 53
NOTE 8COMMITMENTS AND CONTINGENCIES
Affiliate GuaranteesWe guarantee debt and other obligations of certain third parties. In North America, we guarantee the repayment of debt owed by a PET (plastic) bottle manufacturing cooperative in which we have an equity interest. We also guarantee the repayment of debt owed by a vending partnership in which we have a limited partnership interest.
The following table summarizes the maximum amounts of our guarantees and the amounts outstanding under these guarantees as of December 31, 2006 and 2005 (in millions):
Guaranteed Outstanding
Category Expiration 2006 2005 2006 2005
Manufacturing cooperative Various through 2015 $239 $236 $221 $223Vending partnership November 2009 17 25 11 13Other Renewable 1 1 1 1 $257 $262 $233 $237
Debt and Credit FacilitiesWe have amounts available to us for borrowing under various debt and credit facilities. Amounts available under our com-mitted credit facilities serve as a backstop to our domestic and international commercial paper programs and support our working capital needs. Amounts available under our pub-lic debt facilities could be used for long-term fi nancing, refi -nancing of debt maturities, and refi nancing of commercial paper. The following table summarizes our availability under debt and credit facilities as of December 31, 2006 and 2005 (in millions):
2006 2005
Amounts available for borrowing: Amounts available under committed domestic and international credit facilities (A) $1,940 $2,297 Amounts available under public debt facilities: (B)
Shelf registration statement with the U.S. Securities and Exchange Commission 3,221 3,221 Euro medium-term note program 1,514 1,557Total amounts available under public debt facilities 4,735 4,778Total amounts available $6,675 $7,075
(A) Amounts are shown net of outstanding commercial paper totaling $998 million and $593 million as of December 31, 2006 and 2005, respectively, since these facilities serve as a backstop to our commercial paper programs. At December 31, 2006 and 2005, there were no outstanding borrowings under our committed credit facilities. Our primary committed facility matures in 2009 and is a $2.5 billion revolving credit facility with a syndicate of 26 banks.
(B) Amounts available under each of these public debt facilities and the related costs to borrow are subject to market conditions at the time of borrowing.
CovenantsOur credit facilities and outstanding notes and debentures contain various provisions that, among other things, require us to limit the incurrence of certain liens or encumbrances in excess of defi ned amounts. Additionally, our credit facilities require us to maintain a defi ned net debt to total capital ratio. We were in compliance with these requirements as of December 31, 2006. These requirements currently are not, and it is not anticipated they will become, restrictive to our liquidity or capital resources.
NOTE 7OPERATING LEASES
We lease offi ce and warehouse space, computer hardware, machinery and equipment, and vehicles under non-cancelable operating lease agreements expiring at various dates through 2049. Some lease agreements contain standard renewal pro-visions, which allow us to renew the lease at rates equivalent to fair market value at the end of the lease term. Certain lease agreements contain residual guarantees that require us to guarantee the value of the leased assets for the lessor at the end of the lease term. Under lease agreements that contain escalating rent provisions, lease expense is recorded on a straight-line basis over the lease term. Rent expense under non-cancelable operating lease agreements totaled $190 mil-lion, $165 million, and $170 million during 2006, 2005, and 2004, respectively.
The following table summarizes our minimum lease payments under non-cancelable operating leases with initial or remaining lease terms in excess of one year as of December 31, 2006 (in millions):
Years ending December 31, Operating Leases2007 $1272008 1132009 1032010 972011 84Thereafter 256Total minimum operating lease payments $780

54 Coca-Cola Enterprises Inc. – 2006 Form 10-K
The following table summarizes the expiration of amounts outstanding under our guarantees as of December 31, 2006 (in millions):
OutstandingYears ending December 31, Amounts
2007 $ 62008 92009 222010 162011 59Thereafter 121Total outstanding amounts $ 233
We hold no assets as collateral against these guarantees and no contractual recourse provisions exist under the guar-antees that would enable us to recover amounts we guaran-tee in the event of an occurrence of a triggering event under these guarantees. These guarantees arose as a result of our ongoing business relationships.
Variable Interest EntitiesWe have identifi ed the manufacturing cooperatives and the purchasing cooperative in which we participate as variable interest entities (“VIEs”). Our variable interests in these coop-eratives include an equity investment in each of the entities and certain debt guarantees. We are required to consolidate the assets, liabilities, and results of operations of all VIEs for which we determine that we are the primary benefi ciary. At December 31, 2006, these entities had total assets of approximately $430 million and total debt of approximately $280 million. For the year ended December 31, 2006, these entities had total revenues, including sales to us, of approxi-mately $860 million. Our maximum exposure as a result of our involvement in these entities is approximately $265 million, including our equity investments and debt guarantees. The largest of these cooperatives, of which we have determined we are not the primary benefi ciary, represents greater than 95 percent of our maximum exposure. We have been purchas-ing PET (plastic) bottles from this cooperative since 1984 and our fi rst equity investment was made in 1988.
Purchase CommitmentsWe have non-cancelable purchase agreements with various suppliers that specify a fi xed or minimum quantity that we must purchase. At December 31, 2006, we had purchase commitments for 2007 totaling $827 million and had no purchase commitments beyond 2007. All purchases made under these agreements are subject to standard quality and performance criteria.
Legal ContingenciesOn February 7, 2006, a purported class action lawsuit was fi led against us and several of our current and former offi cers and directors (the “Argento Suit”). The lawsuit alleged that we engaged in “channel stuffi ng” with customers and raised cer-tain insider trading claims. “Copycat” lawsuits virtually identical to this suit, some raising derivative claims under Delaware state law and others bringing claims under the Employees’ Retirement Income Security Act, were fi led in courts in Delaware and
Georgia. The Delaware suit names TCCC as a defendant and alleges that we are “controlled” by TCCC to our detriment and to the detriment of our shareowners. The various suits have been consolidated in each court by suit type. Amended com-plaints containing allegations substantially similar to the original suits have now been fi led in each suit. We possess strong defenses to the claims raised in these lawsuits and have asked or will ask the courts to dismiss each of the suits. In an order dated February 7, 2007, the court granted our motion to dismiss the consolidated securities class action in Atlanta. The court’s order was without prejudice, and the plaintiffs have 30 days from the date of the order to re-fi le their suit. At this time, it is not possible for us to predict the ultimate outcome of these matters.
On February 14, 2006, a lawsuit was fi led by a group of United States Coca-Cola bottlers against TCCC and us (the “Ozarks Suit”). This lawsuit brings claims for breach of contract and breach of duty, along with other related claims arising out of our plan to offer warehouse delivery of POWERade to a specifi c customer within our exclusive territory. The lawsuit seeks unspecifi ed compensatory and exemplary damages and seeks injunctive relief. Also, on February 14, 2006, a second lawsuit was fi led in Alabama state court by addi-tional bottler plaintiffs. This lawsuit brings claims that are substantially similar to those in the Ozarks Suit. Plaintiffs subsequently fi led amended complaints in both actions raising comparable allegations regarding programs to offer ware-house delivery of certain Dasani and Minute Maid products to specifi c customers within our exclusive territory. On February 8, 2007, some of the parties to these lawsuits agreed to a condi-tional settlement. Under the terms of the proposed settlement, following full approval by all parties, the cases will be dismissed without prejudice and there will be a two-year test (through 2008) of (1) national warehouse delivery of brands of TCCC into the exclusive territory of almost every bottler of Coca-Cola in the U.S., even nonparties to the litigation, in exchange for compensation in most circumstances, and (2) limits on local warehouse delivery within the parties’ territories. The proposed settlement does not require any payment by the defendants to the plaintiffs.
In 2000, we and TCCC were found by a Texas jury to be jointly liable in a combined amount of $15.2 million to fi ve plaintiffs, each a distributor of competing beverage products. These distributors sued alleging that we and TCCC engaged in anticompetitive marketing practices. The trial court’s verdict was upheld by the Texas Court of Appeals in July 2003. We and TCCC argued our appeals before the Texas Supreme Court in November 2004. In an opinion issued October 20, 2006, the Texas Supreme Court reversed the Texas Court of Appeals’ judgment and either dismissed or rendered judgment in favor of us on the claims that were the subject of the appeal. The plaintiffs have fi led a motion for rehearing, but the Supreme Court has not yet ruled on their motion. The claims of three remaining plaintiffs in this case remain to be tried. We intend to vigorously defend against an unfavorable outcome in these claims. At this time, we have not recorded any amounts for potential awards related to these additional claims.
Our California subsidiary has been sued by several current and former employees over alleged violations of state wage and hour rules. In a matter combined in a consolidated class action proceeding, plaintiffs alleged that certain hourly employees

Coca-Cola Enterprises Inc. – 2006 Form 10-K 55
were required to work off the clock. In December 2006, the parties agreed to settle this matter, as well as a smaller accompanying suit, for a total of $14 million, inclusive of claims, attorneys’ fees, and costs of administration. The settlement has been prelimi-narily approved by the court. Several other California suits have now been resolved and are to be dismissed. Amounts to be paid toward the settlements reached in these suits have been recorded in our Consolidated Financial Statements. Our California subsidiary is vigorously defending against the remaining claims. At this time, it is not possible for us to predict the ultimate out-come of these matters.
We are a party to various other matters of litigation or claims, including other employment matters, generally arising out of the normal course of business. Although it is diffi cult to predict the ultimate outcome of these matters, we believe that any ultimate liability would not have a material adverse effect on our Consolidated Financial Statements.
EnvironmentalAt December 31, 2006, there were two federal and two state superfund sites for which we and our bottling subsidiaries’ involvement or liability as a potentially responsible party (“PRP”) was unresolved. We believe any ultimate liability under these PRP designations will not have a material effect on our Consol-idated Financial Statements. In addition, we or our bottling subsidiaries have been named as a PRP at 38 other federal and 10 other state superfund sites under circumstances that have led us to conclude that either (1) we will have no further liability because we had no responsibility for having deposited hazard-ous waste; (2) our ultimate liability, if any, would be less than $100,000 per site; or (3) payments made to date will be suffi cient to satisfy our liability.
Income TaxesOur tax fi lings for various periods are subjected to audit by tax authorities in most jurisdictions where we conduct business. These audits may result in assessments of additional taxes that are subsequently resolved with the authorities or through the courts. Currently, there are assessments involving certain of our subsidiaries, including one of our Canadian subsidiaries, which may not be resolved for many years. We believe we have sub-stantial defenses to the questions being raised and would pursue all legal remedies before an unfavorable outcome would result. We believe we have adequately provided for any amounts that could result from these proceedings where (1) it is probable we will pay some amount and (2) the amount can be estimated. At this time, it is not possible for us to predict the ultimate out-come of some of these matters.
Letters of CreditAt December 31, 2006, we had letters of credit issued as collateral for claims incurred under self-insurance programs for workers’ compensation and large deductible casualty insurance programs aggregating $294 million and letters of credit for certain operating activities aggregating $3 million.
WorkforceAt December 31, 2006, we had approximately 74,000 employees, including 10,200 in Europe. Approximately 18,800 of our employ-ees in North America are covered by collective bargaining agreements in 164 different employee units and essentially all of our employees in Europe are covered by local agreements. (These employee numbers are unaudited.) These bargaining agreements expire at various dates over the next seven years, including 33 agreements in North America in 2007. We believe that we will be able to renegotiate subsequent agreements on satisfactory terms.
IndemnificationsIn the normal course of business, we enter into agreements that provide general indemnifi cations. We have not made signifi cant indemnifi cation payments under such agreements in the past and we believe the likelihood of incurring such a payment obligation in the future is remote. Furthermore, we cannot reasonably estimate future potential payment obligations, because we cannot predict when and under what circumstances they may be incurred. As a result, we have not recorded a liability in our Consolidated Financial Statements with respect to these general indemnifi cations.
NOTE 9PENSION AND OTHER POSTRETIREMENT BENEFIT PLANS
Pension PlansWe sponsor a number of defi ned benefi t pension plans covering substantially all of our employees in North America and Europe. Pension plans representing approximately 97 percent of our total benefi t obligations were measured as of September 30th and all other plans were measured as of December 31st.
Other Postretirement PlansWe sponsor unfunded defi ned benefi t postretirement plans providing healthcare and life insurance benefi ts to substantially all U.S. and Canadian employees who retire or terminate after qualifying for such benefi ts. Retirees of our European operations are covered primarily by government-sponsored programs and the specifi c cost to us for those programs and other postretire-ment healthcare is not signifi cant. The primary U.S. postretirement benefi t plan is a defi ned dollar benefi t plan limiting the effects of medical infl ation by establishing dollar limits for determining our contribution. The plan has established dollar limits for deter-mining our contributions and, therefore, the effect of a 1 percent increase in the assumed healthcare cost trend rate is not sig-nifi cant. The Canadian plan also contains provisions that limit the effects of infl ation on our future costs. Our defi ned benefi t postretirement plans were measured as of December 31st.

56 Coca-Cola Enterprises Inc. – 2006 Form 10-K
The following table summarizes information about our pension and other postretirement benefi t plans subsequent to the adoptionof SFAS 158 (in millions, except percentages):
Pension Plans Other Postretirement Plans 2006 2005 2006 2005Reconciliation of benefi t obligation: Benefi t obligation at beginning of plan year $ 2,904 $ 2,576 $ 414 $ 390 Service cost 151 128 13 12 Interest cost 157 146 22 22 Plan participants’ contributions 13 12 8 5 Amendments 5 3 2 – Actuarial (gain) loss (161) 184 (9) 11 Benefi t payments (95) (86) (29) (27) Business combinations 16 – – – Curtailment gain (14) – – – Currency translation adjustments 87 (59) 1 1 Benefi t obligation at end of plan year $ 3,063 $ 2,904 $ 422 $ 414Reconciliation of fair value of plan assets: Fair value of plan assets at beginning of plan year $ 2,221 $ 1,810 $ – $ – Actual gain on plan assets 217 266 – – Employer contributions 211 266 21 22 Plan participants’ contributions 13 12 8 5 Benefi t payments (95) (86) (29) (27) Business combinations 12 – – – Currency translation adjustments 77 (47) – – Fair value of plan assets at end of plan year $ 2,656 $ 2,221 $ – $ –Funded status: Projected benefi t obligation (“PBO”) $ (3,063) $ (2,904) $ (422) $ (414) Plan assets at fair value 2,656 2,221 – – Fourth quarter contributions 18 15 – – Net funded status (389) (668) (422) (414) Funded status – overfunded 26 – – – Funded status – underfunded $ (415) $ (668) $ (422) $ (414)Amounts recognized in the balance sheet consist of: Noncurrent assets $ 26 n/a(A) $ – n/a(A)
Current liabilities (9) n/a(A) (22) n/a(A)
Noncurrent liabilities (406) n/a(A) (400) n/a(A)
Net amounts recognized $ (389) n/a(A) $ (422) n/a(A)
Accumulated benefi t obligation (“ABO”) $ 2,588 $ 2,457 n/a n/aAmounts in accumulated other comprehensive income: Prior service cost (credits) $ 33 $ 32 $ (69) $ (84) Net losses 727 990 99 113 Amounts in accumulated other comprehensive income $ 760 $ 1,022 $ 30 $ 29Amortization expense expected to be recognized during next fi scal year: Amortization of prior service cost (credit) $ 3 $ 4 $ (13) $ (13) Amortization of net losses 55 77 4 5 Total amortization expense $ 58 $ 81 $ (9) $ (8)Incremental effect of adopting SFAS 158: Increase in liabilities $ 217 n/a(A) $ 30 n/a(A)
Decrease in assets 331 n/a(A) – n/a(A)
Decrease in accumulated other comprehensive income (355) n/a(A) (19) n/a(A)
Decrease in long-term deferred income tax liabilities (193) n/a(A) (11) n/a(A)
Weighted average assumptions to determine:Benefi t obligations at the measurement date Discount rate 5.7% 5.4% 6.1% 5.6% Rate of compensation increase 4.5 4.6 – –Net periodic pension cost for years ended December 31 Discount rate 5.4 5.8 5.6 5.9 Expected return on assets 8.3 8.3 – – Rate of compensation increase 4.6 4.6 – –
(A) These disclosures are not applicable to our 2005 pension and other postretirement benefi t plans since SFAS 158 was effective for our year ended December 31, 2006.

Coca-Cola Enterprises Inc. – 2006 Form 10-K 57
The following table summarizes information about our pen-sion and other postretirement benefi t plans prior to the adop-tion of SFAS 158 (in millions):
Other Pension Postretirement Plans Plans 2005 2005Amounts recognized in the balance sheet consist of: Prepaid benefi ts cost $ 198 $ – Accrued benefi ts liability (352) (385) Intangible assets 26 – Accumulated other comprehensive income 482 – Net amounts recognized $ 354 $(385)
The following table summarizes information about our defi ned benefi t pension plans as of our measurement dates (in millions):
2006 2005Information for plans with an ABO in excess of plan assets: Projected benefi t obligation $ 853 $2,034 Accumulated benefi t obligation 802 1,790 Fair value of plan assets 622 1,443Information for plans with a PBO in excess of plan assets: Projected benefi t obligation $2,451 $2,904 Accumulated benefi t obligation 2,161 2,457 Fair value of plan assets 2,033 2,221Information for plans with a PBO less than plan assets: Projected benefi t obligation $ 612 $ – Accumulated benefi t obligation 427 – Fair value of plan assets 623 –
The following table summarizes the net periodic benefi t costs of our pension plans and other postretirement plans for the years ended December 31, 2006, 2005, and 2004 (in millions):
Pension Plans Other Postretirement Plans 2006 2005 2004 2006 2005 2004
Components of net periodic benefi t costs: Service cost $ 151 $ 128 $ 108 $ 13 $ 12 $ 11 Interest cost 157 146 131 22 22 21 Expected return on plan assets (188) (158) (135) – – – Amortization of prior service cost (credit) 4 4 2 (13) (13) (13) Recognized actuarial loss 77 62 47 5 5 3
Net periodic benefi t cost 201 182 153 27 26 22 Other (3) 1 – – – –
Total costs $ 198 $ 183 $ 153 $ 27 $ 26 $ 22
Pension Plan AssetsPension assets of our North American and Great Britain plans represent approximately 96 percent of our total pension plan assets. The following table summarizes the pension plan asset allocations of those assets as of the measurement date and the expected long-term rates of return by asset category:
Weighted Average Allocation Weighted Average Target Actual Actual Expected Long-TermAsset Category 2006 2006 2005 Rate of ReturnEquity securities (A) 62% 66% 70% 8.9%Fixed income securities 21 19 20 5.4Real estate 7 4 3 8.0Other(B) 10 11 7 10.5Total 100% 100% 100% 8.3%
(A) The overweight in equity securities versus our target allocation is primarily the result of funds that are invested on an interim basis until they are redirected to the real estate and other asset categories.(B) The other category consists of investments in hedge funds, private equity funds, and timber funds.

58 Coca-Cola Enterprises Inc. – 2006 Form 10-K
We have established formal investment policies for the assets associated with these plans. Policy objectives include maxi-mizing long-term return at acceptable risk levels, diversifying among asset classes, if appropriate, and among investment managers, as well as establishing relevant risk parameters within each asset class. Specifi c asset class targets are based on the results of periodic asset/liability studies. The invest-ment policies permit variances from the targets within certain parameters. The weighted average expected long-term rates of return are based on a January 2007 review of such rates.
Our fi xed income securities portfolio is invested primarily in commingled funds and is generally managed for overall return expectations rather than matching duration against plan liabilities; therefore, debt maturities are not signifi cant to the plan performance.
Benefit Plan ContributionsThe following table summarizes the contributions made to our pension and other postretirement benefi t plans for the years ended December 31, 2006 and 2005, as well as our projected contributions for the year ending December 31, 2007 (in millions):
Actual Projected(A)
2006 2005 2007Pension – U.S. $137 $204 $105Pension – Non-U.S. 77 70 81Other Postretirement 21 22 23Total contributions $235 $296 $209
(A) These amounts are unaudited.
We fund our U.S. pension plans at a level to maintain, within established guidelines, the IRS-defi ned 90 percent current liability funded status. At January 1, 2006, the date of the most recent actuarial valuation, all U.S. funded defi ned benefi t pen-sion plans refl ected current liability funded status equal to or greater than 90 percent. Our primary Canadian plan does not require contributions at this time. Contributions to the primary Great Britain plan are based on a percentage of employees’ pay.
Benefit Plan PaymentsBenefi t payments are made primarily from funded benefi t plan trusts and current assets. The following table summarizes our expected future benefi t payments as of December 31, 2006 (in millions):
Other Pension Postretirement Benefi t Plan Benefi t PlanYears ending December 31, Payments(A) Payments(A)
2007 $104 $ 232008 106 242009 113 252010 122 262011 131 282012 – 2016 841 151
(A) These amounts are unaudited.
Defined Contribution PlansWe sponsor qualifi ed defi ned contribution plans covering substantially all employees in the U.S., France, Canada, and certain employees in Great Britain and the Netherlands. Our contributions to these plans totaled $24 million, $23 million, and $24 million in 2006, 2005, and 2004, respectively. Under our primary plan in the U.S., we matched 25 percent in 2006, 2005, and 2004 of participants’ voluntary contributions up to a maximum of 7 percent of the participants’ contributions.
Multi-Employer Pension PlansWe participate in various multi-employer pension plans (mostly in the U.S.). Pension expense for multi-employer plans totaled $37 million, $36 million, and $37 million in 2006, 2005, and 2004, respectively.
NOTE 10INCOME TAXES
The following table summarizes our (loss) income before income taxes for the years ended December 31, 2006, 2005, and 2004 (in millions):
2006 2005 2004United States(A) $(2,186) $288 $294Non-U.S.(A) 68 502 524(Loss) income before income taxes $(2,118) $790 $818
(A) Our 2006 U.S. and non-U.S. (loss) income before income taxes included a non-cash franchise impairment charge of $2,538 million and $384 million, respectively. For additional information about the non-cash franchise impairment charge, refer to Note 1.
The current income tax provision represents the estimated amount of income taxes paid or payable for the year, as well as changes in estimates from prior years. The deferred income tax (benefi t) provision represents the change in deferred tax liabilities and assets and, for business combinations, the change in tax liabilities and assets since the date of acquisition. The follow-ing table summarizes the signifi cant components of our provi-sion for income taxes for the years ended December 31, 2006, 2005, and 2004 (in millions):
2006 2005 2004Current: United States: Federal $ (7) $ 36 $ – State and local 13 9 7 European and Canadian 92 153 91Total current 98 198 98Deferred: United States: Federal(A) (766) 171 107 State and local(A) (102) (6) 21 European and Canadian(A) (125) (47) 16 Rate changes (80) (40) (20)Total deferred (1,073) 78 124Income tax (benefi t) expense $ (975) $276 $222
(A) Our 2006 U.S. federal, U.S. state and local, and European and Canadian amounts included an income tax benefi t of $888 million, $99 million, and $122 million, respectively, related to the $2.9 billion non-cash franchise impairment charge recorded during 2006. These income tax benefi ts do not impact our current or future cash taxes. For additional information about the non-cash franchise impairment charge, refer to Note 1.

Coca-Cola Enterprises Inc. – 2006 Form 10-K 59
Our effective tax rate was a benefi t of 46 percent, a provision of 35 percent, and a provision of 27 percent for the years ended December 31, 2006, 2005, and 2004, respectively. The follow-ing table provides a reconciliation of our income tax (benefi t) provision at the statutory federal rate to our actual income tax (benefi t) provision for the years ended December 31, 2006, 2005, and 2004 (in millions):
2006 2005 2004U.S. federal statutory (benefi t) expense $(741) $276 $286U.S. state (benefi t) expense, net of federal benefi t (85) 7 12Taxation of European and Canadian operations, net (74) (73) (71)Rate and law change benefi t (80) (40) (20)Repatriation of non-U.S. earnings – 128 –Valuation allowance provision 4 (3) 13Nondeductible items 14 12 12Revaluation of income tax obligations (16) (33) (10)Other, net 3 2 –Income tax (benefi t) expense $(975) $276 $222
As of December 31, 2006, our non-U.S. subsidiaries had $104 million in undistributed earnings. These earnings are exclusive of amounts that would result in little or no tax under current tax laws if remitted in the future. The earnings from our non-U.S. subsidiaries are considered to be indefi nitely reinvested and, accordingly, no provision for U.S. federal and state income taxes has been made in our Consolidated Financial Statements. A distribution of these non-U.S. earnings in the form of dividends or otherwise, would subject us to both U.S. federal and state income taxes, as adjusted for non-U.S. tax credits, and withholding taxes payable to the various non-U.S. countries. Determination of the amount of any unrecognized deferred income tax liability on these undis-tributed earnings is not practicable.
As of December 31, 2005, our non-U.S. subsidiaries did not have any undistributed earnings due to the repatriation that was completed in connection with the unique provisions of the American Jobs Creation Act of 2004 (“Tax Act”). The Tax Act contained, among other things, a repatriation provision that provided a special, one-time tax deduction of 85 percent of certain non-U.S. earnings that were repatriated prior to December 31, 2005, provided certain criteria were met. As such, in December 2005, we repatriated a total of $1.6 billion in previously undistributed non-U.S. earnings and basis. The total income tax provision associated with the repatriation was $128 million.
Deferred income taxes refl ect the net tax effects of tempo-rary differences between the carrying amounts of assets and liabilities for fi nancial reporting purposes and the amounts used for income tax purposes.
The following table summarizes the signifi cant components of our deferred tax liabilities and assets as of December 31, 2006 and 2005 (in millions): 2006 2005Deferred tax liabilities: Franchise license and other intangible assets $3,956 $4,940 Property, plant, and equipment 681 723Total deferred tax liabilities 4,637 5,663Deferred tax assets: Net operating loss and other carryforwards (150) (316) Employee and retiree benefi t accruals (486) (374) Alternative minimum tax and other credits (81) (68) Deferred revenue (94) (123) Other, net (77) (63)Total deferred tax assets (888) (944)Valuation allowances on deferred tax assets 78 74Net deferred tax liabilities 3,827 4,793Current deferred income tax assets 230 313Long-term deferred income tax liabilities $4,057 $5,106
We recognize valuation allowances on deferred tax assets reported if, based on the weight of the evidence, we believe that it is more likely than not that some or all of our deferred tax assets will not be realized. We believe the majority of our deferred tax assets will be realized because of the reversal of certain signifi cant temporary differences and anticipated future taxable income from operations.
As of December 31, 2006 and 2005, we had valuation allowances of $78 million and $74 million, respectively. The net increase in our valuation allowances in 2006 was primar-ily due to increases resulting from the generation of certain non-U.S. net operating losses and state income tax credits, offset partially by the release of net operating losses and credits upon utilization and expirations, and from modifi cations as a result of state law changes. Included in our valuation allowances as of December 31, 2006 and 2005 was $1 million for net operating loss carryforwards of acquired companies.
As of December 31, 2006, we had U.S. federal tax operating loss carryforwards totaling $200 million. These carryforwards are available to offset future taxable income until they expire at varying dates through 2024. We also had U.S. state operating loss carryforwards totaling $1.7 billion, which expire at varying dates through 2026. The following table summarizes the esti-mated amount of our U.S. federal and U.S. state tax operating loss carryforwards that expire each year (in millions):
Years ending December 31, U.S. Federal U.S. State2007 $ – $ 2352008 3 1412009 – 1082010 – 1062011 – 67Thereafter 197 1,054Total tax operating loss carryfowards $200 $1,711

60 Coca-Cola Enterprises Inc. – 2006 Form 10-K
NOTE 11SHARE-BASED COMPENSATION PLANS
We maintain share-based compensation plans that provide for the granting of non-qualifi ed share options and restricted share awards and restricted share units (collectively “restricted shares”) to certain executive and management level employees. We believe that these awards better align the interests of our employees with the interests of our shareowners.
On January 1, 2006, we adopted SFAS 123R, which requires the grant-date fair value of all share-based payment awards that are expected to vest, including employee share options, to be recognized as employee compensation expense over the requi-site service period. We adopted SFAS 123R by applying the modifi ed prospective transition method and, therefore, (1) did not restate any prior periods and (2) are recognizing compensa-tion expense for all share-based payment awards that were outstanding, but not yet vested, as of January 1, 2006, based upon the same estimated grant-date fair values and service periods used to prepare our SFAS 123 pro-forma disclosures.
Prior to adopting SFAS 123R, we accounted for our share-based payment awards using the intrinsic value method of APB 25 and related interpretations. Under APB 25, we did not record compensation expense for employee share options, unless the awards were modifi ed, because our share options were granted with exercise prices equal to or greater than the fair value of our stock on the date of grant. The following table illustrates the effect on reported net income and earnings per share applicable to common shareowners for the years ended December 31, 2005 and 2004, had we accounted for our share-based compensation plans using the fair value method of SFAS 123 (in millions, except per share data):
2005 2004Net income, as reported $ 514 $ 596Add: Total share-based employee compensation costs included in net income, net of tax 19 15Less: Total share-based employee compensation costs determined under the fair value method for all awards, net of tax (52) (71)Net income, pro-forma $ 481 $ 540Net income per share: Basic – as reported $ 1.09 $ 1.28 Basic – pro-forma $ 1.02 $ 1.16 Diluted – as reported $ 1.08 $ 1.26 Diluted – pro-forma $ 1.01 $ 1.14
During the year ended December 31, 2006, we recorded $63 million in compensation expense related to our share-based payment awards. This amount included $35 million ($22 million net of tax, or $0.05 per common share) of incremental expense as a result of adopting SFAS 123R. Our share-based compen-sation expense for the year ended December 31, 2006 also included $4 million related to the modifi cation of certain awards in connection with our restructuring activities (refer to Note 16). We recognize compensation expense for our share-based pay-ment awards on a straight-line basis over the requisite service period of the entire award, unless the awards are subject to market conditions, in which case we recognize compensation expense over the requisite service period of each separate vesting tranche. Compensation expense related to our share-based payment awards is recorded in SD&A expenses. We determine the grant-date fair value of our share-based payment awards using a Black-Scholes model, unless the awards are subject to market conditions, in which case we use a Monte Carlo simulation model. The Monte Carlo simulation model utilizes multiple input variables to estimate the probability that market conditions will be achieved.
Share OptionsOur share options (1) are granted with exercise prices equal to or greater than the fair value of our stock on the date of grant; (2) vest ratably over a period of three to nine years; and (3) expire 10 years from the date of grant. Certain of the share options that were granted during the year ended December 31, 2006 are subject to market conditions that require our stock price to increase 25 percent and 50 percent for a defi ned period. We also have certain outstanding share options that contain provisions that allow for accelerated vesting should various stock performance criteria be met. Generally, when options are exercised we issue new shares, rather than issuing shares from treasury.
The following table summarizes the weighted average grant-date fair values and assumptions that were used to estimate the grant-date fair values of the share options granted during the years ended December 31, 2006, 2005, and 2004:
Grant-date fair value 2006 2005 2004Black-Scholes model $8.77 $7.61 $10.04Monte Carlo model 7.84 n/a n/a
AssumptionsDividend yield (A) 1.2% 0.7% 0.4%Expected volatility (B) 32.7% 30.0% 40.0%Risk-free interest rate (C) 4.9% 3.9% 3.5%Expected life (D) 7.4 years 6.0 years 6.0 years
(A) The dividend yield was calculated by dividing our annual dividend by our average stock price on the date of grant.
(B) The expected volatility was determined by using a combination of the historical volatility of our stock, the implied volatility of our exchange-traded options, and other factors, such as a comparison to our peer group.
(C) The risk-free interest rate was based on the U.S. Treasury yield with a term equal to the expected life on the date of grant.
(D) The expected life was used for options valued by the Black-Scholes model. It was determined by using a combination of actual exercise and post-vesting cancellation history for the types of employees included in the grant population.

Coca-Cola Enterprises Inc. – 2006 Form 10-K 61
The following table summarizes our share option activity during the years ended December 31, 2006, 2005, and 2004 (shares in thousands):
2006 2005 2004 Shares Exercise Price Shares Exercise Price Shares Exercise PriceOutstanding at beginning of year 54,427 $25.04 56,013 $25.09 63,831 $23.01 Granted 3,627 21.47 2,709 22.31 6,724 23.67 Exercised(A) (4,207) 17.25 (2,644) 15.18 (13,225) 13.85 Forfeited or expired (4,781) 32.83 (1,651) 37.90 (1,317) 29.86Outstanding at end of year 49,066 24.69 54,427 25.04 56,013 25.09Options exercisable at end of year 40,766 24.80 44,023 25.23 37,586 26.39Options available for future grant 25,533 27,530 29,730
(A) The total intrinsic value of options exercised during the years ended December 31, 2006, 2005, and 2004 was $14 million, $17 million, and $147 million, respectively.
The following table summarizes our options outstanding and our options exercisable as of December 31, 2006 (shares in thousands):
Outstanding Exercisable Weighted Weighted Average Weighted Average Weighted Range of Options Remaining Average Options Remaining AverageExercise Prices Outstanding (A) Life (years) Exercise Price Exercisable (A) Life (years) Exercise Price
$16.01 to $22.00 27,837 5.18 $19.43 24,266 4.56 $19.1322.01 to 32.00 14,628 5.84 24.68 11,142 5.23 25.2232.01 to 42.00 3,427 1.74 36.02 2,184 1.58 36.53
Over 42.00 3,174 1.47 58.55 3,174 1.47 58.55 49,066 4.90 24.69 40,766 4.34 24.80
(A) The aggregate intrinsic value of options outstanding and exercisable as of December 31, 2006 was $42 million.
As of December 31, 2006, we had approximately $39 million of unrecognized compensation expense related to our unvested share options. We expect to recognize this compensation expense over a weighted average period of 2 years.
Restricted SharesOur restricted shares generally vest upon continued employment for a period of at least four years and the attainment of certain share price targets. Certain of our restricted shares expire 5 years from the date of grant. All restricted share awards entitle the participant to full dividend and voting rights. Unvested shares are restricted as to disposition and subject to forfeiture under certain circumstances.
During the years ended December 31, 2006, 2005, and 2004 we granted 2.4 million, 1.9 million, and 1.2 million restricted shares, respectively. The following table summarizes the weighted average grant-date fair values and assumptions that were used to estimate the grant-date fair values of the restricted shares granted during the years ended December 31, 2006, 2005, and 2004:
Grant-date fair value 2006 2005(A) 2004(A)
Monte Carlo model $18.80 n/a n/aIntrinsic value(A) n/a $22.31 $23.36
AssumptionsDividend yield(B) 1.1% n/a n/aExpected volatility(C) 33.6% n/a n/aRisk-free interest rate(D) 5.1% n/a n/a
(A) Under APB 25 and related interpretations, the grant-date fair value of restricted shares equaled the intrinsic value on the date of grant.
(B) The dividend yield was calculated by dividing our annual dividend by our average stock price on the date of grant.
(C) The expected volatility was determined by using a combination of the historical volatility of our stock, the implied volatility of our exchange-traded options, and other factors, such as a comparison to our peer group.
(D) The risk-free interest rate was based on the U.S. Treasury yield with a term equal to the expected life on the date of grant.
The following table summarizes our restricted share award activity during the years ended December 31, 2006 (shares in thousands):
Weighted Weighted Restricted Average Grant Restricted Average Grant Shares Date Fair Value Share Units Date Fair Value
Outstanding at December 31, 2005 3,923 $21.31 546 $21.67 Granted 1,464 18.70 946 18.95 Vested (601) 18.04 (8) 16.25 Forfeited (130) 21.70 (21) 21.95Outstanding at December 31, 2006 4,656 20.92 1,463 19.73
During 2006, 2005, and 2004, we recognized amortization expense totaling $23 million, $27 million, and $20 million, respectively, related to our restricted share awards. As of December 31, 2006, we had approximately $79 million in total unrecognized compensation expense related to our restricted share awards. We expect to recognize this com-pensation cost over a weighted average period of 2.9 years. As of December 31, 2006, we had approximately 2.5 million restricted shares available for future grant.

62 Coca-Cola Enterprises Inc. – 2006 Form 10-K
NOTE 12EARNINGS (LOSS) PER SHARE
We calculate our basic earnings (loss) per share by dividing net income (loss) by the weighted average number of common shares outstanding during the period. Diluted earnings (loss) per share are calculated in a similar manner, but include the dilutive effect of securities. To the extent that securities are antidilutive, they are excluded from the calculation of earnings (loss) per share. The following table summarizes our basic and diluted earnings (loss) per share calculations for the years ended December 31, 2006, 2005, and 2004 (in millions, except per share data; per share data is calculated prior to rounding to millions):
2006 2005 2004Net (loss) income $(1,143) $ 514 $ 596Basic weighted average common shares outstanding(A) 475 471 465 Effect of dilutive securities (B) – 5 8Diluted weighted average common shares outstanding(A) 475 476 473Basic (loss) earnings per share $ (2.41) $1.09 $1.28Diluted (loss) earnings per share $ (2.41) $1.08 $1.26
(A) At December 31, 2006, 2005, and 2004, we were obligated to issue, for no additional consideration, 2.8 million, 3.3 million, and 3.4 million common shares, respectively, under deferred stock plans and other agreements. These shares were included in our calculation of basic and diluted earnings per share for each year presented.
(B) For the year ended December 31, 2006, all outstanding options to purchase common shares were excluded from the calculation of diluted earnings per share because their effect on our loss per common share was antidilutive. For the years ended December 31, 2005 and 2004, outstanding options to purchase 32 million and 17 million common shares, respectively, were excluded from the diluted earnings per share calculation because the exercise price of the options was greater than the average price of our common stock. The dilutive impact of the remaining options outstanding in these years was included in the effect of dilutive securities.
We paid a quarterly dividend of $0.06 during 2006 and $0.04 during 2005 and 2004. Dividends are declared at the discretion of our Board of Directors.
NOTE 13ACCUMULATED OTHER COMPREHENSIVE INCOME (LOSS)
Comprehensive income (loss) is comprised of net income (loss) and other adjustments, including items such as non-U.S. currency translation adjustments, hedges of net investments in non-U.S. subsidiaries, pension liability adjustments, gains and losses on certain investments in marketable equity securities, and changes in the fair value of certain derivative fi nancial instruments qualifying as cash fl ow hedges. We do not provide income taxes on currency translation adjustments, as the earnings from our non-U.S. subsidiaries are considered to be indefi nitely reinvested. The following table summarizes our accumulated other comprehensive income (loss) activity for the years ended December 31, 2006, 2005, and 2004 (in millions):
Net Pension Other Currency Investment Liability Adjustments, Translations Hedges Adjustments(A) Net TotalBalance, December 31, 2003 $ 379 $ 57 $ (301) $ (2) $ 133 2004 Pre-tax activity 305 (44) (36) 5 230 2004 Tax effect – 16 13 (2) 27Balance, December 31, 2004 684 29 (324) 1 390 2005 Pre-tax activity (303) 86 37 (4) (184) 2005 Tax effect – (32) (14) 2 (44)Balance, December 31, 2005 381 83 (301) (1) 162 2006 Pre-tax activity 211 (44) (309) 17 (125) 2006 Tax effect – 16 96 (6) 106Balance, December 31, 2006 $ 592 $ 55 $ (514) $ 10 $ 143
(A) The 2006 activity includes the impact of adopting SFAS 158.

Coca-Cola Enterprises Inc. – 2006 Form 10-K 63
During 2005, we recorded a $7 million loss ($4 million net of tax) on our investment in certain marketable equity secu-rities, after concluding that the unrealized loss on our invest-ment was other than temporary. As of December 31, 2006, the gross unrealized gain related to this investment was approximately $13 million. The aggregate fair value of this investment was approximately $47 million and $30 million at December 31, 2006 and 2005, respectively.
Refer to Note 9 for additional information about our pension liability adjustments and Note 5 for additional information about our net investment hedges.
NOTE 14SHARE REPURCHASE PROGRAM
Under the 1996 and 2000 share repurchase programs we are authorized to repurchase up to 60 million shares, of which we have repurchased a total of 26.7 million shares.We can repurchase shares in the open market and in pri-vately negotiated transactions. In 2006, 2005, and 2004 there were no share repurchases under these share repurchase programs.
We consider market conditions and alternative uses of cash and/or debt, balance sheet ratios, and shareowner returns when evaluating share repurchases. Repurchased shares are added to treasury stock and are available for general corporate purposes, including acquisition financ-ing and the funding of various employee benefit and compensation plans.
NOTE 15OPERATING SEGMENTS
We operate in one industry within two geographic regions, North America and Europe, which represent our operating seg-ments. These segments derive their revenues from marketing, producing, and distributing bottle and can nonalcoholic bever-ages. There are no material amounts of sales or transfers between North America and Europe and no signifi cant U.S. export sales. In North America, Wal-Mart Stores, Inc accounted for approximately 10 percent of our 2006 net operating reve-nues. No single customer accounted for more than 10 percent of our 2006 net operating revenues in Europe.
We evaluate our operating segments separately to individually monitor the different factors affecting their fi nancial perfor-mance. Segment income or loss includes substantially all of the segment’s cost of production, distribution, and administra-tion. Our information technology, share-based compensation, and debt portfolio are all managed on a global basis and, therefore, expenses and/or costs attributable to these items are included in our corporate operating segment. In addition, certain administrative expenses for departments that support our segments such as legal, accounting, and risk management are included in our corporate operating segment. We evaluate segment performance and allocate resources based on sev-eral factors, of which net revenues and operating income are the primary fi nancial measures.

64 Coca-Cola Enterprises Inc. – 2006 Form 10-K
The following table summarizes selected fi nancial information related to our operating segments for the years ended December 31, 2006, 2005, and 2004 (in millions):
North America(A) Europe(B) Corporate Consolidated2006Net operating revenues $14,221 $5,583 $ – $19,804Operating (loss) income(C) (1,711) 718 (502) (1,495)Interest expense, net – – 633 633Depreciation and amortization 699 250 63 1,012Long-lived assets 13,179 5,875 480 19,534Capital asset investments 568 232 82 882
2005Net operating revenues $13,492 $5,251 $ – $18,743Operating income(D) 1,175 730 (474) 1,431Interest expense, net(E) – – 633 633Depreciation and amortization 725 268 51 1,044Long-lived assets 16,161 5,288 513 21,962Capital asset investments 524 262 116 902
2004Net operating revenues $12,907 $5,283 $ – $18,190Operating income(F) 1,184 737 (485) 1,436Interest expense, net – – 619 619Depreciation and amortization 731 277 60 1,068Long-lived assets 16,529 5,944 617 23,090Capital asset investments 534 320 95 949
(A) Canada contributed approximately 9 percent of North America’s net operating revenues during 2006 and 2005 and 8 percent during 2004. At December 31, 2006, 2005, and 2004, Canada’s long-lived assets represented approximately 13 percent, 12 percent, and 12 percent of North America’s long-lived assets, respectively.
(B) Great Britain contributed approximately 45 percent, 46 percent, and 47 percent of Europe’s net operating revenues during 2006, 2005, and 2004, respectively. (C) In 2006, our operating income in North America, Europe, and Corporate included restructuring charges totaling $16 million, $40 million, and $10 million, respectively. Our operating income in North America
also included a $2.9 billion non-cash impairment charge to reduce the carrying amount of our North American franchise license intangible assets to their estimated fair value. Our Corporate operating income included a $35 million increase in compensation expense related to adoption of SFAS 123R on January 1, 2006 and expenses totaling $14 million related to the settlement of litigation. For additional informa-tion about the non-cash franchise impairment charge, the adoption of SFAS 123R, and our restructuring activities, refer to Notes 1, 11, and 16, respectively.
(D) In 2005, our operating income in North America, Europe, and Corporate included restructuring charges totaling $40 million, $5 million, and $35 million, respectively. Our operating income in North America also included (1) a reduction in our cost of sales from the receipt of $53 million in proceeds related to the settlement of litigation against suppliers of HFCS and (2) a $28 million charge for asset write-offs associated with damage caused by Hurricanes Katrina, Rita, and Wilma.
(E) In 2005, our interest expense included an $8 million net loss resulting from the early extinguishment of certain debt obligations in conjunction with the repatriation of non-U.S. earnings.(F) In 2004, our operating income in North America included a $41 million increase in our cost of sales related to the transition to a new concentrate price structure with TCCC.
NOTE 16RESTRUCTURING ACTIVITES
During the years ended December 31, 2006 and 2005, we recorded restructuring charges totaling $66 million and $80 mil-lion, respectively. These charges, included in SD&A expenses, were primarily related to (1) workforce reductions associated with the reorganization of our North American operations into six United States business units and Canada; (2) the reorganiza-tion of certain aspects of our operations in Europe; (3) changes in our executive management; and (4) the elimination of certain corporate headquarters positions. The reorganization of our North American operations (1) has resulted in a simplifi ed and fl atter organizational structure; (2) has helped facilitate a closer interaction between our front-line employees and our customers; and (3) will provide long-term cost savings through improved administrative and operating effi ciencies. Similarly, the reorgani-zation of certain aspects of our operations in Europe has helped improve operating effectiveness and effi ciency while enabling our front-line employees to better meet the needs of our cus-tomers. We were substantially complete with these restructuring activities by the end of 2006.
The following table summarizes our restructuring activities for the years ended December 31, 2006 and 2005 (in millions):
Consulting, Severance Pay Relocation, and Benefi ts and Other TotalBalance at December 31, 2004 $ – $ – $ – Provision 61 19 80 Cash payments (18) (19) (37) Non-cash (10) – (10)Balance at December 31, 2005 33 – 33 Provision 45 21 66 Cash payments (41) (14) (55) Non-cash (4) – (4)Balance at December 31, 2006 $ 33 $ 7 $ 40

Coca-Cola Enterprises Inc. – 2006 Form 10-K 65
The following table summarizes the total restructuring costs incurred by operating segment for the years ended December 31, 2006 and 2005 (in millions):
2006 2005North America $16 $40Europe 40 5Corporate 10 35Consolidated $66 $80
NOTE 17OTHER EVENTS
Central AcquisitionOn February 28, 2006, we acquired the bottling operations of Central Coca-Cola Bottling Company, Inc. (“Central”) for a total purchase price of $106 million, net of cash acquired. The acquisition of Central, which operates in parts of Virginia, West Virginia, Pennsylvania, Maryland, and Ohio, bolsters our customer and supply chain alignment in the United States. Based upon our preliminary purchase price allocation, we have assigned a value of $6 million to customer relationships, $81 million to franchise license rights, and $28 million to non-deductible goodwill. The value of the customer relationships is being amortized over a period of 15 years. We have assigned an indefi nite life to the franchise license rights since our domes-tic cola franchise license agreements with TCCC do not expire and our domestic non-cola franchise license agreements with TCCC can be renewed for additional terms with minimal cost (refer to Note 1 for additional information about our franchise license agreements with TCCC). The preliminary purchase price allocation is subject to change and will be revised, as necessary, based upon the fi nal determination of the fair value of the assets and liabilities assumed as of the date of the acquisition. In connection with this acquisition, we recorded a liability as of the acquisition date totaling $1 million for costs associated with the severance and relocation of certain Central employees and the elimination of duplicate facilities. The oper-ating results of Central have been included in our Consolidated Statement of Operations since the date of acquisition. This acquisition did not have a material impact on our Consolidated Financial Statements.
HurricanesDuring the latter part of 2005, Hurricanes Katrina, Rita, and Wilma negatively impacted our operations throughout the areas affected by the hurricanes. We sustained damage to several of our production and distribution facilities and had large quantities of vending equipment and inventory damaged or destroyed. We also experienced increased costs in the aftermath of the hurricanes, including higher fuel prices, non-productive labor expenses, outsourced services, and extra storage space. As a result of these hurricanes, we recorded charges totaling $28 million during 2005, primarily related to (1) the write-off of damaged or destroyed fi xed assets; (2) the estimated costs to retrieve and dispose of non-usable vend-ing equipment; and (3) the loss of inventory. Approximately $26 million of the charges were included in SD&A and the remainder were recorded in cost of sales.
Bravo! FoodsIn August 2005, we entered into a master distribution agreement (“MDA”) with Bravo! Foods (“Bravo”). Bravo is a producer and distributor of branded, shelf stable, fl avored milk products. The MDA is effective October 31, 2005 through August 15, 2015 and may be terminated by either party subsequent to August 15, 2006, subject to a twelve-month notifi cation period. In conjunction with the execution of this agreement, we received from Bravo a warrant to purchase up to 30 million shares of Bravo common stock at $0.36 per share. The warrant is exercisable in whole or in part at any time until August 31, 2008. The estimated fair value of the warrant on the date received was approximately $14 million. We attributed the value of the warrant received to the MDA and are recognizing this amount on a straight-line basis as a reduction to cost of sales over the term of the MDA. On the date the warrant was received, the 30 million shares repre-sented approximately 19 percent of Bravo’s outstanding common stock. We account for the warrant at cost due to the limited market for Bravo shares. As of December 31, 2006, the warrant had an estimated fair value of approximately $4 million. We have concluded that the unrealized loss on this warrant is temporary and we have the intent and ability to continue to hold this investment.
NOTE 18SUBSEQUENT EVENT
In February 2007, we announced a restructuring program to support the implementation of key strategic initiatives designed to achieve long-term sustainable growth. This restructuring program will impact certain aspects of our North American and European operations as well as our cor-porate headquarters. Through this restructuring program we will (1) enhance standardization in our operating structure and business practices; (2) create a more effi cient supply chain and order fulfi llment structure; and (3) improve customer ser-vice in North America through the implementation of a new selling system for smaller customers. These restructuring activities are expected to result in a charge of approximately $300 million, including transition costs, and a net job reduc-tion of approximately 5 percent of our total workforce, or approximately 3,500 positions. The majority of the expense is expected to be recognized in 2007 and 2008.

66 Coca-Cola Enterprises Inc. – 2006 Form 10-K
NOTE 19QUARTERLY FINANCIAL INFORMATION (UNAUDITED)
The following table summarizes our quarterly fi nancial information for the years ended December 31, 2006 and 2005 (in millions, except per share data):
2006 First(A) Second(B) Third(C) Fourth(D) Fiscal YearNet operating revenues $ 4,333 $ 5,467 $ 5,218 $ 4,786 $ 19,804Gross profi t 1,737 2,176 2,037 1,868 7,818Operating income (loss) 176 539 448 (2,658) (1,495)Net income (loss) 16 339 213 (1,711) (1,143)Basic net income (loss) per share(E) $ 0.03 $ 0.71 $ 0.45 $ (3.59) $ (2.41)Diluted net income (loss) per share(E) $ 0.03 $ 0.71 $ 0.44 $ (3.59) $ (2.41)
2005 First Second(B) Third(C) Fourth(D) Fiscal YearNet operating revenues $ 4,203 $ 5,138 $ 4,907 $ 4,495 $ 18,743Gross profi t 1,685 2,120 1,985 1,768 7,558Operating income 220 582 423 206 1,431Net income (loss) 46 333 192 (57) 514Basic net income (loss) per share(E) $ 0.10 $ 0.71 $ 0.41 $ (0.12) $ 1.09Diluted net income (loss) per share(E) $ 0.10 $ 0.70 $ 0.40 $ (0.12) $ 1.08
(A) Net income in the fi rst quarter of 2006 included a $39 million ($26 million net of tax, or $0.06 per diluted common share) charge for restructuring activities, primarily in Europe, and an $8 million ($5 million net of tax, or $0.01 per diluted common share) increase in compensation expense as a result of adopting SFAS 123R.
(B) Net income in the second quarter of 2006 included (1) an $8 million ($5 million net of tax, or $0.01 per diluted common share) charge for restructuring activities, primarily in Europe; (2) a $9 million ($6 million net of tax, or $0.01 per diluted common share) increase in compensation expense as a result of adopting SFAS 123R; and (3) a $71 million ($0.15 per diluted common share) tax benefi t for state tax law changes and Canadian federal and provincial tax rate changes. Net income in the second quarter of 2005 included (1) a $48 million ($30 million net of tax, or $0.06 per diluted common share) decrease in our cost of sales from the receipt of proceeds related to the settlement of litigation against suppliers of HFCS; (2) an $8 million ($5 million net of tax, or $0.01 per diluted common share) charge for restructuring activi-ties, primarily in North America; and (3) a $34 million ($0.07 per diluted common share) tax benefi t primarily due to state tax rate changes.
(C) Net income in the third quarter of 2006 included a $5 million ($3 million net of tax, or $0.01 per diluted common share) charge for restructuring activities, primarily in Europe, and a $9 million ($6 million net of tax, or $0.01 per diluted common share) increase in compensation expense as a result of adopting SFAS 123R. Net income in the third quarter of 2005 included a $24 million ($15 million net of tax, or $0.04 per diluted common share) charge for restructuring activities, primarily in North America, and a $24 million ($15 million net of tax, or $0.03 per diluted common share) charge for asset write-offs associated with damage caused by Hurricanes Katrina, Rita, and Wilma.
(D) Net income in the fourth quarter of 2006 included (1) a $2.9 billion ($1.8 billion net of tax, or $3.80 per common share) non-cash impairment charge to reduce the carrying amount of our North American franchise license intangible assets to their estimated value; (2) a $14 million ($10 million net of tax, or $0.02 per common share) charge for restructuring activities, primarily in Europe; (3) a $9 million ($5 million net of tax, or $0.01 per common share) increase in compensation expense as a result of adopting SFAS 123R; (4) a $14 million ($8 million net of tax, or $0.02 per common share) expense related to the settlement of litigation; and (5) a $24 million ($0.05 per common share) tax benefi t for state tax law changes, Canadian federal and provincial tax rate changes, and the revaluation of various income tax obligations. Net income in the fourth quarter of 2005 included (1) a $5 million ($3 million net of tax, or $0.01 per diluted common share) decrease in our cost of sales from the receipt of proceeds related to the settlement of litigation against suppliers of HFCS; (2) a $48 million ($30 million net of tax, or $0.06 per diluted common share) charge for restructuring activities, primarily in North America; (3) a $4 million ($2 million net of tax) charge for asset write-offs associated with damage caused by Hurricanes Katrina, Rita, and Wilma; (4) a $128 million ($0.27 per diluted common share) income tax provision related to the repatriation of non-U.S. earnings; (5) an $8 million ($5 million net of tax, or $0.01 per diluted common share) net loss resulting from the early extinguishment of certain debt obligations in conjunction with the repatriation of non-U.S. earnings; and (6) a $32 million ($0.06 per diluted common share) tax benefi t primarily for state tax rate changes and for the revaluation of various income tax obligations.
(E) Basic and diluted earnings per share are computed independently for each of the quarters presented. As such, the summation of the quarterly amounts may not equal the total basic and diluted earnings per share reported for the year.
ITEM 9. CHANGES IN AND DISAGREEMENTS WITH ACCOUNTANTS ON ACCOUNTING AND FINANCIAL DISCLOSURE
Not applicable.
ITEM 9A. CONTROLS AND PROCEDURES
Coca-Cola Enterprises Inc., under the supervision and with the participation of management, including the chief executive offi cer and the chief fi nancial offi cer, evaluated the effective-ness of our “disclosure controls and procedures” (as defi ned in Rule 13a-15(e) under the Securities Exchange Act of 1934 (the “Exchange Act)”) as of the end of the period covered by this report. Based on that evaluation, the chief executive offi -cer and the chief fi nancial offi cer concluded that our disclosure controls and procedures are effective in timely making known to them material information required to be disclosed in our
reports fi led or submitted under the Exchange Act. During the fourth quarter of 2006, we successfully implemented a new accounts receivable system in the United States. As a result, certain processes were standardized across the United States. Other than the implementation of this system, there has been no change in our internal control over fi nancial report-ing during the quarter ended December 31, 2006 that has materially affected, or is reasonably likely to materially affect, our internal control over fi nancial reporting.
See “FINANCIAL STATEMENTS AND SUPPLEMENTARY DATA – Report of Management and Report of Independent Registered Public Accounting Firm on Internal Control Over Financial Reporting” in ITEM 8.
ITEM 9B. OTHER INFORMATION
Not applicable.

Coca-Cola Enterprises Inc. – 2006 Form 10-K 67
PART III ITEM 10. DIRECTORS, EXECUTIVE OFFICERS AND CORPORATE GOVERNANCE
Information about our directors is in our 2007 Proxy Statement under the heading “Governance of the Company — Current Board of Directors and Nominees for Election” and is incor-porated into this report by reference.
Information about compliance with the reporting requirements of Section 16(a) of the Securities Exchange Act of 1934, as amended, by our executive offi cers and directors, persons who own more than ten percent of our common stock, and their affi liates who are required to comply with such reporting require-ments, is in our 2007 Proxy Statement under the heading “Security Ownership of Directors and Offi cers — Section 16(a) Benefi cial Ownership Reporting Compliance,” and information about the Audit Committee and the Audit Committee Financial Expert is in our 2007 Proxy Statement under the heading “Governance of the Company — Committees of the Board — Audit Committee,” all of which is incorporated into this report by reference.
The information required by this item concerning our executive offi cers is contained in this report in Part I, Item 1, “BUSINESS – EXECUTIVE OFFICERS OF THE REGISTRANT.”
We have adopted a Code of Business Conduct for our employees and directors, including, specifi cally our executive offi cers. A copy of the code is posted on our website (http://www.cokecce.com). If we amend the code, or grant any waivers under the code, that are applicable to our directors, chief executive offi cer, or other persons subject to our securities trading policy – which we do not anticipate doing – then we will promptly post that amendment or waiver on our website.
ITEM 11. EXECUTIVE COMPENSATION
Information about director compensation is in our 2007 Proxy Statement under the heading “Governance of the Company — Director Compensation,” and information about executive compensation is in our 2007 Proxy Statement under the head-ing “Executive Compensation,” all of which is incorporated into this report by reference.
ITEM 12. SECURITY OWNERSHIP OF CERTAIN BENEFICIAL OWNERS AND MANAGEMENT AND RELATED STOCKHOLDER MATTERS
Information about securities authorized for issuance under equity compensation plans is in our 2007 Proxy Statement under the heading “Equity Compensation Plan Information,” and information about ownership of our common stock by certain persons is in our 2007 Proxy Statement under the headings “Principal Shareowners” and “Security Ownership of Directors and Offi cers,” all of which is incorporated into this report by reference.
ITEM 13. CERTAIN RELATIONSHIPS AND RELATED TRANSACTIONS, AND DIRECTOR INDEPENDENCE
Information about certain transactions between us, The Coca-Cola Company and its affi liates, and certain other persons is in our 2007 Proxy Statement under the heading “Certain Relationships and Related Transactions” and is incorporated into this report by reference.
ITEM 14. PRINCIPAL ACCOUNTANT FEES AND SERVICES
Information about the fees and services provided to us by Ernst & Young LLP is in our 2007 Proxy Statement under the heading “Matters that May be Brought before the Annual Meeting – Ratifi cation of Appointment of Independent Registered Public Accounting Firm” and is incorporated into this report by reference.

68 Coca-Cola Enterprises Inc. – 2006 Form 10-K
PART IV ITEM 15. EXHIBITS AND FINANCIAL STATEMENT SCHEDULES
(a) (1) Financial Statements.
The following documents are fi led as a part of this report:
Report of Management.
Report of Independent Registered Public Accounting Firm on Financial Statements.
Report of Independent Registered Public Accounting Firm on Internal Control Over Financial Reporting.
Consolidated Statements of Operations – Years ended December 31, 2006, 2005, and 2004.
Consolidated Balance Sheets – December 31, 2006 and 2005.
Consolidated Statements of Cash Flows – Years ended December 31, 2006, 2005, and 2004.
Consolidated Statements of Shareowners’ Equity – Years ended December 31, 2006, 2005, and 2004.
Notes to Consolidated Financial Statements.
(2) Financial Statement Schedules.
The following fi nancial statement schedule is included in this report:
Schedule II – Valuation and Qualifying Accounts for the years ended December 31, 2006, 2005, and 2004. Pg. 74
All other schedules for which provision is made in the applicable accounting regulations of the Securities and Exchange Commission have been omitted either because they are not required under the related instructions or because they are not applicable.
(3) Exhibits.
ExhibitNumber Description
Incorporated by Reference or Filed Herewith. Our Current, Quarterly, and Annual Reports are fi led with the Securities and Exchange Commission
under File No. 01-09300. Our Registration Statements have the fi le numbers noted wherever such statements are identifi ed in the exhibit listing.
3.1 — Restated Certifi cate of Incorporation of Coca-Cola Enterprises (restated as of April 15, 1992) as amended by Certifi cate of Amendment dated April 21, 1997 and by Certifi cate of Amendment dated April 26, 2000.
Exhibit 3 to our Current Report on Form 8-K (Date of Report: July 22, 1997); Exhibit 3.1 to our Quarterly Report on Form 10-Q for the fi scal quarter ended March 31, 2000.
3.2 — Bylaws of Coca-Cola Enterprises, as amended through February 9, 2007.
Exhibit 3(ii) to our Current Report on Form 8-K (Date of Report: February 9, 2007).
4.1 — Indenture dated as of July 30, 1991, together with the First Supplemental Indenture thereto dated January 29, 1992, between Coca-Cola Enterprises and The Chase Manhattan Bank, formerly known as Chemical Bank (successor by merger to Manufacturers Hanover Trust Company), as Trustee, with regard to certain unsecured and unfunded debt securities of Coca-Cola Enterprises, and forms of notes and debentures issued thereunder.
Exhibit 4.1 to our Current Report on Form 8-K (Date of Report: July 30, 1991); Exhibits 4.01 and 4.02 to our Current Report on Form 8-K (Date of Report: January 29, 1992); Exhibit 4.1 to our Current Report on Form 8-K (Date of Report: September 8, 1992); Exhibit 4.01 to our Current Report on Form 8-K (Date of Report: September 15, 1993); Exhibit 4.01 to our Current Report on Form 8-K (Date of Report: May 12, 1995); Exhibit 4.01 to our Current Report on Form 8-K (Date of Report: September 25, 1996); Exhibit 4.01 to our Current Report on Form 8-K (Date of Report: October 3, 1996); Exhibit 4.01 to our Current Report on Form 8-K (Date of Report: November 15, 1996); Exhibit 4.3 to our Current Report on Form 8-K (Date of Report: July 22, 1997); Exhibit 4.01 to our Current Report on Form 8-K (Date of Report: December 2, 1997); Exhibit 4.01 to our Current Report on Form 8-K (Date of Report: January 6, 1998); Exhibit 4.01 to our Current Report on Form 8-K (Date of Report: May 13, 1998); Exhibit 4.01 to our Current Report on Form 8-K (Date of Report: September 8, 1998); Exhibit 4.01 to our Current Report on Form 8-K (Date of Report: September 18, 1998); Exhibit 4.01 to our Current Report on Form 8-K (Date of Report: October 28, 1998); Exhibit 4.01 to our Current Report on Form 8-K/A (Date of Report: September 16, 1999); Exhibit 4.02 to our Current Report on Form 8-K (Date of Report: August 9, 2001); Exhibit 4.01 to our Current Report on Form 8-K (Date of Report: September 9, 2002); Exhibit 4.02 to our Current Report on Form 8-K (Date of Report: September 29, 2003).

Coca-Cola Enterprises Inc. – 2006 Form 10-K 69
ExhibitNumber Description
Incorporated by Reference or Filed Herewith. Our Current, Quarterly, and Annual Reports are fi led with the Securities and Exchange Commission
under File No. 01-09300. Our Registration Statements have the fi le numbers noted wherever such statements are identifi ed in the exhibit listing.
4.2 — Instrument of Resignation of Resigning Trustee, Appointment of Successor Trustee and Acceptance among Coca-Cola Enterprises, JPMorgan Chase Bank, and Deutsche Bank Trust Company Association, dated as of December 1, 2006.
Filed herewith.
4.3 — Medium-Term Notes Issuing and Paying Agency Agreement dated as of October 24, 1994, between Coca-Cola Enterprises and The Chase Manhattan Bank, formerly known as Chemical Bank, as issuing and paying agent, including as Exhibit B thereto the form of Medium-Term Note issuable thereunder.
Exhibit 4.2 to our Annual Report on Form 10-K for the fi scal year ended December 31, 1994.
4.4 — Five Year Credit Agreement among Coca-Cola Enterprises, Coca-Cola Enterprises (Canada) Bottling Finance Company, the initial Lenders named therein, and Citibank, N.A. as Administrative Agent and Bank of America, N.A. and Deutsche Bank Securities Inc., as Co-Syndication Agents.
Filed herewith.
Certain instruments which defi ne the rights of holders of long-term debt of the Company and its subsidiaries are not being fi led because the total amount of securities authorized under each such instrument does not exceed 10% of the total consolidated assets of the Company and its subsidiaries. The Company and its subsidiaries hereby agree to furnish a copy of each such instrument to the Commission upon request.
10.1 — Coca-Cola Enterprises 1997 Stock Option Plan.* Exhibit 10.11 to our Annual Report on Form 10-K for the fi scal year ended December 31, 1997.
10.2 — Coca-Cola Enterprises 1999 Stock Option Plan.* Exhibit 10.12 to our Annual Report on Form 10-K for the fi scal year ended December 31, 1999.
10.3 — Coca-Cola Enterprises Executive Pension Plan (Amended and Restated January 1, 2002).*
Exhibit 10.8 to our Annual Report on Form 10-K for the fi scal year ended December 31, 2002.
10.4 — 1997 Director Stock Option Plan.* Exhibit 10.26 to our Annual Report on Form 10-K for the fi scal year ended December 31, 1997.
10.5 — Coca-Cola Enterprises 2001 Restricted Stock Award Plan.* Exhibit 10.17 to our Annual Report on Form 10-K for the fi scal year ended December 31, 2001.
10.6 — Coca-Cola Enterprises 2001 Stock Option Plan.* Exhibit 10.18 to our Annual Report on Form 10-K for the fi scal year ended December 31, 2001.
10.7 — Coca-Cola Enterprises Executive Management Incentive Plan (Effective January 1, 2005).*
Exhibit 99.1 to our Current Report on Form 8-K (Date of Report: April 29, 2005).
10.8 — Coca-Cola Enterprises Inc. Supplemental Matched Employee Savings and Investment Plan (Amended and Restated January 1, 2002).*
Exhibit 10.15 to our Annual Report on Form 10-K for the fi scal year ended December 31, 2002.
10.9 — Coca-Cola Enterprises Executive Retiree Medical Plan.* Exhibit 10.20 to our Annual Report on Form 10-K for the fi scal year endedDecember 31, 2002.
10.10 — Form of Stock Option Agreement under the Coca-Cola Enterprises 2001 Stock Option Plan.*
Exhibit 99.1 to our Current Report on Form 8-K (Date of Report: December 13, 2004).
10.11 — Form of Stock Option Agreement for Nonemployee Directors under the Coca-Cola Enterprises 2001 Stock Option Plan.*
Exhibit 99.2 to our Current Report on Form 8-K (Date of Report: December 13, 2004).
10.12 — Form of Restricted Stock Award Agreement under the Coca-Cola Enterprises 2001 Restricted Stock Award Plan.*
Exhibit 99.3 to our Current Report on Form 8-K (Date of Report: December 13, 2004).
10.13 — Coca-Cola Enterprises 2004 Stock Award Plan.* Exhibit 10.18 to our Annual Report on Form 10-K for the fi scal year ended December 31, 2004.

70 Coca-Cola Enterprises Inc. – 2006 Form 10-K
ExhibitNumber Description
Incorporated by Reference or Filed Herewith. Our Current, Quarterly, and Annual Reports are fi led with the Securities and Exchange Commission
under File No. 01-09300. Our Registration Statements have the fi le numbers noted wherever such statements are identifi ed in the exhibit listing.
10.14 — Form of Deferred Stock Unit Award Agreement in connection with the 2004 Stock Award Plan.*
Exhibit 99.1 to our Current Report on Form 8-K (Date of Report: April 25, 2005).
10.15 — Form of Stock Option Grant Agreement in connection with the 2004 Stock Award Plan.*
Exhibit 99.2 to our Current Report on Form 8-K (Date of Report: April 25, 2005).
10.16 — Form of Stock Option Grant to Nonemployee Directors Agreement in connection with the 2004 Stock Award Plan.*
Exhibit 99.3 to our Current Report on Form 8-K (Date of Report: April 25, 2005).
10.17 — Form of Restricted Stock Award Agreement in connection with the 2004 Stock Award Plan.*
Exhibit 99.4 to our Current Report on Form 8-K (Date of Report: April 25, 2005).
10.18 — Summary Plan Description for Coca-Cola Enterprises Executive Long-Term Disability Plan.*
Filed herewith.
10.19 — Executive Severance Guidelines approved by the Compensation Committee of the Board of Directors on October 25, 2005.*
Exhibit 10.1 to our Current Report on Form 8-K (Date of Report: October 25, 2005).
10.20 — Consulting Agreement between Coca-Cola Enterprises and Lowry F. Kline, effective October 25, 2006.*
Filed herewith.
10.21 — Letter dated April 25, 2006 from Coca-Cola Enterprises Inc. to John F. Brock.*
Exhibit 10 to Current Report on Form 8-K (Date of Report: April 25, 2006).
10.22 — Form of Stock Option Agreement (Chief Executive Offi cer).* Exhibit 10.1 to Current Report on Form 8-K (Date of Report: August 3, 2006).
10.23 — Form of Deferred Stock Unit Agreement (Chief Executive Offi cer) in connection with the 2004 Stock Award Plan.*
Filed herewith.
10.24 — Form of Stock Option Grant Agreement (Senior Offi cers) in connection with the 2004 Stock Award Plan.*
Exhibit 10.3 to Current Report on Form 8-K (Date of Report: August 3, 2006).
10.25 — Form of Deferred Stock Unit Agreement (Senior Offi cers) in connection with the 2004 Stock Award Plan.*
Filed herewith.
10.26 — Form of Stock Option Grant Agreement (Senior Offi cers residing in the United Kingdom) in connection with the 2004 Stock Award Plan.*
Exhibit 10.5 to Current Report on Form 8-K (Date of Report: August 3, 2006).
10.27 — Form of Deferred Stock Unit Agreement (Senior Offi cers residing in the United Kingdom) in connection with the 2004 Stock Award Plan.*
Filed herewith.
10.28 — Form of Director Deferred Stock Unit Award Agreement.* Exhibit 10.1 to Current Report on Form 8-K (Date of Report: October 23, 2006).
10.29 — Coca-Cola Enterprises Deferred Compensation Plan for Nonemployee Directors (As Amended and Restated effective January 1, 2005).*
Exhibit 10.2 to Current Report on Form 8-K (Date of Report: October 23, 2006).
10.30 — Coca-Cola Enterprises Stock Deferral Plan (As Amended and Restated Effective January 1, 2005).*
Exhibit 10.1 to Current Report on Form 8-K (Date of Report: December 14, 2006).
10.31 — Tax Sharing Agreement dated November 12, 1986 between Coca-Cola Enterprises and The Coca-Cola Company.
Exhibit 10.1 to our Registration Statement on Form S-1, No. 33-9447.
10.32 — Registration Rights Agreement dated November 12, 1986 between Coca-Cola Enterprises and The Coca-Cola Company.
Exhibit 10.3 to our Registration Statement on Form S-1, No. 33-9447.
10.33 — Registration Rights Agreement dated as of December 17, 1991 among Coca-Cola Enterprises, The Coca-Cola Company and certain stockholders of Johnston Coca-Cola Bottling Group named therein.
Exhibit 10 to our Current Report on Form 8-K (Date of Report: December 18, 1991).
10.34 — Form of Bottle Contract. Exhibit 10.24 to our Annual Report on Form 10-K for the fi scal year ended December 30, 1988.
10.35 — Sweetener Sales Agreement – Bottler between The Coca-Cola Company and various Coca-Cola Enterprises bottlers, dated October 15, 2002.
Exhibit 10.1 to our Quarterly Report on Form 10-Q for the quarter ended September 27, 2002.

Coca-Cola Enterprises Inc. – 2006 Form 10-K 71
ExhibitNumber Description
Incorporated by Reference or Filed Herewith. Our Current, Quarterly, and Annual Reports are fi led with the Securities and Exchange Commission
under File No. 01-09300. Our Registration Statements have the fi le numbers noted wherever such statements are identifi ed in the exhibit listing.
10.36 — Can Supply Agreement, dated as of January 1, 1999, between American National Can Company and Coca-Cola Enterprises.**
Exhibit 10.1 to the Quarterly Report on Form 10-Q fi led by American National Can Group, Inc. with the Securities and Exchange Commission under File No. 1-15163, for the period ended September 30, 1999.
10.37 — Amendment to Can Supply Agreement, dated as of June 25, 2002, between Rexam Beverage Can Company and Coca-Cola Enterprises.**
Exhibit 99 to our Registration Statement on Form S-3, No. 333-100543.
10.38 — Amendment (Letter Agreement) to Can Supply Agreement dated June 25, 2002 between Rexam Beverage Can Company and Coca-Cola Enterprises.**
Exhibit 10.28 to our Annual Report on Form 10-K for the fi scal year ended December 31, 2004.
10.39 — Amendment (Letter Agreement) to Can Supply Agreement, dated September 3, 2003, between Rexam Beverage Can Company and Coca-Cola Enterprises.**
Exhibit 10.29 to our Annual Report on Form 10-K for the fi scal year ended December 31, 2004.
10.40 — Share Repurchase Agreement dated January 1, 1991 between The Coca-Cola Company and Coca-Cola Enterprises.
Exhibit 10.44 to our Annual Report on Form 10-K for the fi scal year ended December 28, 1990.
10.41 — Form of Bottler’s Agreement. Exhibit 10.33 to our Annual Report on Form 10-K for the fi scal year ended December 31, 1996.
10.42 — Supplemental Agreement with effect from October 6, 2000 among The Coca-Cola Company, The Coca-Cola Export Corporation, Bottling Holdings (Netherlands) B.V., Coca-Cola Enterprises Belgium, Coca-Cola Enterprise, Coca-Cola Enterprises Nederland B.V., Coca-Cola Enterprises Limited, and La Société de Boissons Gazeuses de la Côte d’Azur, S.A.
Exhibit 10.30 to our Annual Report on Form 10-K for the fi scal year ended December 31, 2000.
10.43 — 1999 –2008 Cold Drink Equipment Purchase Partnership Program for the United States between Coca-Cola Enterprises and The Coca-Cola Company, as amended and restated January 23, 2002.**
Exhibit 10.1 to our Current Report on Form 8-K (Date of Report: January 23, 2002); Exhibit 10.1 to our Current Report on Form 8-K/A (Amendment No. 1) (Date of Report: January 23, 2002).
10.44 — Letter Agreement dated August 9, 2004 amending the 1999 – 2010 Cold Drink Equipment Purchase Partnership Program (United States).**
Exhibit 10.3 to our Quarterly Report on Form 10-Q for the quarter ended July 2, 2004.
10.45 — Letter agreement, dated December 20, 2005, by and between Coca-Cola Enterprises and The Coca-Cola Company, amending and restating 1999 – 2010 Cold Drink Equipment Purchase Partnership Program.**
Exhibit 10.1 to our Current Report on Form 8-K (Date of Report: December 20, 2005).
10.46 — Cold Drink Equipment Purchase Partnership Program for Europe between Coca-Cola Enterprises and The Coca-Cola Company, as amended and restated January 23, 2002.**
Exhibit 10.2 to our Current Report on Form 8-K (Date of Report: January 23, 2002); Exhibit 10.2 to our Current Report on Form 8-K/A (Amendment No. 1) (Date of Report: January 23, 2002).
10.47 — Amendment dated February 8, 2005 between Coca-Cola Enterprises and The Coca-Cola Export Corporation to Cold Drink Equipment Purchase Partnership Program of January 23, 2002.**
Exhibit 10 to our Current Report on Form 8-K (Date of Report: February 8, 2005); Exhibit 10 to our Current Report on Form 8-K/A (Amendment No. 1) (Date of Report: February 8, 2005).
10.48 — 1998 –2008 Cold Drink Equipment Purchase Partnership Program for Canada between Coca-Cola Enterprises and The Coca-Cola Company, as amended and restated January 23, 2002.**
Exhibit 10.3 to our Current Report on Form 8-K (Date of Report: January 23, 2002); Exhibit 10.3 to our Current Report on Form 8-K/A (Amendment No. 1) (Date of Report: January 23, 2002).
10.49 — Letter Agreement dated August 9, 2004 amending the 1999 –2010 Cold Drink Equipment Purchase Partnership Program (Canada).**
Exhibit 10.4 to our Quarterly Report on Form 10-Q for the quarter ended July 2, 2004.
10.50 — Letter Agreement dated December 20, 2005, by and between Coca-Cola Bottling Company and Coca-Cola Ltd., amending and restating 1998 –2010 Cold Drink Equipment Purchase Partnership Program.**
Exhibit 10.2 to our Current Report on Form 8-K (Date of Report: December 20, 2005).

72 Coca-Cola Enterprises Inc. – 2006 Form 10-K
ExhibitNumber Description
Incorporated by Reference or Filed Herewith. Our Current, Quarterly, and Annual Reports are fi led with the Securities and Exchange Commission
under File No. 01-09300. Our Registration Statements have the fi le numbers noted wherever such statements are identifi ed in the exhibit listing.
10.51 — Letter Agreement dated May 1, 2006 from The Coca-Cola Company to Coca-Cola Enterprises Inc. amending the U.S. and Canada Cold Drink Equipment Purchase Partnership Programs.
Exhibit 10.1 to Current Report on Form 8-K (Date of report: May 9, 2006).
10.52 — Agreement for Marketing Programs with The Coca-Cola Company in the former Herb bottling territories, between Coca-Cola Enterprises and The Coca-Cola Company.
Exhibit 10.32 to our Annual Report on Form 10-K for the fi scal year ended December 31, 2001.
10.53 — Growth Initiative Program agreement with The Coca-Cola Company dated April 15, 2002.
Exhibit 10 to our Quarterly Report on Form 10-K for the quarter ended March 29, 2002.
10.54 — Letter agreement dated March 11, 2003 between The Coca-Cola Company and Coca-Cola Enterprises amending Growth Initiative Program agreement dated April 15, 2002.
Exhibit 10.44 to our Current Report on Form 10-K for the fi scal year ended December 31, 2002.
10.55 — Letter Agreement dated July 13, 2004 terminating the Growth Initiative Program, eliminating SMF funding, and providing a new concentrate pricing schedule.
Exhibit 10.1 to our Quarterly Report on Form 10-Q for the quarter ended July 2, 2004.
10.56 — Letter Agreement dated July 13, 2004 between The Coca-Cola Company and Coca-Cola Enterprises establishing a Global Marketing Fund.
Exhibit 10.43 to our Annual Report on Form 10-K for the year ended December 31, 2004.
10.57 — Undertaking from Bottling Holdings (Luxembourg), dated October 19, 2004, relating to various commercial practices that had been under investigation by the European Commission.
Exhibit 99.1 to our Current Report on Form 8-K (Date of Report: October 19, 2004).
10.58 — Final Undertaking from Bottling Holdings (Luxembourg) adopted by European Commission on June 22, 2005.
Exhibit 99.1 to our Current Report on Form 8-K (Date of Report: June 22, 2005).
12 — Statement re computation of ratios. Filed herewith.
21 — Subsidiaries of the Registrant. Filed herewith.
23 — Consent of Independent Registered Public Accounting Firm. Filed herewith.
24 — Powers of Attorney. Filed herewith.
31.1 — Certifi cation by John F. Brock, President and Chief Executive Offi cer of Coca-Cola Enterprises pursuant to §302 of the Sarbanes-Oxley Act of 2002 (15 U.S.C. §7241).
Filed herewith.
31.2 — Certifi cation by William W. Douglas III, Senior Vice President and Chief Financial Offi cer of Coca-Cola Enterprises pursuant to §302 of the Sarbanes-Oxley Act of 2002 (15 U.S.C. §7241).
Filed herewith.
32.1 — Certifi cation by John F. Brock, President and Chief Executive Offi cer of Coca-Cola Enterprises pursuant to §906 of the Sarbanes-Oxley Act of 2002 (15 U.S.C. §1350).
Filed herewith.
32.2 — Certifi cation by William W. Douglas III, Senior Vice President and Chief Financial Offi cer of Coca-Cola Enterprises pursuant to §906 of the Sarbanes-Oxley Act of 2002 (15 U.S.C. §1350).
Filed herewith.
* Management contracts and compensatory plans or arrangements required to be fi led as exhibits to this form pursuant to Item 15(b).
** The fi ler has requested confi dential treatment with respect to portions of this document.
(b) Exhibits
See Item 15(a)(3) above.
(c) Financial Statement Schedules
See item 15(a)(2) above.

Coca-Cola Enterprises Inc. – 2006 Form 10-K 73
SIGNATURES Pursuant to the requirements of Section 13 or 15(d) of the Securities Exchange Act of 1934, the Registrant has duly caused thisreport to be signed on its behalf by the undersigned, thereunto duly authorized.
COCA-COLA ENTERPRISES INC.(Registrant)
By: /S/ JOHN F. BROCK John F. Brock President and Chief Executive Offi cer
Date: February 16, 2007
Pursuant to requirements of the Securities Exchange Act of 1934, this report has been signed below by the following persons on behalf of the Registrant and in the capacities and on the dates indicated.
Signature Title Date
/S/ JOHN F. BROCK President and Chief Executive Offi cer and a Director February 16, 2007 (John F. Brock)
/S/ WILLIAM W. DOUGLAS III Senior Vice President and Chief Financial Offi cer February 16, 2007 (William W. Douglas III) (principal fi nancial offi cer)
/S/ CHARLES D. LISCHER Vice President, Controller and Chief Accounting Offi cer February 16, 2007 (Charles D. Lischer) (principal accounting offi cer)
* Chairman of the Board and a Director February 16, 2007 (Lowry F. Kline)*
* Director February 16, 2007 (Fernando Aguirre)
* Director February 16, 2007 (James E. Copeland, Jr.)
* Director February 16, 2007 (Calvin Darden)
* Director February 16, 2007 (J. Trevor Eyton)
* Director February 16, 2007 (Gary P. Fayard)
* Director February 16, 2007 (Irial Finan)
* Director February 16, 2007 (Marvin J. Herb)
* Director February 16, 2007 (L. Phillip Humann)
* Director February 16, 2007 (Donna A. James)
* Director February 16, 2007 (Summerfi eld K. Johnston, III)
* Director February 16, 2007 (Paula R. Reynolds)
*By: /S/ JOHN J. CULHANE John J. Culhane Attorney-in-Fact

74 Coca-Cola Enterprises Inc. – 2006 Form 10-K
Index to Financial Statement Schedule Page
Schedule II — Valuation and Qualifying Accounts for the years ended December 31, 2006, 2005, and 2004 74
10-K Schedule II – Valuation and Qualifying Accounts
Coca-Cola Enterprises Inc.
(In Millions)
Column A Column B Column C Column D Column E Additions Balance at Charged to Costs Charged to Other Deductions – Balance at Description Beginning of Period and Expenses Accounts – Describe Describe End of Period
Fiscal Year Ended: December 31, 2006 Allowances for losses on trade accounts $ 40 $17 $ – $ 7(A) $50(B)
Valuation allowances for deferred tax assets 74 4 – –(C) 78
Fiscal Year Ended: December 31, 2005 Allowances for losses on trade accounts 43 14 – 17(A) 40(B)
Valuation allowances for deferred tax assets 88 (3) – 11(D) 74
Fiscal Year Ended: December 31, 2004 Allowances for losses on trade accounts 46 2 – 5(A) 43(B)
Valuation allowances for deferred tax assets 125 13 – 50(E) 88
(A) Charge-offs of/adjustments for uncollectible accounts, net. (B) Our allowances for losses on trade accounts receivable represent an estimate for losses related to bad debts and billing adjustments. The deductions presented in this table represent the activity
specifi cally related to bad debts. (C) Valuation allowance increase of $4 million for changes to state net operating loss carryforward assets, offset by a $4 million reduction due to net operating loss expirations. (D) Valuation allowance reductions of $6 million for changes to state net operating loss carryforward assets and $5 million due to net operating loss expirations. (E) Valuation allowance reductions of $29 million for changes to state net operating loss carryforward assets and $21 million due to net operating loss expirations.

Coca-Cola Enterprises Inc. – 2006 Form 10-K 75
Certifications to the New York Stock Exchange and the United States Securities and Exchange CommissionIn 2006, the Company’s Chief Executive Offi cer (“CEO”) made the annual certifi cation to the New York Stock Exchange (“NYSE”) that he was not aware of any violation by the Company of NYSE corporate governance listing standards, and the Company’s CEO and its Chief Financial Offi cer made all certifi cations required to be fi led with the Securities and Exchange Commission regarding the quality of the Company’s public disclosure, including fi ling the certifi cation required under Section 302 of the Sarbanes-Oxley Act of 2002 as exhibits to the Company’s Annual Report on Form 10-K for the year ended December 31, 2006.
Reconciliation of GAAP to Non-GAAP(In millions, except per share data which is calculated prior to rounding) Full-Year 2006 Items Impacting Comparability HFCS Litigation Hurricane Franchise SFAS Gain on Loss on Debt Repatriation Net Reported Settlement Asset Impairment Restructuring Legal 123R Asset Equity Extinguishment Tax Favorable ComparableReconciliation of Income(A) (GAAP) Proceeds Write-Offs Charge Charges Settlements Expense(B) Sale Securities Costs Expense Tax Items (non-GAAP)
Net Operating Revenues $19,804 $ – $ – $ – $ – $ – $ – $ – $ – $ – $ – $ – $19,804 Cost of Sales 11,986 – – – – – – – – – – – 11,986Gross Profit 7,818 – – – – – – – – – – – 7,818 Selling, Delivery, and Administrative Expenses 6,391 – – – (66) (14) – – – – – – 6,311 Franchise Impairment Charge 2,922 – – (2,922) – – – – – – – – –Operating (Loss) Income (1,495) – – 2,922 66 14 – – – – – – 1,507 Interest Expense, Net 633 – – – – – – – – – – – 633 Other Nonoperating Income (Expense), Net 10 – – – – – – – – – – – 10(Loss) Income Before Income Taxes (2,118) – – 2,922 66 14 – – – – – – 884 Income Tax (Benefit) Expense (975) – – 1,110 22 6 – – – – – 95 258Net (Loss) Income $ (1,143) $ – $ – $ 1,812 $ 44 $ 8 $ – $ – $ – $ – $ – $ (95) $ 626
Diluted Net (Loss) Income Per Share $ (2.41) $ – $ – $ 3.80 $0.09 $0.02 $ – $ – $ – $ – $ – $(0.20) $ 1.30
Full-Year 2005 Items Impacting Comparability HFCS Litigation Hurricane Franchise SFAS Gain on Loss on Debt Repatriation Net Reported Settlement Asset Impairment Restructuring Legal 123R Asset Equity Extinguishment Tax Favorable ComparableReconciliation of Income(A) (GAAP) Proceeds Write-Offs Charge Charges Settlements Expense(B) Sale Securities Costs Expense Tax Items (non-GAAP)
Net Operating Revenues $18,743 $ – $ – $ – $ – $ – $ – $ – $ – $ – $ – $ – $18,743 Cost of Sales 11,185 53 (2) – – – – – – – – – 11,236Gross Profit 7,558 (53) 2 – – – – – – – – – 7,507 Selling, Delivery, and Administrative Expenses 6,127 – (26) – (80) – 48 8 – – – – 6,077 Franchise Impairment Charge – – – – – – – – – – – – –Operating (Loss) Income 1,431 (53) 28 – 80 – (48) (8) – – – – 1,430 Interest Expense, Net 633 – – – – – – – – (8) – – 625 Other Nonoperating Income (Expense), Net (8) – – – – – – – 7 – – – (1)(Loss) Income Before Income Taxes 790 (53) 28 – 80 – (48) (8) 7 8 – – 804 Income Tax (Benefit) Expense 276 (20) 11 – 30 – (19) (3) 3 3 (128) 67 220Net (Loss) Income $ 514 $ (33) $ 17 $ – $ 50 $ – $ (29) $ (5) $ 4 $ 5 $ 128 $ (67) $ 584
Diluted Net (Loss) Income Per Share $ 1.08 $(0.07) $0.03 $ – $0.11 $ – $(0.06) $(0.01) $0.01 $0.01 $0.27 $(0.14) $ 1.23
(A) These non-GAAP measures are provided to allow investors to more clearly evaluate our operating performance and business trends. Management uses this information to review results excluding items that are not necessarily indicative of our ongoing results.(B) On January 1, 2006, we adopted SFAS 123R and applied the modified prospective transition method. Under this method, we did not restate any prior periods. During the full year of 2006, we recorded additional compensation expense of $35 million
(pretax) as a result of adopting SFAS 123R. If we had accounted for our share-based payment awards under SFAS 123R during the full year of 2005, our compensation expense would have been higher by approximately $48 million (pretax).
Key Operating InformationFull-Year 2006 Change
Consolidated North America Europe
Net Revenues Per CaseChange in Net Revenues per Case 4.0% 4.0% 2.5% Impact of Belgian Excise Tax Change 0.0% 0.0% 0.5% Impact of Customer Marketing and Other Promotional Adjustments 0.0% 0.0% 0.5% Impact of Excluding Post-Mix Sales, Agency Sales, and Other Revenue (1.0)% (1.0)% (0.5)%Bottle and Can Net Pricing Per Case(A) 3.0% 3.0% 3.0% Impact of Currency Exchange Rate Changes (1.0)% (0.5)% (1.5)%Currency-Neutral Bottle and Can Net Pricing Per Case(C) 2.0% 2.5% 1.5%
Cost of Sales Per CaseChange in Cost of Sales per Case 5.5% 6.0% 3.5% Impact of Belgian Excise Tax Change 0.0% 0.0% 0.5% Impact of HFCS Litigation Settlement Proceeds in 2005 (0.5)% (0.5)% 0.0% Impact of Excluding Bottle and Can Marketing Credits and Jumpstart Funding 1.0% 1.0% 0.0% Impact of Excluding Post-Mix Sales, Agency Sales, and Other Revenue (1.5)% (2.0)% (0.5)%Bottle and Can Cost of Sales Per Case(B) 4.5% 4.5% 3.5% Impact of Currency Exchange Rate Changes (1.0)% (0.5)% (1.5)%Currency-Neutral Bottle and Can Cost of Sales Per Case(C) 3.5% 4.0% 2.0%
Physical Case Bottle and Can VolumeChange in Volume 1.5% 1.0% 3.5% Impact of Acquisition (0.5)% (0.5)% 0.0%Comparable Bottle and Can Volume(D) 1.0% 0.5% 3.5%
(A) The non-GAAP financial measure “Bottle and Can Net Pricing Per Case” is used to more clearly evaluate bottle and can pricing trends in the marketplace. The measure excludes the impact of fountain gallon volume and other items that are not directly associated with bottle and can pricing in the retail environment. Our bottle and can sales accounted for approximately 90 percent of our net revenue during the full-year 2006.
(B) The non-GAAP financial measure “Bottle and Can Cost of Sales Per Case” is used to more clearly evaluate cost trends for bottle and can products. The measure excludes the impact of fountain ingredient costs as well as marketing credits and Jumpstart funding, and allows investors to gain an understanding of the change in bottle and can ingredient and packaging costs.
(C) The non-GAAP financial measures “Currency-Neutral Bottle and Can Net Pricing Per Case” and “Currency-Neutral Bottle and Can Cost of Sales Per Case” are used to separate the impact of currency exchange rate changes on our operations.(D) “Comparable Volume” excludes the impact of acquisitions. The measure is used to analyze the performance of our business on a constant territory basis.

76 Coca-Cola Enterprises Inc. – 2006 Form 10-K
Officers of the Company
JOHN F. BROCKPresident and Chief Executive Officer
JOHN J. CULHANEExecutive Vice President and General Counsel
SHAUN B. HIGGINS Executive Vice President and President, European Group
TERRANCE M. MARKSExecutive Vice President and President, North American Group
VICKI R. PALMER Executive Vice President, Financial Services and Administration
WILLIAM W. DOUGLAS III Senior Vice President and Chief Financial Officer
JOHN H. DOWNS, JR.Senior Vice President, Public Affairs and Communications
GREG A. LEE Senior Vice President, Human Resources
JOHN R. PARKER, JR.Senior Vice President, Strategic Initiatives, North American Group
ESAT SEZERSenior Vice President and Chief Information Officer
SCOTT ANTHONY Vice President, Chief Financial Officer, North American Group
LISTON BISHOP III Vice President, Secretary, and Deputy General Counsel
RICK L. ENGUM Vice President
TIMOTHY W. JOHNSON Vice President, Labor and Employee Relations
DAVID M. KATZ Vice President, Operations Planning and Development
JOYCE KING-LAVINDER Vice President and Treasurer
HAL KRAVITZ Vice President, Business Development, and Chief Revenue Officer
CHARLES D. LISCHER Vice President, Controller and Chief Accounting Officer
DANIEL J. MARKLE Vice President, U.S. Field Sales Operations
H. LYNN OLIVER Vice President, Tax
SUZANNE D. PATTERSONVice President, Internal Audit
JOHN B. PHILLIPS, JR.Vice President and Deputy General Counsel
WILLIAM T. PLYBON Vice President and Deputy General Counsel
TERRI L. PURCELL Vice President, Deputy General Counsel, and Assistant Secretary
MARK W. SCHORTMAN Vice President, North American Sales
EDWARD L. SUTTER Vice President, Supply Chain
CYRIL J. TURNER Vice President, Capital Planning and Value Management
BRIAN E. WYNNE Vice President, North American Human Resources
BottlerA business like Coca-Cola Enterprises that buys concentrates, beverage bases, or syrups, converts them into fi nished packaged products, and markets and distributes them to customers.
Carbonated Soft DrinkNonalcoholic carbonated beverage containing fl avorings and sweeteners. Excludes, among other beverages, waters and fl avored waters, juices and juice drinks, sports drinks, and teas and coffees.
The Coca-Cola SystemThe Coca-Cola Company and its bottling partners, including Coca-Cola Enterprises.
ConcentrateA product manufactured by The Coca-Cola Company or other beverage company sold to bottlers to prepare fi nished beverages through the addition of sweeteners and/or water.
CustomerAn individual store, retail outlet, restaurant, or a chain of stores or businesses that sells or serves our products directly to consumers.
FountainThe system used by retail outlets to dispense product into cups or glasses for immediate consumption.
Market When used in reference to geographic areas, the territory in which we do business, often defi ned by national, regional, or local boundaries.
Coca-Cola Trademark PortfolioAll beverage products, both regular and diet, that include Coca-Cola or Coke in their name.
Noncarbonated BeveragesNonalcoholic noncarbonated beverages including, but not limited to, waters and fl avored waters, juices and juice drinks, sports drinks, and teas and coffees.
Per Capita ConsumptionAverage number of 8-ounce servings consumed per person, per year in a specifi c market.
Return on Invested CapitalIncome before changes in accounting principles (adding back interest expense, net of related taxes) divided by average total capital. We defi ne total capital as book equity plus net debt.
Total Market Value of Common StockCalculated by multiplying our stock price on a certain date by the number of shares outstanding as of the same date.
VolumeThe number of wholesale physical cases of products directly or indirectly sold to our customers. More than 90 percent of Coca-Cola Enterprises’ volume consists of beverage products of The Coca-Cola Company.
Glossary of Terms
Portions of this report printed on recycled paper. © 2007 Coca-Cola Enterprises Inc. “Coca-Cola” is a trademark of The Coca-Cola Company. Designed and produced by Corporate Reports Inc./Atlanta. www.corporatereport.com. Primary photography by Flip Chalfant and J.D. Tyre.

76 Coca-Cola Enterprises Inc. – 2006 Form 10-K
Officers of the Company
JOHN F. BROCKPresident and Chief Executive Officer
JOHN J. CULHANEExecutive Vice President and General Counsel
SHAUN B. HIGGINS Executive Vice President and President, European Group
TERRANCE M. MARKSExecutive Vice President and President, North American Group
VICKI R. PALMER Executive Vice President, Financial Services and Administration
WILLIAM W. DOUGLAS III Senior Vice President and Chief Financial Officer
JOHN H. DOWNS, JR.Senior Vice President, Public Affairs and Communications
GREG A. LEE Senior Vice President, Human Resources
JOHN R. PARKER, JR.Senior Vice President, Strategic Initiatives, North American Group
ESAT SEZERSenior Vice President and Chief Information Officer
SCOTT ANTHONY Vice President, Investor Relations and Planning
LISTON BISHOP III Vice President, Secretary, and Deputy General Counsel
RICK L. ENGUM Vice President and Chief Financial Officer, North American Group
TIMOTHY W. JOHNSON Vice President, Labor and Employee Relations
DAVID M. KATZ Vice President, Operations Planning and Development
JOYCE KING-LAVINDER Vice President and Treasurer
HAL KRAVITZ Vice President, Business Development, and Chief Revenue Officer
CHARLES D. LISCHER Vice President, Controller and Chief Accounting Officer
DANIEL J. MARKLE Vice President, U.S. Field Sales Operations
H. LYNN OLIVER Vice President, Tax
SUZANNE D. PATTERSONVice President, Internal Audit
JOHN B. PHILLIPS, JR.Vice President and Deputy General Counsel
WILLIAM T. PLYBON Vice President and Deputy General Counsel
TERRI L. PURCELL Vice President, Deputy General Counsel, and Assistant Secretary
MARK W. SCHORTMAN Vice President, North American Sales
EDWARD L. SUTTER Vice President and Chief Procurement Officer
CYRIL J. TURNER Vice President, Capital Planning and Value Management
BRIAN E. WYNNE Vice President, North American Human Resources
BottlerA business like Coca-Cola Enterprises that buys concentrates, beverage bases, or syrups, converts them into fi nished packaged products, and markets and distributes them to customers.
Carbonated Soft DrinkNonalcoholic carbonated beverage containing fl avorings and sweeteners. Excludes, among other beverages, waters and fl avored waters, juices and juice drinks, sports drinks, and teas and coffees.
The Coca-Cola SystemThe Coca-Cola Company and its bottling partners, including Coca-Cola Enterprises.
ConcentrateA product manufactured by The Coca-Cola Company or other beverage company sold to bottlers to prepare fi nished beverages through the addition of sweeteners and/or water.
CustomerAn individual store, retail outlet, restaurant, or a chain of stores or businesses that sells or serves our products directly to consumers.
FountainThe system used by retail outlets to dispense product into cups or glasses for immediate consumption.
Market When used in reference to geographic areas, the territory in which we do business, often defi ned by national, regional, or local boundaries.
Coca-Cola Trademark PortfolioAll beverage products, both regular and diet, that include Coca-Cola or Coke in their name.
Noncarbonated BeveragesNonalcoholic noncarbonated beverages including, but not limited to, waters and fl avored waters, juices and juice drinks, sports drinks, and teas and coffees.
Per Capita ConsumptionAverage number of 8-ounce servings consumed per person, per year in a specifi c market.
Return on Invested CapitalIncome before changes in accounting principles (adding back interest expense, net of related taxes) divided by average total capital. We defi ne total capital as book equity plus net debt.
Total Market Value of Common StockCalculated by multiplying the company’s stock price on a certain date by the number of shares outstanding as of the same date.
VolumeThe number of wholesale physical cases of products directly or indirectly sold to our customers. More than 90 percent of Coca-Cola Enterprises’ volume consists of beverage products of The Coca-Cola Company.
Glossary of Terms
Portions of this report printed on recycled paper. © 2007 Coca-Cola Enterprises Inc. “Coca-Cola” is a trademark of The Coca-Cola Company. Designed and produced by Corporate Reports Inc./Atlanta. www.corporatereport.com. Primary photography by Flip Chalfant, John Madere, and Eric Myer.
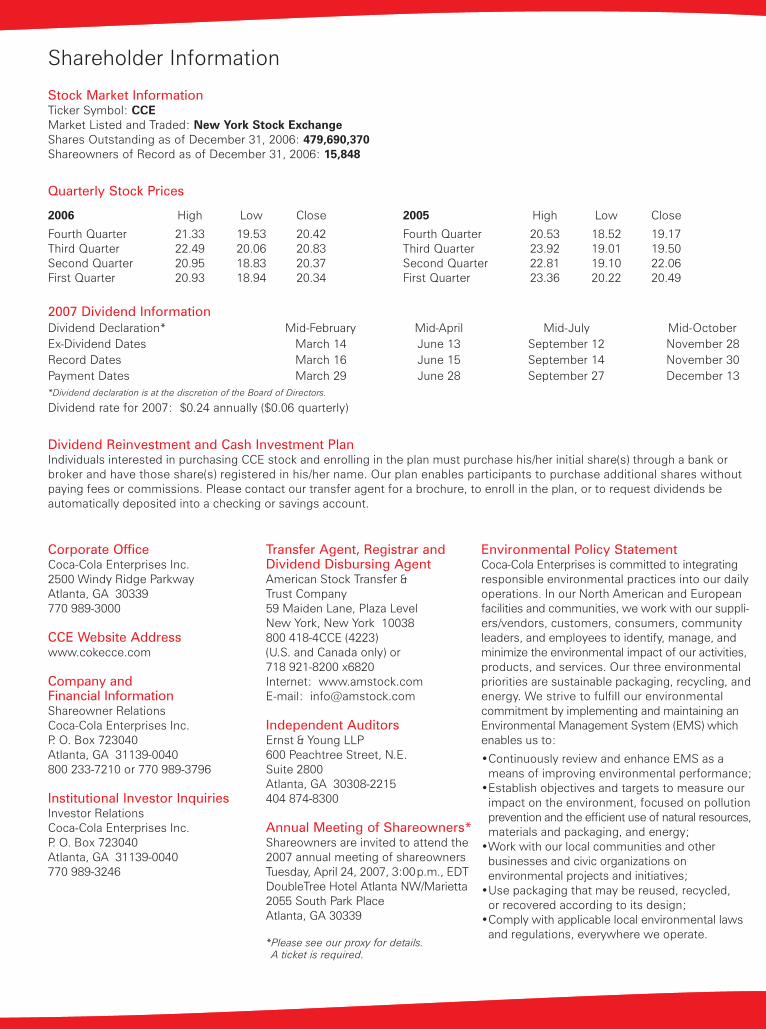
Shareholder Information
Stock Market InformationTicker Symbol: CCEMarket Listed and Traded: New York Stock ExchangeShares Outstanding as of December 31, 2006: 479,690,370Shareowners of Record as of December 31, 2006: 15,848
Quarterly Stock Prices
2006 High Low Close
Fourth Quarter 21.33 19.53 20.42Third Quarter 22.49 20.06 20.83Second Quarter 20.95 18.83 20.37First Quarter 20.93 18.94 20.34
2005 High Low Close
Fourth Quarter 20.53 18.52 19.17Third Quarter 23.92 19.01 19.50Second Quarter 22.81 19.10 22.06First Quarter 23.36 20.22 20.49
2007 Dividend InformationDividend Declaration* Mid-February Mid-April Mid-July Mid-OctoberEx-Dividend Dates March 14 June 13 September 12 November 28Record Dates March 16 June 15 September 14 November 30Payment Dates March 29 June 28 September 27 December 13*Dividend declaration is at the discretion of the Board of Directors.
Dividend rate for 2007: $0.24 annually ($0.06 quarterly)
Dividend Reinvestment and Cash Investment PlanIndividuals interested in purchasing CCE stock and enrolling in the plan must purchase his/her initial share(s) through a bank orbroker and have those share(s) registered in his/her name. Our plan enables participants to purchase additional shares without paying fees or commissions. Please contact our transfer agent for a brochure, to enroll in the plan, or to request dividends beautomatically deposited into a checking or savings account.
Corporate OfficeCoca-Cola Enterprises Inc.2500 Windy Ridge ParkwayAtlanta, GA 30339770 989-3000
CCE Website Addresswww.cokecce.com
Company and Financial Information Shareowner RelationsCoca-Cola Enterprises Inc.P. O. Box 723040Atlanta, GA 31139-0040800 233-7210 or 770 989-3796
Institutional Investor InquiriesInvestor RelationsCoca-Cola Enterprises Inc.P. O. Box 723040Atlanta, GA 31139-0040770 989-3246
Transfer Agent, Registrar and Dividend Disbursing AgentAmerican Stock Transfer & Trust Company59 Maiden Lane, Plaza LevelNew York, New York 10038800 418-4CCE (4223)(U.S. and Canada only) or718 921-8200 x6820Internet: www.amstock.comE-mail: [email protected]
Independent AuditorsErnst & Young LLP600 Peachtree Street, N.E.Suite 2800Atlanta, GA 30308-2215404 874-8300
Annual Meeting of Shareowners*Shareowners are invited to attend the 2007 annual meeting of shareowners Tuesday, April 24, 2007, 3:00 p.m., EDTDoubleTree Hotel Atlanta NW/Marietta2055 South Park PlaceAtlanta, GA 30339
*Please see our proxy for details. A ticket is required.
Environmental Policy StatementCoca-Cola Enterprises is committed to integrating responsible environmental practices into our daily operations. In our North American and European facilities and communities, we work with our suppli-ers/vendors, customers, consumers, community leaders, and employees to identify, manage, and minimize the environmental impact of our activities, products, and services. Our three environmental priorities are sustainable packaging, recycling, and energy. We strive to fulfi ll our environmental commitment by implementing and maintaining an Environmental Management System (EMS) which enables us to:
•Continuously review and enhance EMS as a means of improving environmental performance;
•Establish objectives and targets to measure our impact on the environment, focused on pollution prevention and the effi cient use of natural resources, materials and packaging, and energy;
•Work with our local communities and other businesses and civic organizations on environmental projects and initiatives;
•Use packaging that may be reused, recycled, or recovered according to its design;
•Comply with applicable local environmental laws and regulations, everywhere we operate.

Coca-Cola Enterprises Inc.2500 Windy Ridge Parkway
Atlanta, Georgia 30339770-989-3000
www.cokecce.com