coca-cola hellenic bottling company s.a. 2012 statutory annual report · · 2015-12-21coca-cola...
TRANSCRIPT

Coca-Cola Hellenic Bottling Company S.A. 2012 Statutory Annual Report

Annual Report 2012 Coca-Cola Hellenic
Table of Contents
1. Directors’ Statement pursuant to article 4 of Law 3556/2007 2. Board of Directors’ Report for the year ended 31 December 2012 3. Corporate Governance Statement 4. Independent Auditors’ Report 5. Consolidated Financial Statements and Accompanying Notes for the year
ended 31 December 2012 6. Parent Company Financial Statements and Accompanying Notes for the year
ended 31 December 2012 7. Published Annual Condensed Financial Statements, Notes and Information for the year ended
31 December 2012 8. Information Disclosure pursuant to article 10 of Law 3401/2005

Annual Report 2012 Coca-Cola Hellenic
1. Directors’ Statement pursuant to article 4 of Law 3556/2007

Annual Report 2012 Coca-Cola Hellenic
Directors’ Statement pursuant to article 4 of Law 3556/2007
To the best of our knowledge: 1. The annual financial statements which have been prepared in accordance with the applicable set of accounting
standards give a true and fair view of the assets, liabilities, financial position and profit or loss of Coca-Cola Hellenic Bottling Company S.A. and of the undertakings included in the consolidation taken as a whole.
2. The annual report of the Board of Directors is a true representation of the development and performance of the
business and the position of Coca-Cola Hellenic Bottling Company S.A. and of the undertakings included in the consolidation, taken as a whole, together with a description of the principal risks and uncertainties that they face.
Maroussi, 1March 2013 George David, Chairman of the Board of Directors Dimitris Lois, Chief Executive Officer Irial Finan, Authorised Non-Executive Director

Annual Report 2012 Coca-Cola Hellenic
2. Board of Directors’ Report
Page 1 of 9
Annual Report 2012 Coca-Cola Hellenic
Board of Directors’ Report of Coca-Cola Hellenic Bottling Company S.A. (‘Coca-Cola Hellenic’ or the ‘Group’ or the ‘Company’) regarding the
Financial Statements (consolidated and parent Company) for the year ended 31 December 2012
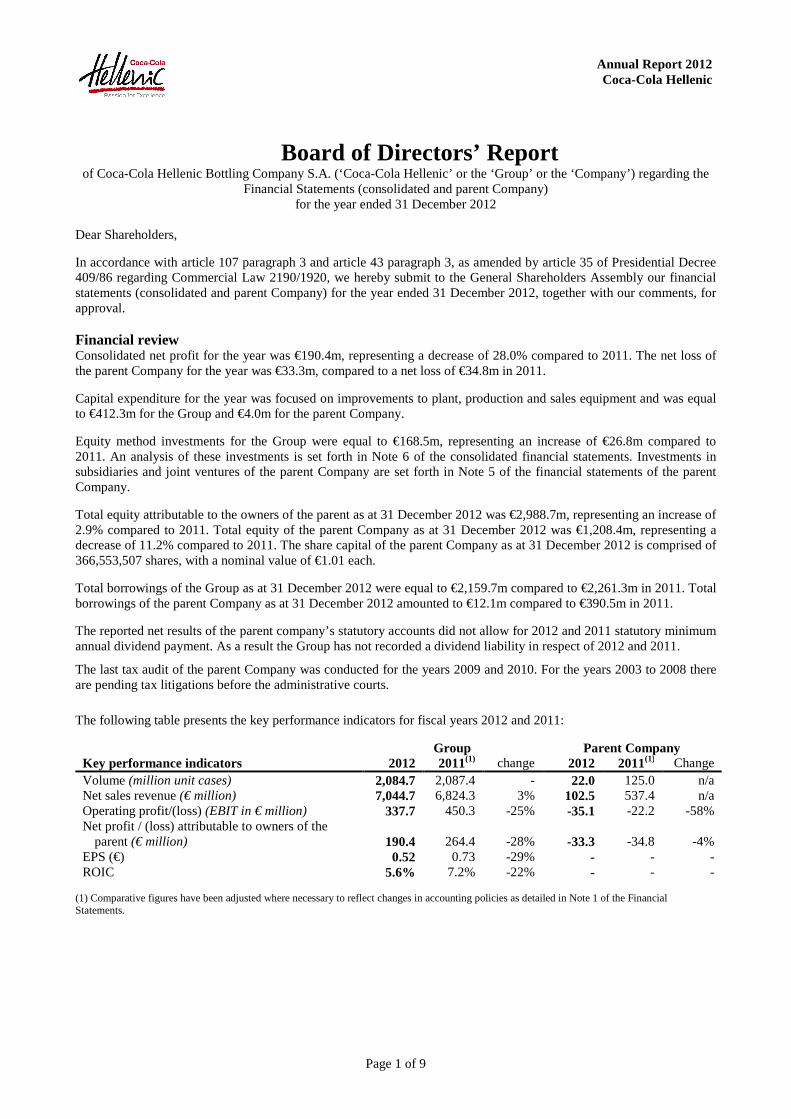
Dear Shareholders, In accordance with article 107 paragraph 3 and article 43 paragraph 3, as amended by article 35 of Presidential Decree 409/86 regarding Commercial Law 2190/1920, we hereby submit to the General Shareholders Assembly our financial statements (consolidated and parent Company) for the year ended 31 December 2012, together with our comments, for approval. Financial review Consolidated net profit for the year was €190.4m, representing a decrease of 28.0% compared to 2011. The net loss of the parent Company for the year was €33.3m, compared to a net loss of €34.8m in 2011. Capital expenditure for the year was focused on improvements to plant, production and sales equipment and was equal to €412.3m for the Group and €4.0m for the parent Company. Equity method investments for the Group were equal to €168.5m, representing an increase of €26.8m compared to 2011. An analysis of these investments is set forth in Note 6 of the consolidated financial statements. Investments in subsidiaries and joint ventures of the parent Company are set forth in Note 5 of the financial statements of the parent Company. Total equity attributable to the owners of the parent as at 31 December 2012 was €2,988.7m, representing an increase of 2.9% compared to 2011. Total equity of the parent Company as at 31 December 2012 was €1,208.4m, representing a decrease of 11.2% compared to 2011. The share capital of the parent Company as at 31 December 2012 is comprised of 366,553,507 shares, with a nominal value of €1.01 each. Total borrowings of the Group as at 31 December 2012 were equal to €2,159.7m compared to €2,261.3m in 2011. Total borrowings of the parent Company as at 31 December 2012 amounted to €12.1m compared to €390.5m in 2011. The reported net results of the parent company’s statutory accounts did not allow for 2012 and 2011 statutory minimum annual dividend payment. As a result the Group has not recorded a dividend liability in respect of 2012 and 2011.
The last tax audit of the parent Company was conducted for the years 2009 and 2010. For the years 2003 to 2008 there are pending tax litigations before the administrative courts.
The following table presents the key performance indicators for fiscal years 2012 and 2011:
Group Parent Company Key performance indicators 2012 2011(1) change 2012 2011(1) Change Volume (million unit cases) 2,084.7 2,087.4 - 22.0 125.0 n/a Net sales revenue (€ million) 7,044.7 6,824.3 3% 102.5 537.4 n/a Operating profit/(loss) (EBIT in € million) 337.7 450.3 -25% -35.1 -22.2 -58% Net profit / (loss) attributable to owners of the
parent (€ million) 190.4 264.4 -28% -33.3 -34.8 -4% EPS (€) 0.52 0.73 -29% - - - ROIC 5.6% 7.2% -22% - - -
(1) Comparative figures have been adjusted where necessary to reflect changes in accounting policies as detailed in Note 1 of the Financial Statements.

Page 2 of 9
Annual Report 2012 Coca-Cola Hellenic
Business Outlook
In 2013, we anticipate a challenging macroeconomic environment, particularly in our established markets. Austerity measures are expected to continue to affect disposable income and unemployment is still on the rise in most of our countries, reaching an all-time high of 11.7% in the Eurozone in December 2012.
Our strategic priorities to strengthen our business remain unchanged. We are focused on winning in the marketplace while growing currency neutral revenue per unit case through OBPPC-driven initiatives. Such initiatives allow us to balance price and package decisions with affordability considerations, thereby remaining relevant to consumers. We are confident that this is the right strategy to drive sustainable profitable volume and revenue growth.
We expect currency neutral revenue per unit case in 2013 to continue to grow year-on-year, albeit at a slower pace.
In 2013, we expect currency neutral input costs per case to increase by low single-digits, driven by EU sugar, PET resin, and aluminium.
We continue to pursue further opportunities to sustainably improve operational efficiencies. In this respect, we have identified additional restructuring initiatives. We expect to incur costs of approximately €50 million from restructuring initiatives in 2013 that are expected to yield €30 million in annualised benefits from 2014 onwards. We expect the initiatives already taken in 2012 and those that we will take in 2013 to yield approximately €65 million in total benefits in 2013.
Based on current spot rates, we expect a negative impact from currency fluctuations in 2013, albeit lower than 2012.
We expect our comparable effective tax rate for the mid-term to range between 23-25%.
Our emphasis on free cash flow generation and tight working capital management continues. We today announce a free cash flow target for the three year period ending 31 December 2015 of €1.3 billion, in line with our macroeconomic and input cost assumptions set out above. This target supersedes all prior years’ free cash flow guidance in its entirety completely. Our annual net capital expenditure is expected to range between 5.5% and 6.5% of net sales revenue over the mid-term.
We will continue to plan and invest for the long term. Our geographic footprint offers ample scope for growth and we are convinced that we are pursuing the right strategy to grow in a sustainable and profitable way and win at the point of sale. We will continue to capture the benefits of our revenue growth management strategy, improve operating efficiencies by focusing on cost leadership, and strengthen our free cash flow to create value for our shareholders.

Page 3 of 9
Annual Report 2012 Coca-Cola Hellenic
Principal risks and uncertainties The following are the principal risks and uncertainties to our business: 1. If The Coca-Cola Company exercises its right to terminate our bottlers’ agreements, upon the occurrence of certain
events, or is unwilling to renew these agreements, our net sales revenue may decline dramatically. In addition, if The Coca-Cola Company is unwilling to renew our bottlers’ agreements on terms at least as favourable to us as the current terms, our net sales revenue could also be adversely affected.
2. The Coca-Cola Company could exercise its rights under the bottlers’ agreements in a manner that would make it difficult for us to achieve our financial goals.
3. The interests of Kar-Tess Holding and The Coca-Cola Company may differ from those of other shareholders. As a result of their influence on our business, Kar-Tess Holding and The Coca-Cola Company could prevent us from making certain decisions or taking certain actions that would protect the interests of shareholders other than The Coca-Cola Company and Kar-Tess Holding or which would otherwise benefit us.
4. If The Coca-Cola Company were to reduce its marketing activities, the level of its contributions to our annual marketing plan or its commitment to the development or acquisition of new products, particularly new non-carbonated soft drinks (‘Non-CSD’), these reductions could lead to decreased consumption of trademarked beverages of The Coca-Cola Company in the countries in which we operate.
5. If The Coca-Cola Company fails to protect its proprietary rights against infringement or misappropriation, this could undermine the competitive position of the products of The Coca-Cola Company and could lead to a significant decrease in the volume of products of The Coca-Cola Company that we sell.
6. The current economic situation could lead to reduced demand for our products, or reductions in the prices of our products, or both, which would have a negative impact on our financial position, results of operations and cash flows.
7. If the capital and credit markets continue to experience volatility and the availability of funds remains limited, we may incur increased interest rates and other costs associated with debt financings and our ability to access the capital markets or borrow money may become restricted at a time when we would like, or need, to raise capital, which could have an adverse impact on our flexibility to react to changing economic and business conditions, on our ability to fund our operations and capital expenditures in the future and on our growth rate and shareholder returns.
8. Weaker consumer demand for carbonated soft drinks could harm our revenues and profitability. Consumer preferences may shift due to a variety of factors, including the ageing of the general population or other changes in demographics, changes in social trends, such as consumer health concerns about obesity, product attributes and ingredients, changes in travel, vacation of leisure activity patterns, weather, negative publicity resulting from regulatory action or litigation against us, The Coca-Cola Company or other comparable companies or a downturn in economic conditions.
9. Our growth prospects may be harmed if we are unable to expand successfully in the non-CSD segment.
10. Miscalculation of infrastructure investment need could adversely impact our financial results.
11. If we do not allocate and effectively manage the resources necessary to build and sustain the proper technology infrastructure, we could be subject to transaction errors, processing inefficiencies, customer service disruptions and in some instances, loss of customers.
12. Damage or disruption to our supply or distribution capabilities due to weather, natural disaster, fire, terrorism, pandemic, strikes, the financial and/or operational instability of key suppliers, distributors, warehousing and transportation providers, or brokers, or other reasons could impair our ability to manufacture or sell our products.
13. The lack of institutional continuity and safeguards in our emerging and developing countries adversely affects our competitive position, increases our cost of regulatory compliance and/or exposes us to a heightened risk of loss due to external interference, nationalisation, expropriation, fraud and criminal activity.

Page 4 of 9
Annual Report 2012 Coca-Cola Hellenic
Principal risks and uncertainties (continued)
14. Adverse economic conditions in our emerging and developing countries may reduce consumer confidence and purchasing power, resulting in lower consumption generally or increased demand for local non-premium brands, which are typically of lower quality, but more affordable than our brands.
15. The sustainability of our growth in our developing and emerging countries depends partly on our ability to attract and retain sufficient number of qualified and experienced personnel for which there is strong demand.
16. Competition law enforcement by the European Union and national authorities may have a significant adverse effect on our competitiveness and results of operations.
17. We are engaged in a highly competitive business. Adverse actions by our competitors or other changes in the competitive environment may adversely affect our results of operations.
18. The increasing concentration of retailers and independent wholesalers, on which we depend to distribute our products in certain countries, could lower our profitability and harm our ability to compete.
19. Our revenue is impacted by how large retailers, such as supermarket and hypermarket chains and independent wholesalers, market or promote our products. Revenue may, for example, be negatively impacted by unfavorable product placement at points of sale or less aggressive price promotions by large retailers or independent wholesalers, particularly in future consumption channels.
20. The Greek government debt crisis and the associated impact on the economic and fiscal prospects of Greece and other EU countries in which we operate could have a material adverse effect on our business. Measures in response to such crisis are likely to reduce disposable income and discretionary spending by our customers, and could adversely affect the tourism industry, which could result in a reduced demand for our products. Such measures have also resulted and may continue to result in increased taxation on our business, which would reduce our profits.
21. Unfavourable changes in general economic conditions, such as economic slowdowns, increases in unemployment and increases in inflation, may reduce demand for our products.
22. Increased taxation on our business may reduce our profitability.
23. The global financial and credit crisis and the Greek government debt crisis may have impacts on our liquidity that currently cannot be predicted, and increasing interest rates may affect our ability to obtain credit.
24. An event, or series of events, that materially damages the reputation of one or more of our brands, including contamination or deterioration of our products, could have an adverse effect on the value of that brand and subsequent revenues from that brand or business.
25. Adverse weather conditions could reduce demand for our products.
26. The effects of climate change could have a long-term adverse impact on our business and results of operations
27. Price increases and shortages of raw materials and packaging materials could lead to an increase in our cost of goods.
28. We rely on key third parties, including key suppliers, and the termination or modification of the arrangements with such third parties could negatively affect our business.
29. An increase in the cost of energy could lead to an increase of our cost of goods and operating expenses.
30. Should an uninsured loss or a loss in excess of insured limits occur, this could adversely impact our business, results of operations and financial condition.
31. Fluctuations in exchange rates may adversely affect the results of our consolidated operations.
32. In certain of our countries, we are exposed to the impact of exchange controls, which may adversely affect our ability to repatriate profits.
33. Our operations are subject to extensive regulation, including resource recovery, environmental and health and safety standards. Changes in the regulatory environment may cause us to incur liabilities or additional costs or limit our business activities.
34. If local customs authorities successfully challenge the classification under which we currently import concentrate in some of our countries, we may have to pay additional customs duties.

Page 5 of 9
Annual Report 2012 Coca-Cola Hellenic
35. The Beverage Partners Worldwide joint venture between The Coca-Cola Company and Nestle S.A. could be dissolved or altered in a manner that adversely affects our business.
A full analysis of the financial risks that the Group and the parent Company are exposed to (foreign currency transaction exposure, fair values of financial assets and liabilities changes, interest rate risk, credit risk, liquidity risk and commodities price risk) is included in the Notes 1 and 30 of the consolidated financial statements as well as in Note 25 of the parent Company’s financial statements.

Page 6 of 9
Annual Report 2012 Coca-Cola Hellenic
Branches analysis
The registered office and branches of the parent Company at 31 December 2012 were as follows: Group Head Office 9, Fragoklissias Str., Maroussi
Information regarding the issues under article 4 paragraph 7 and 8 of the Law 3356/2007.
a. Company’s share capital structure As at 31 December 2012, the share capital of the Company is equal to €370,219,042 and is divided into 366,553,507 common ordinary shares with a voting right and a par value of €1.01 each. Coca-Cola Hellenic’s shares are listed on the Athens Exchange, with a secondary listing on the London Stock Exchange. The Company delisted from the Australian Stock exchange in September 2009 in order to reduce administrative costs associated with multiple listings. Coca-Cola Hellenic’s American Depositary Receipts (ADRs) are listed on the New York Stock Exchange. The voting rights of each shareholder are proportional to its paid-in share capital. Each share provides a right to one vote at general meetings of Coca-Cola Hellenic and entitles the shareholder to dividends declared by Coca-Cola Hellenic.
During 2010, Coca-Cola Hellenic’s Board of Directors resolved to increase the share capital of the Company by issuing 163,354, 161,663, 102,700 and 169,648 new ordinary shares as announced on 26 February, 17 May, 24 August and 25 November 2010 respectively, following the exercise of stock options by option holders pursuant to the Company’s stock option plan. Total proceeds from the issues of the shares were €5.7m. During 2011, Coca-Cola Hellenic’s Board of Directors resolved to increase the share capital of the Company by issuing 354,512, 21,994, 28,749 and 313 new ordinary shares, as announced on 16 March, 24 June, 1 September and 13 December 2011 respectively, following the exercise of stock options by option holders pursuant to the Company’s stock option plan. Total proceeds from the issues of the shares were €4.7 million. During 2012, Coca-Cola Hellenic’s Board of Directors resolved to increase the share capital of the Company by issuing 5,334 and 6,165 new ordinary shares as announced on 21 March 2012 and 27 September 2012, following the exercise of stock options by options holders pursuant to the Company’s stock option plan. Total proceeds from the issues of the shares were €0.1 million. Recapitalisation (Capital return) On 6 May 2011, the Annual General Meeting of shareholders resolved to reorganise its share capital. The Company’s share capital increased by an amount equal to €549.7 million. The increase was performed by capitalising the share premium reserve and increasing the nominal value of each share from €0.50 to €2.00. The Company’s share capital was subsequently decreased by an amount equal to €183.2 million by decreasing the nominal value of each share from €2.00 to €1.50, and distributing such €0.50 per share difference to shareholders in cash.
On 25 June 2012, the Annual General Meeting of shareholders resolved to decrease the share capital of the Company by the amount of €124.6 million by decreasing the nominal value of the Company’s share by €0.34 per share, from €1.50 to €1.16 per share, and the return of the amount of the decrease to the Company’s shareholders in cash, i.e. a return of €0.34 per share. Furthermore, on the same date, it was resolved to decrease the share capital of the Company by the amount of €55.0 million by decreasing the nominal value of the Company’s share by €0.15 per share, from €1.16 to €1.01 per share, in order to extinguish accumulated losses of the parent company Coca-Cola Hellenic Bottling Company S.A. in an equal amount.
After the above changes, the share capital amounts to €370.2 million and is comprised of 366,553,507 shares with a nominal value of €1.01 each.
Treasury shares
On 30 April 2009, the Board of Directors of Coca-Cola Hellenic resolved to buy-back a maximum of 5% of its paid-in share capital during the period that is 24 months from the date of the Extraordinary General Meeting of 27 April 2009 which approved a share buy-back programme pursuant to Article 16 of Codified Law 2190/1920 (i.e. until 26 April 2011). Based on the Company’s capitalisation at that time, the maximum amount that may be

Page 7 of 9
Annual Report 2012 Coca-Cola Hellenic
bought back pursuant to the programme was 18,270,104 shares. Purchases under the programme were subject to a minimum purchase price of €1.00 per share and a maximum purchase price of €20.00 per share. This programme expired on 26 April 2011.
Applicable law does not require any actual use of such approved share buy-back programmes. The Company may therefore, in its sole discretion, decide not to buy back any shares or to buy fewer shares than the maximum permissible number approved under the programme. The purchase of shares pursuant to the share buy-back programme was dependent upon a number of factors including, without limitation, the relative attractiveness of alternative investment opportunities and the availability of funds. As at 31 December 2012, 3,430,135 shares had been held by the Group pursuant to the share buy-back programme of a total value of €54.3m, bringing the shares in circulation to 363,123,372 (2011: 3,430,135 shares held of a total value of €55.5m, 2010: 3,430,135 shares held of a total value of €57.2m).
b. Restrictions on the transfer of the Company’s shares The Company’s shares may be transferred as stipulated by Law. The Articles of Association set forth no further restrictions on transfer.
c. Major direct and indirect shareholders in the meaning of PD 51/1992
The shareholders that hold, directly or indirectly, 5% or more of the total shares of the Company are Kar-Tess Holding which holds directly 23.3% and The Coca-Cola Company which holds directly and indirectly 23.2%.
d. Shares with special control rights
No shares of the Company deliver special control rights to their holders.
e. Restrictions on voting rights The Articles of Association set forth no restrictions on the voting rights of each share.
f. Agreements among shareholders of the Company Kar-Tess Holding and certain affiliates of The Coca-Cola Company through which The Coca-Cola Company holds shares in our Company (collectively “The Coca-Cola Company Entities”) have entered into a renewed shareholders' agreement in 2008. The renewed shareholders’ agreement expires on 31 December 2018 and restricts the sale of our ordinary shares owned by Kar-Tess Holding and The Coca-Cola Company Entities. Under the terms of the renewed shareholder agreement, Kar-Tess Holding and The Coca-Cola Company will maintain a combined shareholding in the Company of at least 44% until January 2014 and at least 40% until December 2018.
The Company is not aware of any other agreements among its shareholders, which would result in restrictions on the assignment of its shares or exercise of voting rights.
g. Regulations on the appointment and replacement of Board of Directors members and amendments to the
Articles of Association The regulations set forth in the Company’s Amended Articles of Association regarding the appointment and replacement of Directors, conform to the provisions of Commercial Law 2190/1920.
h. Authority of the Board of Directors to issue new shares or acquire treasury shares
The authority of the Board of Directors to issue new shares or acquire treasury shares conforms to the provisions of Commercial Law 2190/1920.
i. Major agreement put in force, amended or terminated in the event of change in the control following a public offer There are no agreements that would enter into force or be amended or terminated in the event of a change in the control of the Company following a public offer. We note that our bottlers agreements with The Coca-Cola Company cannot be assigned by operation of law and enable The Coca-Cola Company to terminate them upon any change of control.
j. Agreements with Board of Directors members or staff of the Company There are no agreements between the Company and its Directors or employees that require payment of any compensation to a Director in the event of resignation or dismissal without cause, or termination of their mandate or employment as a result of a public offer.

Page 8 of 9
Annual Report 2012 Coca-Cola Hellenic
Subsequent events
On 14 January 2013, the Group acquired approximately 14.0% in Coca-Hellenic Bottling Company Bulgaria AD for a consideration of approximately €13.2 million and thus its overall participation in the Bulgarian subsidiary is now 99.39%.
By virtue of a tax law that was enacted in Greece on 23 January 2013, the Greek corporate income tax rate was increased to 26% (from 20%) for accounting years starting as of 1 January 2013 onwards. This rate increase had not been substantively enacted at the balance sheet date and, therefore, is not included in 2012 financial statements. The effect of the changes enacted by Parliament on 23 January 2013 would be to increase the deferred tax asset provided at the balance sheet date by €5.0m.
On 22 February 2013, Coca-Cola HBC AG (“CCHBC”) announced that the existing shareholders’ agreement of Kar-Tess Holding and TCCC, as well as the relationship agreement relating to Coca-Cola Hellenic entered into in connection with the acquisition of Coca-Cola Beverages plc by Hellenic Bottling Company S.A. in 2000, will terminate upon settlement of the voluntary share exchange offer and will not be renewed in relation to CCHBC.
During the first months of 2013 the Group incurred €5.6m of restructuring costs before tax, in its established countries.
Other significant events
On 11 October 2012, Coca-Cola HBC AG, a Swiss company incorporated by Kar-Tess Holding, announced a voluntary share exchange offer to acquire all outstanding ordinary registered shares and all American depositary shares of Coca-Cola Hellenic. The transaction is progressing in line with Coca-Cola HBC AG’s most recent announcements and we expect commencement of the acceptance period after publication of Coca-Cola Hellenic’s audited full year 2012 financial statements and completion of the voluntary share exchange offer early in the second quarter of 2013.
Report of related party transactions for the period 1 January to 31 December 2012 (under article 2 paragraph 4 of the Law 3016/2002) An analysis of the parent Company’s and Group’s transactions with its related parties for 2012 is disclosed in note 29 of the parent Company financial statements and in note 34 of the Consolidated financial statements respectively.

Page 9 of 9
Annual Report 2012 Coca-Cola Hellenic
Dear Shareholders, Taking into account the above comments, the accompanying financial statements as well as the audit report of the Certified Auditor Accountant, you may proceed in discharging us from any responsibility that relates to the financial statements of 2012, according to the commercial law as well as the statute of the Company. By order of the Board of Directors
Dimitris Lois Chief Executive Officer Maroussi, 1 March 2013 This report, which consists of nine (9) pages, is the report that we refer to in our audit report of 4 March 2013.
Marios Psaltis Certified Auditor Accountant SOEL reg. no. 38081 Athens, 4 March 2013

Annual Report 2012 Coca-Cola Hellenic
3. Corporate Governance Statement

Page 1 of 8
Annual Report 2012 Coca-Cola Hellenic
Corporate Governance Statement
(in accordance with item (d) of paragraph 3 of article 43a of Codified Law 2190/1920)
1. Corporate Governance Code The Company voluntarily complies with a number of corporate governance procedures which are set forth in a set of documents which together constitute the Company’s corporate governance manual (the “Corporate Governance Manual”). Our Corporate Governance Manual can be found on our website at http://www.coca-colahellenic.com/investorrelations/corporategovernance/ . Hard copies of the Corporate Governance Manual may be obtained from our Investor Relations Department (9 Frangoklissias Street, 151 25 Maroussi, Athens, Greece, tel. +30 210 6183 124). 2. Corporate governance practices applied beyond the requirements of Greek law The Company regularly reviews its corporate governance standards and procedures in light of the ongoing debates and rulemaking developments in Greece, Europe and the United States, in order to ensure that its corporate governance systems remain in line with international best practices. We currently apply certain corporate governance practices beyond the requirements of Greek law on corporate governance. The main such practices are:
• Eleven out of the twelve members of our Board of Directors are currently non-executive directors, instead of the minimum 1/3 (i.e. four directors) required by article 3, paragraph 1 of Law 3016/2002.Five members of our Board of Directors are currently independent non-executive directors, instead of the minimum two required by article 3, paragraph 1 of Law 3016/2002.
• Five members of our Board of Directors are currently independent non-executive directors, instead of the minimum two required by article 3, paragraph 1 of Law 3016/2002.
• Our Board of Directors has established a Human Resources Committee consisting of three non-executive directors and operating under written Terms of Reference.
• Our Board of Directors has established a Social Responsibility Committee consisting of three non-executive directors and operating under written Terms of Reference.
• We have established a Disclosure Committee and adopted disclosure controls and procedures to ensure the accuracy and completeness of the Company’s public disclosures. The Disclosure Committee consists of the Chief Financial Controller, the General Counsel, the Chief Financial Officer and the Director of Investor Relations.
• We have adopted a Code of Ethics for Senior Officers and Directors. • We have adopted a Code of Business Conduct.
More information on the above practices, as well as all the documents referred to in this section, can be found in our Corporate Governance Manual (see under section 1 above). 3. Description of the Company’s internal controls and risk management systems in relation to the financial reporting process The Company’s systems of internal control are designed and operated to support the identification, evaluation and management of risks affecting the Company’s group, including in relation to the financial reporting process and the preparation of consolidated accounts, and the business environment in which it operates. As such, they are subject to continuous review as circumstances change and new risks emerge. Assurance on compliance with systems of internal control and on their effectiveness is obtained through regular management reviews, review of key financial controls, internal audit reviews and testing of certain aspects of the internal financial control systems during the course of the year. Our internal audit department reports directly to the Audit Committee of our Board of Directors and has a full-time staff covering a range of disciplines and business expertise. The internal audit department operates under a Corporate Audit Department Charter which is included in our Corporate Governance Manual (see under 1 above). The function of

Page 2 of 8
Annual Report 2012 Coca-Cola Hellenic
the internal audit department is to confirm the maintenance and effectiveness of the Company’s internal controls to the Audit Committee. The Internal Audit department performs a risk assessment that incorporates both quantitative and qualitative considerations when assessing the significance of accounts and the relative internal controls over financial reporting. The risk assessment includes the determination of significant accounts, as well as materiality thresholds across all of the group's financial reporting entities. Upon determination of these significant accounts, these accounts are further linked to the supporting business processes and key internal controls over financial reporting. These key internal controls over financial reporting are subject to testing throughout the year. The internal audit function monitors the internal financial control system across all the countries in which we operate and reports the findings to management and the Audit Committee. As part of our commitment to maintain and strengthen best practices in corporate governance matters, we consistently seek to enhance our internal control environment across our organisation. Interim financial information is released, on a quarterly basis, to the stock exchanges on which the Company is listed and to the financial press. Internally, the financial results and key business indicators of the Company are circulated and reviewed by senior management on a monthly basis. This information includes comparisons against budgets, forecasts and previous year performance. The Board of Directors receives updates on performance at each Board of Directors meeting as well as a monthly report on business and financial performance of the Company. The Board of Directors acknowledges that it has ultimate responsibility for ensuring that the Company has adequate systems of financial control. It should be noted that such systems of financial control can provide only reasonable and not absolute assurance against material misstatements or loss. In certain of the territories in which we operate, businesses like ours are exposed to a heightened risk of loss due to fraud and criminal activity. We review our systems of financial control regularly in order to minimise such losses. The Board of Directors has adopted a Chart of Authority for the Group defining financial and other authorisation limits and setting procedures for approving capital and investment expenditure. The Board of Directors also approves three-year strategic and financial plans and detailed annual budgets. It subsequently reviews monthly performance against targets set forth in such plans and budgets. A key focus of the financial management strategy is the protection of our earnings stream and management of our cash flow. Insurance is secured to cover any residual insurable risk exposure such as catastrophic-level property damage or business interruption and liability protection. Local insurance policies have been arranged under this cover to provide working loss protection and necessary legal compliance. Our Board of Directors has also established a Disclosure Committee comprising the Company’s Chief Financial Controller, the Chief Financial Officer, the General Counsel, and the Director of Investor Relations. The Disclosure Committee is responsible for adopting disclosure controls and procedures to ensure the accuracy and completeness of the Company’s public disclosures.

Page 3 of 8
Annual Report 2012 Coca-Cola Hellenic
4. Information required by article 10, paragraph 1, points (c), (d), (f), (h) and (i) of Directive 2004/25/EC 4.1 Significant direct and indirect shareholdings Coca-Cola Hellenic’s significant direct and indirect shareholdings within the meaning of Article 85 of Directive 2001/34/EC are set forth in Note 35 of our 2011 Consolidated Financial Statements. 4.2 Securities with special control rights Coca-Cola Hellenic has not issued any debt or equity securities with special control rights. 4.3 Restrictions on voting rights - Systems whereby the financial rights attaching to securities are separated from the holding of securities There are no restrictions on the voting rights of securities issued by Coca-Cola Hellenic or systems whereby, with the company’s cooperation, the financial rights attaching to securities are separated from the holding of securities. 4.4 Rules governing the appointment and replacement of board members and the amendment of the articles of association Our Board of Directors is appointed by our shareholders at a general meeting for a three-year term which is extended until the date of the Annual General Meeting of the year in which such term expires. The current term of Coca-Cola Hellenic’s directors expires in 30.06.2014. Based on a shareholders’ agreement between Kar-Tess Holding and entities of The Coca-Cola Company, four of our directors are designated by Kar-Tess Holding and two are designated by The Coca-Cola Company entities. The remaining directors are jointly designated by Kar-Tess Holding and The Coca-Cola Company entities. Further information on the rules governing our Board of Directors may be found in Codified Law 2190/1920 and in the Company’s Articles of Association. Our Articles may be found on our website at http://www.coca- colahellenic.com/investorrelations/corporategovernance/corporatebylaws/
Under article 19, para. 1 and article 20, para. 3 of our Articles of Association, a quorum of 67% of the holders of our share capital and a supermajority of two-thirds of the share capital present and entitled to vote at a General Meeting of our shareholders, provided that such vote exceeds 50% of the company’s shares, is required to pass resolutions amending our Articles of Association.
4.5 Powers of Board of Directors and, in particular, the power to issue or buy back shares The powers of our Board of Directors are set forth in Codified Law 2190/1920 and in the Company’s Articles of Association. On 30 April 2009, the Board of Directors of Coca-Cola Hellenic resolved to buy-back a maximum of 5% of its paid-in share capital during the period that is 24 months from the date of the Extraordinary General Meeting of 27 April 2009 which approved a share buy-back programme pursuant to Article 16 of Codified Law 2190/1920 (i.e. until 26 April 2011). Based on the Company’s capitalisation at that time, the maximum amount that may be bought back pursuant to the programme was 18,270,104 shares. Purchases under the programme were subject to a minimum purchase price of €1.00 per share and a maximum purchase price of €20.00 per share. This programme expired on 26 April 2011.

Page 4 of 8
Annual Report 2012 Coca-Cola Hellenic
Applicable law does not require any actual use of such approved share buy-back programmes. The Company may therefore, in its sole discretion, decide not to buy back any shares or to buy fewer shares than the maximum permissible number approved under the programme. The purchase of shares pursuant to the share buy-back programme was dependent upon a number of factors including, without limitation, the relative attractiveness of alternative investment opportunities and the availability of funds. As at 31 December 2012, 3,430,135 shares had been held by the Group pursuant to the share buy-back programme of a total value of €54.3m, bringing the shares in circulation to 363,123,372 (2011: 3,430,135 shares held of a total value of €55.5m, 2010: 3,430, 135 shares held of a total value of €57.2m). 5. Operation of Shareholders’ Meetings and its Key Powers –Shareholders’ Rights Operation and Key Powers Coca-Cola Hellenic’s shareholder meetings operate in accordance with the provisions of Codified Law 2190/1920, as in force. The key powers of our shareholder meetings are also provided in Codified Law 2190/1920 and in our Articles of Association. Ordinary quorum and voting majority
The quorum necessary for a valid general meeting is one-fifth of the paid-up share capital. There is no minimum quorum required for an adjourned meeting held twenty days following the general meeting that did not meet the quorum requirement. Resolutions may be validly passed by an absolute majority (50% plus one) of the share capital present and entitled to vote.
Extraordinary quorum and supermajority
A quorum of 67% of the holders of our share capital and a supermajority of two-thirds of the share capital present and entitled to vote, provided that such vote exceeds 50% of the company’s shares, is required to pass resolutions concerning the following matters:
• a merger; • decreases and increases in share capital; • issuance of any convertible bonds; • the decision not to distribute dividends where the minimum dividend required to be paid is 35% of the
parent Company’s profit after tax; • the distribution of dividends and any change in the method of distribution of dividends; • any increase in shareholders’ obligations; • any restrictions or the abolition of pre-emptive rights; • any change of our registered offices; • any change in our country of incorporation; • the establishment of extraordinary reserve funds or other reserve funds in excess of the compulsory reserve
fund required pursuant to our articles of association and Greek law; • our dissolution and the appointment of a receiver, trustee or custodian for our company or any part of our
assets; • any change to our term, objects and purposes; and • any change in our articles of association.
In the absence of the 67% quorum, the general meeting is adjourned, the next meeting requires a quorum of 55% and, if this is not met either, a third meeting is convened to which a quorum of 50% plus one applies.
Rights of our shareholders
A description of the rights of our shareholders can be found in the Company’s Articles of Association and in Codified Law 2190/1920, as currently in force.

Page 5 of 8
Annual Report 2012 Coca-Cola Hellenic
6. Composition and Operation of the Board of Directors and its Committees 6.1 The Board of Directors Our Board of Directors currently has twelve members of which only one, the Managing Director, is an executive of the Company. Mr. George A. David is Chairman and Mr. Dimitris Lois is Chief Executive Officer. The non-executive members of the Board of Directors include representatives of major shareholder interests as outlined in a shareholders agreement between our largest shareholders, Kar-Tess Holding and the The Coca-Cola Company. Based on this agreement, four directors are designated by Kar-Tess Holding and two are designated by the Coca-Cola Company. The remaining directors are independent and are jointly designated by Kar-Tess Holding and the Coca-Cola Company. We recognize the important role of independent non-executive directors in ensuring continued high standards of corporate governance and have appointed five independent directors. The Company’s independent directors are: Mr. Kent Atkinson, Sir Michael Llewellyn-Smith, Mr. Antonio D’Amato, Mr. Nigel Macdonald, and Mr. Christos Ioannou. The role of the independent directors is to provide a clear, independent, non-executive influence and perspective within the Board of Directors. Our Board of Directors believes that all members of our Audit Committee are independent. The Board of Directors and its Committees meet at regular intervals. There are certain matters that are reserved for full consideration by the Board of Directors, including issues of policy, strategy and approval of the Chart of Authority and business plan. The members of the Board of Directors are supplied on a timely basis with comprehensive information, which the Board of Directors believes is in a form and of a quality to enable it to discharge its duties and carry out its responsibilities. All directors have access to our General Counsel, as well as independent professional advice at Company’s expense. All directors also have full access to the Managing Director, senior managers and our external and internal auditors. Prior to the listing of our shares on the London Stock Exchange, our major shareholders entered into a relationship agreement restricting directors nominated by such major shareholders from taking part in, and voting at, Board of Directors meetings regarding matters in which the major shareholder that nominated them has an interest. Further to our objective to adopt international best practices in corporate governance, we have adopted a Code of Ethics for our directors and senior managers to prevent wrongdoing and promote honest and ethical conduct, full, fair, accurate, timely and understandable disclosure, and compliance with applicable governmental rules and regulations. We also have in place a Code of Dealing in Company Securities, applicable to senior managers and employees, as well as a Code of Business Conduct applicable to all our employees and directors. Our Board of Directors has established three committees of the Board, namely the Audit Committee, the Human Resources Committee and the Social Responsibility Committee.

Page 6 of 8
Annual Report 2012 Coca-Cola Hellenic
6.2 The Audit Committee The Audit Committee, acting on behalf of the Board of Directors, is responsible for the oversight of the Company’s accounting policies, financial reporting, and internal control. The Audit Committee is comprised of three non-executive Directors who are independent of management: Mr. Kent Atkinson (Chairman), Mr. Nigel Macdonald and Mr. Christos Ioannou. The Audit Committee operates in accordance with a written charter and its key responsibilities include:
• the appointment and remuneration of the Company’s external auditors; • review and approval of the external auditors’ scope as well as the approval of the appointment or termination
of the Director of Internal Audit; • oversight role concerning the nature and scope of forthcoming audits; • review of our interim and annual statements prior to submission to the Board of Directors; • review and approval of the annual internal audit plans, including summaries of completed audits as well as
periodic summaries involving internal audit investigations and management’s action plans; • establishment of procedures for the receipt, retention and treatment of complaints received by the Company
regarding accounting, internal accounting controls, auditing matters for the confidential, anonymous submission by Company employees of concerns regarding questionable accounting or auditing matters; and
• oversight and monitoring of our compliance with the Section 404 of the Sarbanes-Oxley Act (2002), regarding internal control over financial reporting.
The Audit Committee meets at least four times per year. Our external auditors and our internal audit director normally attend the Audit Committee meetings and also meet with the Audit Committee privately without management, to discuss the adequacy of internal control over financial reporting and any other matters deemed relevant for the attention of the Audit Committee. 6.3 The Human Resources Committee The Human Resources Committee comprises the following three non-executive directors: Sir Michael Llewellyn-Smith (Chairman), Mr. John Hunter and Mr. George A. David. From Coca-Cola Hellenic’s management, the Chief Executive Officer and Human Resources Director typically attend meetings of the Human Resources Committee, except when the discussions concern matters affecting them personally. The Human Resources Committee meets at least four times per year. The Human Resources Committee operates in accordance with a written charter and is responsible for:
• establishing the principles governing human resources policy of the Company, which will guide management decision-making and action;
• overseeing the evaluation of senior management; • overseeing succession planning and approving the appointments and terminations of senior managers of the
Company; • overseeing the talent management framework for the Company to ensure a continuous development of talent
for key roles; • establishing compensation strategy for the Company and approving Company-wide compensation and benefit
plans, as well as compensation for senior managers; • making recommendations to the Board of Directors regarding compensation for the Chief Executive Officer
and • making recommendations to the Board of Directors regarding the appointment of the Chief Executive Officer
and the members of the Board.
Page 7 of 8
Annual Report 2012 Coca-Cola Hellenic
6.4 The Social Responsibility Committee The Social Responsibility Committee is comprised of three non-executive Directors: Sir Michael Llewellyn- Smith (Chairman), Mr. John Hunter and Mr. George A. David. The Chief Executive Officer and Director of Public Affairs normally attend meetings of the Social Responsibility Committee. The Social Responsibility Committee operates in accordance with a written charter and is responsible for:
• overseeing the development and maintenance of procedures and systems that promote the Company’s social and environmental goals;
• establishing principles governing corporate social responsibility and environmental goals, including transparent business conduct in connection therewith;
• establishing an Operating Council responsible for developing and implementing appropriate policies and strategies to promote the Company’s social responsibility and environmental goals;
• ensuring Group-wide capabilities to enable execution of policies and strategies to promote the Company’s social responsibility and environmental goals;
• overseeing communication with stakeholders of the Company’s social and environmental policies, goals and achievements; and
• considering other topics as appropriate.

Page 8 of 8
Annual Report 2012 Coca-Cola Hellenic
The table below sets forth the current members of our Board of Directors, its Committees and the Disclosure Committee: The Board of Directors Name Nationality Age Non-Executive Chairman George A. David British 76 Chief Executive Officer - Executive Director Dimitris P. Lois Greek 51 Vice-Chairman - Non-Executive Director Anastasios P. Leventis British 71 Independent Non-Executive Director Kent Atkinson British 67 Independent Non-Executive Director Antonio D’ Amato Italian 55 Non-Executive Director Anastassis G. David British 42 Non-Executive Director Irial Finan Irish 55 Non-Executive Director John Hunter Australian 75 Independent Non-Executive Director Christos Ioannou Cypriot 41 Non-Executive Director Haralambos K. Leventis British 70 Independent Non-Executive Director Sir Michael Llewellyn-Smith British 73 Independent Non-Executive Director Nigel Macdonald British 67 The Audit Committee Chairman Kent Atkinson British 67 Member Christos Ioannou Cypriot 41 Member Nigel Macdonald British 67 The Human Resources Committee Chairman Sir Michael Llewellyn-Smith British 73 Member George A. David British 76 Member John Hunter Australian 75 The Social Responsibility Committee Chairman Sir Michael Llewellyn-Smith British 73 Member George A. David British 76 Member John Hunter Australian 75 The Disclosure Committee Director of Investor Relations Oya Gur Turkish 45 General Counsel and Director of Strategic Development Jan Gustavsson Swedish 46 Group Financial Controller Nikolaos Mamoulis Greek 52 Chief Financial Officer Michael Imellos Greek 44 The Operating Committee Chief Executive Officer Dimitris P. Lois Greek 51 Regional Director John Brady American 55 Group Chief Customer and Commercial Director Per Steen Breimyr Norwegian 51 Regional Director Alain Brouhard French 50 Supply Chain Services Director Kleon Giavassoglou Greek 60 General Counsel and Director of Strategic Development
Jan Gustavsson
Swedish
46
Human Resources Director Bernard Kunerth French 57 Chief Financial Officer Michael Imellos Greek 44 Regional Director Keith Sanders American 51 Regional Director Richard Smyth British 54

Annual Report 2012 Coca-Cola Hellenic
4. Independent Auditor’s Report

PricewaterhouseCoopers SA, 268 Kifissias Avenue, 15232 Halandri, Greece T:+30 210 6874400, F:+30 210 6874444, 17 Ethnikis Antistassis Str, 55134 Thessaloniki, T:+30 2310 488880 F:+30 2310 459
[Translation from the original text in Greek]
Independent Auditor’s Report
To the Shareholders of “Coca-Cola Hellenic Bottling Company S.A.”
Report on the Separate and Consolidated
We have audited the accompanying separate
Bottling Company S.A.” which comprise the
the separate and consolidated income
equity and cash flow statement for the year then ended and
explanatory information.
Management’s Responsibility for the
Management is responsible for the preparation and fair presentation of these
statements in accordance with International Financial Reporting Standards, as adopted by
and for such internal control as management determines is necessary to enable the preparation of
consolidated financial statements that are free from material misstatement, whether due to fraud or error.
Auditor’s Responsibility
Our responsibility is to express an opinion on
audit. We conducted our audit in accordance with International Standards on Auditing. Those standards require
that we comply with ethical requirements and plan and perform the audit to obtain reasonable assurance about
whether the separate and consolidated financial statemen
An audit involves performing procedures to obtain audit evidence about the amounts and disclosures in the
separate and consolidated financial statements. The procedures selected depend on the auditor's judgment,
including the assessment of the risks of material misstatement of the
statements, whether due to fraud or error. In making those risk assessments, the auditor considers internal
control relevant to the entity's preparation
statements in order to design audit procedures that are appropriate in the circumstances, but not for the purpose
of expressing an opinion on the effectiveness of the entity's internal contro
appropriateness of accounting policies used and the reasonableness of accounting estimates made by
management, as well as evaluating the overall presentation of the
We believe that the audit evidence we have obtained is sufficient and appropriate to provide a basis for our audit opinion.
Kifissias Avenue, 15232 Halandri, Greece T:+30 210 6874400, F:+30 210 6874444, www.pwc.gr
7 Ethnikis Antistassis Str, 55134 Thessaloniki, T:+30 2310 488880 F:+30 2310 459487
[Translation from the original text in Greek]
Cola Hellenic Bottling Company S.A.”
nd Consolidated Financial Statements
separate and consolidated financial statements of “Coca
which comprise the separate and consolidated balance sheet as of 31 December 201
income statement and statement of comprehensive income,
equity and cash flow statement for the year then ended and a summary of significant accounting polic
’s Responsibility for the Separate and Consolidated Financial Statements
Management is responsible for the preparation and fair presentation of these separate and consolidated financial
statements in accordance with International Financial Reporting Standards, as adopted by
and for such internal control as management determines is necessary to enable the preparation of
ed financial statements that are free from material misstatement, whether due to fraud or error.
Our responsibility is to express an opinion on these separate and consolidated financial statements based on our
our audit in accordance with International Standards on Auditing. Those standards require
that we comply with ethical requirements and plan and perform the audit to obtain reasonable assurance about
consolidated financial statements are free from material misstatement.
An audit involves performing procedures to obtain audit evidence about the amounts and disclosures in the
and consolidated financial statements. The procedures selected depend on the auditor's judgment,
luding the assessment of the risks of material misstatement of the separate and consolidated financial
statements, whether due to fraud or error. In making those risk assessments, the auditor considers internal
control relevant to the entity's preparation and fair presentation of the separate and consolidated financial
statements in order to design audit procedures that are appropriate in the circumstances, but not for the purpose
of expressing an opinion on the effectiveness of the entity's internal control. An audit also includes evaluating the
appropriateness of accounting policies used and the reasonableness of accounting estimates made by
management, as well as evaluating the overall presentation of the separate and consolidated financial statements.
e believe that the audit evidence we have obtained is sufficient and appropriate to provide a basis for our audit
“Coca-Cola Hellenic
of 31 December 2012 and
statement of changes in
a summary of significant accounting policies and other
Financial Statements
and consolidated financial
statements in accordance with International Financial Reporting Standards, as adopted by the European Union,
and for such internal control as management determines is necessary to enable the preparation of separate and
ed financial statements that are free from material misstatement, whether due to fraud or error.
and consolidated financial statements based on our
our audit in accordance with International Standards on Auditing. Those standards require
that we comply with ethical requirements and plan and perform the audit to obtain reasonable assurance about
ts are free from material misstatement.
An audit involves performing procedures to obtain audit evidence about the amounts and disclosures in the
and consolidated financial statements. The procedures selected depend on the auditor's judgment,
and consolidated financial
statements, whether due to fraud or error. In making those risk assessments, the auditor considers internal
and consolidated financial
statements in order to design audit procedures that are appropriate in the circumstances, but not for the purpose
l. An audit also includes evaluating the
appropriateness of accounting policies used and the reasonableness of accounting estimates made by
and consolidated financial statements.
e believe that the audit evidence we have obtained is sufficient and appropriate to provide a basis for our audit

PricewaterhouseCoopers SA, 268 Kifissias Avenue, 15232 Halandri, Greece T:+30 210 6874400, F:+30 210 6874444, www.pwc.gr 17 Ethnikis Antistassis Str, 55134 Thessaloniki, T:+30 2310 488880 F:+30 2310 459487
Opinion
In our opinion, the separate and consolidated financial statements present fairly, in all material respects, the
financial position of the “Coca-Cola Hellenic Bottling Company S.A.” and its subsidiaries as at December 31, 2012,
and their financial performance and cash flows for the year then ended in accordance with International Financial
Reporting Standards, as adopted by the European Union.
Reference on Other Legal and Regulatory Matters a) Included in the Board of Directors’ Report is the corporate governance statement that contains the
information that is required by paragraph 3d of article 43a of Codified Law 2190/1920. b) We verified the conformity and consistency of the information given in the Board of Directors’ report with the
accompanying separate and consolidated financial statements in accordance with the requirements of articles 43a, 108 and 37 of Codified Law 2190/1920.
Athens, 4 March 2013 The Certified Auditor – Accountant
PricewaterhouseCoopers Certified Auditors - Accountants 268 Kifissias Avenue, Halandri 152 32 Marios Psaltis SOEL Reg. No. 113 SOEL Reg. No. 38081

Annual Report 2012 Coca-Cola Hellenic
5. Consolidated Financial Statements and Accompanying Notes for the year ended 31 December 2012

The accompanying notes form an integral part of these consolidated financial statements.
Page 1 of 97
Annual Report 2012 Coca-Cola Hellenic
Consolidated Balance Sheet As at 31 December 2012 20111 20101 Note € million € million € million
Assets Intangible assets ................................................................................................ 4 1,944.6 1,935.4 1,954.6 Property, plant and equipment ................................................................................................ 5 3,041.4 2,998.1 3,072.3 Equity method investments ................................................................................................ 6 168.5 141.7 91.8 Available-for-sale financial assets ................................................................................................ 7 1.7 1.2 1.6 Derivative assets ................................................................................................ 8 35.8 69.5 73.1 Deferred tax assets ................................................................................................ 9 40.1 35.1 34.8 Other non-current assets ................................................................................................ 10 47.2 47.4 49.3
Total non-current assets ................................................................................................ 5,279.3 5,228.4 5,277.5 Inventories ................................................................................................................................ 11 458.0 447.7 477.4
Trade receivables ................................................................................................ 12 801.3 854.7 870.5 Other receivables and assets ................................................................................................ 13 235.5 229.9 234.9 Derivative assets ................................................................................................ 8 13.6 15.7 4.2 Current tax assets ................................................................................................ 23.3 19.7 13.8 Cash and cash equivalents ................................................................................................ 14 439.1 447.4 306.7
Total current assets ................................................................................................ 1,970.8 2,015.1 1,907.5
Total assets ................................................................................................................................ 7,250.1 7,243.5 7,185.0 Liabilities
Short-term borrowings ................................................................................................ 15 555.0 321.5 531.2 Cross-currency swap contracts ................................................................................................ 8 67.8 — — Trade payables ................................................................................................................................ 16 435.8 417.8 378.8 Other payables ................................................................................................................................ 16 1,130.5 1,114.3 1,083.9 Current tax liabilities ................................................................................................ 33.2 57.5 36.6
Total current liabilities ................................................................................................ 2,222.3 1,911.1 2,030.5 Long-term borrowings ................................................................................................ 15 1,604.7 1,939.8 1,662.8
Cross-currency swap contracts ................................................................................................ 8 75.6 130.8 136.1 Deferred tax liabilities ................................................................................................ 9 177.4 172.1 165.2 Non-current provisions ................................................................................................ 17 149.0 155.4 145.8 Other non-current liabilities ................................................................................................ 14.6 14.1 13.5
Total non-current liabilities ................................................................................................ 2,021.3 2,412.2 2,123.4
Total liabilities ................................................................................................................................ 4,243.6 4,323.3 4,153.9 Equity
Share capital ................................................................................................................................ 18 370.2 549.8 183.1 Share premium ................................................................................................................................ 18 569.3 569.2 1,119.2 Treasury shares ................................................................................................................................ 19 (54.3) (55.5) (57.2) Exchange equalisation reserve ................................................................................................ 19 (168.1) (199.7) (131.0) Other reserves ................................................................................................................................ 19 376.6 380.0 366.4 Retained earnings ................................................................................................ 1,895.0 1,660.6 1,465.0 Equity attributable to owners of the parent ................................................................ 2,988.7 2,904.4 2,945.5 Non-controlling interests ................................................................................................ 28 17.8 15.8 85.6
Total equity ................................................................................................................................ 3,006.5 2,920.2 3,031.1
Total equity and liabilities ................................................................................................ 7,250.1 7,243.5 7,185.0 (1) Comparative figures have been restated where necessary to reflect changes in accounting policies as detailed in Note 1.

The accompanying notes form an integral part of these consolidated financial statements.
Page 2 of 97
Annual Report 2012 Coca-Cola Hellenic
Consolidated Income Statement Year ended 31 December
Note 2012 20111 20101 € million € million € million
Net sales revenue ................................................................................................ 3 7,044.7 6,824.3 6,761.6 Cost of goods sold ................................................................................................ (4,522.2) (4,254.7) (4,042.7)
Gross profit ................................................................................................................................ 2,522.5 2,569.6 2,718.9
Operating expenses ................................................................................................ 20 (2,078.1) (2,048.2) (2,048.4) Restructuring costs ................................................................................................ 20 (106.7) (71.1) (36.5) Operating profit ................................................................................................ 3 337.7 450.3 634.0
Finance income ................................................................................................ 10.4 8.7 6.9 Finance costs ................................................................................................................................ (98.0) (96.1) (82.8) Loss on net monetary position ................................................................................................ 21 (3.1) (7.8) — Total finance costs, net ................................................................................................ 21 (90.7) (95.2) (75.9) Share of results of equity method investments ................................................................ 6 11.6 9.4 10.4 Profit before tax ................................................................................................ 258.6 364.5 568.5
Tax ................................................................................................................................ 3,22 (65.2) (98.8) (137.8) Profit after tax ................................................................................................ 193.4 265.7 430.7
Attributable to: Owners of the parent ................................................................................................ 190.4 264.4 421.0 Non-controlling interests ................................................................................................ 3.0 1.3 9.7
193.4 265.7 430.7 Basic and diluted earnings per share (€) ................................................................ 23 0.52 0.73 1.16 (1) Comparative figures have been restated where necessary to reflect changes in accounting policies as detailed in Note 1.

The accompanying notes form an integral part of these consolidated financial statements.
Page 3 of 97
Annual Report 2012 Coca-Cola Hellenic
Consolidated Statement of Comprehensive Income Year ended 31 December
2012 20111 20101 € million € million € million
Profit after tax ................................................................................................ 193.4 265.7 430.7 Other comprehensive income: Items that may be subsequently reclassified to income statement: Available-for-sale financial assets: Valuation gains / (losses) during the year ................................ 0.2 (0.4) 0.5 Valuation (gains)/losses reclassified to profit and loss for the year ................................................................ — 0.2 — (0.4) (2.8) (2.3) Cash flow hedges: Amounts of (losses) / gains during the year ................................ (22.9) 5.3 (11.3) Amounts of losses reclassified to profit and loss for the year ................................................................ 9.5 (13.4) 3.1 8.4 2.0 (9.3) Foreign currency translation ................................................................ 32.4 (54.4) 182.0 Share of other comprehensive income of equity method investments ................................................................ (0.8) (0.6) 0.9 Income tax relating to items that may be subsequently reclassified to income statement (refer to Note 24) ................................ 2.9 (2.6) 0.3 21.3 (49.6) 171.6 Items that will not be subsequently reclassified to income statement: Actuarial (losses) / gains ................................................................ (15.2) (27.7) 6.1 Income tax relating to items that will not be subsequently reclassified to income statement (refer to Note 24) ................................ 2.6 5.7 (1.3) (12.6) (22.0) 4.8 Other comprehensive income for the year, net of tax (refer to Note 24) ................................................................ 8.7 (71.6) 176.4 Total comprehensive income for the year ................................ 202.1 194.1 607.1 Total comprehensive income attributable to: Owners of the parent ................................................................ 199.1 187.8 593.3 Non-controlling interests ................................................................ 3.0 6.3 13.8
202.1 194.1 607.1
(1) Comparative figures have been restated where necessary to reflect changes in accounting policy as detailed in Note 1.

The accompanying notes form an integral part of these consolidated financial statements.
Page 4 of 97
Annual Report 2012 Coca-Cola Hellenic
Consolidated Statement of Changes in Equity
Attributable to owners of the parent
Exchange Non-
Share Share Treasury equalisa- Other Retained controlling Total
capital premium shares tion reserve reserves earnings Total interests equity € million € million € million € million € million € million € million € million € million
Balance as at 1 January 2010 182.8 1,113.8 (14.9) (309.1) 368.8 1,112.3 2,453.7 101.2 2,554.9 Changes in accounting policy (Note 1) ................................................................ — — — (1.8) (9.0) 7.1 (3.7) (20.8) (24.5)
Balance as at 1 January 2010
(adjusted) ................................................................182.8 1,113.8 (14.9) (310.9) 359.8 1,119.4 2,450.0 80.4 2,530.4
Shares issued to employees
exercising stock options ................................................................0.3 5.4 — — — — 5.7 — 5.7
Share-based compensation:
Options ................................................................ — — — — 6.7 — 6.7 — 6.7
Movement in treasury shares ................................ — — — — 0.2 — 0.2 0.2 Shares repurchased ................................................................— — (42.3) — — — (42.3) — (42.3)
Exchange equalisation reserve recycled to retained earnings ................................ — — — 1.1 — (1.1) — — —
Appropriation of reserves ................................ — — — — 11.0 (11.0) — — — Purchase of shares held by non-controlling
interests in subsidiary in Serbia ................................— — — — — — — (3.7) (3.7) Dividends ................................................................ — — — — — (68.1) (68.1) (4.9) (73.0)
183.1 1,119.2 (57.2) (309.8) 377.7 1,039.2 2,352.2 71.8 2,424.0
Profit for the year net of tax ................................ — — — — — 421.0 421.0 9.7 430.7 Other comprehensive income for
the year, net of tax ................................................................— — — 178.8 (11.3) 4.8 172.3 4.1 176.4
Total comprehensive income for
the year, net of tax(1) ................................................................— — — 178.8 (11.3) 425.8 593.3 13.8 607.1
Balance as at 31 December 2010 183.1 1,119.2 (57.2) (131.0) 366.4 1,465.0 2,945.5 85.6 3,031.1
(1) The amount included in the exchange equalisation reserve of €178.8m gain for 2010 represents the exchange gains attributable to the owners of the parent of €177.9m plus
the share of equity method investments of €0.9m gain. The amount included in other reserves of €11.3m loss for 2010 consists of losses on cash flow hedges of €9.3m (of which €11.3m represents losses for the year and €2.0m
represents revaluation losses reclassified to profit and loss for the year), losses on valuation of available-for-sale financial assets of €2.3m (of which €0.5m represents revaluation gains for the year and €2.8m represents revaluation gains reclassified to profit and loss for the year) and the deferred income tax credit thereof amounting to €0.3m.
The amount of €425.8m profit comprises of profit for the year of €421.0m plus actuarial gains of €6.1m less deferred income tax debit of €1.3m. The amount of €13.8m income included in non-controlling interests for 2010 represents the share of non-controlling interests in the exchange equalisation reserve of
€4.1m gain and in the retained earnings of €9.7m income.

The accompanying notes form an integral part of these consolidated financial statements.
Page 5 of 97
Annual Report 2012 Coca-Cola Hellenic
Consolidated Statement of Changes in Equity (continued)
Attributable to owners of the parent
Exchange Non-
Share
Share Treasury equalisa- Other Retained controlling Total
capital
premium shares tion reserve reserves earnings Total interests equity
€ million
€ million € million € million € million € million € million € million € million
Balance as at 31 December 2010
(adjusted) ................................................................183.1 1,119.2 (57.2) (131.0) 366.4 1,465.0 2,945.5 85.6 3,031.1 Shares issued to employees
exercising stock options ................................0.2 4.5 — — — — 4.7 — 4.7
Share-based compensation:
Options ................................................................— — — — 8.1 — 8.1 — 8.1 Movement in treasury shares ................................— — — — (0.4) — (0.4) — (0.4) Capitalisation of share premium
reserve ................................................................549.7 (549.7) — — — — — — — Expenses relating to share capital
increase (net of tax €1.2m) ................................— (4.8) — — — — (4.8) — (4.8) Return of capital to shareholders ................................(183.2) — 1.7 — — — (181.5) — (181.5)
Share capital increase
in subsidiary in Serbia ................................— — — — — (0.8) (0.8) 1.2 0.4 Purchase of shares held by
non-controlling interests ................................— — — (8.7) — (37.7) (46.4) (71.5) (117.9)
Appropriation of reserves ................................— — — — 0.5 (0.5) — — — Hyperinflation impact ................................— — — — — (7.8) (7.8) — (7.8) Dividends ................................................................— — — — — — — (5.8) (5.8)
549.8 569.2 (55.5) (139.7) 374.6 1,418.2 2,716.6 9.5 2,726.1
Profit for the year net of tax ................................— — — — — 264.4 264.4 1.3 265.7 Other comprehensive income for ................................
the year, net of tax ................................ — — — (60.0) 5.4 (22.0) (76.6) 5.0 (71.6)
Total comprehensive income for the year, net of tax(2) ................................— — — (60.0) 5.4 242.4 187.8 6.3 194.1
Balance as at 31 December 2011 549.8 569.2 (55.5) (199.7) 380.0 1,660.6 2,904.4 15.8 2,920.2
(2) The amount included in the exchange equalisation reserve of €60.0m loss for 2011 represents the exchange losses attributable to the owners of the parent of €59.4m plus the share of equity method investments of €0.6m loss.
The amount included in other reserves of €5.4m gain for 2011 consists of losses on valuation of available-for-sale financial assets of €0.4m representing revaluation losses for the year, cash flow hedges gain of €8.4m (of which €5.3m represents revaluation gains for the year and €3.1m represents revaluation losses reclassified to profit and loss for the year) and the deferred income tax loss of €2.6m.
The amount of €242.4m profit comprises of profit for the year of €264.4m less actuarial losses of €27.7m plus deferred income tax credit of €5.7m.
The amount of €6.3m gain included in non-controlling interests for 2011 represents the share of non-controlling interests in the exchange equalisation reserve of €5.0m gain and in the retained earnings of €1.3m income.

The accompanying notes form an integral part of these consolidated financial statements.
Page 6 of 97
Annual Report 2012 Coca-Cola Hellenic
Consolidated Statement of Changes in Equity (continued)
Attributable to owners of the parent
Exchange Non-
Share Share Treasury equalisa- Other Retained controlling Total
capital premium shares tion reserve reserves earnings Total interests equity
€ million € million € million € million € million € million € million € million € million
Balance as at 31 December 2011
(adjusted) ................................................................549.8 569.2 (55.5) (199.7) 380.0 1,660.6 2,904.4 15.8 2,920.2 Shares issued to employees
exercising stock options ................................— 0.1 — — — — 0.1 — 0.1 Share-based compensation:
Options ................................................................— — — — 6.3 — 6.3 — 6.3 Movement in treasury shares ................................— — — — 0.1 — 0.1 — 0.1
Return of capital to shareholders ................................(124.6) — 1.2 — — — (123.4) — (123.4) Reduction of share capital to
extinguish accumulated losses of the parent company ................................(55.0) — — — — 55.0 — — —
Share of other changes in equity of equity method investments ................................— — — — — (2.1) (2.1) — (2.1)
Appropriation of reserves ................................— — — — 0.5 (0.5) — — — Hyperinflation impact ................................— — — — — 4.2 4.2 — 4.2
Dividends ................................................................— — — — — — — (1.0) (1.0)
370.2 569.3 (54.3) (199.7) 386.9 1,717.2 2,789.6 14.8 2,804.4
Profit for the year net of tax ................................— — — — — 190.4 190.4 3.0 193.4
Other comprehensive income ................................
for the year, net of tax ................................— — — 31.6 (10.3) (12.6) 8.7 — 8.7
Total comprehensive income for
the year, net of tax(3) ................................— — — 31.6 (10.3) 177.8 199.1 3.0 202.1
Balance as at 31 December 2012 370.2 569.3 (54.3) (168.1) 376.6 1,895.0 2,988.7 17.8 3,006.5
(3) The amount included in the exchange equalisation reserve of €31.6m gain for 2012 represents the exchange gains attributable to the owners of the
parent of €32.4m plus the share of equity method investments of €0.8m loss.
The amount included in other reserves of €10.3m loss for 2012 consists of gains on valuation of available-for-sale financial assets of €0.2m, representing revaluation gains for the year, cash flow hedges loss of €13.4m (of which €22.9m represents revaluation losses for the year and €9.5m represents revaluation losses reclassified to profit and loss for the year), and the deferred income tax gain thereof amounting to €2.9m.
The amount of €177.8m profit comprises of profit for the year of €190.4m less actuarial losses of €15.2m plus deferred income tax credit of €2.6m.
The amount of €3.0m gain included in non-controlling interests for 2012 represents the share of non-controlling interests in the retained earnings.
For further details, please refer to: Note 18 Share capital and share premium; Note 19 Reserves; Note 25; Shares held for equity compensation plan; Note 26; Stock option compensation plans; and Note 29; Dividends.

The accompanying notes form an integral part of these consolidated financial statements.
Page 7 of 97
Annual Report 2012 Coca-Cola Hellenic
Consolidated Cash Flow Statement Year ended 31 December
Note 2012 20111 20101
Operating activities € million € million € million
Profit after tax ................................................................................................................................ 193.4 265.7 430.7 Total finance costs, net ................................................................................................................................ 21 90.7 95.2 75.9 Share of results of equity method investments ................................................................................................ 6 (11.6) (9.4) (10.4) Tax charged to the income statement ................................................................................................ 3,22 65.2 98.8 137.8 Depreciation of property, plant and equipment ................................................................................................ 3,5 375.3 368.3 381.2 Impairment of property, plant and equipment ................................................................................................ 3,5 33.0 21.0 — Employee share options ................................................................................................................................ 26 6.3 8.1 6.7 Amortisation of intangible assets ................................................................................................ 3,4 3.0 3.2 7.1 Other items ................................................................................................................................ 2.3 1.3 — 757.6 852.2 1,029.0 Losses on disposals of non-current assets ................................................................................................ 6.9 3.2 13.0 (Increase) / decrease in inventories ................................................................................................ (10.4) 15.3 (43.4) Decrease / (increase) in trade and other receivables ................................................................ 67.2 (0.8) (29.3) Increase in trade and other payables ................................................................................................ 27.3 46.8 140.5 Tax paid ................................................................................................................................ (95.0) (88.4) (139.4)
Net cash from operating activities ................................................................................................ 753.6 828.3 970.4 Investing activities Payments for purchases of property, plant and equipment ................................................................ (395.5) (363.9) (366.5) Payments for purchases of intangible assets ................................................................................................ — — (15.8) Proceeds from sales of property, plant and equipment ................................................................ 5.0 10.9 8.1 Net (payments for)/receipts from investments ................................................................................................ (21.1) (38.1) 10.9 Interest received ................................................................................................................................ 7.9 8.7 6.6 Net receipts from disposal of subsidiary ................................................................................................ 28 — 13.1 —
Net payments for acquisition of joint arrangement ................................................................ 28 — (2.5) —
Net cash used in investing activities ................................................................................................ (403.7) (371.8) (356.7) Financing activities Return of capital to shareholders ................................................................................................ 18,19 (123.4) (181.5) — Payments of expenses related to the share capital increase ................................................................ 18 — (6.0) — Share buy-back payments ................................................................................................................................ 19 — — (42.3) Purchase of shares held by non-controlling interests ................................................................ 28 (13.9) (74.2) (3.7) Proceeds from shares issued to employees exercising stock options ................................ 18 0.1 4.7 5.7 Dividends paid to owners of the parent ................................................................................................ 29 — — (102.0) Dividends paid to non-controlling interests ................................................................................................ (1.0) (5.8) (4.9) Proceeds from external borrowings ................................................................................................ 1,088.2 1,493.7 926.4 Repayments of external borrowings ................................................................................................ (1,186.2) (1,383.7) (1,178.1) Principal repayments of finance lease obligations ................................................................ (21.8) (48.1) (75.1) Proceeds from sale of interest rate swap contracts ................................................................ — — 33.0
Interest paid ................................................................................................................................ (100.5) (108.9) (71.8)
Net cash used in financing activities ................................................................................................ (358.5) (309.8) (512.8) Net (decrease)/increase in cash and cash equivalents ................................................................ (8.6) 146.7 100.9 Movement in cash and cash equivalents Cash and cash equivalents at 1 January ................................................................................................ 447.4 306.7 206.3
Net (decrease)/increase in cash and cash equivalents ................................................................ (8.6) 146.7 100.9
Effect of changes in exchange rates ................................................................................................ 0.9 1.6 (0.5)
Hyperinflation impact on cash ................................................................................................ (0.6) (7.6) —
Cash and cash equivalents at 31 December ................................................................................................ 14 439.1 447.4 306.7
(1) Comparative figures have been restated where necessary to reflect changes in accounting policy as detailed in Note 1.

Notes to the Consolidated Financial Statements
1. Basis of preparation and accounting policies
Page 8 of 97
Annual Report 2012 Coca-Cola Hellenic
Description of business
Coca-Cola Hellenic Bottling Company S.A. (‘Coca-Cola Hellenic’ or ‘the Group’) is a Société Anonyme (corporation) incorporated in Greece and founded in 1969. It took its current form in August 2000 through the acquisition of the Coca-Cola Beverages plc (‘CCB’) by Hellenic Bottling Company S.A. (‘HBC’). Coca-Cola Hellenic and its subsidiaries (collectively ‘the Company’ or ‘the Group’) are principally engaged in the production, sales and distribution of non-alcoholic ready to drink beverages, under franchise from The Coca-Cola Company (‘TCCC’). The Company distributes its products in 27 countries in Europe and Nigeria. Information on the Company’s operations by segment is included in Note 3.
Coca-Cola Hellenic’s shares are listed on the Athens Exchange (symbol: EEEK), with a secondary listing on the London Stock Exchange (symbol: CCB). Coca-Cola Hellenic’s American Depositary Receipts (ADRs) are listed on the New York Stock Exchange (symbol: CCH).
On 11 October 2012, Coca-Cola HBC AG, a Swiss company incorporated by Kar-Tess Holding, announced a voluntary share exchange offer to acquire all outstanding ordinary registered shares and all American depositary shares of Coca-Cola Hellenic. The transaction is progressing in line with Coca-Cola HBC AG’s most recent announcements and we expect commencement of the acceptance period after publication of Coca-Cola Hellenic’s audited full year 2012 financial statements and completion of the voluntary share exchange offer early in the second quarter of 2013.
These consolidated financial statements were approved for issue by the Board of Directors on 1 March 2013 and are expected to be verified at the Annual General Meeting to be held on 12 June 2013.
Basis of preparation
The consolidated financial statements included in this document are prepared in accordance with International Financial Reporting Standards (‘IFRS’) as issued by the International Accounting Standards Board (‘IASB’) and IFRS as adopted by the European Union (“EU”).
IFRS as adopted by the EU differs in certain respects from IFRS as issued by the IASB. However, the differences have no significant impact on the Group’s consolidated financial statements for the periods presented.
The consolidated financial statements are prepared under the historical cost convention, as modified by the revaluation of available-for-sale financial assets and derivative financial instruments and the financial statements of certain subsidiaries operating in a hyperinflationary economy which are restated and expressed in terms of the measuring unit currency at the balance sheet date and translated to Euro at the exchange rate of the balance sheet date.
Basis of consolidation
Subsidiary undertakings are those companies over which the Group, directly or indirectly, has control. The Group controls an entity when the Group is exposed to, or has rights to, variable returns from its involvement with the entity and has the ability to affect those returns through power over the entity. Subsidiary undertakings are consolidated from the date on which effective control is transferred to the Group and cease to be consolidated from the date on which effective control is transferred out of the Group.
The acquisition method of accounting is used to account for business combinations. The consideration transferred is the fair value of any asset transferred, shares issued and liabilities assumed. The consideration transferred includes the fair value of any asset or liability resulting from a contingent consideration arrangement. Identifiable assets acquired and liabilities and contingent liabilities assumed are measured initially at their fair values at the acquisition date. The excess of the consideration transferred and the fair value of non controlling interest over the net assets acquired and liabilities assumed is recorded as goodwill. All acquisition related costs are expensed as incurred.

Notes to the Consolidated Financial Statements (continued)
1. Basis of preparation and accounting policies (continued)
Page 9 of 97
Annual Report 2012 Coca-Cola Hellenic
For each business combination, the Group elects whether it measures the non-controlling interest in the acquiree either at fair value or at the proportionate share of the acquiree’s identifiable net assets.
Transactions with non-controlling interests that do not result in loss of control are accounted for as equity transactions – that is, as transactions with the owners in their capacity as owners. The difference between fair value of any consideration paid and the relevant share acquired of the carrying value of net assets of the subsidiary is recorded in equity. Intercompany transactions and balances between Group companies are eliminated. Accounting policies of subsidiaries are modified where necessary to ensure consistency with policies adopted by the Group.
When the Group ceases to have control any retained interest in the entity is re-measured to its fair value at the date when such control is lost, with the change in carrying amount recognised in profit or loss. The fair value is the initial carrying amount for the purposes of subsequently accounting for the retained interest as an associate, joint venture or financial asset. In addition, any amounts previously recognised in other comprehensive income in respect of that entity are accounted for as if the Group had directly disposed of the related assets or liabilities. This may mean that amounts previously recognised in other comprehensive income are reclassified to profit or loss.
Critical accounting judgments and estimates
In conformity with generally accepted accounting principles, the preparation of the consolidated financial statements for Coca-Cola Hellenic requires management to make estimates and assumptions that affect the reported amounts of assets, liabilities, revenues and expenses, and the disclosure of contingent assets and liabilities in the consolidated financial statements and accompanying notes. Although these estimates are based on management’s knowledge of current events and actions that may be undertaken in the future, actual results may ultimately differ from estimates.
Income taxes
The Group is subject to income taxes in numerous jurisdictions. There are many transactions and calculations for which the ultimate tax determination cannot be assessed with certainty in the ordinary course of business. The Group recognises provision for potential liabilities that may arise as a result of tax audit issues based on assessment of the probabilities as to whether additional taxes will be due. Where the final tax outcome on these matters is different from the amounts that were initially recorded, such differences will impact the income tax provision in the period in which such determination is made. The Group anticipates that were the final tax outcome, on the judgment areas, to differ from management's estimates by up to 10% the Group’s tax expense would increase (or decrease) by less than €2.9m.
Impairment of goodwill and indefinite-lived intangible assets
Determining whether goodwill or indefinite-lived intangible assets are impaired requires an estimation of the value-in-use of the cash-generating units to which they have been allocated in order to determine the recoverable amount of the cash generating units. The value-in-use calculation requires the Group to estimate the future cash flows expected to arise from the cash-generating unit and a suitable discount rate in order to calculate present value. These assumptions and a discussion on how they are established are described in Note 4.
Employee Benefits—Defined Benefit Pension Plans
The Group provides defined benefit pension plans as an employee benefit in certain territories. Determining the value of these plans requires several actuarial assumptions and estimates about discount rates, future salary increases and future pension increases. Due to the long-term nature of these plans, such estimates are subject to significant uncertainty. Details of assumptions used, including a sensitivity analysis are given in Note 17.
Joint Arrangements
The Group participates in several joint arrangements. Judgment is required in order to determine their classification as a joint venture where the Group has rights to the net assets of the arrangement or a joint operation where the Group has rights to the assets and obligations for the liabilities of the arrangement. In making this judgment, consideration is given to the legal form of the arrangement, the contractual terms and conditions as well as other facts and circumstances (including the

Notes to the Consolidated Financial Statements (continued)
1. Basis of preparation and accounting policies (continued)
Page 10 of 97
Annual Report 2012 Coca-Cola Hellenic
economic rationale of the arrangement and the impact of the legal framework in which the arrangement operates). The Group’s joint arrangements are further discussed in Note 6.
Revenue recognition
Revenues are recognised when all of the following conditions are met: when the amount of revenue can be reliably measured; when it is probable that future economic benefits will flow to the Group and when the significant risks and rewards of ownership of the products have passed to the buyer, usually on delivery of the goods.
Revenue is measured at the fair value of the consideration received or receivable and is stated net of sales discounts, value added taxes and sales taxes as applicable, listing fees and marketing and promotional incentives provided to customers. Listing fees are incentives provided to customers for carrying the Company’s products in their stores. Listing fees that are subject to contract-based term arrangements are capitalised and amortised over the term of the contract as a reduction to revenue. All other listing fees as well as marketing and promotional incentives are a reduction of revenue as incurred. The amount of listing fees capitalised at 31 December 2012 was €25.3m (31 December 2011 and 2010: €23.2m and €31.6m respectively). Of this balance, €16.7m (31 December 2011 and 2010: €13.5m and €19.5m) was classified as current prepayments and the remainder as non-current prepayments. Listing fees recognized as a reduction to revenue for the year ended 31 December 2012 amounted to €419.2m (years ended 31 December 2011 and 2010: €311.3m and €240.0m respectively). Marketing and promotional incentives provided to customers during the year ended 31 December 2012 amounted to €185.5m (years ended 31 December 2011 and 2010: €131.4m and €160.3m respectively).
Coca-Cola Hellenic receives contributions from TCCC in order to promote sales of brands of The Coca-Cola Company. Contributions for price support, marketing and promotional campaigns in respect of specific customers are recognised as an offset to promotional incentives provided to those customers to which the contributions contractually relate. These contributions are accrued and matched to the expenditure to which they relate. In the year ended 31 December 2012, such contributions totaled €51.2m (years ended 31 December 2011 and 2010 €49.0m and €48.8m respectively).
Earnings per share
Basic earnings per share is calculated by dividing the net profit attributable to the owners of the parent by the weighted average number of ordinary shares outstanding during the year. The weighted average number of ordinary shares outstanding during the year is the number of ordinary shares outstanding at the beginning of the year, adjusted by the number of ordinary shares bought back or issued during the year multiplied by a time-weighting factor. Diluted earnings per share incorporates stock options for which the average share price for the year is in excess of the exercise price of the stock option and there is a dilutive effect.
Intangible assets
Intangible assets consist mainly of goodwill, trademarks and franchise agreements. Goodwill is the excess of the consideration transferred over the fair value of the share of net assets acquired. Goodwill and other indefinite-lived intangible assets are not amortised but rather tested for impairment annually and whenever there is an indication of impairment. Goodwill and other indefinite-lived intangible assets are carried at cost less accumulated impairment losses.
For the purpose of impairment testing, goodwill is allocated to each of the Group’s cash-generating units expected to benefit from the business combination in which the goodwill arose. Other indefinite-lived intangible assets are also allocated to the Group’s cash-generating units expected to benefit from those intangibles. The cash-generating units to which goodwill and other indefinite-lived intangible assets have been allocated are tested for impairment annually, or more frequently when there is an indication that the unit may be impaired. If the recoverable amount (i.e. the higher of the value in use and fair value less costs to sell) of the cash-generating unit is less than the carrying amount of the unit, the impairment loss is allocated first to reduce the carrying amount of any goodwill allocated to the unit and then pro-rata to the other assets of the unit on the basis of the carrying amount of each asset in the unit. Impairment losses recognised against goodwill are not reversed in subsequent periods.

Notes to the Consolidated Financial Statements (continued)
1. Basis of preparation and accounting policies (continued)
Page 11 of 97
Annual Report 2012 Coca-Cola Hellenic
Intangible assets with finite lives consist mainly of trademarks and water rights and are amortised over their useful economic lives.
The useful life of trademarks is determined after considering potential limitations that could impact the life of the trademark, such as technological and market limitations and the intent of management. The majority of the Group’s trademarks have been assigned an indefinite useful life as they have an established sales history in the applicable region, it is the intention of the Group to receive a benefit from them indefinitely and there is no indication that this will not be the case.
The useful life of franchise agreements is usually based on the term of the respective franchise agreements. TCCC does not grant perpetual franchise rights outside the United States, however, the Group believes its franchise agreements, consistent with past experience, will continue to be renewed at each expiration date and have therefore been assigned indefinite useful lives.
The useful lives, both finite and indefinite, assigned to intangible assets are evaluated on an annual basis.
Goodwill and fair value adjustments arising on the acquisition of subsidiaries are treated as the assets and liabilities of those subsidiaries. These balances are denominated in the functional currency of the subsidiary and are translated to euro on a basis consistent with the other assets and liabilities of the subsidiary.
Property, plant and equipment
All property, plant and equipment is initially recorded at cost and subsequently measured at cost less accumulated depreciation and impairment losses. Subsequent expenditure is added to the carrying value of the asset when it is probable that future economic benefits, in excess of the original assessed standard of performance of the existing asset, will flow to the operation. All other subsequent expenditure is expensed in the period in which it is incurred. Assets under construction are recorded as part of property, plant and equipment and depreciation on these assets commences when the assets are available for use.
Depreciation is calculated on a straight-line basis to allocate the depreciable amount over the estimated useful life of the assets as follows:
Freehold buildings ................................................................ 40 years Leasehold buildings and improvements ................................ Over the lease term, up to 40 years Production equipment ........................................................... 4 to 12 years Vehicles ................................................................................ 5 to 8 years Computer hardware and software ......................................... 3 to 7 years Marketing equipment ............................................................ 3 to 10 years Fixtures and fittings .............................................................. 8 years Returnable containers ........................................................... 3 to 12 years
Freehold land is not depreciated as it is considered to have an indefinite life.
Deposits received for returnable containers by customers are accounted for as deposit liabilities.
Residual values and useful lives of assets are reviewed and adjusted if appropriate at each balance sheet date.
Impairment of non-financial assets
Goodwill and other indefinite-lived assets are not amortised but rather tested for impairment annually and whenever there is an indication of impairment. Property, plant and equipment and other non-financial assets that are subject to

Notes to the Consolidated Financial Statements (continued)
1. Basis of preparation and accounting policies (continued)
Page 12 of 97
Annual Report 2012 Coca-Cola Hellenic
amortisation are reviewed for impairment whenever events or changes in circumstances indicate that the carrying amount may not be recoverable. An impairment loss is recognised for the amount by which the carrying amount of the asset exceeds its recoverable amount, which is the higher of the asset’s fair value less cost to sell and its value-in-use. For the purposes of assessing impairment, assets are grouped at the lowest level of separately identifiable cash flows.
Borrowing costs
Borrowing costs directly attributable to the acquisition, construction or production of qualifying assets, which are assets that necessarily take a substantial period of time to be prepared for their intended use or sale, are added to the cost of those assets, until such time as the assets are substantially ready for their intended use or sale. Investment income earned on the temporary investment of specific borrowings pending their use for qualifying assets is deducted from the borrowing costs eligible for capitalisation.
All other borrowing costs are expensed as part of finance costs in the period in which they are incurred.
Investments in associates
Investments in associated undertakings are accounted for by the equity method of accounting. Associated undertakings are all entities over which the Group has significant influence but not control, generally accompanying a shareholding of between 20% to 50% of the voting rights.
The equity method of accounting involves recognising the Group’s share of the associates’ post acquisition profit or loss for the period in the income statement and its share of the post-acquisition movement in other comprehensive income is recognised in other comprehensive income. Unrealized gains and losses resulting from transactions between the Group and the associate are eliminated to the extent of the interest in the associate.
The Group’s interest in each associate is carried in the balance sheet at an amount that reflects its share of the net assets of the associate and includes goodwill on acquisition. When the Group’s share of losses in an associate equals or exceeds its interest in the associate, the Group does not recognise further losses, unless the Group has incurred obligations or made payments on behalf of the associate.
Investment in joint arrangements
Joint arrangements are arrangements in which the Group has contractually agreed sharing of control, which exists only when decisions about the relevant activities require unanimous consent. Joint arrangements are classified as joint operations or joint ventures depending upon the rights and obligations arising from the joint arrangement and are accounted for as follows:
The Group classifies a joint arrangement as a joint operation when the Group has the rights to the assets, and obligations for the liabilities, of the arrangement and accounts for each of its assets, liabilities, revenues and expenses, including its share of those held or incurred jointly, in relation to the joint operation.
The Group classifies a joint arrangement as a joint venture when the Group has rights to the net assets of the arrangement. The Group accounts for its interests in joint ventures using the equity method of accounting as described in “Investment for associates” above.
If facts and circumstances change, the Group reassesses whether it still has joint control and whether the type of joint arrangement in which it is involved has changed.

Notes to the Consolidated Financial Statements (continued)
1. Basis of preparation and accounting policies (continued)
Page 13 of 97
Annual Report 2012 Coca-Cola Hellenic
Financial assets
The Group classifies its investments in debt and equity securities into the following categories: financial assets at fair value through profit or loss (‘FVTPL’), held-to-maturity and available-for-sale. The classification depends on the purpose for which the investment was acquired. FVTPL and available-for-sale financial assets are carried at fair value. Investments that are acquired principally for the purpose of generating a profit from short-term fluctuations in price are classified as FVTPL investments and included in current assets. Investments with a fixed maturity that management has the intent and ability to hold to maturity are classified as held-to-maturity and are included in non-current assets, except for those with maturities within twelve months from the balance sheet date, which are classified as current assets. Investments intended to be held for an indefinite period of time, which may be sold in response to needs for liquidity or changes in interest rates, are classified as available-for-sale and are classified as non-current assets, unless they are expected to be realised within twelve months of the balance sheet date.
Regular purchases and sales of investments are recognised on the trade date which is the day the Group commits to purchase or sell. The investments are recognised initially at fair value plus transactions costs, except in the case of FVTPL. For investments traded in active markets, fair value is determined by reference to stock exchange quoted bid prices. For other investments, fair value is estimated by reference to the current market value of similar instruments or by reference to the discounted cash flows of the underlying net assets.
Gains and losses on investments classified as FVTPL are recognised in the income statement in the period in which they arise. Unrealised gains and losses on available-for-sale financial assets are recognised in other comprehensive income, except for impairment losses and foreign exchange gains and losses on monetary financial assets that are recognised in the income statement, until the financial assets are derecognised at which time the cumulative gains or losses previously recognised in equity are reclassified to the income statement.
Held-to-maturity investments are carried at amortised cost using the effective interest rate method. Gains and losses on held-to-maturity investments are recognised in the income statement, when the investments are derecognised or impaired.
Non-current assets held for sale
Non-current assets and disposal groups are classified as held for sale if their carrying amount will be principally recovered through a sale transaction rather than through continuing use. This condition is regarded as met only when the sale is highly probable and the asset (or disposal group) is available for immediate sale in its present condition. In order for a sale to be considered highly probable, management must be committed to the sale, an active programme to locate a buyer and complete the plan has been initiated, and the sale is expected to be completed within one year from the date of classification.
Non-current assets and disposal groups classified as held for sale are measured at the lower of the individual assets’ previous carrying amount and their fair value less costs to sell.
Inventories
Inventories are stated at the lower of cost and net realisable value.
Cost for raw materials and consumables is determined either on a first-in, first-out or weighted average basis, depending on the type of inventory. Cost for work in progress and finished goods is comprised of the cost of direct materials and labour plus attributable overhead costs. Cost includes all costs incurred to bring the product in its present location and condition.
Net realisable value is the estimated selling price in the ordinary course of business, less the estimated costs necessary to complete and sell the inventory.

Notes to the Consolidated Financial Statements (continued)
1. Basis of preparation and accounting policies (continued)
Page 14 of 97
Annual Report 2012 Coca-Cola Hellenic
Trade receivables
Trade receivables are initially recognised at fair value and subsequently measured at amortised cost. A provision for doubtful debts is established when there is objective evidence that the Group will not be able to collect all amounts due, according to the original terms of the trade receivable. Significant financial difficulties of the debtor, probability that the debtor will enter into bankruptcy or financial reorganisation and default or delinquency in payments are considered indicators that the trade receivable could be uncollectible. The amount of the provision is the difference between the receivable’s carrying amount and the present value of its estimated future cash flows, discounted at the original effective interest rate. The carrying amount of the receivable is reduced by the amount of the provision, which is recognised as part of operating expenses. If a trade receivable ultimately becomes uncollectible, it is written off initially against any provision made in respect of that receivable with any excess recognised as part of operating expenses. Subsequent recoveries of amounts previously written off or provisions no longer required are credited against operating expenses.
Trade payables
Trade payables are recognised initially at fair value and subsequently measured at amortised cost using the effective interest rate method.
Foreign currency and translation
The individual financial statements of each Group entity are presented in the currency of the primary economic environment in which the entity operates (its functional currency). For the purpose of the consolidated financial statements, the results and financial position of each entity are expressed in euro, which is the presentation currency for the consolidated financial statements.
The assets and liabilities of foreign subsidiaries are translated into euro at the exchange rate ruling at the balance sheet date. The results of foreign subsidiaries are translated into euro using the average monthly exchange rate, except for foreign subsidiaries operating in a hyperinflationary environment whose results are translated at the closing rate. The exchange differences arising on translation are recognised in other comprehensive income. On disposal of a foreign entity, accumulated exchange differences are recognised as a component of the gain or loss on disposal.
Transactions in foreign currencies are recorded at the rate ruling at the date of transaction. Monetary assets and liabilities denominated in foreign currencies are remeasured at the rate of exchange ruling at the balance sheet date. All gains and losses arising on remeasurement are included in income statement, except for exchange differences arising on assets and liabilities classified as cash flow hedges which are deferred in equity until the occurrence of the hedged transaction, at which time they are recognised in the income statement.
Entities operating in hyperinflationary economies prepare financial statements that are recorded in accordance with IAS 29 Financial Reporting in Hyperinflationary Economies. The gain or loss on net monetary position is recorded in finance costs. The application of hyperinflation accounting includes:
• Adjustment of the historical cost of non-monetary assets and liabilities and the various items of equity from their date of acquisition or inclusion in the balance sheet to the end of the year for the changes in purchasing power of the currency caused by inflation.
• The various components in the income statement and statement of cash flows have been adjusted for the inflation index since their generation.
• The subsidiary’s financial statements are translated at the closing exchange rate.

Notes to the Consolidated Financial Statements (continued)
1. Basis of preparation and accounting policies (continued)
Page 15 of 97
Annual Report 2012 Coca-Cola Hellenic
Cash and cash equivalents
Cash and cash equivalents comprise cash balances and highly liquid investments with an original maturity of three months or less. Bank overdrafts are classified as short-term borrowings in the balance sheet and for the purpose of the cash flow statement.
Borrowings
All loans and borrowings are initially recognised at the fair value net of transaction costs incurred.
After initial recognition, all interest-bearing loans and borrowings are subsequently measured at amortised cost. Amortised cost is calculated using the effective interest rate method whereby any discount, premium or transaction costs associated with a loan or borrowing is amortised to the income statement over the borrowing period.
Derivative financial instruments
The Group uses derivative financial instruments, including interest rate, currency and commodity derivatives, to manage interest, currency and commodity price risk associated with the Group’s underlying business activities. The Group does not use its derivative financial instruments for any trading activities.
All derivative financial instruments are initially recognised on the balance sheet at fair value and are subsequently remeasured at their fair value. Changes in the fair value of derivative financial instruments are recognised at each reporting date either in the income statement or in equity, depending on whether the derivative financial instrument qualifies for hedge accounting, and if so, whether it qualifies as a fair value hedge or a cash flow hedge. All derivative financial instruments that are not part of an effective hedging relationship (undesignated hedges) are classified as assets or liabilities at FVTPL.
At the inception of a hedge transaction the Group documents the relationship between the hedging instrument and the hedged item, as well as its risk management objective and strategy for undertaking the hedge transaction. This process includes linking the derivative financial instrument designated as a hedging instrument to the specific asset, liability, firm commitment or forecast transaction. Both at the hedge inception and on an ongoing basis, the Group assesses and documents whether the derivative financial instrument used in the hedging transaction is highly effective in offsetting changes in fair value or cash flow of the hedged item.
Changes in the fair values of derivative financial instruments that are designated and qualify as fair value hedges and are effective, are recorded in the income statement, together with the changes in the fair values of the hedged items that relate to the hedged risks. Changes in the fair value of derivative financial instruments that are designated and effective as hedges of future cash flows are recognised directly in other comprehensive income and the ineffective portion is recognised immediately in the income statement. Amounts accumulated in equity are recycled to the income statement as the related asset acquired or liability assumed affects the income statement. Changes in the fair values of derivative financial instruments that do not qualify for hedge accounting are recognised in the income statement as they arise.
Hedge accounting is discontinued when the hedging instrument expires or is sold, terminated, or exercised, or no longer qualifies for hedge accounting. At that time, any cumulative gain or loss on the hedging instrument recognised in equity is retained in equity until the forecast transaction occurs. If a hedged transaction is no longer expected to occur, the net cumulative gain or loss recognised in equity is transferred to the income statement.
Leases
Leases of property, plant and equipment, where the Group has substantially all the risks and rewards of ownership, are classified as finance leases. Other leases are classified as operating leases.
Rentals paid under operating leases are charged to the income statement on a straight-line basis over the lease term.

Notes to the Consolidated Financial Statements (continued)
1. Basis of preparation and accounting policies (continued)
Page 16 of 97
Annual Report 2012 Coca-Cola Hellenic
Finance leases are capitalised at the inception of the lease at the lower of the fair value of the leased assets and the present value of the minimum lease payments. Each lease payment is allocated between liability and finance charges to achieve a constant rate on the finance balance outstanding. The corresponding lease obligations, net of finance charges, are included in long-term borrowings. The interest element of the finance cost is charged to the income statement over the lease period, so as to produce a constant periodic rate of interest on the remaining balance of the liability for each period. Property, plant and equipment acquired under finance lease is depreciated over the shorter of the useful life of the asset and the lease term. The useful life for leased assets corresponds with the Group policy for the depreciable life of property, plant and equipment.
Provisions
Provisions are recognised when: the Group has a present obligation (legal or constructive) as a result of a past event; when it is probable that an outflow of resources embodying economic benefits will be required to settle the obligation; and when a reliable estimate can be made of the amount of the obligation. Where the Group expects a provision to be reimbursed, for example under an insurance contract, the reimbursement is recognised as a separate asset only when such reimbursement is virtually certain. If the effect of the time value of money is material, provisions are determined by discounting the expected future cash flows at a pre-tax rate that reflects current market assessments of the time value of money and the risks specific to the liability. Where discounting is used, the increase in the provision due to the passage of time is recognised as an interest expense.
Offsetting financial instruments
The Group offsets financial assets and financial liabilities to the net amount reported in the balance sheet when it currently has a legally enforceable right to offset the recognised amounts and it intends to settle on a net basis or to realise the asset and settle the liability simultaneously.
Employee benefits
The Group operates a number of defined benefit and defined contribution pension plans in its territories.
The defined benefit plans are made up of both funded and unfunded pension plans and employee leaving indemnities. The assets of funded plans are generally held in separate trustee-administered funds and are financed by payments from employees and/or the relevant Group companies.
The liability recognised in the balance sheet in respect of defined benefit plans is the present value of the defined benefit obligation at the balance sheet date less the fair value of the plan assets.
For defined benefit pension plans, pension costs are assessed using the projected unit credit method. Actuarial gains and losses arising from experience adjustments and changes in actuarial assumptions are charged or credited to equity in other comprehensive income in the period in which they arise. Such actuarial gains and losses are also immediately recognised in retained earnings and are not reclassified to the income statement in subsequent periods. The defined benefit obligations are measured at the present value of the estimated future cash outflows using interest rates of corporate or government bonds, depending on whether or not there is a deep market for corporate bonds in the relevant country, which have terms to maturity approximating the terms of the related liability. Past service cost is recognised immediately in the income statement. A number of the Group’s operations have other long service benefits in the form of jubilee plans. These plans are measured at the present value of the estimated future cash outflows with immediate recognition of actuarial gains and losses.
The Group’s contributions to the defined contribution pension plans are charged to the income statement in the period to which the contributions relate.

Notes to the Consolidated Financial Statements (continued)
1. Basis of preparation and accounting policies (continued)
Page 17 of 97
Annual Report 2012 Coca-Cola Hellenic
Share-based payments
Coca-Cola Hellenic issues equity-settled (stock options) and cash-settled (stock appreciation rights) share-based payments to its senior managers.
Equity-settled share-based payments are measured at fair value at the date of grant using a binomial stock option valuation model. Fair value reflects the parameters of the compensation plan, the risk-free interest rate, the expected volatility, the dividend yield and the early exercise experience of the Group’s plans. Expected volatility is determined by calculating the historical volatility of Coca-Cola Hellenic’s share price over previous years. The fair value determined at the grant date of the equity-settled share-based payments is expensed on a straight-line basis over the vesting period.
For cash-settled share-based payments, a liability equal to the portion of the vested stock appreciation rights is recognised at the current fair value determined at each balance sheet date using the same model and inputs as used for determining the fair value of stock options, with the exception of the risk-free interest rate, as described in Note 27.
In addition, the Group operates a stock purchase plan, an equity compensation in which eligible employees can participate. The Group makes contributions to a trust for participating employees and recognises expenses over the vesting period of the contributed shares. Any unvested shares held by the trust are owned by the Group and are recorded at cost on the balance sheet, within equity, until they vest.
Termination benefits
Termination benefits are payable whenever an employee’s employment is terminated before the normal retirement date or whenever an employee accepts voluntary redundancy in exchange for these benefits. The Group recognises termination benefits at the earlier of the following dates: a) when the Group can no longer withdraw the offer of those benefits and b) when the Group recognises costs for a restructuring that is within the scope of IAS 37 Provisions, Contingent Liabilities and Contingent Assets and involves the payment of termination benefits. In the case of an offer made to encourage voluntary redundancy, the termination benefits are measures based on the number of employees expected to accept the offer.
Taxes
The current income tax charge is calculated on the basis of the tax laws enacted or substantively enacted at the balance sheet date in the countries where the Group operates and generates taxable income. Management periodically evaluates positions taken in tax returns with respect to situations in which applicable tax regulations are subject to interpretation and establishes provisions where appropriate, on the basis of amounts expected to be paid to the tax authorities.
Deferred tax is provided using the liability method for all temporary differences arising between the tax bases of assets and liabilities and their carrying values for financial reporting purposes. However, the deferred tax liabilities are not recognised if they arise from the initial recognition of goodwill; deferred tax is not accounted for if it arises from initial recognition of an asset or liability in a transaction other than a business combination that at the time of the transaction affects neither accounting nor taxable profit or loss. Tax rates enacted or substantially enacted at the balance sheet date are those that are expected to apply when the deferred tax asset is realised or deferred tax liability is settled.
Deferred tax assets are recognised to the extent that it is probable that future taxable profit will be available against which the temporary differences can be utilised.
Deferred tax is provided on temporary differences arising on investments in subsidiaries, associates and joint ventures, except where the timing of the reversal of the temporary difference can be controlled by the Group, and it is probable that the temporary difference will not reverse in the foreseeable future.

Notes to the Consolidated Financial Statements (continued)
1. Basis of preparation and accounting policies (continued)
Page 18 of 97
Annual Report 2012 Coca-Cola Hellenic
Tax is recognised in the income statement, except to the extent that it relates to items recognised in other comprehensive income or in equity. In this case the tax is recognised in other comprehensive income or directly in equity respectively.
Deferred tax assets and deferred tax liabilities are offset if a legally enforceable right exists to set off current tax assets against current income tax liabilities and the deferred taxes relate to the same taxation authority on either the same taxable entity or different taxable entities where there is an intention to settle the balances on a net basis.
Franchise incentive arrangements
TCCC, at its sole discretion, provides the Group with various incentives, including contributions toward the purchase of cold drink equipment. Payments are made on placement of coolers and are based on franchise incentive arrangements. The terms and conditions of these arrangements require reimbursement if certain conditions stipulated in the agreements are not met, including minimum volume through-put requirements. Support payments received from TCCC for the placement of cold drink equipment are deducted from the cost of the related asset.
Share capital
Coca-Cola Hellenic has only one class of shares, ordinary shares. When new shares are issued, they are recorded in share capital at their par value. The excess of the issue price over the par value is recorded to the share premium reserve.
Incremental external costs directly attributable to the issue of new shares or to the process of returning capital to shareholders are recorded in equity as a deduction, net of tax, in the share premium reserve.
Dividends
Dividends are recorded in the Group’s consolidated financial statements in the period in which they are approved by the Group’s shareholders, with the exception of the statutory minimum dividend.
Under Greek corporate legislation, companies are required to declare dividends annually of at least 35% of unconsolidated adjusted after-tax IFRS profits. This statutory minimum dividend is recognised as a liability at the balance sheet date.
Comparative Figures
Comparative figures have been reclassified and adjusted where necessary to conform with changes in presentation in the current year and account for the change in the accounting policies discussed below.
Changes in accounting policies and disclosures:
The Group has early adopted IFRS 10 Consolidated Financial Statements, IFRS 12 Disclosure of Interests in Other
Entities and consequential amendments to IAS 28 Investments in Associates and Joint Ventures and IAS 27 Separate Financial Statements. At the same time, the Group has early adopted IFRS 11 Joint Arrangements. The Group assessed that the adoption of IFRS 10 did not result in any change in the consolidation status of its subsidiaries.
The adoption of IFRS 11 resulted in the Group changing its accounting policy for its interest in joint arrangements. Under IFRS 11, investments in joint arrangements are classified either as joint operations or joint ventures depending on the contractual rights and obligations each investor has, rather than the legal structure of the joint arrangement. Interests in joint ventures are accounted for using the equity method and interests’ in joint operations are accounted for by recognizing the

Notes to the Consolidated Financial Statements (continued)
1. Basis of preparation and accounting policies (continued)
Page 19 of 97
Annual Report 2012 Coca-Cola Hellenic
Group’s share of assets, liabilities, revenues and expenses. The Group has assessed the nature of its joint arrangements and
classified them as either joint operations or joint ventures. The adjustments on application of IFRS 11 relate primarily to a change in accounting for Brewinvest S.A. and BrewTech B.V., from proportionate consolidation to equity accounting, and recognizing our share of assets, liabilities, revenues and expenses in the Romerquelle joint arrangement. None of the Group’s other joint arrangements were materially affected by the application of IFRS 11.
In addition, the Group has early adopted the revised IAS 19 Employee Benefits. This resulted in the Group changing its accounting policy for defined benefit plans. Under the revised IAS 19, past service costs are recognized immediately in the income statement and the expected return on assets and interest costs have been replaced with a net interest amount.
The Group has also early adopted the IAS 1 Presentation of Items of Other Comprehensive income - Amendments to IAS 1 Presentation of Financial Statements. The amendments change the grouping of items presented in other comprehensive income between items that may be reclassified to the income statement at a future point in time and those that will not be reclassified.
The Group has applied the above mentioned changes in accounting policies at the beginning of the earliest period presented in accordance with transitional provisions of the amended standards. The impact from the adoption of IFRS 11 and IAS 19 revised is presented in the tables below:
Impact of change in accounting policies on consolidated Balance Sheet
2012
€ million 2011
€ million 2010
€ million
Before adjustments
Change in accounting
policies As
presented Before
adjustments
Change in accounting
policies As
presented Before
adjustments
Change in accounting
policies As presented
Assets Intangible assets 1,956.9 (12.3) 1,944.6 1,947.7 (12.3) 1,935.4 1,966.9 (12.3) 1,954.6 Property, plant and equipment 3,093.8 (52.4) 3,041.4 3,051.5 (53.4) 2,998.1 3,122.9 (50.6) 3,072.3 Equity method investments 43.7 124.8 168.5 42.9 98.8 141.7 41.1 50.7 91.8 Available-for-sale financial assets 1.9 (0.2) 1.7 1.4 (0.2) 1.2 1.8 (0.2) 1.6
Derivative assets 35.8 35.8 69.5 — 69.5 73.1 — 73.1 Deferred tax assets 40.6 (0.5) 40.1 35.2 (0.1) 35.1 35.0 (0.2) 34.8 Other non-current assets 39.8 7.4 47.2 36.9 10.5 47.4 40.4 8.9 49.3 Total non-current assets 5,212.5 66.8 5,279.3 5,185.1 43.3 5,228.4 5,281.2 (3.7) 5,277.5
Inventories. 460.6 (2.6) 458.0 451.5 (3.8) 447.7 481.7 (4.3) 477.4 Trade receivables 802.1 (0.8) 801.3 855.2 (0.5) 854.7 870.2 0.3 870.5 Other receivables and assets 234.7 0.8 235.5 231.5 (1.6) 229.9 233.5 1.4 234.9 Derivative assets 13.6 — 13.6 15.7 — 15.7 4.2 — 4.2 Current tax assets 23.3 — 23.3 20.0 (0.3) 19.7 13.8 — 13.8 Cash and cash equivalents 446.4 (7.3) 439.1 476.1 (28.7) 447.4 326.1 (19.4) 306.7 Total current assets 1,980.7 (9.9) 1,970.8 2,050.0 (34.9) 2,015.1 1,929.5 (22.0) 1,907.5 Total assets 7,193.2 56.9 7,250.1 7,235.1 8.4 7,243.5 7,210.7 (25.7) 7,185.0
Liabilities Short-term borrowings 560.3 (5.3) 555.0 321.5 — 321.5 535.1 (3.9) 531.2 Cross currency swaps 67.8 — 67.8 — — — — — — Trade payables 441.9 (6.1) 435.8 423.5 (5.7) 417.8 384.7 (5.9) 378.8 Other payables 1,135.0 (4.5) 1,130.5 1,118.0 (3.7) 1,114.3 1,079.4 4.5 1,083.9 Current tax liabilities 33.3 (0.1) 33.2 58.4 (0.9) 57.5 37.2 (0.6) 36.6 Total current liabilities 2,238.3 (16.0) 2,222.3 1,921.4 (10.3) 1,911.1 2,036.4 (5.9) 2,030.5
Long-term borrowings 1,542.2 62.5 1,604.7 1,934.5 5.3 1,939.8 1,656.4 6.4 1,662.8 Cross-currency swap contracts 75.6 75.6 130.8 — 130.8 136.1 — 136.1 Deferred tax liabilities 176.7 0.7 177.4 171.5 0.6 172.1 162.9 2.3 165.2 Non-current provisions 146.9 2.1 149.0 149.5 5.9 155.4 144.2 1.6 145.8

Notes to the Consolidated Financial Statements (continued)
1. Basis of preparation and accounting policies (continued)
Page 20 of 97
Annual Report 2012 Coca-Cola Hellenic
Other non-current liabilities 14.6 14.6 14.2 (0.1) 14.1 13.9 (0.4) 13.5 Total non-current liabilities 1,956.0 65.3 2,021.3 2,400.5 11.7 2,412.2 2,113.5 9.9 2,123.4 Total liabilities 4,194.3 49.3 4,243.6 4,321.9 1.4 4,323.3 4,149.9 4.0 4,153.9
Equity Share capital 370.2 — 370.2 549.8 — 549.8 183.1 — 183.1 Share premium 569.3 — 569.3 569.2 — 569.2 1,119.2 — 1,119.2 Treasury shares (54.3) — (54.3) (55.5) — (55.5) (57.2) — (57.2) Exchange equalisation reserve (166.2) (1.9) (168.1) (197.9) (1.8) (199.7) (129.2) (1.8) (131.0) Other reserves 381.1 (4.5) 376.6 389.0 (9.0) 380.0 375.4 (9.0) 366.4 Retained earnings 1,880.3 14.7 1,895.0 1,640.7 19.9 1,660.6 1,460.8 4.2 1,465.0 Equity attributable to owners of the parent 2,980.4 8.3 2,988.7 2,895.3 9.1 2,904.4 2,952.1 (6.6) 2,945.5 Non-controlling interests 18.5 (0.7) 17.8 17.9 (2.1) 15.8 108.7 (23.1) 85.6 Total equity 2,998.9 7.6 3,006.5 2,913.2 7.0 2,920.2 3,060.8 (29.7) 3,031.1 Total equity and liabilities 7,193.2 56.9 7,250.1 7,235.1 8.4 7,243.5 7,210.7 (25.7) 7,185.0
The impact to equity as at 1 January 2010 from the adoption of IFRS 11 and IAS 19 Revised was a reduction of €24.0 million and € 0.5 million respectively. The adjustments in the table above comprise the impact from the adoption of IFRS 11 and IAS 19 revised. The impact from the adoption of IAS 19 revised in 2010 was an increase in “non-current provisions” of €0.5m; the remaining adjustments in 2010 are due to the adoption of IFRS 11. The impact from the adoption of IAS 19 revised in 2011 was an increase in “non-current provisions” of €0.4m; the remaining adjustments in 2011 are due to the adoption of IFRS 11. The impact from the adoption of IAS 19 revised in 2012 was a reduction of “Deferred tax assets” of €0.4m, and a reduction in “non-current provisions” of €1.7m; the remaining adjustments in 2012 are due to the adoption of IFRS 11.
Impact of changes in accounting policies on consolidated Income Statement
2012
€ million 2011
€ million 2010
€ million
Before adjustments
Change in accounting
policies As
presented Before
adjustments
Change in accounting
policies As
presented Before
adjustments
Change in accounting
policies As
presented
Net sales revenue 7,078.3 (33.6) 7,044.7 6,854.3 (30.0) 6,824.3 6,793.6 (32.0) 6,761.6 Cost of goods sold (4,531.6) 9.4 (4,522.2) (4,258.8) 4.1 (4,254.7) (4,048.6) 5.9 (4,042.7) Gross profit . 2,546.7 (24.2) 2,522.5 2,595.5 (25.9) 2,569.6 2,745.0 (26.1) 2,718.9
Operating expenses (2,090.2) 12.1 (2,078.1) (2,055.6) 7.4 (2,048.2) (2,058.4) 10.0 (2,048.4) Restructuring costs (106.4) (0.3) (106.7) (71.5) 0.4 (71.1) (36.7) 0.2 (36.5) Operating profit 350.1 (12.4) 337.7 468.4 (18.1) 450.3 649.9 (15.9) 634.0
Finance income 10.7 (0.3) 10.4 9.8 (1.1) 8.7 7.4 (0.5) 6.9
Finance costs (98.3) 0.3 (98.0) (96.1) (96.1) (83.1) 0.3 (82.8) Loss on net monetary position (3.1) — (3.1) (7.8) — (7.8) — — — Total finance costs, net (90.7) — (90.7) (94.1) (1.1) (95.2) (75.7) (0.2) (75.9) Share of results of equity method investments 2.4 9.2 11.6 1.2 8.2 9.4 2.5 7.9 10.4 Profit before tax 261.8 (3.2) 258.6 375.5 (11.0) 364.5 576.7 (8.2) 568.5
Tax (66.7) 1.5 (65.2) (102.7) 3.9 (98.8) (138.0) 0.2 (137.8) Profit after tax. 195.1 (1.7) 193.4 272.8 (7.1) 265.7 438.7 (8.0) 430.7
Attributable to: Owners of the parent 192.0 (1.6) 190.4 268.9 (4.5) 264.4 426.6 (5.6) 421.0 Non-controlling interests 3.1 (0.1) 3.0 3.9 (2.6) 1.3 12.1 (2.4) 9.7
195.1 (1.7) 193.4 272.8 (7.1) 265.7 438.7 (8.0) 430.7
Basic and diluted earnings per share (€) 0.53 (0.01) 0.52 0.74 (0.01) 0.73 1.17 ( 0.01) 1.16

Notes to the Consolidated Financial Statements (continued)
1. Basis of preparation and accounting policies (continued)
Page 21 of 97
Annual Report 2012 Coca-Cola Hellenic
The adjustments in the table above comprise the impact from the adoption of IFRS 11 and IAS 19 revised. The impact from the adoption of IAS 19 revised in 2010 was an increase in “Cost of Goods sold” of €0.7m, an increase in “operating expenses” of €2.7m and a reduction in “Tax” of €0.7m; the remaining adjustments in 2010 are due to the adoption of IFRS 11. The impact from the adoption of IAS 19 revised in 2011 was an increase in “Cost of Goods sold” of €0.8m, an increase in “operating expenses” of €3.1m and a reduction in “Tax” of €0.7m; the remaining adjustments in 2011 are due to the adoption of IFRS 11. The impact from the adoption of IAS 19 revised in 2012 was an increase in “Cost of Goods sold” of €0.1m, an increase in “operating expenses of €0.5m and a reduction in “Tax” of €0.2m; the remaining adjustments in 2012 are due to the adoption of IFRS 11.
Impact of changes in accounting policies on consolidated Statement of Comprehensive income
2012
€ million 2011
€ million 2010
€ million
Before adjustments
Change in accounting
policies As
presented Before
adjustments
Change in accounting
policies As
presented Before
adjustments
Change in accounting
policies As
presented
Profit after tax 195.1 (1.7) 193.4 272.8 (7.1) 265.7 438.7 (8.0) 430.7 Other comprehensive income: Items that may be subsequently reclassified to income statement Available-for-sale financial assets 0.2 — 0.2 (0.4) — (0.4) (2.3) — (2.3) Cash flow hedges (13.4) — (13.4) 8.4 — 8.4 (9.3) — (9.3) Foreign currency translation 31.5 0.9 32.4 (54.2) (0.2) (54.4) 181.5 0.5 182.0 Share of other comprehensive income of equity method investments 0.1 (0.9) (0.8) (0.8) 0.2 (0.6) 1.4 (0.5) 0.9 Income tax relating to items that may be subsequently reclassified to income statement 2.9 — 2.9 (2.6) — (2.6) 0.3 — 0.3 21.3 — 21.3 (49.6) — (49.6) 171.6 — 171.6 Items that will not be subsequently reclassified to income statement Actuarial (losses) / gains. (17.9) 2.7 (15.2) (31.8) 4.1 (27.7) 2.7 3.4 6.1 Income tax relating to items that will not be subsequently reclassified to income statement 3.2 (0.6) 2.6 6.5 (0.8) 5.7 (0.6) (0.7) (1.3) Other comprehensive income for the year, net of tax 6.6 2.1 8.7 (74.9) 3.3 (71.6) 173.7 2.7 176.4 Total comprehensive income for the year 201.7 0.4 202.1 197.9 (3.8) 194.1 612.4 (5.3) 607.1
Total comprehensive income attributable to: Owners of the parent 198.6 0.5 199.1 189.0 (1.2) 187.8 596.2 (2.9) 593.3
Non-controlling interests 3.1 (0.1) 3.0 8.9 (2.6) 6.3 16.2 (2.4) 13.8
201.7 0.4 202.1 197.9 (3.8) 194.1 612.4 (5.3) 607.1
The adjustments in the table above comprise the impact from the adoption of IFRS 11 and IAS 19 revised. The impact from the adoption of IAS 19 revised in 2010 was an increase in “Actuarial gains” of €3.4m, an increase in “income tax relating to components of other comprehensive income” of €0.7m, the remaining adjustments in 2010 are due to the adoption of IFRS 11. The impact from the adoption of IAS 19 revised in 2011 was a reduction in “Actuarial losses” of €4.1m, a reduction in “income tax relating to components of other comprehensive income” of €0.8m, the remaining adjustments in 2011 are due to the adoption of IFRS 11. The impact from the adoption of IAS 19 revised in 2012 was a reduction in

Notes to the Consolidated Financial Statements (continued)
1. Basis of preparation and accounting policies (continued)
Page 22 of 97
Annual Report 2012 Coca-Cola Hellenic
“Actuarial losses” of €2.7m, a reduction in “income tax relating to components of other comprehensive income” of €0.6m, the remaining adjustments in 2012 are due to the adoption of IFRS 11.
The adjustments in the table above comprise the impact from the adoption of IFRS 11. There was no impact on the cash flow statement from the adoption of IAS 19 revised.
Accounting pronouncements adopted in 2012
In the current period, in addition to the new and revised standards the Group early adopted as described above under “changes in accounting policies and disclosures”, the Group has adopted all of the new and revised standards and interpretations which were issued by the IASB and the International Financial Reporting Interpretations Committee (‘IFRIC’) of the IASB, that are relevant to its operations and effective for accounting periods beginning on 1 January 2012. None of these standards and interpretations had a significant effect on the consolidated financial statements of the Company. The revised standard and interpretation is as follows:
Amendment to IFRS 7, Financial Instruments: Disclosures - The amendments require additional disclosures of the full or partial derecognition of financial assets that are transferred to a counterparty under certain conditions.
Accounting pronouncements not yet adopted
At the date of approval of these consolidated financial statements, the following standards and interpretations relevant to Company’s operations were issued but not yet effective and not early adopted:
IFRS 9, Financial Instruments addresses the classification, measurement and recognition of financial assets and liabilities. IFRS 9 was issued in November 2009 and October 2010 and it replaces parts of IAS 39, Financial Instruments: Recognition and Measurement that relate to the classification and measurement of financial instruments. The standard introduces new requirements for classifying and measuring financial assets and eliminates the available-for-sale and held-to-maturity categories. It separates financial assets into two categories; those measured at amortised cost and those measured at fair value. For financial liabilities the standard retains most of the IAS 39 requirements, the main change is that, in cases where the fair value option is taken for financial liabilities, the part of a fair value change due to an entity’s own credit risk is recorded in other comprehensive income rather than the income statement, unless this creates an accounting mismatch. IFRS 9 will be effective for annual periods beginning on or after 1 January 2015. The standard has not yet been adopted by the EU. The Group is currently evaluating the impact this standard will have on its consolidated financial statements.
In May 2011 the IASB issued IFRS 13 Fair Value Measurement which is effective for annual periods beginning on or after 1 January 2013. The new standard defines fair value and establishes a single framework for measuring fair value
Impact of changes in accounting policies on consolidated cash flow statement
2012
€ million 2011
€ million 2010
€ million
Before adjustments
Change in accounting
policies As
presented Before
adjustments
Change in accounting
policies As
presented Before
adjustments
Change in accounting
policies As presented
Net cash from operating activities 774.2 (20.6) 753.6 845.7 (17.4) 828.3 987.9 (17.5) 970.4 Net cash used in investing activities (390.6) (13.1) (403.7) (336.4) (35.4) (371.8) (365.5) 8.8 (356.7) Net cash (used in)/from financing activities (413.3) 54.8 (358.5) (353.3) 43.5 (309.8) (527.7) 14.9 (512.8) Net (decrease)/increase in cash and cash equivalents (29.7) 21.1 (8.6) 156.0 (9.3) 146.7 94.7 6.2 100.9

Notes to the Consolidated Financial Statements (continued)
1. Basis of preparation and accounting policies (continued)
Page 23 of 97
Annual Report 2012 Coca-Cola Hellenic
where that is required by other standards and introduces consistent requirements for disclosures on fair value measurements. The standard applies to both financial and non-financial assets and liabilities which are measured at fair value. The Group is currently evaluating the impact this standard will have on its consolidated financial statements.
In December 2011 the IASB issued an amendment to IFRS 7 Financial Instruments: Disclosures—Offsetting Financial Assets and Financial Liabilities which is effective for annual reporting periods beginning on or after 1 January, 2013. The new disclosures will require entities to disclose gross amounts subject to rights of set-off, amounts set off in accordance with the accounting standards, and the related net credit exposure. The amendment will not have a significant impact on the Group’s consolidated financial statements.
In December 2011 the IASB issued an amendment of IAS 32 Financial Instruments: Presentation which is effective
for annual reporting periods beginning on or after 1 January 2014. This amendment to the application guidance in IAS 32 clarifies some of the requirements for offsetting financial assets and financial liabilities on the statement of financial position. The Group is currently evaluating the impact the amendments will have on its consolidated financial statements.
In May 2012 the IASB issued its annual improvements to IFRS (2009-2011 cycle). The effective date of the amendments is 1 January 2013. The Group is currently evaluating the impact the amendments will have on its consolidated financial statements. The amendments, which have not yet been adopted by the EU, are outlined below:
Amendment to IAS 1 Presentation of Financial Statements - Clarification of the requirements for comparative information: The amendment clarifies the difference between voluntary additional comparative information and the minimum required comparative information. Generally, the minimum required comparative period is the previous period. An entity must include comparative information in the related notes to the financial statements when it voluntarily provides comparative information beyond the minimum required comparative period. The additional comparative period does not need to contain a complete set of financial statements. In addition, the opening statement of financial position (known as the third balance sheet) must be presented in the following circumstances: when an entity changes its accounting policies; makes retrospective restatements or makes reclassifications, and that change has a material effect on the statement of financial position. The opening statement would be at the beginning of the preceding period. For example, the beginning of the preceding period for a 31 December 2014 year-end would be 1 January 2013. However, unlike the voluntary comparative information, the related notes are not required to accompany the third balance sheet.
IAS 16 Property, Plant and Equipment - Classification of servicing equipment: The amendment clarifies that major spare parts and servicing equipment that meet the definition of property, plant and equipment are not inventory.
IAS 32 Financial Instruments: Presentation - Tax effect of distributions to holders of equity instruments: The amendment clarifies that income taxes arising from distributions to equity holders are accounted for in accordance with IAS 12 Income Taxes. The amendment removes existing income tax requirements from IAS 32 and requires entities to apply the requirements in IAS 12 to any income tax arising from distributions to equity holders.
IAS 34 Interim Financial Reporting - Interim financial reporting and segment information for total assets and liabilities. The amendment clarifies the requirements in IAS 34 relating to segment information for total assets and liabilities for each reportable segment to enhance consistency with the requirements in IFRS 8 Operating Segments. Total assets and liabilities for a particular reportable segment need to be disclosed only when the amounts are regularly provided to the chief operating decision maker and there has been a material change in the total amount disclosed in the entity’s previous annual financial statements for that reportable segment.
In June 2012 the IASB issued amendments to IFRS 10 Consolidated Financial Statements, IFRS 11 Joint Arrangements and IFRS 12 Disclosures of Interests in Other Entities that are applicable from 1 January 2013. The amendments change the transition guidance to provide relief from full retrospective application such that the requirement to provide adjusted comparative application is limited to the immediate preceding period only. The amendments will not have an impact on the Group’s consolidated financial statements as these standards have been early adopted with full retrospective application. The amendments have not been adopted by the EU.

Notes to the Consolidated Financial Statements (continued)
Page 24 of 97
Annual Report 2012 Coca-Cola Hellenic
2. Exchange rates
The Group’s reporting currency is the euro (€). Coca-Cola Hellenic translates the income statements of subsidiary operations to the euro at average exchange rates and the balance sheets at the closing exchange rates at 31 December, except for subsidiaries operating in hyperinflationary environment as explained in Note 1. The principal exchange rates used for transaction and translation purposes in respect of one euro are:
Average Average Average Closing Closing Closing 2012 2011 2010 2012 2011 2010
US dollar ................................................................................................ 1.29 1.40 1.32 1.33 1.31 1.31 UK sterling ................................................................................................ 0.81 0.87 0.85 0.82 0.83 0.85 Polish zloty ................................................................ 4.18 4.12 4.01 4.09 4.40 3.99 Nigerian naira ................................................................ 200.65 212.90 196.41 206.72 204.79 196.01 Hungarian forint ................................................................ 288.38 279.76 276.38 291.50 306.54 279.30 Swiss franc ................................................................................................ 1.21 1.23 1.38 1.21 1.22 1.25 Russian rouble ................................................................ 39.84 41.04 40.11 40.42 41.27 39.95 Romanian leu ................................................................ 4.46 4.23 4.22 4.43 4.30 4.29 Ukrainian hryvnia ................................................................ 10.28 11.11 10.49 10.57 10.44 10.50 Czech crown ................................................................ 25.15 24.65 25.31 25.08 25.75 25.27 Serbian dinar ................................................................ 113.08 101.99 103.40 113.46 102.65 105.88 3. Segmental Analysis
Coca-Cola Hellenic has one business, being the production, sale and distribution of non-alcoholic, ready-to-drink beverages. The Group operates in 28 countries and its financial results are reported in the following three reportable segments: Established countries: Austria, Cyprus, Greece, Italy, Northern Ireland, Republic of Ireland and Switzerland. Developing countries: Croatia, Czech Republic, Estonia, Hungary, Latvia, Lithuania, Poland, Slovakia and
Slovenia.
Emerging countries: Armenia, Belarus, Bosnia and Herzegovina, Bulgaria, FYROM, Moldova, Montenegro, Nigeria, Romania, Russia, Serbia and Ukraine.
The Group’s operations in each of these segments have similar levels of political and economic stability and development, regulatory environments, growth opportunities, customers and distribution infrastructures. The accounting policies of the Group’s reportable segments are the same as those described in Note 1 . The Group’s Chief Operating Decision Maker is its operating committee, which evaluates performance and allocates resources based on volume, net sales revenue and operating profit.
There are no material amounts of sales or transfers between the Group’s segments. In addition there are no customers who represent more than 5% of the total balance of revenue for the Group.

Notes to the Consolidated Financial Statements (continued)
3. Segmental analysis (continued)
Page 25 of 97
Annual Report 2012 Coca-Cola Hellenic
2012 2011 2010
Year ended 31 December Note € million € million € million
Volume in unit cases(1) Established ................................................................................................................................ 679.4 713.5 731.8 Developing ................................................................................................................................ 393.5 399.7 391.7 Emerging ................................................................................................................................ 1,011.8 974.2 981.5
Total volume in unit cases ................................................................................................ 2,084.7 2,087.4 2,105.0 Net sales revenue Established ................................................................................................................................ 2,701.8 2,834.8 2,861.6 Developing ................................................................................................................................ 1,148.1 1,161.5 1,140.0 Emerging ................................................................................................................................ 3,194.8 2,828.0 2,760.0 Total net sales revenue ................................................................................................ 7,044.7 6,824.3 6,761.6 Adjusted EBITDA(2) Established ................................................................................................................................ 231.9 343.2 405.0 Developing ................................................................................................................................ 76.5 141.1 163.9 Emerging ................................................................................................................................ 449.2 367.9 460.1 Total adjusted EBITDA ................................................................................................ 757.6 852.2 1,029.0 Depreciation and impairment of property, plant and equipment Established ................................................................................................................................ (136.3) (137.7) (134.3) Developing ................................................................................................................................ (83.4) (80.4) (73.0) Emerging ................................................................................................................................ (188.6) (171.2) (173.9)
Total depreciation and impairment of property, plant and equipment ................................ 5 (408.3) (389.3) (381.2) Amortisation of intangible assets Established ................................................................................................................................ (0.6) (0.8) (4.5) Developing ................................................................................................................................ (0.3) (0.4) (0.5) Emerging ................................................................................................................................ (2.1) (2.0) (2.1)
Total amortisation of intangible assets ................................................................ (3.0) (3.2) (7.1) Other non-cash items(3) Established ................................................................................................................................ (2.5) (3.3) (2.4) Developing ................................................................................................................................ (1.5) (1.9) (1.2) Emerging ................................................................................................................................ (4.6) (4.2) (3.1)
Total other non-cash items ................................................................................................ (8.6) (9.4) (6.7) _________________________ (1) One unit case corresponds to approximately 5.678 litres or 24 servings, being a typically used measure of volume. Volume data is derived from unaudited operational data.
(2) We define adjusted EBITDA as operating profit before deductions for depreciation (included both in cost of goods sold and in operating expenses), impairment of property, plant and equipment, stock option compensation, impairment of intangible assets, amortisation of and adjustments to intangible assets and other non-cash items. (3) Other non-cash items comprise adjustments to intangible assets of which were nil in 2012 (2011 and 2010 : nil) (refer to Note 20), losses on available-for-sale financial assets reclassified to the profit and loss from equity of which were nil in 2012 (2011 and 2010: nil) (refer to Note 20), stock option expenses of €6.3m (2011: €8.1m, 2010: €6.7m) (refer to Note 26) and other items of €2.3m (2011: €1.3m , 2010: nil)

Notes to the Consolidated Financial Statements (continued)
3. Segmental analysis (continued)
Page 26 of 97
Annual Report 2012 Coca-Cola Hellenic
2012 2011 2010 Year ended 31 December Note € million € million € million
Operating profit
Established ................................................................................................................................ 92.5 201.4 263.8 Developing ................................................................................................................................ (8.7) 58.4 89.2 Emerging ................................................................................................................................ 253.9 190.5 281.0
Total operating profit ................................................................................................ 337.7 450.3 634.0 Interest expense and finance charges Established ................................................................................................................................ (76.3) (94.3) (106.2) Developing ................................................................................................................................ (2.5) (2.2) (2.0) Emerging ................................................................................................................................ (32.1) (34.8) (21.4) Corporate ................................................................................................................................ (131.3) (146.7) (153.1) Inter segment interest expense ................................................................................................ 141.4 173.5 200.3
Total interest expense and finance charges ................................................................ 21 (100.8) (104.5) (82.4) Finance income Established ................................................................................................................................ 16.9 38.9 49.5 Developing ................................................................................................................................ 1.2 1.4 2.4 Emerging ................................................................................................................................ 25.5 22.9 15.6 Corporate ................................................................................................................................ 108.2 119.0 139.7 Inter segment finance income ................................................................................................ (141.4) (173.5) (200.3)
Total finance income ................................................................................................ 21 10.4 8.7 6.9 Income tax expense Established ................................................................................................................................ (29.5) (49.1) (73.6) Developing ................................................................................................................................ (3.3) (12.6) (22.4) Emerging ................................................................................................................................ (26.9) (29.0) (39.8) Corporate ................................................................................................................................ (5.5) (8.1) (2.0) Total income tax expense ................................................................................................ 22 (65.2) (98.8) (137.8) Reconciling items Net foreign exchange translation losses ................................................................ 21 (0.3) 0.6 (0.4) Share of results of equity method investments ................................................................ 6 11.6 9.4 10.4
Profit after tax ................................................................................................................................ 193.4 265.7 430.7 Expenditure on non-current assets(4) Established ................................................................................................................................ 123.5 117.1 117.9
Developing ................................................................................................................................ 46.4 46.5 61.0 Emerging ................................................................................................................................ 225.6 200.3 203.4
Total expenditure on non-current assets ................................................................ 395.5 363.9 382.3 _________________________ (4) Total additions of property, plant and equipment for the year ended 31 December 2012 were €468.4.m (2011: €396.2m, 2010: €436.4m). Corporate line refers to holding, finance and other non-operating subsidiaries of the Group.

Notes to the Consolidated Financial Statements (continued)
3. Segmental analysis (continued)
Page 27 of 97
Annual Report 2012 Coca-Cola Hellenic
The net sales revenue from external customers and the balance of long-lived assets attributed to Greece (the Group’s country of domicile), Russia, Italy and Switzerland (whose revenues from external customers or long-lived assets are significant compared to the combined Group revenues from external customers or long-lived assets) and the total of all other countries, as well as the entire Group, were as follows for the years ended 31 December:
2012 2011 2010
Year ended 31 December € million € million € million
Net sales revenue from external customers Greece ................................................................................................................................ 450.8 526.9 604.9 Russia ................................................................................................................................ 1,461.4 1,201.4 1,138.6 Italy ................................................................................................................................ 1,099.0 1,133.1 1,135.2 Switzerland ................................................................................................................................ 426.1 434.8 379.8 All countries, other than Greece, Russia, Italy and Switzerland ................................ 3,607.4 3,528.1 3,503.1
Total net sales revenue from external customers ................................................................ 7,044.7 6,824.3 6,761.6
2012 2011 2010
€ million € million € million
Non-current assets(5) Greece ................................................................................................................................ 159.8 175.2 194.2 Russia ................................................................................................................................ 840.0 817.6 850.5 Italy ................................................................................................................................ 1,059.8 1,072.3 1,091.6 Switzerland ................................................................................................................................ 516.6 520.6 501.2 All countries, other than Greece, Russia, Italy and Switzerland ................................ 2,455.4 2,393.6 2,437.0
Total non-current assets ................................................................................................ 5,031.6 4,979.3 5,074.5
(5) Excluding financial instruments, equity method investments and deferred tax assets.

Notes to the Consolidated Financial Statements (continued)
Page 28 of 97
Annual Report 2012 Coca-Cola Hellenic
4. Intangible assets Other
Franchise intangible
Goodwill agreements Trademarks assets Total € million € million € million € million € million
Cost As at 1 January 2012 ................................................................ 1,880.7 156.8 78.8 24.1 2,140.4 Foreign currency translation ................................................................ 11.1 (0.2) 1.3 — 12.2 As at 31 December 2012 ................................................................ 1,891.8 156.6 80.1 24.1 2,152.6 Amortisation As at 1 January 2012 ................................................................ 182.4 — 7.8 14.8 205.0 Charge for the year ................................................................ — — 1.1 1.9 3.0 As at 31 December 2012 ................................................................ 182.4 — 8.9 16.7 208.0 Net book value as at 1 January 2012 ................................................................ 1,698.3 156.8 71.0 9.3 1,935.4
Net book value as at 31 December 2012 ................................ 1,709.4 156.6 71.2 7.4 1,944.6
Cost As at 1 January 2011 ................................................................ 1,895.4 157.7 80.5 27.2 2,160.8 Disposal of subsidiary ................................................................ (13.5) — — (2.9) (16.4) Intangibles assets arising on current year acquisitions................................ 2.7 — 0.2 — 2.9 Foreign currency translation ................................................................ (3.9) (0.9) (1.9) (0.2) (6.9) As at 31 December 2011 ................................................................ 1,880.7 156.8 78.8 24.1 2,140.4 Amortisation As at 1 January 2011 ................................................................ 185.3 — 7.2 13.7 206.2 Charge for the year ................................................................ — — 0.6 2.6 3.2 Disposal of subsidiary ................................................................ (2.9) — — (1.5) (4.4) As at 31 December 2011 ................................................................ 182.4 — 7.8 14.8 205.0 Net book value as at 1 January 2011 ................................................................ 1,710.1 157.7 73.3 13.5 1,954.6
Net book value as at 31 December 2011 ................................ 1,698.3 156.8 71.0 9.3 1,935.4
Cost As at 1 January 2010 ................................................................ 1,829.7 136.7 75.2 22.6 2,064.2 Additions ................................................................................................ — 21.8 — 5.9 27.7 Disposals ................................................................................................ — — — (1.3) (1.3) Foreign currency translation ................................................................ 65.7 (0.8) 5.3 — 70.2 As at 31 December 2010 ................................................................ 1,895.4 157.7 80.5 27.2 2,160.8 Amortisation As at 1 January 2010 ................................................................ 185.3 — 6.6 10.5 202.4 Charge for the year ................................................................ — — 0.6 3.6 4.2 Disposals ................................................................................................ — — — (0.4) (0.4) As at 31 December 2010 ................................................................ 185.3 — 7.2 13.7 206.2 Net book value as at 1 January 2010 ................................................................ 1,644.4 136.7 68.6 12.1 1,861.8
Net book value as at 31 December 2010 ................................ 1,710.1 157.7 73.3 13.5 1,954.6

Notes to the Consolidated Financial Statements (continued)
Page 29 of 97
Annual Report 2012 Coca-Cola Hellenic
4. Intangible assets (continued) Goodwill is allocated to each of the Group's cash-generating units expected to benefit from the business combination in which the goodwill arose. Other indefinite-lived intangible assets are also allocated to the Group’s cash-generating units expected to benefit from those intangibles. The following table sets forth the carrying value of intangible assets subject to and not subject to amortisation:
2012 2011 2010 € million € million € million
Intangible assets not subject to amortisation
Goodwill ................................................................................................................................ 1,709.4 1,698.3 1,710.1
Franchise agreements ................................................................................................................................ 156.6 156.8 157.7
Trademarks ................................................................................................................................ 71.0 69.9 72.3
1,937.0 1,925.0 1,940.1 Intangible assets subject to amortisation Trademarks ................................................................................................................................ 0.2 1.1 1.0
Water rights ................................................................................................................................ 6.7 6.9 7.4
Other intangible assets ................................................................................................................................ 0.7 2.4 6.1
7.6 10.4 14.5
Total intangible assets ................................................................................................................................ 1,944.6 1,935.4 1,954.6 The following table sets forth the carrying value of goodwill and other indefinite lived intangible assets for those cash-generating units that are considered significant in comparison with the Group’s total carrying value of goodwill and other indefinite-lived intangible assets, as at 31 December 2012.
Franchise
Goodwill agreements Total
€ million € million € million
Italy ................................................................................................................................................................ 625.2 126.9 752.1 Switzerland ................................................................................................................................ 381.0 — 381.0
Total Ireland ................................................................................................................................ 288.9 — 288.9 Total ................................................................................................................................ 1,295.1 126.9 1,422.0
The Group conducts a test for impairment of goodwill and indefinite-lived intangible assets in accordance with IAS 36 Impairment of Assets annually and whenever there is an indication of impairment. No impairment was indicated from the impairment tests of 2012, 2011 and 2010.
The recoverable amount of each operation was determined through a value-in-use calculation. That calculation uses cash flow projections based on financial budgets approved by the Board of Directors covering a three-year period and cash projections for two additional years. Cash flow projections for years four to five were projected by management based on operation and market specific high-level assumptions including growth rates, discount rates and forecasted selling prices and direct costs.

Notes to the Consolidated Financial Statements (continued)
Page 30 of 97
Annual Report 2012 Coca-Cola Hellenic
4. Intangible assets (continued)
Management determined gross margins based on past performance, expectations for the development of the market and expectations about raw material costs. The growth rates used in perpetuity reflect the forecasts in line with management beliefs. These forecasts exceeded, in some cases, those expected for the industry in general, due to the strength of our brand portfolio. Management estimates discount rates using rates that reflect current market assessments of the time value of money and risks specific to the countries of operation.
For those countries that are considered significant in comparison with the Group’s total carrying value of goodwill and other indefinite-lived intangible assets, as at 31 December 2012, cash flows beyond the five-year period (the period in perpetuity) have been extrapolated using the following estimated growth and discount rates:
Growth rate in Discount
perpetuity (%) rate (%)
2012 2011 2012 2011
Italy ................................................................................................................................ 2.5 3.0 8.5 9.9
Switzerland ................................................................................................................................ 1.0 1.5 6.4 6.2
Total Ireland ................................................................................................................................ 2.0 2.0 8.2 9.0 In Italy, the recoverable amount calculated based on value in use exceeded carrying value by €226.1 m. Any one of a reduction in the average gross profit margin of 1.7%, a fall in the revenue growth rate in perpetuity of 1.6%, or a rise in the weighted average discount rate of 1.3% would remove the remaining headroom. In Ireland, the headroom was €74.7 m. Any one of a reduction in the average gross profit margin of 1.7%, a fall in the revenue growth rate in perpetuity of 1.4% or a rise in the weighted average discount rate of 1.0% would remove the remaining headroom.

Notes to the Consolidated Financial Statements (continued)
Page 31 of 97
Annual Report 2012 Coca-Cola Hellenic
.
5. Property, plant and equipment
Land and Plant and Returnable Assets under buildings equipment containers construction Total € million € million € million € million € million
Cost As at 1 January 2012 ................................................................ 1,459.6 3,691.5 359.0 156.6 5,666.7 Additions ................................................................................................ 7.5 160.6 45.2 255.1 468.4 Disposals ................................................................................................ (6.7) (151.8) (18.9) — (177.4) Classified to assets held for sale (refer to Note 13) ................................ (9.4) — — — (9.4) Reclassifications ................................................................ 51.7 225.0 0.2 (276.9) — Foreign currency translation ................................................................ 12.8 24.8 (1.2) 0.2 36.6 Effect of hyperinflation ................................................................ 0.5 3.8 — (0.2) 4.1 As at 31 December 2012 ................................................................ 1,516.0 3,953.9 384.3 134.8 5,989.0 Depreciation and impairment As at 1 January 2012 ................................................................ 305.3 2,211.7 151.6 — 2,668.6 Charge for the year ................................................................ 38.6 308.8 27.9 — 375.3 Impairment ................................................................................................ 17.6 13.4 2.0 — 33.0 Disposals ................................................................................................ (4.4) (127.0) (17.1) — (148.5) Foreign currency translation ................................................................ 2.7 13.7 (0.3) — 16.1 Effect of hyperinflation ................................................................ 0.1 3.0 — — 3.1 As at 31 December 2012 ................................................................ 359.9 2,423.6 164.1 — 2,947.6 Net book value as at 1 January 2012 ................................ 1,154.3 1,479.8 207.4 156.6 2,998.1 Net book value as at 31 December 2012 ................................ 1,156.1 1,530.3 220.2 134.8 3,041.4 Cost As at 1 January 2011 ................................................................ 1,437.0 3,584.3 337.8 162.4 5,521.5 Additions ................................................................................................ 7.5 162.9 45.3 180.4 396.1 Arising on acquisitions ................................................................ 0.7 — — — 0.7 Disposals ................................................................................................ (8.0) (112.3) (18.5) — (138.8) Disposal of subsidiary ................................................................ (0.2) (9.1) — — (9.3) Reclassified from assets held for sale (refer to Note 13) — 5.9 — — 5.9 Reclassifications ................................................................ 48.5 134.8 0.2 (183.5) (0.0) Foreign currency translation ................................................................ (26.8) (83.9) (5.8) (2.9) (119.4) Effect of hyperinflation ................................................................ 0.9 8.9 — 0.2 10.0 As at 31 December 2011 ................................................................ 1,459.6 3,691.5 359.0 156.6 5,666.7 Depreciation and impairment As at 1 January 2011 ................................................................ 274.4 2,040.7 134.1 — 2,449.2 Charge for the year ................................................................ 38.8 296.4 33.1 — 368.3 Impairment ................................................................................................ 2.5 15.2 3.3 — 21.0 Disposals ................................................................................................ (4.8) (100.4) (16.7) — (121.9) Disposal of subsidiary ................................................................ (0.1) (2.7) — — (2.8) Reclassified from assets held for sale (refer to Note 13) — 4.1 — — 4.1 Foreign currency translation ................................................................ (5.7) (47.0) (2.2) — (54.9) Effect of hyperinflation ................................................................ 0.2 5.4 — — 5.6 As at 31 December 2011 ................................................................ 305.3 2,211.7 151.6 — 2,668.6

Notes to the Consolidated Financial Statements (continued)
Page 32 of 97
Annual Report 2012 Coca-Cola Hellenic
Land and Plant and Returnable Assets under buildings equipment containers construction Total € million € million € million € million € million
Net book value as at 1 January 2011 ................................ 1,162.6 1,543.6 203.7 162.4 3,072.3 Net book value as at 31 December 2011 ................................ 1,154.3 1,479.8 207.4 156.6 2,998.1
Cost As at 1 January 2010 ................................................................ 1,258.9 3,252.7 289.2 250.9 5,051.7 Additions ................................................................................................ 15.5 161.6 40.9 218.4 436.4 Disposals ................................................................................................ (8.5) (139.7) (6.5) — (154.7) Reclassified from assets held for sale (refer to Note 13) — 1.5 — — 1.5 Classified to assets held for sale (refer to Note 13) ................................ (1.3) (0.7) — — (2.0) Reclassifications ................................................................ 130.7 198.8 0.1 (329.6) — Foreign currency translation ................................................................ 41.7 110.1 14.1 22.7 188.6 As at 31 December 2010 ................................................................ 1,437.0 3,584.3 337.8 162.4 5,521.5 Depreciation As at 1 January 2010 ................................................................ 232.8 1,818.4 91.1 — 2,142.3 Charge for the year ................................................................ 38.9 298.2 44.1 — 381.2 Disposals ................................................................................................ (5.7) (134.5) (6.6) — (146.8) Reclassified from assets held for sale (refer to Note 13) — 0.5 — — 0.5 Classified to assets held for sale (refer to Note 13) ................................ (0.1) (0.1) — — (0.2) Foreign currency translation ................................................................ 8.5 58.2 5.5 — 72.2 As at 31 December 2010 ................................................................ 274.4 2,040.7 134.1 — 2,449.2 Net book value as at 1 January 2010 ................................ 1,026.1 1,434.3 198.1 250.9 2,909.4 Net book value as at 31 December 2010 ................................ 1,162.6 1,543.6 203.7 162.4 3,072.3 Assets under construction at 31 December 2012 include advances for equipment purchases of €20.8m (2011: €16.5m, 2010: €46.8m). Impairment of Property, Plant and Equipment of €33.0m (2011: €21.0m) relates to restructuring initiatives of €11.5m, €20.1m and €1.4m in the established, developing and emerging segments respectively (2011: €11.5m, €8.9m, €0.6m respectively). Refer also to note 20(c).

Notes to the Consolidated Financial Statements (continued)
Page 33 of 97
Annual Report 2012 Coca-Cola Hellenic
5. Property, plant and equipment (continued) Included in property, plant and equipment are assets held under finance leases, where the Group is the lessee, as follows:
2012 2011 2010 € million € million € million
As at 1 January 161.0 235.0 251.5 Additions ................................................................................................................................................................ 42.0 4.3 62.8 Disposals ................................................................................................................................................................ (36.8) (53.5) (47.8) Depreciation charge ................................................................................................................................ (15.6) (22.4) (31.4) Foreign currency translation ................................................................................................................................ 7.1 (2.4) (0.1)
As at 31 December ................................................................................................................................ 157.7 161.0 235.0 Assets held under finance leases have been pledged as security in relation to the liabilities under the finance leases. The net book value of land and buildings held under finance leases as at 31 December 2012 was €48.9m (2011: €44.7m, 2010: €42.0m). The net book value of plant and equipment held under finance leases as at 31 December 2012 was €108.8m (2011: €116.3m, 2010: €193.0m). 6. Equity method investments and joint operations (a) Investments in associates Summarised financial information of our investments in associates is as follows:
2012 2011 2010 € million € million € million
Carrying amount ................................................................................................................................ 16.6 16.5 15.4 Share of profit ................................................................................................................................ 2.0 1.7 2.4 Share of other comprehensive income ................................................................................................ (0.1) (0.6) 1.0
Share of total comprehensive income ................................................................................................ 1.9 1.1 3.4 Included in investment in associates is the Group's investment in Frigoglass Industries Limited. Nigerian Bottling Company plc holds an interest in Frigoglass of 23.9% (2011 and 2010: 23.9% respectively). The Group has a 100% (2011: 100% and 2010: 66.4%) interest in Nigerian Bottling Company plc therefore the Group has an effective interest in Frigoglass of 24% (2011 : 24% and 2010: 16%) . There are restrictive controls on the movement of funds out of Nigeria. Changes in the carrying amounts of investments in associates are as follows:
2012 2011 2010 € million € million € million
As at 1 January ................................................................................................................................ 16.5 15.4 13.8 Share of results of equity method investments ................................................................ 2.0 1.7 2.4 Return of capital from associates ................................................................................................ (1.8) — (1.8) Foreign currency translation ................................................................................................ (0.1) (0.6) 1.0
As at 31 December ................................................................................................................................ 16.6 16.5 15.4

Notes to the Consolidated Financial Statements (continued)
Page 34 of 97
Annual Report 2012 Coca-Cola Hellenic
6. Equity method investments (continued) (b) Investments in joint ventures The Group has a material joint venture with Heineken that is conducted through a number of legal entities, being the Brewinvest S.A. Group of companies and the BrewTech B.V. Group of companies. As such the joint venture is structured through separate vehicles and provides the Group with rights to their net assets. The Brewinvest S.A. Group of companies is engaged in the bottling and distribution of beer in Bulgaria. Brewinvest S.A. is incorporated in Greece and the Group owns 50% (2011 and 2010: 50% respectively) of its share capital. The BrewTech B.V. Group of companies is engaged in the bottling and distribution of soft drinks and beer in FYROM. In 2010, 2011 and up until April 2012 BrewTech B.V. Group formed part of the Brewinvest S.A. Group. BrewTech B.V. is incorporated in the Netherlands and the Group owns 50% of its share capital. Summarised financial information of our material joint venture is as follows (the information below reflects the amount presented in the IFRS financial statements of the joint venture, and not our share in those amounts):
2012 2011 2010 € million € million € million
Summarised balance sheet: Cash and cash equivalents ................................................................................................ 11.4 55.2 36.0 Other current assets (excluding cash) ................................................................................................ 15.4 17.4 20.6 Total current assets ................................................................................................................................ 26.8 72.6 56.6 Financial liabilities (excluding trade payables)................................................................ — — (7.8) Other current liabilities (including trade payables) ................................................................ (27.2) (26.6) (26.2) Total current liabilities ................................................................................................ (27.2) (26.6) (34.0) Non - current assets................................................................................................................................ 215.2 113.4 117.8 Non - current financial liabilities ................................................................................................ — (0.2) (0.2) Non - current other liabilities ................................................................................................ (0.2) (1.0) (1.0) Total non - current liabilities................................................................................................ (0.2) (1.2) (1.2) Net assets................................................................................................................................ 214.6 158.2 139.2 Summarised statement of comprehensive income: Revenue ................................................................................................................................ 126.4 117.2 118.2 Depreciation and amortization ................................................................................................ (11.6) (12.8) (15.8) Interest income ................................................................................................................................ 1.8 2.6 1.2 Interest expense ................................................................................................................................ (1.0) (0.2) (0.6) Profit before tax ................................................................................................................................ 24.4 22.8 25.0 Income tax expense ................................................................................................................................ (3.0) (2.7) (2.6) Profit after tax ................................................................................................................................ 21.4 20.2 22.4 Other comprehensive income ................................................................................................ — — — Total comprehensive income ................................................................................................ 21.4 20.2 22.4 Reconciliation of net assets to carrying amount Closing net assets ................................................................................................................................ 214.6 158.2 139.2 Interest in JV @ 50% ................................................................................................................................ 107.3 79.1 69.6 Goodwill ................................................................................................................................ 16.9 16.9 — Non controlling interest ................................................................................................ (2.0) (2.1) (23.0) Carrying value ................................................................................................................................ 122.2 93.9 46.6

Notes to the Consolidated Financial Statements (continued)
Page 35 of 97
Annual Report 2012 Coca-Cola Hellenic
Summarised financial information of our investment in other joint ventures is as follows: 2012 2011 2010 € million € million € million
Carrying amount ................................................................................................................................ 29.7 31.3 29.8 Share of profit ................................................................................................................................ (1.0) 0.2 (0.7) Share of other comprehensive income ................................................................................................ (0.7) — (0.1)
Share of total comprehensive income ................................................................................................ (1.7) 0.2 (0.8) Changes in the carrying amounts of investments in joint ventures are as follows:
2012 2011 2010 € million € million € million
As at 1 January ................................................................................................................................ 125.2 76.4 74.4 Capital injections ................................................................................................................................ — 1.6 2.8 Purchases of additional share ................................................................................................ 20.8 39.8 — Disposals ................................................................................................................................ — (0.3) — Share of results of equity method investments ................................................................ 9.6 7.7 8.0 Return of capital from joint ventures ................................................................................................ — — (8.7) Dividends ................................................................................................................................ (3.0) — — Foreign currency translation ................................................................................................ (0.7) — (0.1)
As at 31 December ................................................................................................................................ 151.9 125.2 76.4 Purchases of additional share relates to purchase of non-controlling interest in A.D. Pivara Skopje, the beer and beverages subsidiary of BrewTech B.V. in FYROM. (c) Investments in joint operations The Group has a 50% interest in the Multon Z.A.O. Group of companies (“Multon”). Multon is engaged in the production and distribution of juices in Russia and is classified as a joint operation as the arrangement gives the Group right to the assets and obligations for the liabilities relating to the joint arrangement.
Other joint operations of the Group comprise mainly of a 50% interest in each of several water businesses including, Romerquelle, Fonti Del Vulture, Dorna, Multivita, Valser and Vlasinka which are engaged in the production and distribution of water in Austria, Italy, Romania, Poland, Switzerland and Serbia respectively. 7. Available-for-sale financial assets Movements in available-for-sale financial assets are as follows:
2012 2011 2010
€ million € million € million
As at 1 January ................................................................................................................................ 1.2 1.6 17.5 Purchases ................................................................................................................................ 0.4 0.1 0.3 Disposals ................................................................................................................................ (0.1) (0.1) (16.7) Unrealised gains/(losses) on available-for-sale financial assets ................................................................ 0.2 (0.4) 0.5 As at 31 December ................................................................................................................................ 1.7 1.2 1.6 Available-for-sale financial assets relate to listed equities €1.0m (2011: €0.7m and 2010: €1.3m respectively) and other unlisted equities of €0.7m (2011: €0.5m and 2010: €0.3m respectively). The fair values of available-for-sale financial assets are based on quoted market prices, where available, or discounted cash flow projections where quoted market prices are unavailable.
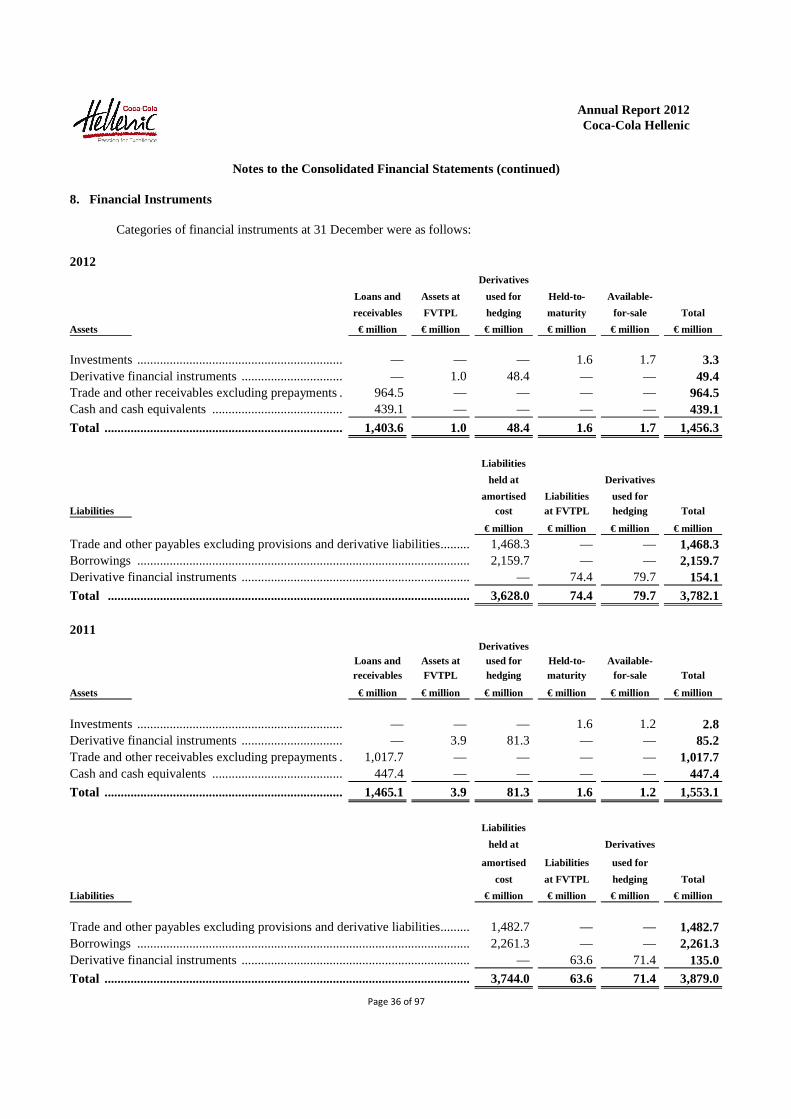
Notes to the Consolidated Financial Statements (continued)
8. Financial Instruments
Page 36 of 97
Annual Report 2012 Coca-Cola Hellenic
Categories of financial instruments at 31 December were as follows:
2012 Derivatives
Loans and Assets at used for Held-to- Available-
receivables FVTPL hedging maturity for-sale Total
Assets € million € million € million € million € million € million
Investments ................................................................ — — — 1.6 1.7 3.3 Derivative financial instruments ................................ — 1.0 48.4 — — 49.4 Trade and other receivables excluding prepayments ................................ 964.5 — — — — 964.5 Cash and cash equivalents ................................................................ 439.1 — — — — 439.1 Total ................................................................................................ 1,403.6 1.0 48.4 1.6 1.7 1,456.3 Liabilities
held at Derivatives
amortised Liabilities used for Liabilities cost at FVTPL hedging Total
€ million € million € million € million
Trade and other payables excluding provisions and derivative liabilities ................................ 1,468.3 — — 1,468.3 Borrowings ................................................................................................................................ 2,159.7 — — 2,159.7 Derivative financial instruments ................................................................................................ — 74.4 79.7 154.1 Total ................................................................................................................................ 3,628.0 74.4 79.7 3,782.1 2011 Derivatives Loans and Assets at used for Held-to- Available- receivables FVTPL hedging maturity for-sale Total
Assets € million € million € million € million € million € million
Investments ................................................................ — — — 1.6 1.2 2.8 Derivative financial instruments ................................ — 3.9 81.3 — — 85.2 Trade and other receivables excluding prepayments ................................ 1,017.7 — — — — 1,017.7 Cash and cash equivalents ................................................................ 447.4 — — — — 447.4 Total ................................................................................................ 1,465.1 3.9 81.3 1.6 1.2 1,553.1 Liabilities
held at Derivatives
amortised Liabilities used for
cost at FVTPL hedging Total
Liabilities € million € million € million € million
Trade and other payables excluding provisions and derivative liabilities ................................ 1,482.7 — — 1,482.7 Borrowings ................................................................................................................................ 2,261.3 — — 2,261.3 Derivative financial instruments ................................................................................................ — 63.6 71.4 135.0 Total ................................................................................................................................ 3,744.0 63.6 71.4 3,879.0

Notes to the Consolidated Financial Statements (continued)
8. Financial Instruments (continued)
Page 37 of 97
Annual Report 2012 Coca-Cola Hellenic
2010 Derivatives
Loans and Assets at used for Held-to- Available-
receivables FVTPL hedging maturity for-sale Total
Assets € million € million € million € million € million € million
Investments ................................................................ — — — 1.7 1.6 3.3 Derivative financial instruments ................................ — 0.7 76.6 — — 77.3 Trade and other receivables excluding prepayments ................................ 1,006.3 — — — — 1,006.3 Cash and cash equivalents ................................................................ 306.7 — — — — 306.7 Total ................................................................................................ 1,313.0 0.7 76.6 1.7 1.6 1,393.6 Liabilities
held at Derivatives
amortised Liabilities used for
cost at FVTPL hedging Total
Liabilities € million € million € million € million
Trade and other payables excluding provisions and derivative liabilities ................................ 1,427.0 — — 1,427.0 Borrowings ................................................................................................................................ 2,194.0 — — 2,194.0 Derivative financial instruments ................................................................................................ — 72.7 67.5 140.2 Total ................................................................................................................................ 3,621.0 72.7 67.5 3,761.2

Notes to the Consolidated Financial Statements (continued)
8. Financial Instruments (continued)
Page 38 of 97
Annual Report 2012 Coca-Cola Hellenic
The derivative financial instruments are included in the Group's balance sheet as follows: As at 31 December 2012
Assets Liabilit ies
€ million € million
Current Current Foreign currency forward contracts ................................................................................................................................ 1.4 (4.9)Foreign currency option contracts ................................................................................................................................ 0.9 — Cross-currency swap contracts ................................................................................................................................ — (67.8)Commodity swap contracts ................................................................................................................................ — (5.8)Interest rate swap contracts ................................................................................................................................ 11.3 —
Total current ................................................................................................................................................................ 13.6 (78.5)
Non-current Interest rate swap contracts ................................................................................................................................ 35.8 — Cross-currency swap contracts ................................................................................................................................ — (75.6)
Total non-current ................................................................................................................................ 35.8 (75.6)
At 31 December 2011 Current Foreign currency forward contracts ................................................................................................................................ 13.9 (2.4)Foreign currency option contracts ................................................................................................................................ 1.8 (0.4)Commodity swap contracts ................................................................................................................................ — (1.4)
Total current ................................................................................................................................................................ 15.7 (4.2)
Non-current ................................................................................................................................................................ Interest rate swap contracts 69.5 — Cross-currency swap contracts ................................................................................................................................ — (130.8)
Total non-current ................................................................................................................................ 69.5 (130.8)
At 31 December 2010 Current Foreign currency forward contracts ................................................................................................................................ 2.6 (4.1)Foreign currency option contracts ................................................................................................................................ 1.6 —
Total current ................................................................................................................................................................ 4.2 (4.1)
Non-current ................................................................................................................................................................ Interest rate swap contracts 73.1 — Cross-currency swap contracts ................................................................................................................................ — (136.1)
Total non-current ................................................................................................................................ 73.1 (136.1) As at 31 December 2012, other receivables of €23.5m (2011: €26.3m, 2010: €11.6m) served as collateral for net open position of interest rate and cross currency swap derivative financial instruments. The collateral resets monthly and earns interest based on Euro Overnight Index Average (EONIA) rate.

Notes to the Consolidated Financial Statements (continued)
8. Financial Instruments (continued)
Page 39 of 97
Annual Report 2012 Coca-Cola Hellenic
Net fair values of derivative financial instruments (a) Cash flow hedges
The fair values of derivative financial instruments as at 31 December designated as cash flow hedges were:
2012 2011 2010
€ million € million € million Contracts with positive fair values Foreign currency forward contracts ................................................................................................ 0.6 9.8 0.6 Foreign currency option contracts ................................................................................................ 0.7 1.4 1.2 Interest rate swap contracts ................................................................................................ 35.8 43.8 37.7
37.1 55.0 39.5 Contracts with negative fair values Foreign currency forward contracts ................................................................................................ (3.6) (1.5) (3.4)Cross currency swap contracts ................................................................................................ (75.6) (69.9) (63.5)
(79.2) (71.4) (66.9) Cash flows from the Group’s cash flow hedges at 31 December 2012 are expected to occur and, accordingly, affect profit or loss in 2013, except for the combined interest rate/cross currency swap hedging contracts used for the US$400.0m bond for which cash flows are expected to occur and affect profit or loss up to 2015. (b) Fair value hedges
The fair values of derivative financial instruments at 31 December designated as fair value hedges were:
2012 2011 2010
€ million € million € million Contracts with positive fair values Foreign currency forward contracts ................................................................................................ — 0.6 1.7 Interest rate swap contracts ................................................................................................ 11.3 25.7 35.4
11.3 26.3 37.1 Contracts with negative fair values Foreign currency forward contracts ................................................................................................ (0.5) — (0.6) (c) Undesignated hedges
The fair values of derivative financial instruments at 31 December for which hedge accounting has not been applied, were: 2012 2011 2010
€ million € million € million Contracts with positive fair values Foreign currency forward contracts ................................................................................................ 0.8 3.5 0.3 Foreign currency option contracts ................................................................................................ 0.2 0.4 0.4
1.0 3.9 0.7

Notes to the Consolidated Financial Statements (continued)
8. Financial Instruments (continued)
Page 40 of 97
Annual Report 2012 Coca-Cola Hellenic
2012 2011 2010
€ million € million € million Contracts with negative fair values Foreign currency forward contracts ................................................................................................ (0.8) (0.9) (0.1)Foreign currency option contracts ................................................................................................ — (0.4) — Cross-currency swap contracts ................................................................................................ (67.8) (60.9) (72.6)Commodity swap contracts ................................................................................................ (5.8) (1.4) —
(74.4) (63.6) (72.7)
Foreign currency forward contracts and foreign currency option contracts
The Company uses a combination of foreign currency forward contracts and foreign currency option contracts to hedge foreign exchange transaction exposures. The notional principal amounts of the outstanding foreign currency forward contracts at 31 December 2012 totaled €339.7m (2011: €419.3m, 2010: €246.0m). The notional principal amounts of the outstanding foreign currency option contracts at 31 December 2012 totaled €108.2m (2011: €64.3m, 2010: €158.0m).
Commodity swap contracts
The Group purchases sugar and aluminium on an ongoing basis to meet its operational needs. The increased volatility in commodity prices led to the decision to enter into commodity swap contracts since August 2011.
These contracts which economically hedge sugar and aluminium can purchases, are expected to reduce volatility of cash flows (in respect of sugar and aluminium purchases attributable to the fluctuation of the sugar and aluminium price) for a period up to 36 months in accordance with the Group’s risk management policy (see Note 30).
The notional principal amounts of the outstanding commodity swap contracts at 31 December 2012 totaled €56.4m (2011: €40.9m, 2010: nil).
Interest rate swap contracts
The Group uses interest rate swap contracts to hedge its exposure to changes in the fair value of its debt (refer to Notes 15 and 30), as well as to hedge the foreign exchange cash flow exposure on the $400.0m fixed rate debt. The notional principal amounts of the outstanding interest rate swap contracts totaled $900.0m (2011: $900.0m, 2010: $900.0m). In June and July 2010 the Group adjusted its interest rate profile by unwinding the euro denominated interest rate swap contracts with an aggregate notional principal amount of €792.5m, maturing in 2011 and 2014. As a result an amount of €1.4m was credited to the income statement, in the interest expense line, in 2010.
The interest rate swap contracts outstanding at 31 December 2012 can be summarised as follows: Amount Receive Pay
Currency million Start date Maturity date fixed rate floating rate
US dollar ................................................................ 500.0 17 September 2003 17 September 2013 5.125% Libor + margin US dollar ................................................................ 400.0 17 September 2003 17 September 2015 5.500% Libor + margin 900.0 Repricing dates for all US dollar denominated interest rate swap contracts are the 17th of March and the 17th of September annually until maturity.

Notes to the Consolidated Financial Statements (continued)
8. Financial Instruments (continued)
Page 41 of 97
Annual Report 2012 Coca-Cola Hellenic
Cross-currency swap contracts
The Group entered into cross-currency swap contracts to cover the currency risk related to its US dollar denominated debt (refer to Notes 15 and 30). At 31 December 2012 the fair value of the cross-currency swap contracts represented a liability of €143.4m (2011: €130.8m, 2010: €136.1m). The cross-currency swap contracts are recorded as both short-term and long-term liabilities to match the maturities of the underlying notes. The €12.6m loss (2011: €5.3m gain, 2010: €39.3m gain) on the cross-currency swap contracts during 2012 was almost fully offset by the €12.5m gain, (2011: €21.1m loss, 2010: €44.9m loss) recorded on the translation of the US dollar- denominated debt to euro.
Part of the restructuring of the Group's interest rate profile which took place in June and July 2010 was the change of the interest rate conditions of the paying leg of the cross currency swap contracts maturing in 2015 from Euribor plus margin to a fixed rate.
The notional principal amounts of the outstanding cross-currency swap contracts at 31 December 2012 totaled €803.9m (2011: €803.9m, 2010: €803.9m). The cross-currency swap contracts outstanding at 31 December 2012 are summarised as follows:
Receive US$ million € million Start date Maturity date floating rate Pay rate
500.0 446.8 17 September 2003 17 September 2013 Libor + margin Euribor + margin 250.0 223.2 17 September 2003 17 September 2015 Libor + margin 2.718% 100.0 89.3 17 September 2003 17 September 2015 Libor + margin 2.750% 50.0 44.6 17 September 2003 17 September 2015 Libor + margin 2.675% 900.0 803.9
Repricing dates for all US dollar denominated cross currency swap contracts are the 17th of March and the 17th of September annually until maturity. Fair value Ineffectiveness and undesignated Losses Cash flow charged/ hedges charged/ released hedges losses/ (credited) to the (credited) to the from equity to (gains) taken
profit and loss profit and loss the profit and loss to equity
31 December 2012 € million € million € million € million
Derivatives Interest rate swap contracts for fair value hedging ................................ 0.7 14.4 — — Interest rate and Cross currency swap contracts for cash flow hedging ................................................................ 7.2 — 1.2 8.2 Foreign currency forward contracts / Foreign currency option contracts ................................ — 3.5 8.3 14.7 Commodity swap contracts ................................................................ — 4.4 — — Hedged items Borrowings ................................................................ — (14.4) — (15.4) Forecast transactions ................................................................ — — — (14.7) Other foreign currency assets / liabilities ................................ — (1.1) — — Total ................................................................................................ 7.9 6.8 9.5 (7.2)
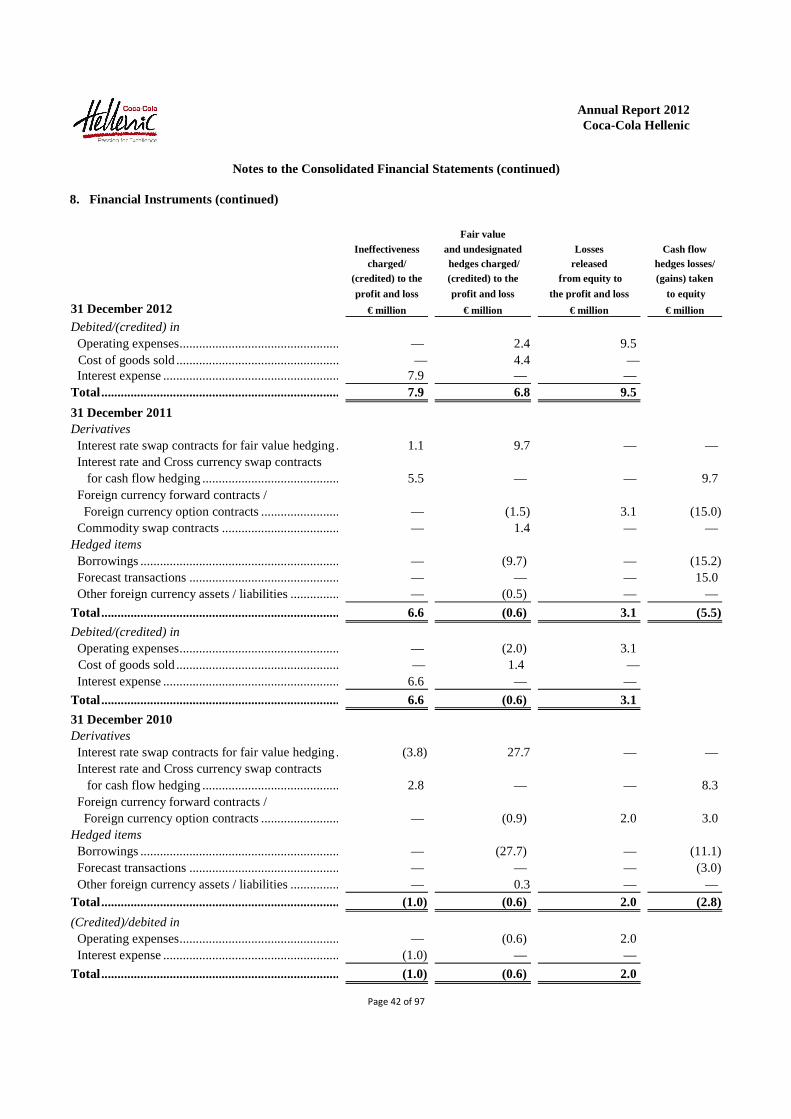
Notes to the Consolidated Financial Statements (continued)
8. Financial Instruments (continued)
Page 42 of 97
Annual Report 2012 Coca-Cola Hellenic
Fair value Ineffectiveness and undesignated Losses Cash flow charged/ hedges charged/ released hedges losses/ (credited) to the (credited) to the from equity to (gains) taken
profit and loss profit and loss the profit and loss to equity
31 December 2012 € million € million € million € million
Debited/(credited) in Operating expenses ................................................................ — 2.4 9.5 Cost of goods sold ................................................................
— 4.4 — Interest expense ................................................................ 7.9 — — Total ................................................................................................ 7.9 6.8 9.5
31 December 2011 Derivatives Interest rate swap contracts for fair value hedging ................................ 1.1 9.7 — — Interest rate and Cross currency swap contracts for cash flow hedging ................................................................ 5.5 — — 9.7 Foreign currency forward contracts / Foreign currency option contracts ................................ — (1.5) 3.1 (15.0) Commodity swap contracts ................................................................ — 1.4 — — Hedged items Borrowings ................................................................ — (9.7) — (15.2) Forecast transactions ................................................................ — — — 15.0 Other foreign currency assets / liabilities ................................ — (0.5) — —
Total ................................................................................................ 6.6 (0.6) 3.1 (5.5)
Debited/(credited) in Operating expenses ................................................................ — (2.0) 3.1 Cost of goods sold ................................................................
— 1.4 — Interest expense ................................................................ 6.6 — — Total ................................................................................................ 6.6 (0.6) 3.1
31 December 2010 Derivatives Interest rate swap contracts for fair value hedging ................................ (3.8) 27.7 — — Interest rate and Cross currency swap contracts for cash flow hedging ................................................................ 2.8 — — 8.3 Foreign currency forward contracts / Foreign currency option contracts ................................ — (0.9) 2.0 3.0 Hedged items Borrowings ................................................................ — (27.7) — (11.1) Forecast transactions ................................................................ — — — (3.0) Other foreign currency assets / liabilities ................................ — 0.3 — — Total ................................................................................................ (1.0) (0.6) 2.0 (2.8)
(Credited)/debited in Operating expenses ................................................................ — (0.6) 2.0 Interest expense ................................................................ (1.0) — —
Total ................................................................................................ (1.0) (0.6) 2.0

Notes to the Consolidated Financial Statements (continued)
9. Deferred Tax
Page 43 of 97
Annual Report 2012 Coca-Cola Hellenic
Deferred tax assets and liabilities are offset when there is a legally enforceable right to offset current tax assets against current tax liabilities, when the deferred taxes are levied by the same fiscal authority on either the taxable entity or different taxable entities, and there is an intention to settle the balances on a net basis. The following amounts, after off-setting balances within the same tax jurisdiction where applicable, are shown in the consolidated balance sheet:
2012 2011 2010 € million € million € million
Deferred tax assets ................................................................................................................................ 40.1 35.1 34.8 Deferred tax liabilities ................................................................................................................................ (177.4) (172.1) (165.2)
Total deferred tax ................................................................................................................................ (137.3) (137.0) (130.4) The gross amounts of deferred tax assets and liabilities are as follows:
2012 2011 2010 € million € million € million
Deferred tax assets To be recovered after more than 12 months ................................................................ 66.7 72.4 68.8 To be recovered within 12 months ................................................................................................ 99.4 86.5 94.6
166.1 158.9 163.4 Deferred tax liabilities To be recovered after more than 12 months ................................................................ (296.0) (288.8) (286.5) To be recovered within 12 months ................................................................................................ (7.4) (7.1) (7.3)
(303.4) (295.9) (293.8)
Deferred tax liabilities (net) ................................................................................................ (137.3) (137.0) (130.4) The movements in deferred tax assets and liabilities during the year, after off-setting balances within the same tax jurisdiction where applicable, are as follows:
2012 2011 2010 € million € million € million
As at 1 January ................................................................................................................................ (137.0) (130.4) (102.1) Taken to the income statement (refer to Note 22) ................................................................ (4.8) (13.5) (31.2) Taken to equity ................................................................................................................................ 5.5 4.3 (1.0) Pre-acquisition deferred tax assets in connection with acquisition of CCB, recognised subsequent to business combination (refer to Note 20 and Note 22) ................................................................................................ — — 10.2 Arising on prior year acquisitions ................................................................................................ — 0.1 — Arising on disposal of subsidiary ................................................................................................ — 0.7 — Foreign currency translation ................................................................................................ (1.0) 1.8 (6.3)
As at 31 December ................................................................................................................................ (137.3) (137.0) (130.4)

Notes to the Consolidated Financial Statements (continued)
9. Deferred Tax (continued)
Page 44 of 97
Annual Report 2012 Coca-Cola Hellenic
The movements in deferred tax assets and liabilities during the year, without taking into consideration the offsetting of balances within the same tax jurisdiction where applicable, are as follows: Tax in excess Capital Other
of book Assets investment Derivative deferred tax
depreciation impairment incentives instruments liabilities Total
Deferred tax liabilities € million € million € million € million € million € million
As at 1 January 2010 (240.4) (2.9) (2.2) 0.6 (11.5) (256.4) Taken to the income statement ................................ (26.9) (0.2) — — (0.6) (27.7) Taken to equity ................................................................ — — — 0.2 (0.4) (0.2) Transfers between assets/liabilities ................................ — — — — 2.6 2.6 Foreign currency translation ................................ (11.3) 0.1 — — (0.9) (12.1) As at 31 December 2010 (278.6) (3.0) (2.2) 0.8 (10.8) (293.8) Taken to the income statement ................................ (13.9) 3.0 — — 2.9 (8.0) Taken to equity ................................................................ — — — (2.8) (0.8) (3.6) Arising on disposal of subsidiary ................................ 0.7 — — — — 0.7 Transfers between assets/liabilities ................................ 0.5 — — — 2.8 3.3 Foreign currency translation ................................ 4.9 — — — 0.6 5.5 As at 31 December 2011 (286.4) — (2.2) (2.0) (5.3) (295.9) Taken to the income statement ................................ (8.2) — — (1.0) — (9.2) Taken to equity ................................................................ — — — 1.0 (0.2) 0.8 Transfers between assets/liabilities ................................ 4.3 — — — (1.0) 3.3 Foreign currency translation ................................ (2.4) — — — — (2.4)
As at 31 December 2012 (292.7) — (2.2) (2.0) (6.5) (303.4)

Notes to the Consolidated Financial Statements (continued)
9. Deferred Tax (continued)
Page 45 of 97
Annual Report 2012 Coca-Cola Hellenic
Book in Pensions Other
excess of tax Tax losses and deferred
depreciation Provisions carry-forward Leasing benefit plans tax assets Total Deferred tax assets € million € million € million € million € million € million € million
As at 1 January 2010 ................................ 1.5 65.5 18.4 13.7 20.1 35.1 154.3 Taken to the income statement ................................(0.1) (6.6) 10.3 4.5 1.6 (3.0) 6.7 Taken to equity ................................ — (0.1) — — (0.9) 0.2 (0.8)
Transfers between assets/liabilities ................................— (2.5) — — (1.1) 1.0 (2.6) Foreign currency translation ................................— 2.8 1.1 — 0.6 1.3 5.8 As at 31 December 2010 1.4 59.1 29.8 18.2 20.3 34.6 163.4 Taken to the income statement ................................0.4 (8.4) 8.3 (4.0) (3.4) 1.6 (5.5) Taken to equity ................................ — — — — 6.5 1.4 7.9 Arising on current year acquisition ................................— — — — — 0.1 0.1 Transfers between assets/liabilities ................................(0.5) (0.1) — — (2.6) (0.1) (3.3) Foreign currency translation ................................(0.5) (1.4) — (0.2) (0.2) (1.4) (3.7) As at 31 December 2011 0.8 49.2 38.1 14.0 20.6 36.2 158.9 Taken to the income statement ................................5.0 4.5 (7.1) 4.2 (2.0) (0.2) 4.4 Taken to equity ................................ — — — — 3.0 1.7 4.7 Transfers between assets/liabilities ................................(2.9) (1.8) — — (0.1) 1.5 (3.3) Foreign currency translation ................................— 0.6 0.7 0.1 0.3 (0.3) 1.4
As at 31 December 2012 2.9 52.5 31.7 18.3 21.8 38.9 166.1

Notes to the Consolidated Financial Statements (continued)
9. Deferred Tax (continued)
Page 46 of 97
Annual Report 2012 Coca-Cola Hellenic
Deferred tax assets are recognised for tax losses carry-forward to the extent that realisation of the related tax benefit through the reduction of future taxes is probable. The Group has unrecognised deferred tax assets attributable to tax losses that are available to carry forward against future taxable income of €0.5m (2011: €0.9m, 2010: €1.3m). €0.5m of this unrecognised deferred tax asset is attributable to tax losses that expire between 2013 and 2017.
The aggregate amount of temporary differences associated with investment in subsidiaries and interests in joint arrangements, for which deferred tax liabilities have not been recognised amount to €1,856.3m (2011: €2,433.5m, 2010: € 2,143.6m ). It is not practicable to compute the total amount of the potential income tax consequences that would result from the payment of dividends to shareholders.
10. Other non-current assets Other non-current assets consisted of the following at 31 December: 2012 2011 2010 € million € million € million Non-current prepayments ................................................................................................ 30.8 32.8 31.3 Loans to related parties (refer to Note 34) ................................................................................................ 13.7 10.6 11.8 Loans to non-related parties ................................................................................................ 1.1 2.4 4.5 Held-to-maturity investments ................................................................................................ 1.6 1.6 1.7 Total other non-current assets ................................................................................................ 47.2 47.4 49.3
11. Inventories Inventories consisted of the following at 31 December:
2012 2011 2010 € million € million € million
Finished goods ................................................................................................................................186.0 163.6 195.5 Raw materials and work in progress ................................................................................................175.6 179.7 180.3 Consumables ................................................................................................................................96.4 104.4 101.6
Total inventories ................................................................................................................................458.0 447.7 477.4 The amount of inventories recognized as an expense during 2012 was €3,709.4m (2011: €3,355.8m, 2010: €3,863.3m). During 2012 provision of obsolete inventories recognised as an expense amounted to €9.2m (2011: €2.7m, 2010: €1.1m), whereas provision reversed in the period amounted to €0.1m (2011: €1.3m, 2010: €2.6m).

Notes to the Consolidated Financial Statements (continued)
12. Trade receivables
Page 47 of 97
Annual Report 2012 Coca-Cola Hellenic
Trade receivables consisted of the following at 31 December:
2012 2011 2010 € million € million € million
Trade receivables ................................................................................................................................ 878.2 929.0 937.3 Less: Provision for doubtful debts ................................................................................................ (76.9) (74.3) (66.8)
Total trade receivables ................................................................................................................................ 801.3 854.7 870.5 The credit period given to customers ranges from 7 days to 105 days depending on the country and customer type. In most territories, interest is not charged for late payment. The Group provides for all receivables that are considered non-collectible on a specific basis after considering the circumstances of each case. Before accepting any new credit customers, the Group investigates the potential customer’s credit quality (usually through external agents) and defines credit limits for each customer. Customers are reviewed on an ongoing basis and credit limits adjusted accordingly. There are no customers who represent more than 5% of the total balance of trade receivables for the Group. The Group's exposure to credit risk is managed by established policies and procedures regarding financial risk management as described in Note 30. The trade receivables are as follows:
2012 2011 2010
€ million € million € million
Due within due date ................................................................................................................................ 655.5 715.6 706.2 Less: Provision for doubtful debts within due date ................................................................ (1.3) (1.1) (3.5) Past due ................................................................................................................................ 222.7 213.4 231.1 Less: Provision for doubtful debts past due ................................................................................................ (75.6) (73.2) (63.3)
Total trade receivables ................................................................................................................................ 801.3 854.7 870.5 As at 31 December 2012, the Group held collateral, in the form of mortgages, bank guarantees, bills of exchange and credit insurance, as security against trade receivables with a carrying amount of €20.9m (2011 and 2010: €23.1m and €22.0m respectively).
As at 31 December 2012, trade receivables of €147.1m (2011 and 2010: €140.2m and €167.8m respectively) were past due but not impaired. The ageing analysis of these trade receivables is as follows: 2012 2011 2010
€ million € million € million
Up to 3 months ................................................................................................................................ 128.2 116.4 140.9 3 to 6 months ................................................................................................................................ 5.4 11.6 16.9 6 to 9 months ................................................................................................................................ 2.7 4.9 5.8 More than 9 months ................................................................................................................................ 10.8 7.3 4.2
147.1 140.2 167.8 As at 31 December 2012, trade receivables of €75.6m (2011 and 2010: €73.2m and €63.3m respectively) were past due and impaired or provided for. The ageing analysis of these receivables is as follows:

Notes to the Consolidated Financial Statements (continued)
12. Trade receivables (continued)
Page 48 of 97
Annual Report 2012 Coca-Cola Hellenic
2012 2011 2010
€ million € million € million
Up to 3 months ................................................................................................................................ (2.0) (11.2) (4.0) 3 to 6 months ................................................................................................................................ (6.9) (6.0) (11.5) 6 to 9 months ................................................................................................................................ (3.7) (3.3) (4.5) More than 9 months ................................................................................................................................ (63.0) (52.7) (43.3)
(75.6) (73.2) (63.3) The movement in the provision for doubtful debts during the year is as follows:
2012 2011 2010 € million € million € million As at 1 January ................................................................................................................................ (74.3) (66.8) (63.2) Amounts written off during the year ................................................................................................ 18.0 6.1 6.8 Amounts recovered during the year ................................................................................................ 1.5 4.5 11.2 Increase in allowance recognised in profit or loss ................................................................ (22.1) (18.5) (20.9) Foreign currency translation ................................................................................................ — 0.4 (0.7)
As at 31 December ................................................................................................................................ (76.9) (74.3) (66.8)
The recording and release of provision for impaired receivables are classified within operating expenses. 13. Other receivables and assets Other receivables and assets consisted of the following at 31 December:
2012 2011 2010 € million € million € million
Prepayments ................................................................................................................................ 72.3 66.9 99.1 Receivables from related parties (refer to Note 34) ................................................................ 57.0 65.6 58.2 Collateral for interest rate swap contracts (refer to Note 8) ................................................................ 23.5 26.3 11.6 VAT and other taxes receivable ................................................................................................ 21.0 19.6 20.1 Loans and advances to employees ................................................................................................ 13.6 11.9 8.2 Assets classified as held for sale ................................................................................................ 10.4 — 1.8 Receivables from sale of property, plant and equipment ................................................................ 8.0 0.8 4.0 Other receivables ................................................................................................................................ 29.7 38.8 31.9
Total other receivables and assets ................................................................................................ 235.5 229.9 234.9 The related party receivables, net of the provision for doubtful debts, are as follows:
2012 2011 2010 € million € million € million
Due within due date ................................................................................................................................ 48.7 61.5 54.2 Past due ................................................................................................................................ 8.3 4.1 4.0 Less: Provision for doubtful debts ................................................................................................ — — —
Total related party receivables ................................................................................................ 57.0 65.6 58.2
Collateral held against related party receivables ................................................................ — — 0.3

Notes to the Consolidated Financial Statements (continued)
13. Other receivables and assets (continued)
Page 49 of 97
Annual Report 2012 Coca-Cola Hellenic
As at 31 December 2012, related party receivables of €8.3m (2011 and 2010: €4.1m and €4.0m respectively) were past due but not impaired. The ageing analysis of these related party receivables is as follows:
2012 2011 2010 € million € million € million
Up to 3 months ................................................................................................................................ 4.8 2.4 2.3 3 to 6 months ................................................................................................................................ 1.4 0.5 0.5 6 to 9 months ................................................................................................................................ 0.5 0.4 0.1 More than 9 months ................................................................................................................................ 1.6 0.8 1.1
Total ................................................................................................................................ 8.3 4.1 4.0

Notes to the Consolidated Financial Statements (continued)
13. Other receivables and assets (continued)
Page 50 of 97
Annual Report 2012 Coca-Cola Hellenic
During 2010, non-current assets with a net book value of €1.8m were reclassified from property, plant and equipment to assets held for sale. The amount of €1.2m concerns land and buildings in our established markets of which €0.4m was sold during 2010 and the amount of €0.6m concerns a plant in our emerging markets.
During 2011, no assets were classified as held for sale. Additionally, non-current assets with a net book value of €1.8m were reclassified to property, plant and equipment, and the depreciation charge for the year was adjusted for the depreciation that would have been recognized had the assets not been classified as held for sale, because the criteria for continued classification as held for sale were no longer met.
During 2012 non-current assets with a net book value of €9.4m were reclassified from property, plant and equipment to assets held for sale. The amount of €9.4m concerns building in our established markets of €4.7m and building in our developing markets of €4.7m respectively. In addition, right to use of land of €1.0m, in our developing markets was classified to assets held for sale during 2012.
14. Cash and cash equivalents
Cash and cash equivalents at 31 December comprise the following:
2012 2011 2010 € million € million € million
Cash at bank, in transit and in hand ................................................................................................79.7 89.8 69.0 Short-term deposits ................................................................................................................................359.4 357.6 237.7 Total cash and cash equivalents................................................................................................439.1 447.4 306.7
Cash and cash equivalents are held in the following currencies: 2012 2011 2010
€ million € million € million
Euro ................................................................................................................................ 377.3 356.1 268.5 Nigerian naira ................................................................................................................................39.2 51.7 3.0 Belorusian rouble ................................................................................................................................4.9 6.6 7.6 Russian rouble ................................................................................................................................4.2 9.6 3.7 Croatian kuna ................................................................................................................................3.2 5.0 4.0 Romanian leu ................................................................................................................................2.4 2.0 1.3 Swiss franc ................................................................................................................................1.4 1.5 1.2 Bosnia and Herzegovina convertible mark ................................................................................................1.4 0.5 0.9 US dollar ................................................................................................................................ 1.3 1.9 0.6 UK Sterling ................................................................................................................................1.1 0.2 0.1 Moldovan leu ................................................................................................................................ 0.7 0.7 0.1 Bulgaria lev ................................................................................................................................0.7 3.6 2.0 Ukrainian hryvnia ................................................................................................................................0.5 2.2 1.6 Polish zloty ................................................................................................................................0.3 0.6 0.4 Serbian dinar ................................................................................................................................— 3.9 10.7 Other ................................................................................................................................ 0.5 1.3 1.0
Total cash and cash equivalents ................................................................................................439.1 447.4 306.7 Under Nigerian naira currency, an equivalent amount of €29.8m relates to the outstanding balance of the bank
account held for the repayment of the former minority shareholders' of the Company's subsidiary Nigerian Bottling Company plc (refer to Note 28). The amount of dividends payable to the Company by its operating subsidiaries is subject to, among other

Notes to the Consolidated Financial Statements (continued)
13. Other receivables and assets (continued)
Page 51 of 97
Annual Report 2012 Coca-Cola Hellenic
restrictions, general limitations imposed by the corporate laws and exchange control restrictions of the respective jurisdictions where those subsidiaries are organized and operate. Also, there are fund transfer restrictions in certain countries in which we operate, in particular Nigeria. These restrictions do not have a material impact on the Group’s liquidity, as the amounts of cash and cash equivalents held in such countries are generally retained for capital expenditure and working capital purposes. Intra group dividends paid by certain of our subsidiaries are also subject to withholding taxes.

Notes to the Consolidated Financial Statements (continued)
15. Borrowings
Page 52 of 97
Annual Report 2012 Coca-Cola Hellenic
The Group held the following borrowings at 31 December:
2012 2011 2010
€ million € million € million
Bank overdrafts ................................................................................................................................16.6 37.5 40.4 Bank loans ................................................................................................................................ — 9.8 8.9 Current portion of long-term bonds, bills and unsecured notes ................................................................391.3 — 304.9 Commercial paper ................................................................................................................................129.5 250.0 127.0 Loan payable to related parties (refer to Note 34) ................................................................ — 2.3 1.2 537.4 299.6 482.4 Obligations under finance leases falling due within one year ................................................................17.6 21.9 48.8 Total borrowings falling due within one year................................................................ 555.0 321.5 531.2
Borrowings falling due within one to two years Bonds, bills and unsecured notes ................................................................................................505.3 411.1 — Borrowings falling due within two to five years Bonds, bills and unsecured notes ................................................................................................923.8 1,446.5 1,259.7 Loan payable to related parties (refer to Note 34) ................................................................ 62.5 9.7 9.6 Borrowings falling due in more than five years Bonds, bills and unsecured notes ................................................................................................— — 298.4 1,491.6 1,867.3 1,567.7 Obligations under finance leases falling due in more than one year ................................ 113.1 72.5 95.1 Total borrowings falling due after one year ................................................................ 1,604.7 1,939.8 1,662.8
Total borrowings ................................................................................................................................2,159.7 2,261.3 2,194.0 Commercial paper programme and committed credit facilities
In March 2002, Coca-Cola Hellenic established a €1.0bn global commercial paper programme to further diversify its short-term funding sources. The programme consists of a euro commercial paper facility and a US dollar-denominated US commercial paper facility, of which the later is currently not active. The commercial paper notes may be issued either as non-interest bearing notes sold at a discount or as interest bearing notes at a fixed or at a floating rate, or by reference to an index or formula. All commercial paper issued under the programme must be repaid within 1 to 365 days. The outstanding amount under the euro commercial paper facility at 31 December 2012 was €129.5m (2011: €250.0m, 2010: €127.0m).
In May 2011, Coca-Cola Hellenic replaced its existing €500.0m syndicated loan facility expiring on 17 December 2012, with a new €500.0m syndicated loan facility, issued through various financial institutions, expiring on 11 May 2016. As a result, an amount of €1.9m was charged to the income statement, in the finance costs line. This facility can be used for general corporate purposes and carries a floating interest rate over Euribor and Libor. The facility allows the Company to draw down, on three to five days notice, amounts in tranches and repay them in periods ranging from one to six months, or any other period agreed between the financial institutions and Coca-Cola Hellenic. No amounts have been drawn under this syndicated loan facility since inception. There are no financial covenants applicable to this facility.
Euro medium-term note programme (‘EMTN’)
In 2001, the Group established a €2.0bn euro medium-term note programme. Bonds issued under the programme through the 100% owned subsidiary Coca-Cola HBC Finance B.V. are fully, unconditionally and irrevocably guaranteed by Coca-Cola Hellenic, as well as Coca-Cola HBC Finance plc (for issues prior to 2009), and are not subject to any financial covenants.

Notes to the Consolidated Financial Statements (continued)
15. Borrowings (continued)
Page 53 of 97
Annual Report 2012 Coca-Cola Hellenic
In July 2004, Coca-Cola Hellenic completed the issue of a €500.0m 7-year euro-denominated fixed rate bond. In December 2010 Coca-Cola Hellenic finalized a cash tender offer through its subsidiary Coca-Cola HBC Finance B.V. for the repurchase of its existing €500m. 4.375% fixed rate notes due on 15 July 2011. On 14 December 2010, Coca-Cola HBC Finance B.V. purchased an aggregate amount of €198.9m which was almost 40% of the total issued €500m euro-denominated bond. As a consequence, an amount of €1.7m was charged to the income statement, in the finance costs line.
In December 2008, Coca-Cola Hellenic completed the issue of a €500.0m 5-year euro-denominated fixed rate bond. Proceeds from the bond offering were partly used to pay for the acquisition of Socib S.p.A. and partly to refinance a floating rate bond that matured in March 2009.
In November 2009, Coca-Cola Hellenic completed the issue of a €300.0m 7-year euro-denominated fixed rate bond. Proceeds from the bond offering were used to fund the capital return payment (refer to Note 18) and it allowed Coca-Cola Hellenic to extend its debt maturity profile.
In March 2011, Coca-Cola Hellenic completed the successful offering of an additional €300.0m 4.25% fixed rate notes to be consolidated and form a single series with the existing €300.0m 4.25% fixed rate notes due 16 November 2016 issued on 16 November 2009. The new notes bring the total outstanding amount of the series to €600.0m. The proceeds of the issue were used to repay the maturity of the existing €301.1m notes due on 15 July 2011.
No bond offerings took place in 2012.
In April 2012, Coca-Cola Hellenic successfully updated the Euro Medium Term Note Programme (EMTN) and increased the programme from €2.0 bn to €3.0 bn to provide for future new issuances.
As at 31 December 2012, a total of €1.1bn in bonds issued under the €3.0bn EMTN programme were outstanding. A further amount of €1.9bn is available for issuance. These bonds are not subject to financial covenants.
Notes issued in the US market
On 17 September 2003, Coca-Cola Hellenic successfully completed, through its 100% owned finance subsidiary Coca-Cola HBC Finance B.V., a $900.0m (€682.0m at 31 December 2012 exchange rates) global offering of privately placed notes with registration rights. The first tranche consisted of an aggregate principal amount of $500.0m (€378.9m at 31 December 2012 exchange rates) due in 2013 and the second tranche consisted of an aggregate principal amount of $400.0m (€303.1m at 31 December 2012 exchange rates) due in 2015. The net proceeds of the offering were used to refinance certain outstanding debt, the leveraged re-capitalisation of the Group and the acquisition of Römerquelle GmbH. In December 2003, an exchange offer was made by Coca-Cola Hellenic in order to effect the exchange of the privately placed notes for similar notes registered with the Securities and Exchange Commission (“SEC”). Acceptances under the offer, which was finalised in February 2004, were $898.1m. The notes are fully, unconditionally and irrevocably solely guaranteed by Coca-Cola Hellenic. These notes are not subject to financial covenants.
Summary of bonds and notes outstanding
Start date Maturity date Fixed coupon
$500m notes 17 September 2003 17 September 2013 5.125%€500m bond 17 December 2008 15 January 2014 7.875%$400m notes 17 September 2003 17 September 2015 5.500%€300m bond 16 November 2009 16 November 2016 4.250%€300m bond 2 March 2011 16 November 2016 4.250% The fair value of bonds and notes payable, including the current portion, is €1,898.3m (2011: €1,926.3m, 2010: €1,919.0m) compared to their book value, including the current portion, of €1,820.4m (2011: €1,857.6m, 2010: €1,863.0m).

Notes to the Consolidated Financial Statements (continued)
15. Borrowings (continued)
Page 54 of 97
Annual Report 2012 Coca-Cola Hellenic
The present value of finance lease liabilities at 31 December was as follows:
2012 2011 2010
€ million € million € million
Less than one year................................................................................................................................ 17.6 21.9 48.8 Later than one year but less than two years ................................................................................................ 13.4 13.7 20.7 Later than two years but less than three years................................................................................................ 7.7 11.3 14.6 Later than three years but less than four years ................................................................................................ 6.0 4.9 11.3 Later than four years but less than five years ................................................................................................ 6.4 3.2 4.5 Later than five years ................................................................................................................................ 79.6 39.4 44.0
Present value of finance lease liabilities ................................................................................................ 130.7 94.4 143.9 The minimum lease payments of finance lease liabilities at 31 December were as follows:
2012 2011 2010
€ million € million € million
Less than one year................................................................................................................................ 22.7 24.8 53.2 Later than one year but less than two years ................................................................................................ 18.7 16.8 24.3 Later than two years but less than three years................................................................................................ 12.4 13.8 17.0 Later than three years but less than four years ................................................................................................ 10.6 7.3 13.8 Later than four years but less than five years ................................................................................................ 11.2 5.5 6.7 Later than five years ................................................................................................................................ 93.1 41.4 46.8 168.7 109.6 161.8 Future finance charges on finance leases ................................................................................................ (38.0) (15.2) (17.9) Present value of finance lease liabilities ................................................................................................ 130.7 94.4 143.9 Finance leases are mainly for land and buildings as well as plant and equipment. The finance leases do not contain contingent rent payments or escalation clauses. The borrowings at 31 December were held in the following currencies: Current Non-current Current Non-current Current Non-current
2012 2012 2011 2011 2010 2010 € million € million € million € million € million € million
Euro ................................................................143.2 1,225.1 269.8 1,164.7 487.7 887.6 US Dollar ................................................................391.5 324.7 — 749.4 — 744.1 Nigerian naira ................................................................11.0 19.3 45.6 — 23.6 — Polish zloty ................................................................5.8 19.3 3.1 8.3 3.2 12.4 UK Sterling ................................................................1.2 15.8 1.8 16.7 6.0 18.1 Ukrainian hryvnia ................................................................0.9 0.5 0.7 0.7 9.4 0.6 Serbian Dinar ................................................................0.9 — — — — — Other ................................................................ 0.5 — 0.5 — 1.3 —
Borrowings ................................................................555.0 1,604.7 321.5 1,939.8 531.2 1,662.8

Notes to the Consolidated Financial Statements (continued)
15. Borrowings (continued)
Page 55 of 97
Annual Report 2012 Coca-Cola Hellenic
The carrying amounts of the borrowings held at fixed and floating interest rate as at 31 December 2012, as well as the weighted average interest rates and maturities of fixed rate borrowings were as follows:
Fixed rate Weighted
liabilities average Fixed Floating weighted maturity for interest rate interest rate Total average which rate is
€ million € million € million interest rate fixed (years)
Euro ................................................................................................ 1,262.3 106.0 1,368.3 5.3% 2.4 US Dollar ................................................................................................ 716.2 — 716.2 5.3% 1.6 Nigerian naira ................................................................ — 30.3 30.3 — — Ukrainian hryvnia ................................................................ — 1.4 1.4 — — UK Sterling ................................................................................................ — 17.0 17.0 — — Polish zloty ................................................................................................ — 25.1 25.1 — — Serbian dinar ................................................................................................ — 0.9 0.9 — — Other ................................................................................................ 0.5 — 0.5 — —
Financial liabilities ................................................................ 1,979.0 180.7 2,159.7 5.3% 2.1
Financial liabilities represent fixed and floating rate borrowings held by the Group. The Group's policy is to hedge
exposures to changes in the fair value of debt and interest rates by using a combination of cross-currency swap contracts, fixed to floating rate interest rate swap contracts and interest rate option contracts. In order to hedge the foreign exchange cash flow exposure on the $400.0m US dollar fixed rate debt, a combination of floating to fixed rate cross currency swap contracts and fixed to floating rate interest rate swap contracts is used.
The $500.0m US dollar fixed rate debt has been fully swapped into a euro floating-rate obligation through a combination of interest rate and cross-currency swaps, with no residual currency risk for the life of the respective bond. In June and July 2010 the $400.0m US dollar fixed rate debt which was initially swapped into a euro floating-rate obligation was restructured to a €357.0m fixed-rate liability (refer to Note 8).
Floating rate debt bears interest based on the following benchmark rates:
Euro ..........................................................................................................6 month EURIBOR (European inter-bank offer rate) Serbian dinar .............................................................................................1 month BELIBOR (Serbian inter-bank offer rate) Nigerian naira ...........................................................................................3 month NIBOR (Nigerian inter-bank offer rate)
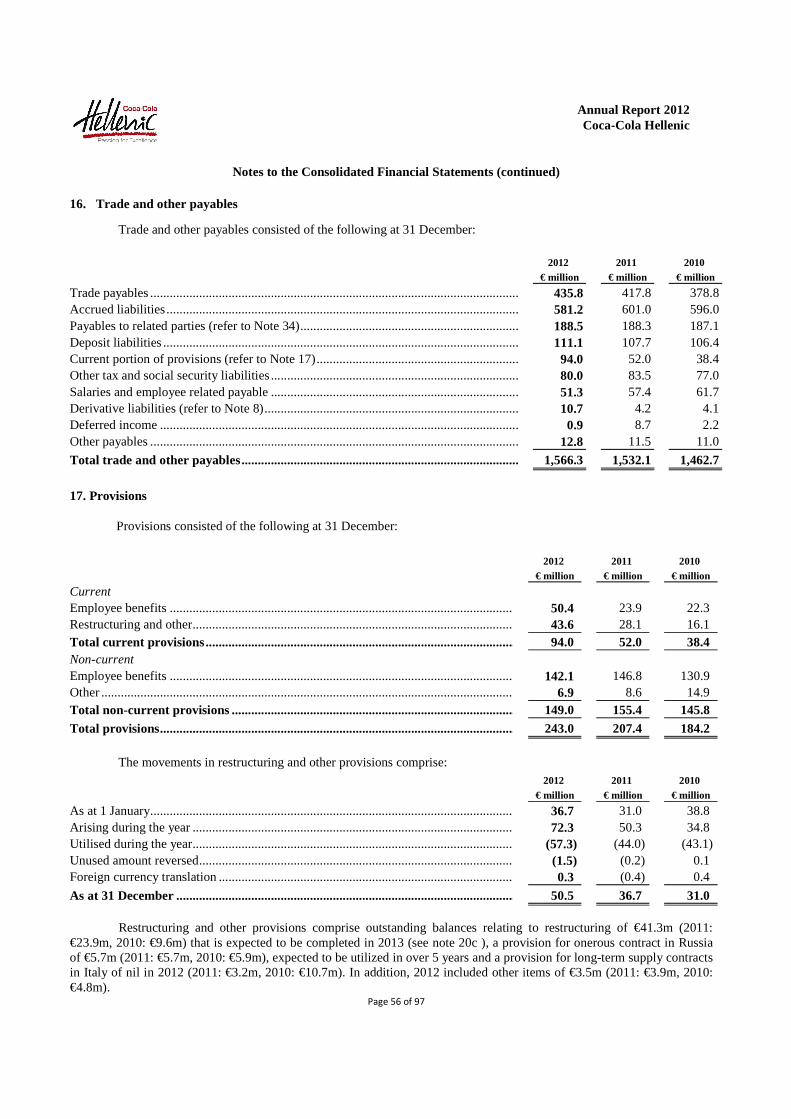
Notes to the Consolidated Financial Statements (continued)
Page 56 of 97
Annual Report 2012 Coca-Cola Hellenic
16. Trade and other payables Trade and other payables consisted of the following at 31 December:
2012 2011 2010 € million € million € million
Trade payables ................................................................................................................................435.8 417.8 378.8 Accrued liabilities ................................................................................................................................581.2 601.0 596.0 Payables to related parties (refer to Note 34) ................................................................................................188.5 188.3 187.1 Deposit liabilities ................................................................................................................................111.1 107.7 106.4 Current portion of provisions (refer to Note 17) ................................................................ 94.0 52.0 38.4 Other tax and social security liabilities ................................................................................................80.0 83.5 77.0 Salaries and employee related payable ................................................................................................51.3 57.4 61.7 Derivative liabilities (refer to Note 8) ................................................................................................10.7 4.2 4.1 Deferred income ................................................................................................................................0.9 8.7 2.2 Other payables ................................................................................................................................12.8 11.5 11.0
Total trade and other payables ................................................................................................1,566.3 1,532.1 1,462.7
17. Provisions
Provisions consisted of the following at 31 December:
2012 2011 2010 € million € million € million
Current Employee benefits ................................................................................................................................ 50.4 23.9 22.3 Restructuring and other ................................................................................................................................ 43.6 28.1 16.1 Total current provisions ................................................................................................ 94.0 52.0 38.4 Non-current Employee benefits ................................................................................................................................ 142.1 146.8 130.9 Other ................................................................................................................................ 6.9 8.6 14.9 Total non-current provisions ................................................................................................ 149.0 155.4 145.8 Total provisions ................................................................................................................................ 243.0 207.4 184.2 The movements in restructuring and other provisions comprise:
2012 2011 2010 € million € million € million
As at 1 January ................................................................................................................................ 36.7 31.0 38.8 Arising during the year ................................................................................................................................ 72.3 50.3 34.8 Utilised during the year ................................................................................................................................ (57.3) (44.0) (43.1) Unused amount reversed ................................................................................................................................ (1.5) (0.2) 0.1 Foreign currency translation ................................................................................................ 0.3 (0.4) 0.4
As at 31 December ................................................................................................................................ 50.5 36.7 31.0 Restructuring and other provisions comprise outstanding balances relating to restructuring of €41.3m (2011: €23.9m, 2010: €9.6m) that is expected to be completed in 2013 (see note 20c ), a provision for onerous contract in Russia of €5.7m (2011: €5.7m, 2010: €5.9m), expected to be utilized in over 5 years and a provision for long-term supply contracts in Italy of nil in 2012 (2011: €3.2m, 2010: €10.7m). In addition, 2012 included other items of €3.5m (2011: €3.9m, 2010: €4.8m).

Notes to the Consolidated Financial Statements (continued)
17. Provisions (continued)
Page 57 of 97
Annual Report 2012 Coca-Cola Hellenic
Employee benefits Employee benefits consisted of the following at 31 December: 2012 2011 2010
€ million € million € mill ion
Defined benefit plans Employee leaving indemnities ................................................................................................ 94.0 95.0 99.9 Pension plans ................................................................................................................................ 42.4 41.4 19.5 Long service benefits—jubilee plans ................................................................................................ 8.2 7.9 7.7 Total defined benefits plans ................................................................................................ 144.6 144.3 127.1 Other employee benefits Annual leave ................................................................................................................................ 9.1 9.2 9.6 Other employee benefits ................................................................................................................................ 38.8 17.2 16.5 Total other employee benefits ................................................................................................ 47.9 26.4 26.1 Total employee benefits obligations ................................................................................................ 192.5 170.7 153.2 Employee benefit obligations at 31 December were split between current and non-current as follows: 2012 2011 2010
€ million € million € million
Current ................................................................................................................................ 50.4 23.9 22.3 Non-current ................................................................................................................................ 142.1 146.8 130.9
Total employee benefits obligations ................................................................................................ 192.5 170.7 153.2
Employees of Coca-Cola Hellenic’s subsidiaries in Austria, Bulgaria, Croatia, Greece, Italy, Montenegro, Nigeria, Poland, Romania, Serbia and Slovenia are entitled to employee leaving indemnities, generally based on each employee’s length of service, employment category and remuneration.
Coca-Cola Hellenic’s subsidiaries in Austria, Greece, Northern Ireland, the Republic of Ireland and Switzerland sponsor defined benefit pension plans. Of the three plans in the Republic of Ireland, two have plan assets, as do the two plans in Northern Ireland, one plan in Greece and one plan in Switzerland. The Austrian plans do not have plan assets. The defined benefit pension plans in Austria, Greece, Republic of Ireland and Northern Ireland are closed to new members.
Coca-Cola Hellenic provides long service benefits in the form of jubilee plans to its employees in Austria, Croatia, Nigeria, Poland, Slovenia and Switzerland.
Defined benefit obligation by segment is as follows: 2012 2011 2010 € million € million € million
Defined Benefit obligation: 144.6 144.3 125.7 Established ................................................................................................................................ 110.9 112.0 96.2 Emerging ................................................................................................................................ 31.3 30.2 27.6 Developing ................................................................................................................................ 2.4 2.1 1.9

Notes to the Consolidated Financial Statements (continued)
17. Provisions (continued)
Page 58 of 97
Annual Report 2012 Coca-Cola Hellenic
The average duration of the defined benefit plans is 17 years and the total employer contributions expected to be paid in 2013 are €22.7m. Through its defined benefit plans the Group is exposed to a number of risks as outlined below:
The Northern Ireland, the Republic of Ireland and Swiss plans hold a significant portion of equities, through investment funds, which are expected to outperform corporate and government bonds in the long term, while providing volatility and risk in the short term. The Group believes due to the long term nature of the plan liabilities the level of equity investments held by the plans are appropriate.
A decrease in corporate bond yields will increase net plan liabilities and the sensitivity of the defined benefit obligation to changes in the discount rate and other significant actuarial assumptions is as follows: Impact on defined benefit obligation
Change in assumptions
Increase in assumption
Decrease in assumption
Discount rate 0.50% decrease of 7.81% increase of 8.62%
Rate of compensation increase 0.50% increase of 2.02% decrease of 1.87% Rate of pension increase 0.50% increase of 2.46% decrease of 1.63% The above sensitivity analysis is based on a change in assumption while holding all other assumptions constant. Reconciliation of defined benefit obligation:
2012 2011 2010 € million € million € million
Present value of defined benefit obligation at 1 January ................................................................ 390.5 374.6 352.9 Current service cost ................................................................................................ 13.4 13.0 13.3 Interest cost ................................................................................................................................ 15.8 15.8 16.9 Plan participants’ contributions ................................................................................................ 4.7 5.0 4.6 Past service cost ................................................................................................ (2.1) 0.2 (2.3) Curtailment/settlement ................................................................................................ 8.0 (5.1) 4.7 Benefits paid ................................................................................................................................ (42.5) (31.6) (38.9) Remeasurements: - (Gains)/Loss from change in demographic assumptions ................................ (4.0) 3.5 5.2 - Loss from change in financial assumptions ................................................................ 37.1 12.9 4.3 - Experience adjustments ................................................................................................ (5.7) (1.6) (12.3) Actual taxes paid ................................................................................................ (0.1) — (0.3) Foreign currency translation ................................................................................................ — 3.8 26.5 Present value of defined benefit obligation at 31 December ................................ 415.1 390.5 374.6

Notes to the Consolidated Financial Statements (continued)
17. Provisions (continued)
Page 59 of 97
Annual Report 2012 Coca-Cola Hellenic
Reconciliation of plan assets: 2012 2011 2010
€ million € million € million
Fair value of plan assets at 1 January ................................................................ 246.2 248.9 207.1 Interest income on plan assets................................................................................................ 8.2 9.3 8.7 Return on plan assets excluding interest income ................................................................ 12.4 (12.4) 3.7 Actual employer’s contributions ................................................................................................ 9.7 10.0 10.5 Actual participant’s contributions ................................................................................................ 4.7 5.0 4.6 Actual benefits paid ................................................................................................ (12.8) (11.1) (11.7) Settlement ................................................................................................................................ — (8.3) — Admin expenses ................................................................................................ — — (0.3) Foreign currency translation ................................................................................................ 2.1 4.8 26.3
Fair value of plan assets at 31 December ................................................................ 270.5 246.2 248.9
The present value and funded status of defined benefit obligations were as follows at 31 December:
2012 2011 2010
€ million € million € million
Deficit of funded plans ................................................................................................ 310.1 285.2 264.6 Fair value of plan assets ................................................................................................ (270.5) (246.2) (248.9)
39.6 39.0 15.7 Present value of unfunded obligations ................................................................................................ 105.0 105.3 110.0 Defined benefit obligations ................................................................................................ 144.6 144.3 125.7 Plus: amounts recognised within long term assets ................................................................ — — 1.4 Total defined benefit obligations ................................................................................................ 144.6 144.3 127.1
The movement in the defined benefit obligation recognised on the balance sheet was as follows: 2012 2011 2010
€ million € million € million
Defined benefit obligation as at 1 January ................................................................ 144.3 125.7 145.8 Expense recognised in the income statement ................................................................ 26.6 22.4 23.5 Actuarial loss/(gain) recognised in OCI................................................................ 15.2 27.7 (6.1) Employer contributions ................................................................................................ (9.7) (10.0) (10.5) Benefits paid ................................................................................................................................ (29.7) (20.5) (27.2) Foreign currency translation ................................................................................................ (2.1) (1.0) 0.2 Defined benefit obligation as at 31 December ................................................................ 144.6 144.3 125.7
The assumptions used in computing the defined benefit obligation comprised the following for the years ended 31 December:

Notes to the Consolidated Financial Statements (continued)
17. Provisions (continued)
Page 60 of 97
Annual Report 2012 Coca-Cola Hellenic
2012 2011 2010
% % %
Discount rate ................................................................................................................................ 3.5 4.2 4.4 Rate of compensation increase................................................................................................ 2.8 3.1 3.1 Pension increases ................................................................................................................................ 0.9 0.9 0.7 The expense recognised in the income statement comprised the following for the years ended 31 December:
2012 2011 2010
€ million € million € million
Service cost ................................................................................................................................ 19.3 16.4 15.7 Net interest cost on defined benefit liability / (asset) ................................................................ 7.5 6.5 8.2 Actuarial gain ................................................................................................................................ (0.2) (0.5) (0.4)
Total ................................................................................................................................ 26.6 22.4 23.5

Notes to the Consolidated Financial Statements (continued)
17. Provisions (continued)
Page 61 of 97
Annual Report 2012 Coca-Cola Hellenic
Defined benefit plan expenditure is included in staff costs and presented in cost of goods sold and operating expenses.
Plan assets are invested as follows: 2012 2011 2010
% % %
Asset category Equity securities - EU ................................................................................................ 15 14 15 Equity securities - NON - EU ................................................................................................ 25 26 27 Government Debt Securities - NON - EU ................................................................ 18 12 12 Government Bonds - EU ................................................................................................ 12 11 7 Corporate Bonds - EU................................................................................................ 2 8 8 Corporate Bonds - NON - EU ................................................................................................ 13 14 14 Real estate ................................................................................................................................ 10 10 10 Cash ................................................................................................................................ 2 2 2 Other ................................................................................................................................ 3 3 5
Total ................................................................................................................................ 100 100 100 Plan assets relate predominately to quoted financial instruments. Equity securities were not invested in ordinary shares of the Company as at 31 December 2012, 31 December 2011 and 31 December 2010. Defined contribution plans The expense recognised in the income statement in 2012 for the defined contribution plan is €20.9m (2011: €20.5m, 2010: €15.5m). This is included in staff costs and recorded in cost of goods sold and operating expenses. 18. Share capital and share premium
Number of
shares Share Share
(authorised Capital Premium Total
and issued) € million € million € million
As at 1 January 2010 ................................................................................................ 365,539,075 182.8 1,113.8 1,296.6 Shares issued to employees exercising stock options ................................ 597,365 0.3 5.4 5.7 Balance as at 31 December 2010 ................................................................ 366,136,440 183.1 1,119.2 1,302.3
Shares issued to employees exercising stock options ................................ 405,568 0.2 4.5 4.7 Capitalisation of share premium reserve ................................................................ — 549.7 (549.7) — Expenses related to share capital increase (net of tax of €1.2m) ................................ — — (4.8) (4.8) Return of capital to shareholders ................................................................ — (183.2) — (183.2) Balance as at 31 December 2011 ................................................................ 366,542,008 549.8 569.2 1,119.0
Shares issued to employees exercising stock options ................................ 11,499 — 0.1 0.1 Reduction of share capital to extinguish accumulated losses of the parent company ................................................................ — (55.0) — (55.0) Return of capital to shareholders ................................................................ — (124.6) — (124.6) Balance as at 31 December 2012 ................................................................ 366,553,507 370.2 569.3 939.5

Notes to the Consolidated Financial Statements (continued)
Page 62 of 97
Annual Report 2012 Coca-Cola Hellenic
18. Share capital and share premium (continued)
During 2010, Coca-Cola Hellenic’s Board of Directors resolved to increase the share capital of the Company by issuing 163,354, 161,663, 102,700 and 169,648 new ordinary shares, on 26 February, 17 May, 24 August and 25 November 2010 respectively following the exercise of stock options by option holders pursuant to the Company’s stock option plan. Total proceeds from the issues of the shares were €5.7m.
During 2011, Coca-Cola Hellenic’s Board of Directors resolved to increase the share capital of the Company by issuing 354,512, 21,994, 28,749 and 313 new ordinary shares as announced on 16 March, 24 June, 1 September and 13 December 2011 respectively, following the exercise of stock options by option holders pursuant to the Company’s stock option plan. Total proceeds from the issues of the shares were €4.7m.
During 2012, Coca-Cola Hellenic’s Board of Directors resolved to increase the share capital of the Company by issuing 5,334 and 6,165 new ordinary shares as announced on 21 March and 27 September 2012 respectively, following the exercise of stock options by option holders pursuant to the Company’s stock option plan. Total proceeds from the issues of the shares were €0.1m.
On 6 May 2011, the Annual General Meeting of shareholders resolved on the reorganisation of its share capital. The Group’s share capital increased by an amount equal to €549.7 million. This increase was effected by capitalising the share premium reserve and increasing the nominal value of each share from €0.50 to €2.00. The share capital was subsequently decreased by an amount equal to €183.2 million by decreasing the nominal value of each share from €2.00 to €1.50, and distributing such €0.50 per share difference to shareholders in cash.
On 25 June 2012, the Annual General Meeting of shareholders resolved to decrease the share capital of the
Company by the amount of €124.6 million by decreasing the nominal value of the Company’s share by €0.34 per share, from €1.50 to €1.16 per share, and the return of the amount of the decrease to the Company’s shareholders in cash, i.e. a return of €0.34 per share. Furthermore, on the same date, it was resolved to decrease the share capital of the Company by the amount of €55.0 million by decreasing the nominal value of the Company’s share by €0.15 per share, from €1.16 to €1.01 per share, in order to extinguish accumulated losses of the parent company Coca-Cola Hellenic Bottling Company S.A. in an equal amount.
After the above changes, the share capital on 31 December 2012 amounts to €370.2 million and is comprised of 366,553,507 shares with a nominal value of €1.01 each. Each share provides the right to one vote at general meetings of Coca-Cola Hellenic and entitles the holder to dividends declared by Coca-Cola Hellenic.

Notes to the Consolidated Financial Statements (continued)
Page 63 of 97
Annual Report 2012 Coca-Cola Hellenic
19. Reserves The reserves of the Group at 31 December were as follows:
2012 2011 2010 € million € million € million
Treasury shares ................................................................................................................................ (54.3) (55.5) (57.2) Exchange equalisation reserve ................................................................................................ (168.1) (199.7) (131.0) Other reserves Shares held for equity compensation plan ................................................................................................ (1.1) (1.2) (0.8) Hedging reserve (net of deferred tax of €3.0m gain; 2011: €2.7m expense; 2010: €0.2m gain) ................................................................................................................................ (15.1) (4.7) (10.3) Tax-free reserve ................................................................................................................................ 251.6 251.6 251.6 Statutory reserve ................................................................................................................................ 76.7 76.2 75.7 Stock option reserve................................................................................................................................ 51.9 45.6 37.5 Available-for-sale financial assets valuation reserve (net of deferred tax of €0.1m expense; 2011: €0.1m gain; 2010: €0.1m gain) ................................ 0.6 0.5 0.8 Other ................................................................................................................................ 12.0 12.0 11.9 Total other reserves ................................................................................................................................ 376.6 380.0 366.4 Total reserves 154.2 124.8 178.2
Treasury shares
On 30 April 2009, the Board of Directors of Coca-Cola Hellenic resolved to buy-back a maximum of 5% of its paid-in share capital during the period that is 24 months from the date of the Extraordinary General Meeting of 27 April 2009 which approved a share buy-back programme pursuant to Article 16 of Codified Law 2190/1920 (i.e. until 26 April 2011). Based on the Company’s capitalisation at that time, the maximum amount that may be bought back pursuant to the programme was 18,270,104 shares. Purchases under the programme were subject to a minimum purchase price of €1.00 per share and a maximum purchase price of €20.00 per share. This programme expired on 26 April 2011.
Applicable law does not require any actual use of such approved share buy-back programmes. The Company may therefore, in its sole discretion, decide not to buy back any shares or to buy fewer shares than the maximum permissible number approved under the programme. The purchase of shares pursuant to the share buy-back programme was dependent upon a number of factors including, without limitation, the relative attractiveness of alternative investment opportunities and the availability of funds. As at 31 December 2012, 3,430,135 shares had been held by the Group pursuant to the share buy-back programme of a total value of €54.3m, bringing the shares in circulation to 363,123,372 (2011: 3,430,135 shares held of a total value of €55.5m, 2010: 3,430, 135 shares held of a total value of €57.2m).
Exchange equalisation reserve
The exchange equalisation reserve comprises all foreign exchange differences arising from the translation of the financial statements of entities with functional currencies other than the euro.

Notes to the Consolidated Financial Statements (continued)
Page 64 of 97
Annual Report 2012 Coca-Cola Hellenic
19. Reserves (continued)
Other reserves
Shares held for equity compensation plan
Shares held for the Coca-Cola Hellenic Stock Purchase Plan, which is an equity compensation plan in which eligible employees may participate. The movement for share-based payment transactions in 2012 was a credit of €0.1m (2011: €0.4m debit, 2010: €0.2m credit)
Hedging reserve
The hedging reserve reflects changes in the fair values of derivatives accounted for as cash flow hedges, net of the deferred tax related to such balances. The movement for 2012 relates to the movement in cash flow hedges of €10.4m debit, net of tax gain of €3.0m (2011: €5.6m credit, net of tax expense of €2.7m, 2010: € 9.1m debit, net of tax gain of €0.2m).
Tax-free reserve
The tax-free reserve includes investment tax incentive and other tax-free or partially taxed reserves of the Group. The tax-free reserve may be distributed if taxed, where applicable. There was no movement in the tax-free reserve in 2012 (2011: nil, 2010: €10.5m credit for the establishment of additional reserves).
Statutory reserves
Statutory reserves are particular to the various countries in which the Group operates. The amount of statutory reserves of the parent entity, Coca-Cola Hellenic, with restrictions on distribution is €55.7m (2011: €55.7m, 2010: €55.7m). The movement in the statutory reserves for 2012 was a €0.5m credit (2011: €0.5m credit, 2010: € 0.4m credit) and relates to the establishment of additional reserves.
Other reserves
Other reserves are particular to the various countries in which the Group operates. There was no movement in other reserves for 2012 (2011: €0.1m credit, 2010: €0.1m credit).
Stock option reserve
The stock option reserve represents the cumulative charge to the income statement for employee stock option awards. The movement for the stock option reserve for 2012 was a €6.3m credit (2011: €8.1m credit, 2010: €6.7m credit).
Available-for-sale financial assets valuation reserve
The available-for-sale financial assets valuation reserve reflects changes in the fair values of available-for-sale financial assets. Amounts in this reserve are reclassified to profit or loss upon sale or impairment of the related investments. The movement for available-for-sale financial assets valuation reserve for 2012 was a € 0.1m credit net of tax expense of €0.1m (2011: €0.3m debit net of tax gain of €0.1m, 2010: €2.2m debit net of tax gain of €0.1m) and relates to revaluation impact of listed and unlisted equities held.

Notes to the Consolidated Financial Statements (continued)
20. Total operating costs
Page 65 of 97
Annual Report 2012 Coca-Cola Hellenic
Total operating costs for the years ended 31 December comprised:
2012 2011 2010 € million € million € million
Operating expenses ................................................................................................................................2,078.1 2,048.2 2,048.4 Restructuring costs ................................................................................................................................106.7 71.1 36.5
Total operating costs ................................................................................................................................2,184.8 2,119.3 2,084.9 a) Operating expenses
2012 2011 2010 € million € million € million
Selling expenses ................................................................................................................................995.6 998.5 1,021.1 Delivery expenses ................................................................................................................................649.6 632.1 630.2 Administrative expenses ................................................................................................................................423.6 406.3 383.6 Stock option expense (refer to Note 26) ................................................................................................6.3 8.1 6.7 Amortisation of intangible assets (refer to Note 4) ................................................................ 3.0 3.2 6.8
Operating expenses ................................................................................................................................2,078.1 2,048.2 2,048.4 In 2012, operating expenses included net losses on disposal of property, plant and equipment of €6.9m (2011: €3.2m losses, 2010: €13.0m losses). (b) Adjustments to intangible assets
During 2010, the Group recognized deferred tax assets on losses that had previously not been recognised on acquisition of CCB by HBC. Correspondingly, a deferred tax credit of €10.2m had been included within tax on the income statement. Based on the revised IFRS 3, Business Combinations, goodwill is no longer adjusted when deferred tax assets on losses have not been recognised on acquisition and are subsequently recognized. Therefore no charge has been included in the operating expenses of 2010. For the credit that has been included in taxes please refer to Note 22 Tax.
(c) Restructuring costs
As part of the effort to optimise its cost base and sustain competitiveness in the market place, the Company undertook restructuring initiatives in 2012 which amounted to €106.7m (2011: €71.1m, 2010: €36.5m) before tax. The Company recorded during 2012 €65.8m (2011: €47.6m, 2010: €25.7m), €34.8m (2011: €17.6m, 2010: €2.3m) and €6.1m (2011: €5.9m, 2010: €8.5m) of restructuring charges in its established, developing and emerging markets, respectively. The restructuring concerns mainly employees’ costs (see note 17) and impairment of property, plant and equipment (see note 5).

Notes to the Consolidated Financial Statements (continued)
20. Total operating costs (continued)
Page 66 of 97
Annual Report 2012 Coca-Cola Hellenic
(e) Staff costs Staff costs included in the income statement in operating expenses and in the cost of goods sold lines are analysed as follows:
2012 2011 2010
€ million € million € million
Wages and salaries ................................................................................................................................819.2 821.6 833.1 Social security costs ................................................................................................................................181.3 175.2 160.4 Pension and other employee benefits ................................................................................................131.3 129.7 123.7 Termination benefits ................................................................................................................................67.5 48.6 32.6
Total staff costs ................................................................................................................................1,199.3 1,175.1 1,149.8 Staff costs included in operating expenses amounted to €945.0m in 2012 (2011: €928.0m, 2010: €906.0m). Staff costs included in cost of goods sold amounted to €254.3m in 2012 (2011: €247.1m, 2010: €243.8m). The average number of full-time equivalent employees in 2012 was 39,736 (2011: 41,291, 2010: 42,044). (f) Fees and other services of the statutory auditor Audit and other fees charged in the income statement concerning the statutory auditor of the consolidated financial statements, PricewaterhouseCoopers S.A and affiliates, were as follows, for the years ended 31 December: 2012 2011 2010 € million € million € million Audit fees ................................................................................................................................ 9.1 6.1 6.1 Audit related fees ................................................................................................................................ 0.5 0.4 0.2 Other fees ................................................................................................................................ 0.1 0.1 0.2
Total audit and all other fees ................................................................................................ 9.7 6.6 6.5
21. Finance costs Net finance costs for the years ended 31 December comprised:
2012 2011 2010 € million € million € million
Interest income ................................................................................................................................ 10.4 8.7 6.9 Interest expense................................................................................................................................ (89.2) (87.2) (68.1) Other finance cost ................................................................................................................................ (1.6) (3.9) (8.2) Net foreign exchange remeasurement gains/(losses) ................................................................ (0.3) 0.6 (0.4) Finance charges paid with respect to finance leases ................................................................ (6.9) (5.6) (6.1) Finance costs (98.0) (96.1) (82.8) Loss on net monetary position (3.1) (7.8) — Total finance costs (101.1) (103.9) (82.8) Total finance costs, net (90.7) (95.2) (75.9)

Notes to the Consolidated Financial Statements (continued)
Page 67 of 97
Annual Report 2012 Coca-Cola Hellenic
Other finance cost includes commitment fees on loan facilities, not drawn down, other similar fees and when applicable premium on debt buy back. Belarus has been considered to be a hyperinflationary economy since the fourth quarter of 2011 as three year cumulative inflation exceeded 100% and therefore Belarus is consolidated in terms of the measuring unit at the balance sheet date and translated at the closing exchange rate. The restatement was based on conversion factors derived from the Belarusian Consumer Price Index (CPI) as compiled by the National Statistical Committee of the Republic of Belarus. The conversion factor used for December 2012 was 1.223 which resulted in a net monetary loss for 2012 of €3.1m. The conversion factor used for December 2011 was 2.080 which resulted in a net monetary loss for 2011 of €7.8m.
Capitalised borrowing costs in 2012 amounted to €1.4m (2011: €1.6m, 2010: €1.4m). The interest rate used to capitalise borrowing costs of the Group for 2012 was 3.86% (2011: 3.83%, 2010: 3.16%).

Notes to the Consolidated Financial Statements (continued)
Page 68 of 97
Annual Report 2012 Coca-Cola Hellenic
22. Tax The tax on the Group’s profit before tax differs from the theoretical amount that would arise using the statutory tax rate in Greece as follows:
2012 2011 2010 € million € million € million
Profit before tax per the income statement ................................................................................................ 258.6 364.5 568.5 Tax calculated at a tax rate of 20% (2011: 20% and 2010: 24% ) ................................................................ 51.7 72.9 136.4 Effect of different tax rates in foreign jurisdictions ................................................................ 8.3 5.3 (24.1) Additional local taxes in foreign jurisdictions ................................................................ 11.6 13.6 13.2 Special tax in Greece ................................................................................................................................ — — 21.2 Tax holidays in foreign jurisdictions ................................................................................................ (1.7) (2.4) (2.0) Expenses non-deductible for tax purposes ................................................................................................ 33.3 51.0 41.1 Income not subject to tax ................................................................................................ (33.6) (30.3) (20.7) Changes in tax laws and rates ................................................................................................ (1.5) 0.4 (1.7) Current year tax losses not recognised ................................................................................................ 2.1 0.2 0.5 Recognition of pre-acquisition deferred tax assets ................................................................ — — (10.2) Utilisation of previously unrecognised post-acquisition tax losses................................................................ (0.1) (0.1) (6.2) Recognition of previously unrecognised post-acquisition tax losses ................................ (0.7) (7.9) (6.5) Other ................................................................................................................................ (4.2) (3.9) (3.2)
Income tax charge per the income statement ................................................................ 65.2 98.8 137.8 Non-deductible expenses for tax purposes include marketing and advertising expenses, service fees, bad debt provisions, entertainment expenses, certain employee benefits and stock options expenses and other items that, partially or in full, are not deductible for tax purposes in certain of our jurisdictions. Special tax in Greece On 6 May 2010, the Greek Government enacted the ‘Extraordinary Contribution of Social Responsibility’ (Law Nr. 3845/2010). According to article 5, the ‘Extraordinary Social Contribution Tax’ was applied retrospectively on the parent Company's 2009 total net income. The amount of such ‘Extraordinary Social Contribution Tax’ applicable to 2009 was €21.2m. As a result the Group recorded a tax charge of €21.2m in 2010. The income tax charge for the years ended 31 December is as follows: 2012 2011 2010
€ million € million € million
Current tax charge ................................................................................................................................ 60.4 85.3 116.8 Deferred tax charge (refer to Note 9) ................................................................................................ 4.8 13.5 31.2 Pre-acquisition deferred tax assets recognised subsequent to acquisition of CCB (refer to Note 20) ................................................................................................................................ — — (10.2) Total income tax charge ................................................................................................ 65.2 98.8 137.8

Notes to the Consolidated Financial Statements (continued)
Page 69 of 97
Annual Report 2012 Coca-Cola Hellenic
23. Earnings per share The calculation of the basic and diluted earnings per share attributable to the owners of the parent entity is based on the following data:
2012 2011 2010
Net profit attributable to the owners of the parent (€ million) ................................................................190.4 264.4 421.0 Weighted average number of ordinary shares for the purposes of basic earnings per share (million) ................................................................................................363.9 363.0 363.3 Effect of dilutive stock options (million) ................................................................................................0.6 0.8 0.2 Weighted average number of ordinary shares for the purposes of diluted earnings per share (million) ................................................................................................364.5 363.8 363.5
Basic and diluted earnings per share (€) ................................................................................................0.52 0.73 1.16 Given the effect of rounding, basic and diluted earnings per share are equal. Outstanding stock options that have an anti-dilutive effect and therefore excluded from diluted earnings per share in 2012 were 6.0m (2011: 4.4m, 2010: 3.4m). 24. Components of other comprehensive income The components of other comprehensive income for the years ended 31 December comprise:
2012 2011 2010
Tax Tax Tax
Before-tax (expense)/ Net-of-tax Before-tax (expense)/ Net-of-tax Before-tax (expense)/ Net-of-tax
amount benefit amount amount benefit amount amount benefit amount
€ million € million € million € million € million € million € million € million € million
Available-for-sale ................................
financial assets ................................ ................................0.2 (0.1) 0.1 (0.4) 0.1 (0.3) (2.3) 0.1 (2.2)
Cash flow hedges ................................ ................................(13.4) 3.0 (10.4) 8.4 (2.7) 5.7 (9.3) 0.2 (9.1)
Foreign currency ................................
translation ................................ ................................32.4 — 32.4 (54.4) — (54.4) 182.0 — 182.0
Actuarial (losses) / gains ................................ ................................(15.2) 2.6 (12.6) (27.7) 5.7 (22.0) 6.1 (1.3) 4.8
Share of other
comprehensive
income of equity
method investments ................................ ................................(0.8) — (0.8) (0.6) — (0.6) 0.9 — 0.9
Other comprehensive income ................................ ................................3.2 5.5 8.7 (74.7) 3.1 (71.6) 177.4 (1.0) 176.4

Notes to the Consolidated Financial Statements (continued)
Page 70 of 97
Annual Report 2012 Coca-Cola Hellenic
25. Shares held for equity compensation plan
The Group operates a stock purchase plan, the Coca-Cola Hellenic Stock Purchase Plan, which is an equity compensation plan in which eligible employees may participate.
Under the terms of this plan, employees have the opportunity to invest 1% to 15% of their salary in ordinary Coca-Cola Hellenic shares by contributing to the plan monthly. Coca-Cola Hellenic will match up to a maximum of 3% of the employee’s salary by way of contribution. Employer contributions are used to purchase matching shares on a monthly basis on the open market, currently the Athens Exchange. Shares are either held in the employees name or by a trust, The Coca-Cola Hellenic Employee Stock Purchase Trust. Matching shares vest one year after the purchase. However, forfeited shares are held in a reserve account of the plan, do not revert back to the Company and may be used to reduce future employer contributions. Dividends received in respect of shares held by the trust are used to purchase additional shares and accrue to the employees.
In order to adapt the plan to the Greek legal framework in the case of employees resident in Greece, Coca-Cola Hellenic matches the contribution of the employees resident in Greece with an annual employer contribution of up to 5% of the employee’s salary, which is made in December, and matching shares purchased in December vest immediately.
During the year of 2012, 188,545 shares were purchased by Coca-Cola Hellenic (2011: 346,996, 2010: 272,279) as matching shares to employee investments. The charge to the income statement totaled €4.1 m (2011: €5.3m, 2010: €5.2m). Of this amount, €0.6m represented employer contributions accrued for Greek resident employees (2011: €1.1m, 2010: €1.1m). The cost of unvested matching shares held by the trust at the end of December 2012, before they vest to employees, was €3.5m (2011: €4.1m, 2010: €4.1m). The total number of shares held by the trust at December 31, 2012 was 2,536,061 (2011: 2,701,979, 2010: 2,428,353). The total contributions made by employees to the trust during 2012 were €3.9m (2011: €6.1m, 2010: €6.0m).
No provision is made for any increase or decrease in value of these shares, as they will vest to employees, and the risks and rewards of fluctuations of the share price are borne by those employees.
The shares held under the equity compensation plan are included in other Reserves (refer to Note 19) and deducted from equity.
26. Stock option compensation plans
Coca-Cola Hellenic operates an equity compensation plan, under which senior managers are granted awards of stock options, based on performance, potentiality and level of responsibility. Options are granted at an exercise price equal to the closing price of the Company’s shares trading on the Athens Exchange on the day of the grant1. Options vest in one-third increments each year for three years and can be exercised for up to ten years from the date of award. When the options are exercised, the proceeds received, net of any transaction costs, are credited to share capital (at the nominal value) and share premium.
1 From December 2008 the exercise price of stock options is determined by reference to the share price of the Company’s share at the close of trading on the date of the grant instead of the weighted average share price during the ten working days prior to the date of the grant.

Notes to the Consolidated Financial Statements (continued)
26. Stock option compensation plans (continued)
Page 71 of 97
Annual Report 2012 Coca-Cola Hellenic
The following table summarizes information regarding outstanding stock options exercisable at December 31, 2012 and stock options exercised during 2012:
Exercise Vesting Number of price after Vesting dates for End of stock the capital status further option options return (€) 2012 increments period outstanding
2003-2004 Stock Option Plan/2003 Grant ................................ 8.83 fully vested - - - 14.12.2013 3,250
2003-2004 Stock Option Plan/2004 Grant ................................ 10.08 fully vested - - - 02.12.2014 86,827
2005-2009 Plan/2005 Grant ................................ 13.19 fully vested - - - 01.12.2015 571,883
2005-2009 Plan/2006A Grant ................................ 14.23 fully vested - - - 20.03.2016 50,001
2005-2009 Plan/2006 Grant ................................ 16.37 fully vested - - - 12.12.2016 1,050,401
2005-2009 Plan/2007 Grant ................................ 26.41 fully vested - - - 12.12.2017 1,274,450
2005-2009 Plan/2008A Grant ................................ 22.20 fully vested - - - 19.06.2018 30,000
2005-2009 Plan/2008 Grant ................................ 9.02 fully vested - - - 10.12.2018 1,333,341
2009-2011 Plan/2009 Grant ................................ 15.70 fully vested - - - 09.12.2019 1,646,967
2009-2011 Plan/2010A Grant ................................ 19.16 two thirds 18.03.2013 - - 17.03.2020 30,000
2009-2011 Plan/2010 Grant ................................ 19.31 two thirds 09.12.2013 - - 08.12.2020 1,913,100
2009-2011 Plan/2011A Grant ................................ 18.53 one third 16.03.2013 16.03.2014 - 15.03.2021 75,000
2009-2011 Plan/2011B Grant ................................ 18.16 one third 24.06.2013 24.06.2014 - 23.06.2021 3,333
2009-2011 Plan/2011 Grant ................................ 11.98 one third 16.12.2013 16.12.2014 - 15.12.2021 1,632,500
Total ................................................................................................ 9,701,053
A summary of stock option activity in 2012 under all plans is as follows:
Weighted Weighted Weighted Weighted average average average average Number exercise price exercise price Number exercise price exercise price of stock before the after the of stock before the after the options capital return capital return options capital return capital return 2012 2012 (€) 2012 (€) 2011 2011 (€) 2011 (€)
Outstanding at January 1 ................................ 9,767,302 16.55 n/a 8,759,862 17.65 n/a Granted ................................................................ n/a n/a n/a 1,717,500 n/a 12.64 Exercised ................................................................ (11,499) 9.36 9.02 (405,568) 11.69 11.19 Expired ................................................................ n/a n/a n/a (3,151) 8.19 7.69 Forfeited ................................................................ (54,750) 21.81 21.47 (301,341) 19.48 18.98
Outstanding at December 31 ................................ 9,701,053 n/a 16.19 9,767,302 n/a 16.55
Exercisable at December 31 ................................ 7,914,981 n/a 16.50 6,192,606 n/a 17.04 Number Weighted of stock average options exercise price 2010 2010 (€)
Outstanding at January 1 ................................ 7,415,442 16.33 Granted ................................................................ 2,010,100 20.15 Exercised ................................................................ (597,365) 9.59 Expired ................................................................ (1,453) 8.29 Forfeited ................................................................ (66,862) 18.08
Outstanding at December 31 ................................ 8,759,862 17.65
Exercisable at December 31 ................................ 5,001,036 17.77

Notes to the Consolidated Financial Statements (continued)
26. Stock option compensation plans (continued)
Page 72 of 97
Annual Report 2012 Coca-Cola Hellenic
The charge to the income statement for employee stock option awards for 2012 amounted to €6.3m (2011: €8.1m,
2010: €6.7m respectively).
As a result of the capital return (refer to note 18 to our consolidated financial statements) of €0.34, a corresponding €0.34 reduction was made to the exercise price of each unexercised stock option under each plan. The modification to the exercise price ensured the intrinsic value of each stock option was retained and did not result in incremental fair value for any of the unexercised stock options. Incremental fair value is calculated using the binomial stock option valuation model and represents the difference between the fair value of an option immediately after the modification and the original fair value of the respective option, measured immediately before the modification.
The Company adopted the employee stock option plan on 13 December 2001. Previously, the Company had issued stock appreciation rights to certain of its employees, including employees who previously held options in CCB. Upon adoption of the stock option plan, all such rights, except those held by retirees and employees located in countries where granting and exercising stock options was impractical or not permitted, were converted into stock options carrying over the same exercise prices, vesting periods and expiration dates.
Equity settled share based payments are measured at fair value at the date of grant using a binomial stock option valuation model. For the year of 2012 there have been no grants. For prior years, the inputs into the model are as follows:
2011 2010
Weighted average fair value of options granted ................................................................ € 2.9 € 5.2 Risk free interest rates ................................................................................................ 2.4% 3.0% Expected volatility ................................................................................................................................ 33.2% 32.2% Dividend yield ................................................................................................................................ 2.5% 1.5% Expected life ................................................................................................................................ 4.1 years 4.0 years
The weighted average remaining contractual life of share options outstanding under the stock option compensation plans at December 31, 2012 was 6.5 years (2011: 7.5 years, 2010: 7.8 years). 27. Stock appreciation rights
Effective January 1, 2012 the Company does not operate any stock appreciation rights.
The Company operated in the past a stock-based compensation plan, under which certain key employees were granted stock appreciation rights (‘SARs’), based on an employee’s performance, potentiality and level of responsibility. There were some stock appreciation rights that remained unexercised from grants that occurred in the past. These remaining stock appreciation rights were exercised during 2011. The terms of the SARs were based upon the basic terms and conditions of stock option grants, except that instead of shares, the holders received a payment equal to the positive difference between the market price of Coca-Cola Hellenic’s shares at the closing time of the Athens Exchange at the date of exercise and the exercise price. SARs vested in one-third increments each year for three years and could be exercised for up to ten years from the date of award.
After the remaining SARs from previous grants were exercised in 2011, on December 31, 2012, there were no outstanding stock appreciation rights.

Notes to the Consolidated Financial Statements (continued)
27. Stock appreciation rights (continued)
Page 73 of 97
Annual Report 2012 Coca-Cola Hellenic
A summary of stock appreciation rights activity under all plans is as follows:
Weighted Weighted average average Weighted exercise exercise
average price before price after Number of exercise Number of the capital the capital SARs price SARs return return
2012 2012 (€) 2011 2011 (€) 2011 (€)
Outstanding on 1 January ................................ — — 13,950 8.19 n/a Exercised ................................................................ — — (13,950) 8.19 7.69 Outstanding and exercisable on 31 December ................................................................ — — — — —
Weighted average Number of exercise SARs price 2010 2010 (€)
Outstanding on 1 January ................................ 77,250 9.60 Exercised ................................................................ (63,300) 9.91 Outstanding and exercisable on 31 December ................................................................ 13,950 8.19 The inputs used for the valuation of SARs are the same as those used for equity settled share based payments with the exception of risk-free interest rates. In 2012 there was no expense recorded in the income statement relating to SARs, compared to debit of €0.1 million and a credit of €0.5 million recorded in 2011 and 2010, respectively. 28. Business combinations and acquisition of non-controlling interests
During 2012, the Group paid the following amounts in respect of non-controlling interest acquired in 2011: Amount of
consideration
€ million
Payment for acquisition in 2011 of non-controlling interests in Nigerian Bottling Company plc 13.9 Cash outflow included in cash flow 13.9

Notes to the Consolidated Financial Statements (continued)
28. Business combinations and acquisition of non-controlling interests (continued)
Page 74 of 97
Annual Report 2012 Coca-Cola Hellenic
During 2011, the Group acquired controlling interests or increased its controlling interest in the following entities:
Net tangible assets Goodwill Acquisition Amount of
applicable arising of trademarks consideration
Location € million € million € million € million
Acquired business: MS Foods UAB Belarus (0.4) 2.7 0.2 2.5 Acquisition of non-controlling interests: Nigerian Bottling Company plc Nigeria - - - 100.2 Coca -Cola HBC-Srbija d.o.o. Serbia - - - 17.7 Total acquisitions as at 31 December 2011 (0.4) 2.7 0.2 120.4
€ million Total consideration 120.4 Less: payment deferred (43.7) Cash outflow included in cash flow 76.7 Acquisition of MS Foods UAB
On 20 April 2011, the Group, along with TCCC, acquired through Multon ZAO, the Russian juice joint arrangement, all outstanding shares of MS Foods UAB, a company that owns 100% of the equity of Vlanpak FE ("Vlanpak"), a fruit juice and nectar producer in Belarus. Our share of the acquisition consideration was €3.9m including an assumption of debt of €1.4m. Acquisition related costs recognized as an expense in income statement, under operating expenses, amounted to €0.3m.
Details of the acquisition are as follows:
Acquiree's carrying Fair Value
amount before combination Adjustments Fair values
€ million € million € million
Property, plant and equipment ................................................................ 0.6 0.3 0.9 Deferred tax assets ................................................................ — 0.1 0.1 Inventories ................................................................................................ 0.1 — 0.1 Short-term borrowings ................................................................ (0.9) (0.5) (1.4) Accounts payable ................................................................................................ (0.1) — (0.1) Fair value of net tangible assets acquired ................................ (0.3) (0.1) (0.4) Trademarks ................................................................................................ — 0.2 0.2 Goodwill ................................................................................................ — 2.7 2.7 Fair value of net assets acquired ................................................................ (0.3) 2.8 2.5
Consideration paid to former shareholders ................................................................................................................................ 2.5 Total consideration ................................................................................................................................................................ 2.5
The contribution of MS Foods UAB to the results of the Group for the year ended 31 December 2011 was revenue of €1.3m and a profit of €1.2m. The revenue and profit that MS Food UAB would have contributed to the Group for the year ended 31 December 2011 if the acquisition date for the business combination had been as of the beginning of the annual

Notes to the Consolidated Financial Statements (continued)
28. Business combinations and acquisition of non-controlling interests (continued)
Page 75 of 97
Annual Report 2012 Coca-Cola Hellenic
reporting period would have been €1.4m and €1.2m respectively. The acquisition resulted in the Group recording €2.7m of goodwill and €0.2m of trademarks in its emerging countries segment.
The goodwill arising on the acquisition of MS Foods UAB is attributed to synergies that the Group expects to realize by combining operations with those already existing in Belarus. None of the goodwill recognized is expected to be deductible for income tax purposes.
Acquisitions of non controlling interests
In 2011 the Group acquired non controlling interests as follows:
On 8 June 2011, the Board of Directors of the Company’s subsidiary Nigerian Bottling Company plc (“NBC”) resolved to propose a scheme of arrangement between NBC and its minority shareholders, involving the cancellation of part of the share capital of NBC. The transaction was approved by the Board of Directors and General Assembly of NBC on 8 June 2011 and 22 July 2011 respectively and resulted in acquisition of the remaining 33.6% of the voting shares of NBC bringing the Group’s interest in the subsidiary to 100%. The transaction was completed in September 2011 and NBC was de-listed from the Nigerian Stock Exchange. The consideration for the acquisition of non controlling interests was €100.2m, including transaction costs of €1.8m, out of which €70.4m was paid as of 31 December 2012 (2011: €56.5m). The remaining amount of €29.8m has yet to be paid in respect of shares acquired as the sellers have yet to claim the cash consideration. This amount is currently held in a separate bank account in Nigeria awaiting claim (see note 14). The difference between the consideration and the carrying value of the interest acquired (€60.1m) has been recognized in retained earnings while the accumulated components recognized in other comprehensive income have been reallocated within the equity of the Group.
On 25 June 2010, the Group initiated a tender offer to purchase all of the remaining shares of the non-controlling interest in Coca-Cola HBC – Srbija d.o.o. (“CCH Serbia’’). The tender offer was completed on 2 August 2010 and resulted in the Group increasing its stake in CCH Serbia to 91.2% as of 31 December 2010. In 2011, the Group acquired all the remaining interest in the subsidiary. The consideration paid for the acquisition of non controlling interest acquired in 2011 was €17.7m, including transaction costs of €0.4m (2010: €3.7m) and the carrying value of the additional interest acquired was €11.4m. The difference between the consideration and the carrying value of the interest acquired has been recognized in retained earnings.
Disposal of Eurmatik S.r.l
In February 2011, the Group sold all of its interests in Eurmatik S.r.l., the vending operator in Italy. The consideration was €13.5m and the cash and cash equivalents disposed were €0.4m. The disposal resulted in the Group derecognising €12.0m of intangible assets and €12.7m of net assets. The disposal of Eurmatik S.r.l resulted in a gain of €0.8m in the Group’s established segment.

Notes to the Consolidated Financial Statements (continued)
Page 76 of 97
Annual Report 2012 Coca-Cola Hellenic
29. Dividends
The reported net results of the parent company’s statutory accounts do not allow for 2012 and 2011 statutory minimum annual dividend payment. As a result the Group has not recorded a dividend liability in respect of 2012 and 2011.
During 2010, a dividend of €0.30 per share totaling €102.0m was paid.
30. Financial risk management
Financial risk factors
The Group’s activities expose it to a variety of financial risks: market risk (including foreign currency risk, interest rate risk, commodity price risk), credit risk, liquidity risk and capital risk. The Group’s overall risk management programme focuses on the volatility of financial markets and seeks to minimise potential adverse effects on the Group’s cash flows. The Group uses derivative financial instruments to hedge certain risk exposures.
Risk management is carried out by the Group Treasury in a controlled manner, consistent with the Board of Directors’ approved policies. Group Treasury identifies, evaluates and hedges financial risks in close co-operation with the Group’s subsidiaries. The Board of Directors has approved the Treasury Policy and Chart of Authority, which together provide the control framework for all treasury and treasury related transactions.
Market Risk
Foreign currency risk
The Group is exposed to the effect of foreign currency risk on future commercial transactions, recognised monetary assets and liabilities that are denominated in currencies other than the local entity’s functional currency, as well as net investments in foreign operations. Foreign currency forward contracts and foreign currency option contracts are used to hedge a portion of the Group’s foreign currency risk. The majority of the foreign currency forward contracts and foreign currency option contracts have maturities of less than one year after the balance sheet date. The foreign currency risk arising from the investment in foreign operations is not hedged.
Management has set up a policy that requires Group companies to manage their foreign exchange risk against their functional currency. To manage their foreign exchange risk arising from future commercial transactions and recognised monetary assets and liabilities, entities in the Group use foreign currency forward and option contracts transacted with Group Treasury. Foreign exchange risk arises when future commercial transactions or recognised monetary assets or liabilities are denominated in a currency that is not the entity’s functional currency. The Group Treasury’s risk management policy is to hedge between 25% and 80% of anticipated cash flows in each major foreign currency for the next twelve months. Each subsidiary designates contracts with Group Treasury as fair value hedges or cash flow hedges, as appropriate. External foreign exchange contracts are designated at Group level as hedges of foreign exchange risk on specific monetary assets, monetary liabilities or future transactions on a gross basis.
The following tables present details of the Group’s sensitivity to reasonably possible increases and decreases in the euro and US dollar against the relevant foreign currencies. In determining reasonable possible changes, the historical volatility over a twelve-month period of the respective foreign currencies in relation to the euro and the US dollar, has been considered. The sensitivity analysis determines the potential gains and losses in the income statement or equity arising from the Group’s foreign exchange positions as a result of the corresponding percentage increases and decreases in the Group’s main foreign currencies, relative to the euro and the US dollar. The sensitivity analysis includes outstanding foreign currency denominated monetary items, external loans as well as loans between operations within the Group where the denomination of the loan is in a currency other than the currency of the local entity. The sensitivity analysis for exchange risk for 2012, 2011 and 2010 was as follows:

Notes to the Consolidated Financial Statements (continued)
30. Financial risk management (continued)
Page 77 of 97
Annual Report 2012 Coca-Cola Hellenic
2012 exchange risk sensitivity analysis
Euro strengthens against Euro weakens against
local currency local currency
Loss/(Gain) in (Gain)/loss in
income (Gain)/loss in income (Gain)/loss in
statement equity statement equity
% change € million € million € million € million
Armenian dram ................................................................ 10.04% 0.7 — (0.8) — Belarusian rouble ................................................................ 9.58% (0.9) — 1.0 — Bulgarian lev ................................................................ 1.97% (0.7) — 0.8 — Croatian kuna ................................................................ 1.99% (0.1) (0.1) 0.1 0.1 Czech koruna ................................................................ 6.52% (2.0) (1.3) 2.5 1.2 Hungarian forint ................................................................ 10.55% (0.7) (1.3) 0.7 1.3 Moldovan leu ................................................................ 10.37% 0.5 0.8 (0.6) (0.9) Nigerian naira ................................................................ 9.89% 1.7 — (2.1) — Polish zloty ................................................................ 8.67% (0.4) (3.8) 0.3 3.4 Romanian leu ................................................................ 4.03% — (1.2) 0.2 0.8 Russian rouble ................................................................ 7.70% 0.2 (2.5) (0.4) 1.4 Serbian dinar ................................................................ 7.27% 0.6 — (0.5) — Swiss franc ................................................................ 1.60% — (0.6) — 0.6 UK sterling ................................................................ 5.81% (0.5) 4.2 0.6 (4.7) Ukrainian hryvnia ................................................................ 8.99% 1.8 — (2.2) — US dollar ................................................................ 8.62% 18.4 1.7 (21.8) (2.0)
18.6 (4.1) (22.2) 1.2
US dollar strengthens against US dollar weakens against
local currency local currency
(Gain)/loss in Loss/(Gain) in
income (Gain)/loss in income Loss/(Gain) in
statement equity statement equity
% change € million € million € million € million Bulgarian lev ................................................................ 8.60% 0.1 — (0.1) — Croatian kuna ................................................................ 8.77% — (0.1) — 0.1 Czech Koruna ................................................................ 13.09% 0.1 — (0.1) — Euro ................................................................ 8.62% (19.1) 1.7 22.7 (2.0) Romanian leu ................................................................ 9.98% (0.1) — 0.1 — Russian rouble ................................................................ 10.92% (0.3) (6.6) 0.8 3.1 Serbian dinar ................................................................ 11.10% — — 0.1 — Ukrainian hryvnia ................................................................ 2.59% 0.2 — (0.3) —
(19.1) (5.0) 23.2 1.2
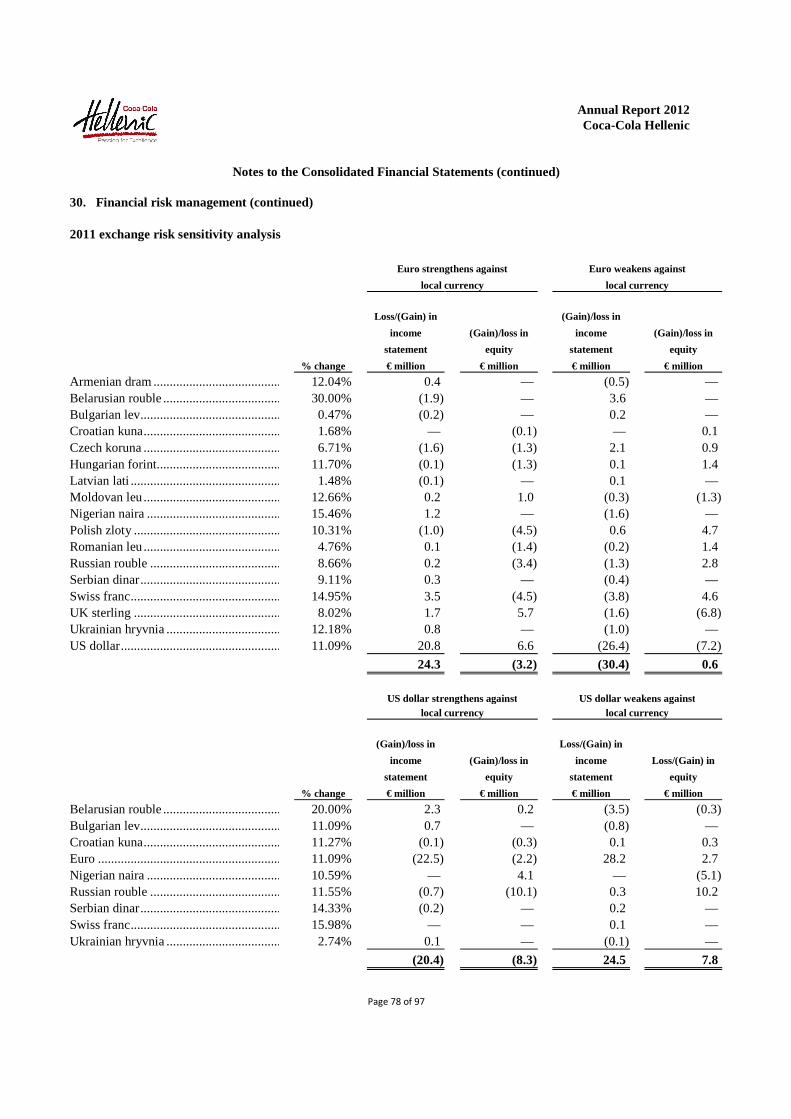
Notes to the Consolidated Financial Statements (continued)
30. Financial risk management (continued)
Page 78 of 97
Annual Report 2012 Coca-Cola Hellenic
2011 exchange risk sensitivity analysis
Euro strengthens against Euro weakens against
local currency local currency
Loss/(Gain) in (Gain)/loss in
income (Gain)/loss in income (Gain)/loss in
statement equity statement equity
% change € million € million € million € million
Armenian dram ................................................................ 12.04% 0.4 — (0.5) — Belarusian rouble ................................................................ 30.00% (1.9) — 3.6 — Bulgarian lev ................................................................ 0.47% (0.2) — 0.2 — Croatian kuna ................................................................ 1.68% — (0.1) — 0.1 Czech koruna ................................................................ 6.71% (1.6) (1.3) 2.1 0.9 Hungarian forint ................................................................ 11.70% (0.1) (1.3) 0.1 1.4 Latvian lati ................................................................ 1.48% (0.1) — 0.1 — Moldovan leu ................................................................ 12.66% 0.2 1.0 (0.3) (1.3) Nigerian naira ................................................................ 15.46% 1.2 — (1.6) — Polish zloty ................................................................ 10.31% (1.0) (4.5) 0.6 4.7 Romanian leu ................................................................ 4.76% 0.1 (1.4) (0.2) 1.4 Russian rouble ................................................................ 8.66% 0.2 (3.4) (1.3) 2.8 Serbian dinar ................................................................ 9.11% 0.3 — (0.4) — Swiss franc ................................................................ 14.95% 3.5 (4.5) (3.8) 4.6 UK sterling ................................................................ 8.02% 1.7 5.7 (1.6) (6.8) Ukrainian hryvnia ................................................................ 12.18% 0.8 — (1.0) — US dollar ................................................................ 11.09% 20.8 6.6 (26.4) (7.2)
24.3 (3.2) (30.4) 0.6
US dollar strengthens against US dollar weakens against local currency local currency
(Gain)/loss in Loss/(Gain) in
income (Gain)/loss in income Loss/(Gain) in
statement equity statement equity
% change € million € million € million € million
Belarusian rouble ................................................................ 20.00% 2.3 0.2 (3.5) (0.3) Bulgarian lev ................................................................ 11.09% 0.7 — (0.8) — Croatian kuna ................................................................ 11.27% (0.1) (0.3) 0.1 0.3 Euro ................................................................ 11.09% (22.5) (2.2) 28.2 2.7 Nigerian naira ................................................................ 10.59% — 4.1 — (5.1) Russian rouble ................................................................ 11.55% (0.7) (10.1) 0.3 10.2 Serbian dinar ................................................................ 14.33% (0.2) — 0.2 — Swiss franc ................................................................ 15.98% — — 0.1 — Ukrainian hryvnia ................................................................ 2.74% 0.1 — (0.1) —
(20.4) (8.3) 24.5 7.8

Notes to the Consolidated Financial Statements (continued)
30. Financial risk management (continued)
Page 79 of 97
Annual Report 2012 Coca-Cola Hellenic
2010 exchange risk sensitivity analysis
Euro strengthens against Euro weakens against
local currency local currency
Loss/(Gain) in Loss/(Gain) in income Loss/(Gain) in income (Gain)/loss in statement equity statement equity
% change € million € million € million € million Belarusian rouble ................................................................ 9.82% (0.6) — 0.7 — Bulgarian lev ................................................................ 0.59% (0.1) — 0.1 — Croatian kuna ................................................................ 1.84% — (0.1) — 0.1 Czech koruna ................................................................ 6.22% (1.4) (1.0) 1.6 0.9 Estonian kroon ................................................................ 0.46% (0.1) — 0.1 — Hungarian forint ................................................................ 11.28% (1.2) (1.6) 2.0 1.1 Moldovan leu ................................................................ 12.38% 0.1 1.0 (0.1) (1.3) Nigerian naira ................................................................ 10.66% 0.5 — (0.7) — Polish zloty ................................................................ 10.56% (0.4) (4.4) 2.6 1.7 Romanian leu ................................................................ 5.14% 1.2 (1.2) (0.4) — Russian rouble ................................................................ 8.64% (0.2) (0.8) (0.7) 0.5 Serbian dinar ................................................................ 4.91% (0.4) — 0.4 — Swiss franc ................................................................ 8.65% (1.6) (1.9) 1.8 1.8 UK sterling ................................................................ 8.38% (0.1) 6.0 0.5 (7.0) Ukrainian hryvnia ................................................................ 10.87% 0.2 — (0.2) — US dollar ................................................................ 10.25% 5.4 3.9 (6.7) (3.3)
1.3 (0.1) 1.0 (5.5)
US dollar strengthens against US dollar weakens against
local currency local currency
(Gain)/loss in Loss/(Gain) in
income (Gain)/loss in income Loss/(Gain) in
statement equity statement equity
% change € million € million € million € million
Belarusian rouble ................................................................ 2.87% 0.1 — (0.1) — Bulgarian lev ................................................................ 10.22% 0.6 (0.1) (0.8) 0.1 Croatian kuna ................................................................ 11.05% — (0.1) — 0.1 Euro ................................................................ 10.25% (5.5) (3.0) 6.8 3.7 Nigerian naira ................................................................ 4.18% 0.1 1.5 (0.1) (1.7) Romanian leu ................................................................ 12.47% — (0.3) — 0.3 Russian rouble ................................................................ 8.94% 0.4 (2.2) (0.6) 0.5
Ukrainian hryvnia ................................................................ 3.21% (0.9) — 1.0 —
(5.2) (4.2) 6.2 3.0

Notes to the Consolidated Financial Statements (continued)
30. Financial risk management (continued)
Page 80 of 97
Annual Report 2012 Coca-Cola Hellenic
Commodity price risk The Group is affected by the volatility of certain commodity prices in relation to certain raw materials (being mainly sugar and aluminium) necessary for the production of the Group’s products. Due to the significantly increased volatility of commodity prices, the Group’s Board of Directors has developed and enacted a risk management strategy regarding commodity price risk and its mitigation. Although the Group continues to contract prices with suppliers in advance, to reduce its exposure to the effect of short-term changes in the price of sugar, fructose and aluminium, in addition, based on a rolling 36 month forecast, the Group hedges the purchase price of sugar and aluminium using commodity swap contracts, even though these contracts do not qualify for hedge accounting. The following table presents details of the Group’s income statement and equity sensitivity to increases and decreases in sugar and aluminium prices. The table does not show the sensitivity to the Group's total underlying sugar and aluminium exposure or the impact of changes in volumes that may arise from increase or decrease in sugar and aluminium prices. The sensitivity analysis determines the potential effect on profit or loss and equity arising from the Group’s commodity swap contract positions as a result of the reasonably possible increases or decreases of the sugar and aluminium price. The sensitivity analysis for sugar and aluminium price risk was as follows: 31 December 2012 Commodity price increases with Commodity price decreases with all other variables held constant all other variables held constant (Gain)/loss in Loss/(Gain) in
income (Gain)/loss in income Loss/(Gain) in
statement equity statement equity
% change € million € million € million € million
Sugar ................................................................ 16.4% (7.8) — 7.8 — Aluminium ................................................................ 19.8% (0.6) — 0.6 —
(8.4) — 8.4 — 31 December 2011 Commodity price increases with Commodity price decreases with all other variables held constant all other variables held constant (Gain)/loss in Loss/(Gain) in
income (Gain)/loss in income Loss/(Gain) in
statement equity statement equity
% change € million € million € million € million
Sugar ................................................................ 27.9% (11.1) — 11.0 —

Notes to the Consolidated Financial Statements (continued)
30. Financial risk management (continued)
Page 81 of 97
Annual Report 2012 Coca-Cola Hellenic
Interest rate risk
The fair value of interest rate swap agreements utilised by the Group modifies the Group’s exposure to interest rate risk and the changes in fair value of debt by converting the Group’s fixed rate debt into floating rate obligation based on Euribor over the life of the underlying US$500.0 million notes. The agreements involve the receipt of fixed rate interest payments in exchange of floating rate interest payments over the life of the agreement without an exchange of the underlying principal amount. In June and July 2009, the Group unwound two euro interest rate swap contracts with a notional value of €207.5m, while in June and July 2010 the Group unwound the remaining interest rate swap contracts with a notional value of €292.5m, all of which related to the €500.0m 7-year euro-denominated fixed rate bond that matured in 2011. Furthermore, in June and July 2010, the Group unwound the interest rate swap contracts with notional value of €500.0m which related to the €500.0m 5-year euro-denominated fixed rate bond that matures in 2014.
During 2009, Coca-Cola Hellenic purchased interest rate option contracts on floating rate debt in order to continue to benefit from lower floating interest rates whilst ensuring protection against adverse interest rate movements. These interest rate options were sold in June and July 2010.
During 2012, we recognized in interest expense an expense of €7.9m in relation to the ineffective portion of swaps which qualified for hedge accounting compared to an expense of €6.6m in 2011 and an income of €1.0m in 2010.
The sensitivity analysis in the following paragraph has been determined based on exposure to interest rates of both derivative and non-derivative instruments existing at the balance sheet date and assuming constant foreign exchange rates. For floating rate liabilities, the analysis is prepared assuming the amount of liability outstanding at the balance sheet date was outstanding for the whole year. A 100 basis point increase or decrease represents management’s assessment of a reasonably possible change in interest rates.
If interest rates had been 100 basis points higher and all other variables were held constant, the Group’s profit for the year ended 31 December 2012 would have decreased by €4.7m (2011: €5.0m, 2010: €1.8m). If interest rates had been 100 basis points lower and all other variables were held constant, the Group’s profit for the year ended 31 December 2012 would have increased by €4.7m (2011: €5.0m, 2010: €1.8m). This is mainly attributable to the Group’s exposure to interest rates on a fixed rate bond that have been swapped to a floating rate obligation.
Credit risk
The Group has limited concentration of credit risk across trade and financial counterparties. Policies are in place to ensure that sales of products and services on credit are made to customers with an appropriate credit history. The Group has policies that limit the amount of credit exposure to any single financial institution.
The Group’s maximum exposure to credit risk in the event that counterparties fail to perform their obligations at 31 December 2012 in relation to each class of recognised financial asset, is the carrying amount of those assets as indicated on the balance sheet.
If credit is granted to customers, their credit quality is normally assessed using external agencies and historic experience. Credit limits are set accordingly. Further information regarding credit risk exposure is shown within Notes 12 and 13.
With respect to derivative financial instruments, credit risk arises from the potential failure of counterparties to meet their obligations under the contract or arrangement. The Group’s maximum credit risk exposure for each derivative instrument is the carrying amount of the derivative (refer to Note 8). In addition, the Group regularly makes use of money market funds to invest temporarily excess cash balances and to diversify its counterparty risk. These funds all have a minimum AAA rating and strict investment limits are set, per fund, depending on the size of the fund.

Notes to the Consolidated Financial Statements (continued)
30. Financial risk management (continued)
Page 82 of 97
Annual Report 2012 Coca-Cola Hellenic
The Group only undertakes investment and derivative transactions with banks and financial institutions that have a minimum credit rating of ‘BBB-’ from Standard & Poor’s and ‘Baa3’ from Moody’s. Since June 2012 the Group has also introduced the Credit Default Swaps of a counterparty in order to measure more timely the credit worthiness of a counterparty and set up its counterparties in tiers in order to assign maximum exposure and tenor per tier. If the Credit Default Swaps of certain counterparty exceed 500bps the Group will stop trading derivatives with that counterparty and will try to cancel any deposits on a best effort basis.
Liquidity risk
The Group actively manages liquidity risk to ensure there are sufficient funds available for any short-term and long-term commitments. Bank overdrafts and bank facilities, both committed and uncommitted, are used to manage this risk.
Ultimate responsibility for liquidity risk management rests with the Board of Directors, which has built an appropriate liquidity risk management framework for the management of the Group’s short, medium and long-term funding and liquidity requirements. The Group manages liquidity risk by maintaining adequate cash reserves and committed banking facilities, access to the debt capital markets, and by continuously monitoring forecasted and actual cash flows. Included in Note 15 is a listing of the undrawn facilities that the Group has at its disposal to manage liquidity risk.
The following tables detail the Group’s remaining contractual maturities for its financial liabilities. The tables include both interest and principal undiscounted cash flows assuming that interest rates remain constant from 31 December 2012.
€ million € million € million € million
up to 1 year 1–2 yrs 2–5 yrs over 5 years
Borrowings ................................................................................................639.1 597.9 1,078.7 96.6 Derivative liabilities ................................................................................................8.3 2.2 0.2 — Trade and other payables ................................................................ 1,461.6 — — 6.7
As at 31 December 2012 ................................................................ 2,109.0 600.1 1,078.9 103.3 Borrowings ................................................................................................413.0 511.7 1,615.7 44.7 Derivative liabilities ................................................................................................4.0 0.2 — — Trade and other payables ................................................................ 1,475.9 — — 6.8
As at 31 December 2011 ................................................................ 1,892.9 511.9 1,615.7 51.5 Borrowings ................................................................................................619.9 92.4 1,458.2 361.3 Derivative liabilities ................................................................................................4.1 — — — Trade and other payables ................................................................ 1,420.2 — — 6.8
As at 31 December 2010 ................................................................ 2,044.2 92.4 1,458.2 368.1
The Group hedges exposures to changes in the fair value of debt, as well as in the foreign exchange cash flows of
debt by using a combination of interest rate and cross-currency swap contracts (refer to Notes 8 and 15). Therefore, the impact of these instruments has been included in the aggregate interest and principal undiscounted cash flows related to the underlying borrowings presented above.

Notes to the Consolidated Financial Statements (continued)
30. Financial risk management (continued)
Page 83 of 97
Annual Report 2012 Coca-Cola Hellenic
Capital risk
The Group’s objectives when managing capital are to safeguard the Group’s ability to continue as going concern and to maintain an optimal capital structure to reduce the cost of capital.
In order to maintain or adjust the capital structure, the Group may increase or decrease debt, issue or buy back shares, adjust the amount of dividends paid to shareholders, or return capital to shareholders.
The Group’s goal is to maintain a conservative financial profile. In April 2012, Standard & Poor’s changed its rating outlook to negative and in June the corporate credit ratings were downgraded to "BBB+" long term, "A2" short term with Credit Watch Negative. In June 2012, Moody's also downgraded Coca-Cola Hellenic ratings to "Baa1" long-term and the outlook remained negative. The main reasons for both downgrades were the continued pressure on business results due to the macroeconomic pressures in our territories and the potential impact of Greece leaving the Eurozone. The Group monitors its capital structure on the basis of the gearing ratio. This ratio is calculated as net debt divided by total capital. Total capital is calculated as ‘Total equity’ plus ’Net debt’ as shown in the consolidated balance sheet. The Group’s strategy is to maintain a gearing ratio within a 35% to 45% range. The gearing ratios at 31 December 2012, 2011 and 2010 were as follows:
2012 2011 2010 € million € million € million
Total borrowings (refer to Note 15) ................................................................................................ 2,159.7 2,261.3 2,194.0 Less: Cash and cash equivalents (refer to Note 14) ................................................................ (439.1) (447.4) (306.7) Net debt ................................................................................................................................ 1,720.6 1,813.9 1,887.3 Total equity ................................................................................................................................ 3,006.5 2,920.2 3,031.1
Total capital ................................................................................................................................ 4,727.1 4,734.1 4,918.4
Gearing ratio ................................................................................................................................ 36% 38% 38%
Fair values of financial assets and liabilities
For financial instruments such as cash, deposits, debtors and creditors, investments, short-term borrowings (excluding the current portion of bonds and notes payable) and other financial liabilities (other than bonds and notes payable), carrying values are a reasonable approximation of their fair values. According to the fair value hierarchy, the financial instruments measured at fair value are classified as follows:
Level 1
The fair value of available-for-sale listed equity securities is based on quoted market prices at 31 December 2012.
Level 2
The fair value of foreign currency forward contracts, foreign currency option contracts, commodity swap contracts, bonds and notes payable, interest rate swap contracts and cross-currency swap contracts is determined by using valuation techniques. These valuation techniques maximise the use of observable market data. The fair value of the foreign currency forward contracts, foreign currency option contracts, commodity swap contracts and cross-currency swap contracts is calculated by reference to quoted forward exchange, deposit rates and forward rate curve of the underlying commodity at 31 December 2012 for contracts with similar maturity dates. The fair value of interest rate option contracts is calculated by reference to the Black and Scholes valuation model and implied volatilities. The fair value of bonds and notes payable has been determined on the basis of the estimated present value of future cash flows based on observable yield curves. The fair value of interest rate swap contracts is determined as the difference in the present value of the future interest cash inflows and outflows based on observable yield curves.

Notes to the Consolidated Financial Statements (continued)
30. Financial risk management (continued)
Page 84 of 97
Annual Report 2012 Coca-Cola Hellenic
Level 3
The fair value of available-for-sale unlisted investments is determined through the use of estimated discounted cash flows.
The following table provides the fair value hierarchy in which fair value measurements are categorised for assets and liabilities at 31 December 2012:
Level 1 Level 2 Level 3 Total
€ million € million € million € million
Financial assets at FVTPL Foreign currency forward contracts ................................................................ — 0.8 — 0.8 Foreign currency option contracts................................................................ — 0.2 — 0.2 Derivative financial assets used for hedging Fair value hedges Foreign currency forward contracts ................................................................ — — — — Interest rate swap contracts ................................................................ — 11.3 — 11.3 Cash flow hedges Foreign currency forward contracts ................................................................ — 0.6 — 0.6 Foreign currency option contracts ................................................................ — 0.7 — 0.7 Interest rate swap contracts ................................................................ — 35.8 — 35.8 Available-for-sale financial assets ................................................................ Equity securities ................................................................................................ 1.0 — 0.7 1.7 Total financial assets ................................................................................................ 1.0 49.4 0.7 51.1
Financial liabilities at FVTPL Foreign currency forward contracts ................................................................ — (0.8) — (0.8) Cross-currency swap contracts ................................................................ — (67.8) — (67.8) Commodity swap contracts ................................................................ — (5.8) — (5.8) Derivative financial liabilities used for hedging Fair value hedges Foreign currency forward contracts ................................................................ — (0.5) — (0.5) Cash flow hedges Foreign currency forward contracts ................................................................ — (3.6) — (3.6) Cross-currency swap contracts ................................................................ — (75.6) — (75.6) Total financial liabilities ................................................................................................ — (154.1) — (154.1)
There were no material changes in fair value measurements for Level 3 items for the year ended 31 December 2012. The following table provides the fair value hierarchy in which fair value measurements are categorised for assets and liabilities at 31 December 2011:

Notes to the Consolidated Financial Statements (continued)
30. Financial risk management (continued)
Page 85 of 97
Annual Report 2012 Coca-Cola Hellenic
Level 1 Level 2 Level 3 Total
€ million € million € million € million Financial assets at FVTPL Foreign currency forward contracts ................................................................ — 3.5 — 3.5 Foreign currency option contracts................................................................ — 0.4 — 0.4 Derivative financial assets used for hedging Fair value hedges Foreign currency forward contracts ................................................................ — 0.6 — 0.6 Interest rate swap contracts ................................................................ — 25.7 — 25.7 Cash flow hedges Foreign currency forward contracts ................................................................ — 9.8 — 9.8 Foreign currency option contracts ................................................................ — 1.4 — 1.4 Interest rate swap contracts ................................................................ — 43.8 — 43.8 Available-for-sale financial assets ................................................................ Equity securities ................................................................................................ 0.7 — 0.5 1.2 Total financial assets ................................................................................................ 0.7 85.2 0.5 86.4
Financial liabilities at FVTPL Foreign currency forward contracts ................................................................ — (0.9) — (0.9) Foreign currency option contracts ................................................................ — (0.4) — (0.4) Cross-currency swap contracts ................................................................ — (60.9) — (60.9) Commodity swap contracts ................................................................ — (1.4) — (1.4) Derivative financial liabilities used for hedging Cash flow hedges Foreign currency forward contracts ................................................................ — (1.5) — (1.5) Cross-currency swap contracts ................................................................ — (69.9) — (69.9) Total financial liabilities ................................................................................................ — (135.0) — (135.0) There were no material changes in fair value measurements for Level 3 items for the year ended 31 December 2011. The following table provides the fair value hierarchy in which fair value measurements are categorised for assets and liabilities at 31 December 2010:

Notes to the Consolidated Financial Statements (continued)
30. Financial risk management (continued)
Page 86 of 97
Annual Report 2012 Coca-Cola Hellenic
Level 1 Level 2 Level 3 Total
€ million € million € million € million Financial assets at FVTPL Foreign currency forward contracts ................................................................ — 0.3 — 0.3 Foreign currency option contracts................................................................ — 0.4 — 0.4 Derivative financial assets used for hedging Fair value hedges Foreign currency forward contracts ................................................................ — 1.7 — 1.7 Interest rate swap contracts ................................................................ — 35.4 — 35.4 Cash flow hedges Foreign currency forward contracts ................................................................ — 0.6 — 0.6 Foreign currency option contracts ................................................................ — 1.2 — 1.2 Interest rate swap contracts ................................................................ — 37.7 — 37.7 Available-for-sale financial assets Equity securities 1.3 — 0.3 1.6 Total financial assets 1.3 77.3 0.3 78.9
Financial liabilities at FVTPL Foreign currency forward contracts ................................................................ — (0.1) — (0.1) Cross-currency swap contracts ................................................................ — (72.6) — (72.6) Derivative financial liabilities used for hedging Fair value hedges Foreign currency forward contracts ................................................................ — (0.6) — (0.6) Cash flow hedges Foreign currency forward contracts ................................................................ — (3.4) — (3.4) Cross-currency swap contracts ................................................................ — (63.5) — (63.5) Total financial liabilities ................................................................................................ — (140.2) — (140.2)
The following table presents changes in fair value measurements for Level 3 items for the year ended 31 December 2010: € million As at 1 January 2010 15.6 Total gains for the year In profit and loss ................................................................................................................................................................ 1.0 Settlements (16.3) As at 31 December 2010 ................................................................................................................................................................ 0.3
Total gains for the year included in profit or loss for assets held at 31 December 2010 1.0 Total gains for the year included in profit or loss for available-for-sale equity securities amounted to €1.0m, related to assets held at 31 December 2010 and were recorded within operating expenses.

Notes to the Consolidated Financial Statements (continued)
Page 87 of 97
Annual Report 2012 Coca-Cola Hellenic
31. Contingencies
The Greek Competition Authority issued a decision on 25 January 2002, imposing a fine on the Company of approximately €2.9m for certain discount and rebate practices and required changes to the Company’s commercial practices with respect to placing coolers in certain locations and lending these assets free of charge. On 16 June 2004, the fine was reduced on appeal to €1.8m. On 29 June 2005, the Greek Competition Authority requested that the Company provide information on its commercial practices as a result of a complaint by certain third parties regarding the Company’s compliance with the decision of 25 January 2002. On 7 October 2005, the Company was served with notice to appear before the Greek Competition Authority. On 14 June 2006, the Greek Competition Authority issued a decision imposing a daily penalty of €5,869 for each day that the Company allegedly failed to comply with the decision of 25 January 2002. On 31 August 2006, the Company deposited an amount of €8.9m, reflecting the amount of the fine and applicable tax, with the Greek authorities. As a result of this deposit, the Company increased the charge to its 2006 financial statements in connection to this case. On 23 November 2007, the Court of Appeals partly reversed and partly upheld the decision of the Greek Competition Authority reducing the amount of the fine to €5.9m. The reduction of the fine by €2.8m was recognized in the Company’s 2007 income statement. The Company has appealed the decision of the Court of Appeals to the extent it upholds the fine, to the Supreme Administrative Court of Greece. The Company believes that it has substantial legal grounds for its appeal against the judgment of the Court of Appeals. The Greek Competition Authority and one of the Company’s competitors have also appealed the decision of the Court of Appeals. There have been no material developments in the applicable litigation. Since 2008 when the case was first referred to the Supreme Administrative Court of Greece, hearings have been postponed due to the backlog of pending cases before the Court. Utilizing advice from outside legal counsel, we consider the risk of an increase to the amount of the fine and the possibility of further cash outflows as remote. In relation to the Greek Competition Authority’s decision of 25 January 2002, one of the Company’s competitors has filed a lawsuit claiming damages in an amount of €7.7m. The court of first instance heard the case on 21 January 2009 and subsequently rejected the lawsuit. The plaintiff has appealed the judgment. At present, it is not possible to predict the final outcome of this lawsuit or quantify the likelihood or materiality of any potential liability arising from it. We have not provided for any losses related to this case. On 1 February 2012, the Greek Competition Commission conducted an inspection of the Company's Greek operations as part of an investigation into the sparkling, juice and water categories. The Company has a policy of strict compliance with Greek and EU competition law and it is cooperating fully with the Commission. In the second quarter of 2010, the Serbian Competition Authority opened an investigation into the commercial practices of our Serbian subsidiary for potential abuse of dominance in the market for distribution of alcoholic and non-alcoholic beverages. On December 2012, the authority addressed a statement of objections to our Serbian subsidiary. We believe that our Serbian subsidiary has not violated any Serbian competition rules and we will challenge any such allegations vigorously. At present, it is not possible to predict the outcome of this investigation.
In 1992, our subsidiary Nigerian Bottling Company ("NBC") acquired a manufacturing facility in Nigeria from Vacunak, a Nigerian Company. In 1994, Vacunak filed a lawsuit against NBC, alleging that a representative of NBC had orally agreed to rescind the sale agreement and instead enter into a lease agreement with Vacunak. As part of its lawsuit Vacunak sought compensation for rent and loss of business opportunities. NBC discontinued all use of the facility in 1995. In a judgement delivered by the Nigerian court of first instance on 28 June 2012, the court awarded Vacunak damages in an amount equivalent to approximately €7.0 million. NBC has filed an appeal against the judgment. Based on advice from NBC's outside legal counsel, we believe that it is unlikely that NBC will suffer material financial losses from this case. We have consequently not provided for any losses in relation to this case. The tax filings of the Company and its subsidiaries are routinely subjected to audit by tax authorities in most of the jurisdictions in which the Company conducts business. These audits may result in assessments of additional taxes. The Company provides additional tax in relation to the outcome of such tax assessments, to the extent that a liability is probable and estimable.
The Company is also involved in various other legal proceedings. Management believes that any liability to the
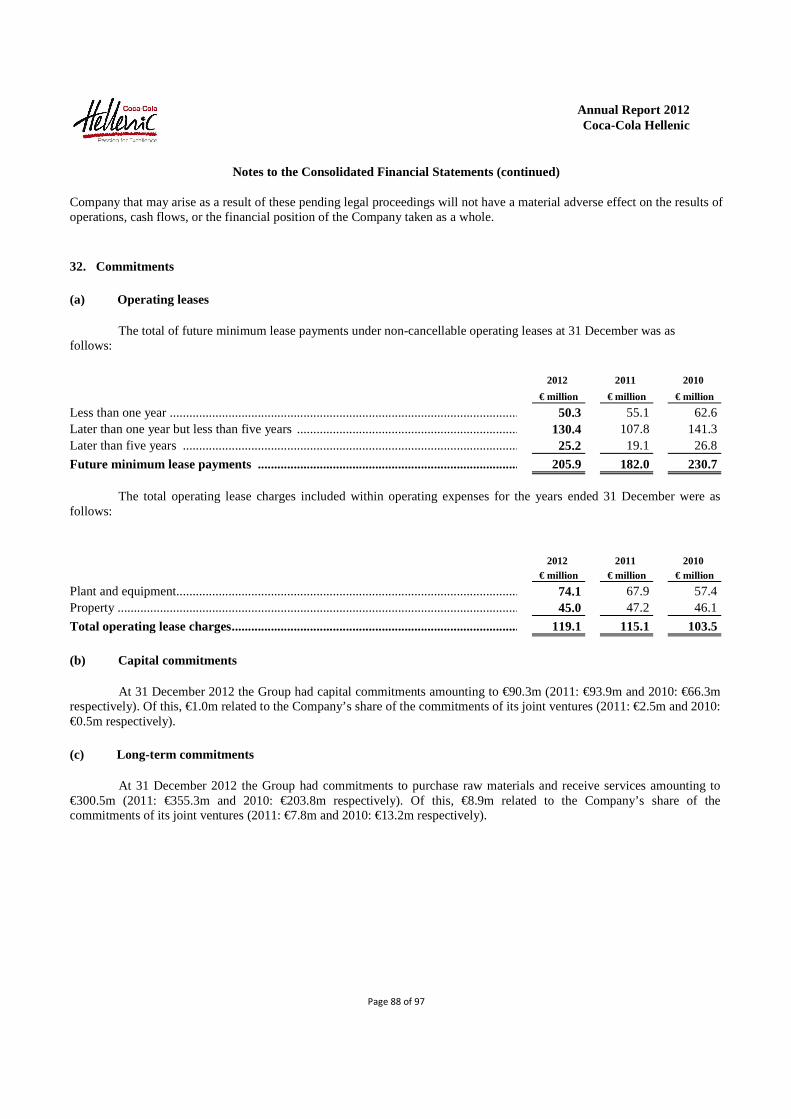
Notes to the Consolidated Financial Statements (continued)
Page 88 of 97
Annual Report 2012 Coca-Cola Hellenic
Company that may arise as a result of these pending legal proceedings will not have a material adverse effect on the results of operations, cash flows, or the financial position of the Company taken as a whole.
32. Commitments (a) Operating leases The total of future minimum lease payments under non-cancellable operating leases at 31 December was as follows:
2012 2011 2010
€ million € million € million
Less than one year ................................................................................................................................ 50.3 55.1 62.6 Later than one year but less than five years ................................................................................................ 130.4 107.8 141.3 Later than five years ................................................................................................................................ 25.2 19.1 26.8
Future minimum lease payments ................................................................................................ 205.9 182.0 230.7 The total operating lease charges included within operating expenses for the years ended 31 December were as follows:
2012 2011 2010 € million € million € million
Plant and equipment................................................................................................................................ 74.1 67.9 57.4 Property ................................................................................................................................ 45.0 47.2 46.1
Total operating lease charges ................................................................................................ 119.1 115.1 103.5 (b) Capital commitments At 31 December 2012 the Group had capital commitments amounting to €90.3m (2011: €93.9m and 2010: €66.3m respectively). Of this, €1.0m related to the Company’s share of the commitments of its joint ventures (2011: €2.5m and 2010: €0.5m respectively). (c) Long-term commitments At 31 December 2012 the Group had commitments to purchase raw materials and receive services amounting to €300.5m (2011: €355.3m and 2010: €203.8m respectively). Of this, €8.9m related to the Company’s share of the commitments of its joint ventures (2011: €7.8m and 2010: €13.2m respectively).

Notes to the Consolidated Financial Statements (continued)
Page 89 of 97
Annual Report 2012 Coca-Cola Hellenic
33. Directors’ and senior management remuneration
The total remuneration paid to or accrued for directors and the senior management team for 2012 amounted to €11.4m (2011: €14.4m, 2010: €14.1m). Out of this, the amount paid or accrued for stock option grants during 2012 was €3.0m (2011: €4.6m, 2010: €4.2m). Pension and post employment benefits for directors and the senior management team during 2012 amounted to €1.0m (2011: €0.8m, 2010: €0.9m).
34. Related party transactions
(a) The Coca-Cola Company
As at 31 December 2012, TCCC indirectly owned 23.2% (2011: 23.2%, 2010: 23.2%) of the issued share capital of Coca-Cola Hellenic. TCCC considers Coca-Cola Hellenic to be a ‘key bottler’ and has entered into bottler’s agreements with Coca-Cola Hellenic in respect of each of Coca-Cola Hellenic’s territories. All the bottler’s agreements entered into by TCCC and Coca-Cola Hellenic are Standard International Bottler’s (‘SIB’) agreements. The terms of the bottler’s agreements grant Coca-Cola Hellenic the right to produce and the exclusive right to sell and distribute the beverages of TCCC in each of the countries Coca-Cola Hellenic operates. Consequently, Coca-Cola Hellenic is obliged to purchase all concentrate for TCCC’s beverages from TCCC, or its designee, in the ordinary course of business. On 10 October 2012, TCCC agreed to extend the term of the bottlers’ agreements for further ten years until 2023. On 29 December 2008, Kar-Tess Holding and TCCC agreed to extend their existing shareholders’ agreement, whereby the combined shareholdings of Kar-Tess Holding and TCCC will not fall below 44% for the period up to January 2014 and not below 40% for the period thereafter until 31 December 2018. Refer also to note 36.
TCCC owns or has applied for the trademarks that identify its beverages in each of the countries Coca-Cola Hellenic operates. TCCC has authorised Coca-Cola Hellenic and certain of its subsidiaries to use the trademark ‘Coca-Cola’ in their corporate names.
Total purchases of concentrate, finished products and other materials from TCCC and its subsidiaries during 2012 amounted to €1,305.4m (2011: €1,300.8m, 2010: €1,368.2m).
TCCC makes discretionary marketing contributions to Coca-Cola Hellenic’s operating subsidiaries. The participation in shared marketing agreements is at TCCC’s discretion and, where co-operative arrangements are entered into, marketing expenses are shared. Such arrangements include the development of marketing programmes to promote TCCC’s beverages. Total net contributions received from TCCC for marketing and promotional incentives during the year amounted to €70.6m (2011: €76.5m, 2010: €60.8m). Contributions for price support and marketing and promotional campaigns in respect of specific customers are recorded in net sales revenue as an offset to promotional incentives paid to customers. In 2012, such contributions totaled €51.2m (2011: €49.0m, 2010: €48.8m). Contributions for general marketing programmes are recorded as an offset to selling expenses. In 2012, such contributions made by TCCC to Coca-Cola Hellenic totalled €20.1m (2011: €21.9m, 2010: €19.8m) and the contributions of Coca-Cola Hellenic to TCCC totalled €0.7m (2011: €9.0m, 2010: €7.8m). TCCC has also customarily made additional payments for marketing and advertising directly to suppliers as part of the shared marketing arrangements. The proportion of direct and indirect payments, made at TCCC’s discretion, will not necessarily be the same from year to year. In addition, there were no support payments received from TCCC for the placement of cold drink equipment for the year ended 31 December 2012 (2011: €14.6m, 2010: nil).
During the year, the Group sold €25.1m of finished goods and raw materials to TCCC (2011: €32.8m, 2010: €19.0m).
Other income primarily comprises rent, facility and other items of €1.2m (2011: €1.2m, 2010: €14.3m) and a toll-filling relationship in Poland of €18.0m (2011: €13.8m, 2010: €17.6m). Other expenses related to facility costs charged by TCCC and shared costs included in operating expenses amounted to €1.5m (2011: €4.0m, 2010: nil).
During 2012 the Group did not make any purchases of franchise rights (2011: nil, 2010: €4.4m) and did not receive any income from the sale of available-for-sale assets to TCCC (2011: nil, 2010: €4.9m).

Notes to the Consolidated Financial Statements (continued)
34. Related party transactions (continued)
Page 90 of 97
Annual Report 2012 Coca-Cola Hellenic
As at 31 December 2012, the Group had a total amount due from TCCC of €49.6m (2011: €56.6m, 2010: €47.9m), and a total amount due to TCCC of €154.0m of trade payables (2011: €162.1m, 2010: €163.1m) and no other liabilities (2011: €7.6m, 2010: nil).
(b) Frigoglass S.A. (‘Frigoglass’)
Frigoglass, a company listed on the Athens Exchange, is a manufacturer of coolers, glass bottles and crowns. Frigoglass is related to Coca-Cola Hellenic by way of 44.1% ownership by the parent of Kar-Tess Holding (see below). Frigoglass has a controlling interest in Frigoglass Industries Limited, a company in which Coca-Cola Hellenic has a 23.9% effective interest, through its investment in Nigerian Bottling Company plc (refer to Note 6).
Coca-Cola Hellenic entered into a supply agreement with Frigoglass for the purchase of cooling equipment in 1999. The supply agreement was extended in 2004 and, most recently, in 2008, on substantially similar terms. Coca-Cola Hellenic has the status of most favoured customer of Frigoglass, on a non-exclusive basis, provided that it obtains at least 60% (at prices which are negotiated on an annual basis and which must be competitive) of its annual requirements for cooling equipment. The current agreement expires on 31 December 2013.
During 2012, the Group made purchases of €137.9m (2011: €147.7m, 2010: €100.5m) of coolers, glass bottles and crowns from Frigoglass and its subsidiaries and incurred maintenance and other expenses of €9.8m (2011: €6.3m, 2010: €5.6m). In addition the Group recorded other income of €0.8m (2011: €1.0m, 2010: €0.5m). As at 31 December 2012, Coca-Cola Hellenic owed €21.4m (2011: €14.3m, 2010: €13.8m) to, and was owed €1.2m (2011: €1.2m, 2010: €1.2m) by Frigoglass.
(c) Directors
Mr George A. David, Mr Haralambos K. Leventis, Mr Anastasios P. Leventis and Mr Anastassis G. David have been nominated by Kar-Tess Holding to the board of Coca-Cola Hellenic. Mr Irial Finan and Mr John Hunter have been nominated by TCCC to the board of Coca-Cola Hellenic. There have been no transactions between Coca-Cola Hellenic and the directors except for remuneration (refer to Note 33).
(d) Other
Beverage Partners Worldwide (‘BPW’)
BPW is a 50/50 joint venture between TCCC and Nestlé. During 2012, the Group purchased inventory from BPW amounting to €101.5m (2011: €99.6m, 2010: €89.4m) and did not record any income (2011: nil, 2010: €0.1m). As at 31 December 2012, Coca-Cola Hellenic owed €4.9m (2011: €4.4m, 2010: €4.4m) to and was not owed any amounts (2011: €0.1m, 2010: nil) by BPW.
Kar-Tess Holding
As at 31 December 2012, Kar-Tess Holding owned 23.3% (2011: 23.3%, 2010: 23.3%) of the issued share capital of Coca-Cola Hellenic.
On 6 December, 2010 Kar-Tess Holding transferred 22,453,254 of Coca-Cola Hellenic shares and voting rights representing 6.13% of the total number of shares and voting rights of Coca-Cola Hellenic by transferring its 100% owned subsidiaries under the trade names “Sammy LLC”, “Lucky 70 LLC”, “Zoe 20 LLC”, “Kooky LLC”, “Utopia Business Company Ltd.”, “Harmonia Commercial S.A.”, “Ice Cold Holdings Limited” and “Red & White Holdings Limited” to entities and individuals, who were either ultimate beneficial owners of Kar-Tess Holding or have been nominated by them. None of the above persons owns individually more than 2% of the outstanding shares and voting rights of Coca-Cola Hellenic.

Notes to the Consolidated Financial Statements (continued)
34. Related party transactions (continued)
Page 91 of 97
Annual Report 2012 Coca-Cola Hellenic
Leventis Overseas & AG Leventis (Nigeria) PLC (the ‘Leventis Companies’)
The Leventis Companies are related to Coca-Cola Hellenic by way of common directors, as a result of which significant influence is considered to exist. During 2012, the Group purchased €20.3m (2011: €14.9m, 2010: €10.8m) of finished goods and other materials from the Leventis Companies. Furthermore the Group did not record any sales of finished goods and raw materials to the Leventis Companies (2011: nil, 2010:€0.1m) and incurred rental expenses of €2.1m (2011: €2.8m, 2010: €0.6m) from the Leventis Companies. In addition during 2012 the Group incurred other expenses of €0.3m (2011: €0.3m, 2010: €0.4m) and did not record other income (2011: €0.3m, 2010: €1.0m) with the Leventis Companies. As at 31 December 2012, the Group owed €2.5m (2011: €3.8m, 2010: €1.3m) to, and was owed €0.1m (2011: €0.2m, 2010: €0.8m) by the Leventis Companies.
Other Coca-Cola bottlers
The Group sold €0.5m of finished goods (2011: €1.6m, 2010: €1.3m), purchased €5.5m of finished goods (2011: €1.9m, 2010: €0.5m), incurred expenses of €0.1m (2011: €0.1m, 2010: €0.1m) and recorded no income (2011: nil, 2010: €0.3m) from other Coca-Cola bottlers over which TCCC has significant influence. Furthermore during 2012 the Group received reimbursement for direct marketing expenses incurred of €0.2m (2011: €0.1m, 2010: €0.8m) from other Coca-Cola bottlers. At 31 December 2012, the receivables from such Coca-Cola bottlers were €0.2m (2011: €0.3m, 2010: €1.5m) and payables to other Coca-Cola bottlers were €0.2m (2011: nil, 2010: nil).
Other related parties
The Group purchased €1.3m (2011: nil, 2010: nil) of raw materials and finished goods and did not perform any purchases of fixed assets from other related parties (2011: nil, 2010: €0.1m). Further, the Group incurred expenses of €1.9m (2011: €1.8m, 2010: €1.4m) and recorded income of €0.1m (2011: €0.3m, 2010: nil). At 31 December 2012, the Group owed €0.5m (2011: €0.2m, 2010: nil) to, and was owed €0.1m (2011: €0.4m, 2010: €0.8m) by other related parties.
(e) Joint Arrangements
The Group purchased €31.0m of finished goods (2011: €28.9m, 2010: €62.3m), incurred other expenses of €0.4m (2011: €0.1m, 2010: €0.1m) and recorded other income of €0.2m from joint arrangements (2011: €0.2m, 2010: €0.1m). As at 31 December 2012, the Group owed €67.5m (2011: €15.5m, 2010: €15.3m) to, and was owed €19.5m (2011: €17.4m, 2010: €17.8m) by joint arrangements ventures, which relate to current and non-current portion.
There are no significant transactions with other related parties for the year ended 31 December 2012.

Notes to the Consolidated Financial Statements (continued)
35. List of principal Group companies
Page 92 of 97
Annual Report 2012 Coca-Cola Hellenic
The following are the principal Group companies at 31 December: % ownership
Country of registration 2012 2011 2010
3E (Cyprus) Limited ...............................................................................Cyprus 100.0% 100.0% 100.0% AS Coca-Cola HBC Eesti ................................................................Estonia 100.0% 100.0% 100.0% Bankya Mineral Waters Bottling Company EOOD ................................Bulgaria 100.0% 100.0% 100.0% Brewinvest S.A. Group(1) ................................................................Greece 50.0% 50.0% 50.0% BrewTech B.V. Group(1),(2) ................................................................The Netherlands 50.0% — — CC Beverages Holdings II B.V. ..............................................................The Netherlands 100.0% 100.0% 100.0% CCB Management Services GmbH ........................................................Austria 100.0% 100.0% 100.0% CCHBC Armenia CJSC ................................................................Armenia 90.0% 90.0% 90.0% CCHBC Bulgaria AD ................................................................Bulgaria 85.4% 85.4% 85.4% CCHBC Insurance (Guernsey) Limited ..................................................Guernsey 100.0% 100.0% 100.0% CCHBC IT Services Limited ................................................................Bulgaria 100.0% 100.0% 100.0% Coca-Cola Beverages Austria GmbH .....................................................Austria 100.0% 100.0% 100.0% Coca-Cola Beverages Belorussiya ..........................................................Belarus 100.0% 100.0% 100.0% Coca-Cola Beverages Ceska republika, s.r.o. ................................Czech Republic 100.0% 100.0% 100.0% Coca-Cola Beverages Ukraine Ltd .........................................................Ukraine 100.0% 100.0% 100.0% Coca-Cola Bottlers Chisinau S.R.L. .......................................................Moldova 100.0% 100.0% 100.0% Coca-Cola Bottlers Iasi Srl ................................................................Romania 99.2% 99.2% 99.2% Coca-Cola Bottling Company (Dublin) Limited................................Republic of Ireland 100.0% 100.0% 100.0% Coca-Cola HBC Balkan Holding B.V. (3) ...............................................The Netherlands — 100.0% 100.0% Coca-Cola HBC-Srbija d.o.o. (4) ..............................................................Serbia 100.0% 100.0% 91.2% Coca-Cola HBC B-H d.o.o. Sarajevo .....................................................Bosnia and Herzegovina 100.0% 100.0% 100.0% Coca-Cola HBC Finance B.V. ................................................................The Netherlands 100.0% 100.0% 100.0% Coca-Cola HBC Finance plc ................................................................England and Wales 100.0% 100.0% 100.0% Coca-Cola HBC Greece S.A.I.C. (5) .......................................................Greece 100.0% 100.0% 100.0% Coca-Cola HBC Hrvatska d.o.o. .............................................................Croatia 100.0% 100.0% 100.0% Coca-Cola HBC Hungary Ltd ................................................................Hungary 100.0% 100.0% 100.0% Coca-Cola HBC Ireland Limited ............................................................Republic of Ireland 100.0% 100.0% 100.0% Coca-Cola HBC Italia S.r.l. ................................................................Italy 100.0% 100.0% 100.0% Coca-Cola HBC Kosovo L.L.C. .............................................................Kosovo 100.0% 100.0% 100.0% Coca-Cola HBC Northern Ireland Limited ................................Northern Ireland 100.0% 100.0% 100.0% Coca-Cola HBC Polska sp. z o.o. ...........................................................Poland 100.0% 100.0% 100.0% Coca-Cola HBC Romania Ltd ................................................................Romania 100.0% 100.0% 100.0% Coca-Cola HBC Slovenija d.o.o. ............................................................Slovenia 100.0% 100.0% 100.0% Coca-Cola HBC Slovenska republika, s.r.o. ................................Slovakia 100.0% 100.0% 100.0% Coca-Cola HBC Switzerland Ltd (6) .......................................................Switzerland 99.9% 99.9% 99.9% Coca-Cola Hellenic Bottling Company-Crna Gora d.o.o.,
Podgorica(4) .........................................................................................Montenegro 100.0% 100.0% 91.2% Coca-Cola Hellenic Business Service Organization (7) ...........................Bulgaria 100.0% 100.0% — Coca-Cola Hellenic Procurement GmbH ................................................Austria 100.0% 100.0% 100.0% Deepwaters Investments Ltd ................................................................Cyprus 50.0% 50.0% 50.0% Dunlogan Limited(8) ................................................................................Northern Ireland — 100.0% 100.0% Lanitis Bros Ltd ......................................................................................Cyprus 100.0% 100.0% 100.0% LLC Coca-Cola HBC Eurasia ................................................................Russia 100.0% 100.0% 100.0% MTV West Kishinev Bottling Company S.A. ................................Moldova 100.0% 100.0% 100.0% Multon Z.A.O. Group(1),(9)................................................................Russia 50.0% 50.0% 50.0% Nigerian Bottling Company Ltd (10) ........................................................Nigeria 100.0% 100.0% 66.4% Panpak Limited(11) ...................................................................................Republic of Ireland — 100.0% 100.0% SIA Coca-Cola HBC Latvia................................................................Latvia 100.0% 100.0% 100.0%

Notes to the Consolidated Financial Statements (continued)
35. List of principal Group companies
Page 93 of 97
Annual Report 2012 Coca-Cola Hellenic
% ownership
Country of registration 2012 2011 2010
Star Bottling Limited ..............................................................................Cyprus 100.0% 100.0% 100.0% Star Bottling Services Corp. ................................................................British Virgin Islands 100.0% 100.0% 100.0% Tsakiris S.A. ...........................................................................................Greece 100.0% 100.0% 100.0% UAB Coca-Cola HBC Lietuva................................................................Lithuania 100.0% 100.0% 100.0% Valser Services AG(7) ................................................................Switzerland 99.9% 99.9% — Vendit Ltd (12) ..........................................................................................Republic of Ireland 100.0% 100.0% 100.0% Yoppi Hungary Kft. ................................................................................Hungary 100.0% 100.0% 100.0%
(1) Joint arrangement. (2) The BrewTech B.V Group of companies is engaged in the bottling and distribution of soft drinks and beer in FYROM. In 2010, 2011 and up until
April 2012 Brewtech B.V. Group formed part of the Brewinvest S.A Group. (3) CCHBC Balkan Holding BV was merged into its parent company, CC Beverages Holdings II BV, effective 14 November 2012. (4) On 25 June 2010, the Group initiated a tender offer to purchase all of remaining shares of the non-controlling interest in Coca-Cola HBC – Srbija
A.D., Zemun (‘’CCH Serbia’’). The tender offer was completed on 2 August 2010 and resulted in the Group increasing its stake in CCH Serbia to 91.2% as of 31 December 2010. In 2011, the Group acquired all the remaining interest in the subsidiary (refer to Note 28).
(5) Effective from 1 August 2012, Elxym S.A. has been renamed to “Coca-Cola HBC Greece S.A.I.C”. On 25 June 2012, CCH’s annual general meeting of shareholders approved the transfer of Greek operations’ operating assets and liabilities to Coca-Cola HBC Greece S.A.I.C, in accordance with Greek Law 2166/1993. In connection therewith, the transformation balance sheet of 31 March 2012, the respective audit report and the draft deed relating to the transaction were approved and the necessary authorisations for its execution and submission to the competent authorities were granted.
(6) During 2010, Coca-Cola Beverages A.G. was renamed to Coca-Cola HBC Switzerland Ltd. (7) Incorporated in 2011. (8) On September 2012, Dunlogan Limited was merged with CC Beverages Holdings II B.V. (9) On 20 April, 2011 the Group along with TCCC, acquired through Multon Z.A.O., MS Foods UAB, a company that owns 100% of the equity of
Vlanpak FE, a fruit juice and nectar producer in Belarus (refer to Note 28). (10) On 8 June 2011, the Board of Directors of the Company’s subsidiary Nigerian Bottling Company plc (“NBC”) resolved to propose a scheme of
arrangement between NBC and its minority shareholders, involving the cancellation of part of the share capital of NBC. The transaction was approved by the Board of Directors and General Assembly of NBC on 8 June 2011 and 22 July 2011 respectively and resulted in acquisition of the remaining 33.6% of the voting shares of NBC bringing the Group’s interest in the subsidiary to 100%. The transaction was completed in September 2011 (refer to Note 28).
(11) Dissolved, effective 7 March 2012. (12) Dissolved, effective 1 January 2013.
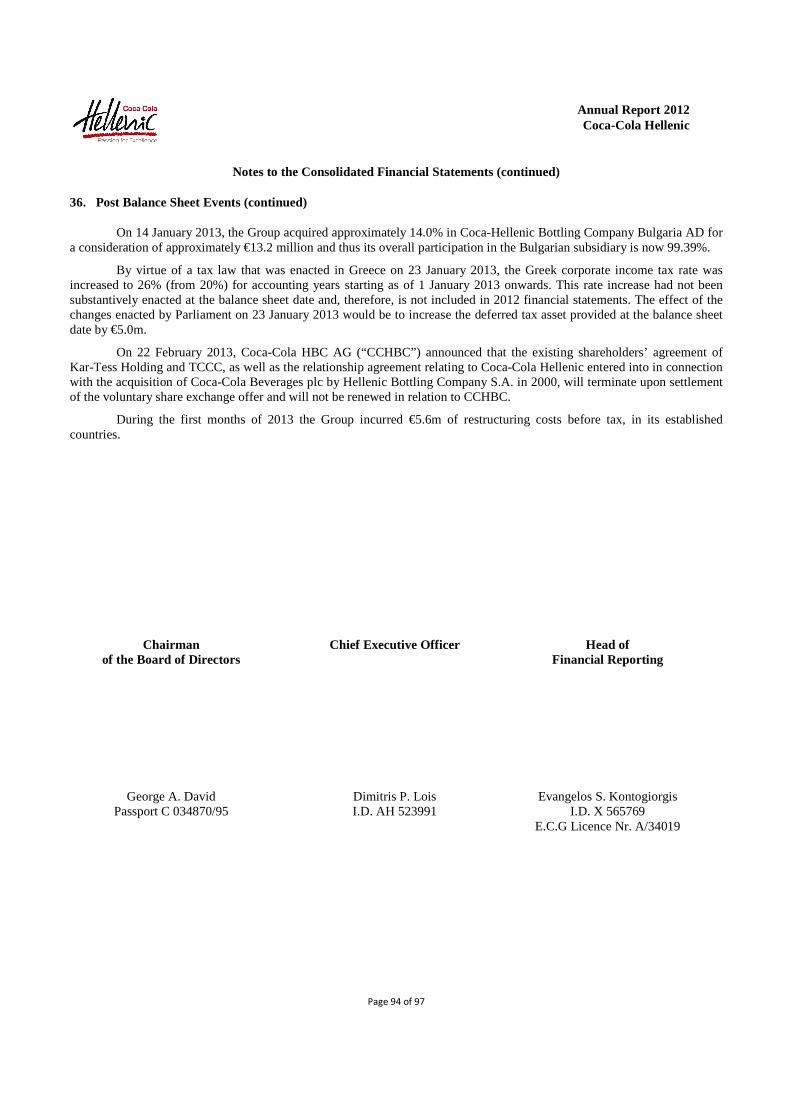
Notes to the Consolidated Financial Statements (continued)
36. Post Balance Sheet Events (continued)
Page 94 of 97
Annual Report 2012 Coca-Cola Hellenic
On 14 January 2013, the Group acquired approximately 14.0% in Coca-Hellenic Bottling Company Bulgaria AD for a consideration of approximately €13.2 million and thus its overall participation in the Bulgarian subsidiary is now 99.39%.
By virtue of a tax law that was enacted in Greece on 23 January 2013, the Greek corporate income tax rate was increased to 26% (from 20%) for accounting years starting as of 1 January 2013 onwards. This rate increase had not been substantively enacted at the balance sheet date and, therefore, is not included in 2012 financial statements. The effect of the changes enacted by Parliament on 23 January 2013 would be to increase the deferred tax asset provided at the balance sheet date by €5.0m.
On 22 February 2013, Coca-Cola HBC AG (“CCHBC”) announced that the existing shareholders’ agreement of Kar-Tess Holding and TCCC, as well as the relationship agreement relating to Coca-Cola Hellenic entered into in connection with the acquisition of Coca-Cola Beverages plc by Hellenic Bottling Company S.A. in 2000, will terminate upon settlement of the voluntary share exchange offer and will not be renewed in relation to CCHBC.
During the first months of 2013 the Group incurred €5.6m of restructuring costs before tax, in its established countries.
Chairman of the Board of Directors
Chief Executive Officer
Head of Financial Reporting
George A. David Passport C 034870/95
Dimitris P. Lois I.D. AH 523991
Evangelos S. Kontogiorgis I.D. X 565769
E.C.G Licence Nr. A/34019

Annual Report 2012 Coca-Cola Hellenic
6. Parent Company Financial Statements and accompanying Notes for the year ended 31 December 2012

The accompanying notes form an integral part of these financial statements
Page 1 of 48
Annual Report 2012 Coca-Cola Hellenic
Balance Sheet As at 31 December
2012(1) 2011 Note € million € million
Assets Goodwill ................................................................................................................................ 3 — 7.5 Property, plant and equipment ................................................................................................ 4 2.6 149.3 Investments in subsidiaries and joint arrangements ................................................................ 5 1,221.6 1,524.1 Available-for-sale financial assets ................................................................................................ 6 1.1 0.6 Deferred tax assets ................................................................................................................................ 8 2.7 15.2 Other non-current assets ................................................................................................................................ 0.4 1.0
Total non-current assets ................................................................................................................................ 1,228.4 1,697.7 Inventories ................................................................................................................................ 9 — 26.6 Trade receivables ................................................................................................................................ 10 0.5 128.9 Other receivables ................................................................................................................................ 11 10.8 40.4 Current tax assets ................................................................................................................................ 0.1 3.7 Cash and cash equivalents ................................................................................................................................ 12 0.4 0.3
Total current assets ................................................................................................................................ 11.8 199.9
Total assets ................................................................................................................................ 1,240.2 1,897.6 Liabilities Short-term borrowings from subsidiaries ................................................................................................ 13 12.1 5.8 Trade and other payables ................................................................................................................................ 14 12.9 119.6
Total current liabilities ................................................................................................................................ 25.0 125.4 Long-term borrowings from subsidiaries ................................................................................................ 13 — 384.7 Other non-current liabilities ................................................................................................................................ 15 6.8 26.7
Total non-current liabilities ................................................................................................ 6.8 411.4
Total liabilities ................................................................................................................................ 31.8 536.8 Equity Share capital ................................................................................................................................ 16 370.2 549.8 Share premium ................................................................................................................................ 16 569.3 569.2 Treasury shares ................................................................................................................................ 17 (54.3) (55.5) Other reserves ................................................................................................................................ 17 192.2 353.0 Retained earnings ................................................................................................................................ 131.0 (55.7)
Total equity ................................................................................................................................ 1,208.4 1,360.8
Total equity and liabilities ................................................................................................................................ 1,240.2 1,897.6 (1) On 1 April 2012, the assets and liabilities of Coca-Cola Hellenic’s Greek Operations were transferred to a wholly-owned subsidiary of Coca-Cola Hellenic as detailed in Note 1.

The accompanying notes form an integral part of these financial statements
Page 2 of 48
Annual Report 2012 Coca-Cola Hellenic
Income Statement
Year ended 31 December
Note
2012(1) 2011 2010
€ million € million € million
Net sales revenue ................................................................................................ 102.5 537.4 609.0 Cost of goods sold ................................................................................................ (76.0) (341.3) (346.5)
Gross profit ................................................................................................................................ 26.5 196.1 262.5
Operating expenses ................................................................................................ 18 (56.4) (191.6) (212.6) Restructuring costs ................................................................................................ 19 (5.2) (26.7) (19.5) Operating (loss) / profit ................................................................................................ (35.1) (22.2) 30.4
Finance income ................................................................................................................................ — — 0.2 Finance costs ................................................................................................................................ (2.0) (14.7) (28.5) Finance costs, net ................................................................................................ 20 (2.0) (14.7) (28.3) (Loss) / profit before tax ................................................................................................ (37.1) (36.9) 2.1
Tax ................................................................................................................................ 21 3.8 2.1 (32.0)
Loss after tax ................................................................................................................................ (33.3) (34.8) (29.9) (1) The income statement includes the Q1 2012 results of Coca-Cola Hellenic’s Greek Operations sector that was transferred to a wholly-owned subsidiary of Coca-Cola Hellenic on 1 April 2012, as detailed in Note 1.

The accompanying notes form an integral part of these financial statements
Page 3 of 48
Annual Report 2012 Coca-Cola Hellenic
Statement of Comprehensive Income Year ended 31 December
2012(1) 2011 2010 € million € million € million
Loss after tax ................................................................................................ (33.3) (34.8) (29.9) Other comprehensive income: Items that may be subsequently reclassified to income statement: Available-for-sale financial assets: Valuation gains/(losses) during the year ................................ 0.3 (0.4) (0.5) Cash flow hedges: Amounts of (losses)/gains during the year ................................ — (0.1) 0.1 Amounts of gains reclassified to profit and loss for the year ................................................................ — — (0.1) (0.2) — 0.1 Income tax relating to items that may be subsequently reclassified to income statement ................................................................ (0.1) 0.1 0.1 0.2 (0.5) (0.3) Items that will not be subsequently reclassified to income statement Actuarial (losses)/gains ................................................................ (3.4) 2.1 7.1 Income tax relating to components of other comprehensive income ................................................................ 1.1 (0.3) (1.4) (2.3) 1.8 5.7 Other comprehensive income for the year, net of tax ................................................................................................ (2.1) 1.3 5.4 Total comprehensive income for the year ................................ (35.4) (33.5) (24.5) (1) The statement of comprehensive income includes the Q1 2012 results of Coca-Cola Hellenic’s Greek Operations sector that was transferred to a wholly-owned subsidiary of Coca-Cola Hellenic on 1 April 2012, as detailed in Note 1.

The accompanying notes form an integral part of these financial statements
Page 4 of 48
Annual Report 2012 Coca-Cola Hellenic
Statement of Changes in Equity
Attributable to owners of the Company
Share Share Treasury Other Retained
capital premium shares reserves earnings Total € million € million € million € million € million € million
Balance as at 1 January 2010 182.8 1,113.8 (14.9) 328.3 80.3 1,690.3 Shares issued to employees exercising stock options ................................ 0.3 5.4 — — — 5.7 Share-based compensation - options — — — 6.7 — 6.7 Shares repurchased ................................................................— — (42.3) — — (42.3) Appropriation of reserves ................................ — — — 10.7 (10.7) — Dividends ................................................................ — — — — (68.1) (68.1) 183.1 1,119.2 (57.2) 345.7 1.5 1,592.3 Loss for the year net of tax ................................ — — — — (29.9) (29.9) Other comprehensive income for
the year, net of tax ................................................................— — —
(0.3) 5.7 5.4 Total comprehensive income for
the year, net of tax(1) ................................................................— — —
(0.3) (24.2) (24.5) Balance as at 31 December 2010 183.1 1,119.2 (57.2) 345.4 (22.7) 1,567.8 Shares issued to employees exercising stock options ................................ 0.2 4.5 — — — 4.7 Share-based compensation - options — — — 8.1 — 8.1 Capitalisation of share premium reserve ................................549.7 (549.7) — — — — Expenses related to share capital increase (net of tax €1.2m) ................................................................— (4.8) — — — (4.8) Return of capital to shareholders ................................(183.2) — 1.7 — — (181.5) 549.8 569.2 (55.5) 353.5 (22.7) 1,394.3 Loss for the year net of tax ................................ — — — — (34.8) (34.8) Other comprehensive income for the year, net of tax ................................................................— — — (0.5) 1.8 1.3 Total comprehensive income for the year, net of tax(2) ................................................................— — — (0.5) (33.0) (33.5) Balance as at 31 December 2011 549.8 569.2 (55.5) 353.0 (55.7) 1,360.8
(1) The amount included in other reserves of €0.3m loss for 2010 consists of losses on valuation of available-for-sale financial assets of €0.5m, gains on
cash flow hedges reserves of €0.1m and deferred income tax thereof amounting to €0.1m. The amount included in retained earnings of €24.2m loss comprises of loss for the year of €29.9m less actuarial gains of €7.1m plus deferred income
tax debit of €1.4m.
(2) The amount included in other reserves of €0.5m loss for 2011 consists of losses on valuation of available-for-sale financial assets of €0.4m, losses on
cash flow hedges reserves of €0.2m and deferred income tax thereof amounting to €0.1m. The amount included in retained earnings of €33.0m loss comprises of loss for the year of €34.8m less actuarial gains of €2.1m plus deferred income tax
debit of €0.3m.

The accompanying notes form an integral part of these financial statements
Page 5 of 48
Annual Report 2012 Coca-Cola Hellenic
Statement of Changes in Equity
Attributable to owners of the Company
Share Share Treasury Other Retained capital premium shares reserves earnings Total € million € million € million € million € million € million
Balance as at 31 December 2011 549.8 569.2 (55.5) 353.0 (55.7) 1,360.8
Shares issued to employees exercising stock options ................................................................ — 0.1 — — — 0.1
Share-based compensation - options ................................ — — — 6.3 — 6.3
Return of capital to shareholders ................................ (124.6) — 1.2 — — (123.4)
Reduction of share capital to extinguish accumulated losses ................................................................ (55.0) — — — 55.0 —
Spin-off of Greek Operations sector (refer to Note 1).............................................................. — — — (167.3) 167.3 —
370.2 569.3 (54.3) 192.0 166.6 1,243.8
Loss for the year net of tax ................................................................ — — — — (33.3) (33.3)
Other comprehensive income for the year, net of tax ................................................................ — — — 0.2 (2.3) (2.1)
Total comprehensive income for the year, net of tax(3) ................................................................ — — — 0.2 (35.6) (35.4)
Balance as at 31 December 2012 370.2 569.3 (54.3) 192.2 131.0 1,208.4
For further details, please refer to: Note 16 Share capital and share premium; Note 17 Reserves; Note 22 Shares held for equity compensation plan; Note 23 Stock option compensation plans; and Note 24 Dividends.
(3) The amount included in other reserves of €0.3m income for 2012 consists of gains on valuation of available-for-sale financial assets and deferred
income tax thereof amounting to €0.1m. The amount included in retained earnings of €35.6m loss comprises of loss for the year of €33.3m plus actuarial losses of €3.4m less deferred income
tax credit of €1.1m.

The accompanying notes form an integral part of these financial statements
Page 6 of 48
Annual Report 2012 Coca-Cola Hellenic
Cash Flow Statement
Year ended 31 December
Note
2012(1) 2011 2010
€ million € million € million
Operating activities Loss after tax ................................................................................................................................ (33.3) (34.8) (29.9) Finance costs, net ................................................................................................................................ 20 2.0 14.7 28.3 Tax (credited)/charged to the income statement ................................................................................................ 21 (3.8) (2.1) 32.0 Depreciation of property, plant and equipment ................................................................................................ 4 7.3 26.6 29.1 Impairment of property, plant and equipment ................................................................................................ 4 — 7.6 — Employee share options ................................................................................................................................ 23 3.9 5.4 4.4
(23.9) 17.4 63.9 Losses/(Gains) on disposals of non-current assets ................................................................ 0.1 (1.0) (0.5) (Increase)/decrease in inventories ................................................................................................ (7.6) 2.9 3.4
Decrease in trade and other receivables ................................................................................................
10.1 1.0
20.2
Increase/(decrease) in trade and other payables ................................................................................................ 9.8 15.3
(25.8) Tax paid ................................................................................................................................................................ (5.7) (20.7) (62.0)
Net cash (used in)/from operating activities ................................................................ (17.2) 14.9 (0.8) Investing activities Payments for purchases of property, plant and equipment ................................................................ (4.0) (14.4) (29.4) Proceeds from sales of property, plant and equipment ................................................................ — 0.1 — Proceeds from investments ................................................................................................................................ 5 425.0 183.5 633.9 Payments for capital increases in subsidiaries ................................................................................................ — — (2.1)
Net cash from investing activities ................................................................................................ 421.0 169.2 602.4 Financing activities Return of capital to shareholders ................................................................................................ (123.4) (181.5) — Payments of expenses related to share capital increase ................................................................ — (6.0) — Share buy-back payments ................................................................................................................................ — — (42.3) Proceeds from shares issued to employees exercising stock options ................................................................ 0.1 4.7 5.7 Dividends paid ................................................................................................................................ 24 — — (102.0) Proceeds from borrowings ................................................................................................................................ 13 123.8 292.2 442.1 Repayment of borrowings ................................................................................................................................ 13 (398.6) (283.0) (887.7) Interest paid ................................................................................................................................ (5.6) (10.5) (17.6)
Net cash used in financing activities ................................................................................................ (403.7) (184.1) (601.8) Net increase/(decrease) in cash and cash equivalents ................................................................ 0.1 — (0.2) Movement in cash and cash equivalents Cash and cash equivalents at 1 January ................................................................................................ 0.3 0.3 0.5 Net increase/(decrease) in cash and cash equivalents ................................................................ 0.1 — (0.2)
Cash and cash equivalents at 31 December ................................................................ 12 0.4 0.3 0.3
(1) The cash flow statement includes the Q1 2012 results of Coca-Cola Hellenic’s Greek Operations sector that was transferred to a wholly-owned subsidiary of Coca-Cola Hellenic on 1 April 2012, as detailed in Note 1.

Notes to the Financial Statements
1. Basis of preparation and accounting policies
Page 7 of 48
Annual Report 2012 Coca-Cola Hellenic
Description of business
Coca-Cola Hellenic Bottling Company S.A. (‘Coca-Cola Hellenic’ or the ‘Company’) is a Société Anonyme (corporation) incorporated in Greece and is engaged as a holding company of various entities operating in the production, sales and distribution of non-alcoholic ready to drink beverages, under franchise from The Coca-Cola Company (‘TCCC’). Coca-Cola Hellenic has operations in 27 countries in Europe and Nigeria also principally engaged in the same activities.
Coca-Cola Hellenic’s shares are listed on the Athens Exchange (symbol: EEEK), with a secondary listing on the London Stock Exchange (symbol: CCB). Coca-Cola Hellenic’s American Depositary Receipts (ADRs) are listed on the New York Stock Exchange (symbol: CCH).
On 28 March 2012, the Board of Directors approved certain changes to Coca-Cola Hellenic’s corporate structure. The changes have been also approved by the shareholders at the Annual General Meeting on 25 June 2012. Under the transaction Coca-Cola Hellenic’s Greek operating assets and liabilities have been transferred to a wholly-owned subsidiary of Coca-Cola Hellenic, namely to Coca-Cola HBC Greece SAIC, in accordance with the provisions of Greek Law 2166/1993. The effective date for the transformation of the balance sheet was 31 March 2012. The approval of the transaction took place on 31July 2012 by the decision EM – 18753/12 of the Greek regulatory Authorities. The changes in the corporate structure which brings the operations in Greece in line with the majority of Group operations in other countries is intended to reduce complexity and not have any impact on Coca-Cola Hellenic’s customers, employees or shareholders. It ensures a clear distinction between Coca-Cola Hellenic, which manages operations in 28 countries, and its operations in Greece, which produces, distributes and sells Coca-Cola Hellenic’s products in Greece.
On 11 October 2012, Coca-Cola HBC AG, a Swiss company incorporated by Kar-Tess Holding, announced a voluntary share exchange offer to acquire all outstanding ordinary registered shares and all American depositary shares of Coca-Cola Hellenic. The transaction is progressing in line with Coca-Cola HBC AG’s most recent announcements and we expect commencement of the acceptance period after publication of Coca-Cola Hellenic’s audited full year 2012 financial statements and completion of the voluntary share exchange offer early in the second quarter of 2013.
These financial statements were approved for issue by the Board of Directors on 1 March 2013 and are expected to be verified at the Annual General Meeting to be held on 12 June 2013.
Basis of preparation
The financial statements included in this document are prepared in accordance with International Financial Reporting Standards (‘IFRS’) issued by the International Accounting Standards Board (‘IASB’) and IFRS as adopted by the European Union (‘EU’).
IFRS as adopted by the EU differs in certain respects from IFRS as issued by the IASB. However, the differences have no significant impact on the Company’s financial statements for the periods present.
The financial statements are prepared under the historical cost convention, as modified by the revaluation of available-for-sale financial assets and derivative financial instruments.
These stand-alone financial statements should be read in conjunction with the consolidated financial statements of Coca-Cola Hellenic and its subsidiaries (collectively ‘the Group’) for the year ended 31 December 2012 prepared in accordance with IFRS.

Notes to the Financial Statements (continued)
1. Basis of preparation and accounting policies (continued)
Page 8 of 48
Annual Report 2012 Coca-Cola Hellenic
Critical accounting judgments and estimates
In conformity with generally accepted accounting principles, the preparation of financial statements for Coca-Cola Hellenic requires management to make estimates and assumptions that affect the reported amounts of assets, liabilities, revenues and expenses, and the disclosure of contingent assets and liabilities in the financial statements and accompanying notes. Although these estimates are based on management’s knowledge of current events and actions that may be undertaken in the future, actual results may ultimately differ from estimates.
Income taxes
The Company is subject to income taxes in Greece. There are many transactions and calculations for which the ultimate tax determination cannot be assessed with certainty in the ordinary course of business. The Company recognises provision for potential liabilities that may arise as a result of tax audit issues based on assessment of the probabilities as to whether additional taxes will be due. Where the final tax outcome on these matters is different from the amounts that were initially recorded, such differences will impact the income tax provision in the period in which such determination is made. The Company does not anticipate the actual final outcome, on the judgment areas, to differ by more than 10% from management’s estimates, in order to require adjustments of the reported income tax liability.
Impairment of goodwill
Determining whether goodwill is impaired requires an estimation of the value-in-use of the cash-generating units to which it has been allocated in order to determine the recoverable amount of the cash generating units. The value-in-use calculation requires the Company to estimate the future cash flows expected to arise from the cash-generating unit and a suitable discount rate in order to calculate present value. These assumptions and a discussion on how they are established are described in Note 3.
Impairment of investments in subsidiaries and joint arrangements
The Company follows the guidance of IAS 36 to determine when an investment in subsidiaries and joint arrangements is impaired. This determination requires significant judgment. In making this judgment, the Company evaluates, among other factors, the extent to which the fair value of an investment is less than its cost; and the financial health of and short term business outlook for the investee, including factors such as industry and sector performance, changes in technology and operational and financing cash flow. Management believes that any reasonably possible change in any of the key assumptions used in determination of the fair values of its investments would not cause the investments carrying amounts to exceed their recoverable amounts.
Employee Benefits—Defined Benefit Pension Plans
The Company provides defined benefit pension plans as an employee benefit. Determining the value of these plans requires several actuarial assumptions and estimates about discount rates, future salary increases and future pension increases. Due to the long-term nature of these plans, such estimates are subject to significant uncertainty. These assumptions and a discussion on how they are established are described in Note 15.
Revenue recognition
Revenues are recognised when all of the following conditions are met: when the amount of revenue can be reliably measured; when it is probable that future economic benefits will flow to the Company and when the significant risks and rewards of ownership of the products have passed to the buyer, usually on delivery of the goods.
Notes to the Financial Statements (continued)
1. Basis of preparation and accounting policies (continued)
Page 9 of 48
Annual Report 2012 Coca-Cola Hellenic
Revenue is measured at the fair value of the consideration received or receivable and is stated net of sales discounts, listing fees and marketing and promotional incentives provided to customers. Listing fees are incentives provided to customers for carrying the Company’s products in their stores. Listing fees that are subject to contract-based term arrangements are capitalized and amortised over the term of the contract as a reduction to revenue. All other listing fees as well as marketing and promotional incentives are a reduction of revenue as incurred. Listing fees recognized as a reduction to revenue during the year ended 31 December 2012, amounted to €16.1m (2011: €96.5m, 2010: €92.7 m). Marketing and promotional incentives provided to customers during 2012 amounted to €5.2m (2011: €15.0m, 2010: €22.6m) net of TCCC support.
Coca-Cola Hellenic receives contributions from TCCC in order to promote sales of brands of The Coca-Cola Company. Contributions for price support, marketing and promotional campaigns in respect of specific customers are recognised as an offset to promotional incentives provided to those customers to which the contributions contractually relate. These contributions are accrued and matched to the expenditure to which they relate. In 2012, such contributions totaled €0.3m (2011: €16.4m, 2010: €23.9m).
Dividend income
Dividend income is recognised in the income statement when the Company’s right to receive the dividend is established.
Management fee income
The Company charges management fees to its subsidiaries for services provided. Income from management fees is recognised in accordance with the substance of the relevant agreement.
Goodwill
Goodwill is the excess of the cost of an acquisition over the fair value of the Company’s share of the net identifiable assets of the acquired subsidiary at the date of acquisition. Goodwill is not amortised but rather tested for impairment annually and whenever there is an indication of impairment. Goodwill is carried at cost less accumulated impairment losses.
For the purpose of impairment testing, goodwill is allocated to the relevant cash-generating units. The cash-generating units to which goodwill has been allocated are tested for impairment annually, or more frequently when there is an indication that the unit may be impaired. If the recoverable (i.e. the higher of the value in use and fair value less costs to sell) amount of the cash-generating unit is less than the carrying amount of the unit, the impairment loss is allocated first to reduce the carrying amount of any goodwill allocated to the unit and then pro-rata to the other assets of the unit on the basis of the carrying amount of each asset in the unit. Impairment losses recognised against goodwill are not reversed in subsequent periods.
Property, plant and equipment
All property, plant and equipment is initially recorded at cost and subsequently measured at cost less accumulated depreciation and impairment losses. Subsequent expenditure is added to the carrying value of the asset when it is probable that future economic benefits, in excess of the original assessed standard of performance of the existing asset, will flow to the operation. All other subsequent expenditure is expensed in the period in which it is incurred. Assets under construction are recorded as part of property, plant and equipment and depreciation on these assets commences when the assets are available for use.

Notes to the Financial Statements (continued)
1. Basis of preparation and accounting policies (continued)
Page 10 of 48
Annual Report 2012 Coca-Cola Hellenic
Depreciation is calculated on a straight-line basis to allocate the depreciable amount over the estimated useful life of the assets as follows:
Freehold buildings ................................................................ 40 years Leasehold buildings and improvements ................................ Over the lease term, up to 40 years Production equipment ........................................................... 4 to 12 years Vehicles ................................................................................ 5 to 8 years Computer hardware and software ......................................... 3 to 7 years Marketing equipment ............................................................ 3 to 7 years Fixtures and fittings .............................................................. 8 years Returnable containers ........................................................... 3 to 12 years
Freehold land is not depreciated as it is considered to have an indefinite life.
Deposits received for returnable containers by customers are accounted for as deposit liabilities.
Residual values and useful lives of assets are reviewed and adjusted if appropriate at each balance sheet date.
An asset’s carrying amount is written down immediately to its recoverable amount if the asset’s carrying amount is greater than its estimated recoverable amount.
Gains and losses on disposals are determined by comparing the proceeds with the carrying amount and are recognized in the income statement.
Impairment of non-financial assets
Goodwill is not amortised but rather tested for impairment annually and whenever there is an indication of impairment. Property, plant and equipment and other non-financial assets that are subject to amortisation are reviewed for impairment whenever events or changes in circumstances indicate that the carrying amount may not be recoverable. An impairment loss is recognised for the amount by which the carrying amount of the asset exceeds its recoverable amount, which is the higher of an asset’s fair value less cost to sell and value-in-use. For the purposes of assessing impairment, assets are grouped at the lowest level of separately identifiable cash flows.
Borrowing costs
Borrowing costs directly attributable to the acquisition, construction or production of qualifying assets, which are assets that necessarily take a substantial period of time to be prepared for their intended use or sale, are added to the cost of those assets, until such time as the assets are substantially ready for their intended use or sale. Investment income earned on the temporary investment of specific borrowing pending their use for qualifying assets is deducted from the borrowing costs eligible for capitalisation.
All other borrowing costs excluding transaction costs on borrowings are expensed as part of finance costs in the period in which they are incurred.
Investments in subsidiaries and joint arrangements
Investments in subsidiaries and joint arrangements are measured at cost less impairment. In addition, following IFRIC 11, Group and Treasury Share Transactions, the charge for stock option related to subsidiaries is passed to the subsidiaries by way of the investment in subsidiaries account.

Notes to the Financial Statements (continued)
1. Basis of preparation and accounting policies (continued)
Page 11 of 48
Annual Report 2012 Coca-Cola Hellenic
Financial assets
The Company classifies its investments in debt and equity securities into the following categories: financial assets at fair value through profit or loss (‘FVTPL’), held-to-maturity and available-for-sale financial assets. The classification depends on the purpose for which the investment was acquired. Management determines the classification of its investments at initial recognition. FVTPL and available-for-sale financial assets are carried at fair value. Investments that are acquired principally for the purpose of generating a profit from short-term fluctuations in price are classified as FVTPL investments and included in current assets. Investments with a fixed maturity that management has the intent and ability to hold to maturity are classified as held-to-maturity and are included in non-current assets, except for those with maturities within twelve months from the balance sheet date, which are classified as current assets. Investments intended to be held for an indefinite period of time, which may be sold in response to needs for liquidity or changes in interest rates, are classified as available-for-sale financial assets; and are classified as non-current assets, unless they are expected to be realised within twelve months of the balance sheet date.
Regular purchases and sales of investments are recognised on the trade date which is the day the Company commits to purchase or sell. The cost of purchase includes transaction costs for investments other than those carried at FVTPL where transaction costs are expensed. For investments traded in active markets, fair value is determined by reference to stock exchange quoted bid prices. For other investments, fair value is estimated by reference to the current market value of similar instruments or by reference to the discounted cash flows of the underlying net assets.
Available-for-sale investments and FVTPL are subsequently carried at fair value.
Gains and losses on investments classified as FVTPL are recognised in the income statement in the period in which they arise. Unrealised gains and losses on available-for-sale financial assets are recognised in other comprehensive income, except for impairment losses and foreign exchange gains and losses on monetary financial assets that are recognised in the income statement, until the financial assets are derecognised, at which time the cumulative gains or losses previously recognised in equity are reclassified to the income statement.
Held-to-maturity investments are carried at amortised cost using the effective interest rate method. Gains and losses on held-to-maturity investments are recognised in the income statement, when the investments are derecognised or impaired.
Non-current assets held for sale
Non-current assets and disposal groups are classified as held for sale if their carrying amount will be principally recovered through a sale transaction rather than through continuing use. This condition is regarded as met only when the sale is highly probable and the asset (or disposal group) is available for immediate sale in its present condition. In order for a sale to be considered highly probable, management must be committed to the sale, an active programme to locate a buyer and complete the plan has been initiated, and the sale is expected to be completed within one year from the date of classification.
Non-current assets and disposal groups classified as held for sale are measured at the lower of the individual assets’ previous carrying amount and their fair value less costs to sell.
Inventories
Inventories are stated at the lower of cost and net realisable value.
Cost is determined using the weighted average method. Cost for work in progress and finished goods, is comprised of the cost of direct materials and labour plus attributable overhead costs. Cost includes all costs incurred to bring the product to its present location and condition.
Net realisable value is the estimated selling price in the ordinary course of business, less the estimated costs to complete and sell the inventory.

Notes to the Financial Statements (continued)
1. Basis of preparation and accounting policies (continued)
Page 12 of 48
Annual Report 2012 Coca-Cola Hellenic
Trade receivables
Trade receivables are initially recognised at fair value and subsequently measured at amortised cost, less provision for doubtful debts. A provision for doubtful debts is established when there is objective evidence that the Company will not be able to collect all amounts due, according to the original terms of the receivables. Significant financial difficulties of the debtor, probability that the debtor will enter into bankruptcy or financial reorganisation, and default or delinquency in payments are considered indicators that the trade receivable could be uncollected. The amount of the provision is the difference between the receivable’s carrying amount and the present value of its estimated future cash flows (excluding future credit losses that have not been incurred), discounted at the original effective interest rate. The carrying amount of the receivable is reduced by the amount of the provision, which is recognised as part of ‘operating expenses’. If a trade receivable ultimate becomes uncollectible, it is written off initially against any provision made in respect of that receivable with any excess recognised as part of operating expenses. Subsequent recoveries of amounts previously written off or provisions no longer required are credited against ‘operating expenses’.
Trade payables
Trade payables are recognised initially at fair value and, subsequently measured at amortised cost using the effective interest rate method.
Foreign currency and translation
The Company’s financial statements are presented in the currency of the primary economic environment in which the entity operates (its functional currency). For the purpose of the financial statements the results and financial position of the Company are expressed in euro, which is the functional currency of Coca-Cola Hellenic and the presentation currency for the financial statements.
Transactions in foreign currencies are recorded at the rate ruling at the date of transaction. Monetary assets and liabilities denominated in foreign currencies are remeasured at the rate of exchange ruling at the balance sheet date. All gains and losses arising on remeasurement are included in income statement, except for exchange differences arising on assets and liabilities classified as cash flow hedges which are deferred in equity until the occurrence of the hedged transaction, at which time they are recognised in the income statement.
The Company has minor foreign exchange transaction exposures where it holds a small amount of monetary assets and liabilities, which are not denominated in its functional currency.
Cash and cash equivalents
Cash and cash equivalents comprise cash balances and highly liquid investments with an original maturity of three months or less. Bank overdrafts are classified as short-term borrowings in the balance sheet and for the purpose of the cash flow statement.
Borrowings
All loans and borrowings are initially recognised at the fair value of the consideration received net of transaction costs incurred.
After initial recognition, all interest-bearing loans and borrowings are subsequently measured at amortised cost. Amortised cost is calculated using the effective interest rate method whereby any discount premium or transaction costs associated with a loan or borrowing is amortised to the income statement over the borrowing period.

Notes to the Financial Statements (continued)
1. Basis of preparation and accounting policies (continued)
Page 13 of 48
Annual Report 2012 Coca-Cola Hellenic
Derivative financial instruments
The Company uses derivative financial instruments, including options, currency and commodity derivatives, to manage interest, currency and commodity price risk associated with the Company’s underlying business activities. The Company does not use its derivative financial instruments for any trading activities.
All derivative financial instruments are initially recognised on the balance sheet at fair value and are subsequently remeasured at their fair value. Changes in the fair value of derivative financial instruments are recognised at each reporting date either in the income statement or in equity, depending on whether the derivative financial instrument qualifies for hedge accounting, and if so, whether it qualifies as a fair value hedge or a cash flow hedge. All derivative financial instruments that are not part of an effective hedging relationship (undesignated hedges) are classified as assets or liabilities at FVTPL.
The Company documents at the inception of hedged transaction the relationship between hedging instruments and hedged items, as well as its risk management objective and strategy for undertaking the hedge transactions. This process includes linking all derivative financial instruments designated as hedging instruments to specific assets, liabilities, firm commitments or forecast transactions. Both at the hedge inception and on an ongoing basis, the Company assesses and documents whether the derivative financial instruments used in hedging transactions are highly effective in offsetting changes in fair values or cash flows of hedged items.
Changes in the fair values of derivative financial instruments, that are designated and qualify as fair value hedges and are effective, are recorded in the income statement, together with the changes in the fair values of the hedged items that relate to the hedged risks. Changes in the fair value of derivative financial instruments that are designated and effective as hedges of future cash flows are recognised directly in other comprehensive income and the ineffective portion is recognised immediately in the income statement. Amounts accumulated in equity are recycled to the income statement as the related asset acquired or liability assumed affects the income statement. Changes in the fair values of derivative financial instruments that do not qualify for hedge accounting are recognised in the income statement as they arise.
Hedge accounting is discontinued when the hedging instrument expires or is sold, terminated, or exercised, or no longer qualifies for hedge accounting. At that time, any cumulative gain or loss on the hedging instrument recognised in equity is retained in equity until the forecasted transaction occurs. If a hedged transaction is no longer expected to occur, the net cumulative gain or loss recognised in equity is transferred to the income statement.
Leases
Leases of property, plant and equipment, where the Company has substantially all the risks and rewards of ownership, are classified as finance leases. Other leases are classified as operating leases.
Rentals paid under operating leases are charged to the income statement on a straight-line basis over the lease term.
Finance leases are capitalised at the inception of the lease at the lower of the fair value of the leased assets and the present value of the minimum lease payments. Each lease payment is allocated between liability and finance charges to achieve a constant rate on the finance balance outstanding. The corresponding lease obligations, net of finance charges, are included in long-term borrowings. The interest element of the finance cost is charged to the income statement over the lease period, so as to produce a constant periodic rate of interest on the remaining balance of the liability for each period.
Property, plant and equipment acquired under finance leases is depreciated over the shorter of the useful life of the asset and the lease term. The useful life for leased assets corresponds with the Company policy for depreciable life of property, plant and equipment.
Provisions
Provisions are recognised when: the Company has a present obligation (legal or constructive) as a result of a past event; when it is probable that an outflow of resources embodying economic benefits will be required to settle the obligation;

Notes to the Financial Statements (continued)
1. Basis of preparation and accounting policies (continued)
Page 14 of 48
Annual Report 2012 Coca-Cola Hellenic
and when a reliable estimate can be made of the amount of the obligation. Where the Company expects a provision to be reimbursed, for example under an insurance contract, the reimbursement is recognised as a separate asset only when such reimbursement is virtually certain. If the effect of the time value of money is material, provisions are determined by discounting the expected future cash flows at a pre-tax rate that reflects current market assessments of the time value of money and the risks specific to the liability. Where discounting is used, the increase in the provision due to the passage of time is recognised as an interest expense.
Offsetting financial instruments
The Company offsets financial assets and financial liabilities to the net amount reported in the balance sheet when it currently has a legally enforceable right to offset the recognised amounts and it intends to settle on a net basis or to realize the asset and settle the liability simultaneously.
Employee benefits
The Company operates two defined benefit plans and a defined contribution pension plan.
The defined benefit plans are made up of a funded pension plan and employee leaving indemnities. The assets of the funded plan are held in a separate trustee-administered fund and are financed by the Company.
The liability recognised in the balance sheet in respect of defined benefit plans is the present value of the defined benefit obligation at the balance sheet date less the fair value of the plan assets.
For defined benefit pension plans, pension costs are assessed using the projected unit credit method. Actuarial gains and losses arising from experience adjustments and changes in actuarial assumptions are charged or credited to equity in other comprehensive income in the period in which they arise. Such actuarial gains and losses are also immediately recognised in retained earnings and are not reclassified to the income statement in subsequent periods. The defined benefit obligations are measured at the present value of the estimated future cash outflows using interest rates of corporate or government bonds, depending on whether or not there is a deep market for corporate bonds in the relevant country, which have terms to maturity approximating the terms of the related liability. Past service cost is recognised immediately in the income statement.
The Company’s contributions to the defined contribution pension plan are charged to the income statement in the period to which the contributions relate.
Employee benefits - long-term incentive plan
The Company operates a long-term incentive plan where employees are entitled to additional cash benefits that have a vesting period of three years. The cost of the benefits is recording in the income statement over the vesting period.
Share-based payments
Coca-Cola Hellenic issues equity-settled (stock options) and cash-settled (stock appreciation rights) share-based payments to its senior managers.
Equity- settled share-based payments are measured at fair value at the date of grant using a binomial stock option valuation model. Fair value reflects the parameters of the compensation plan, the risk-free interest rate, the expected volatility, the dividend yield and the early exercise experience of the Company’s plans. Expected volatility is determined by calculating the historical volatility of Coca-Cola Hellenic’s share price over previous years. The fair value determined at the grant date of the equity-settled share-based payments is expensed on a straight-line basis over the vesting period.

Notes to the Financial Statements (continued)
1. Basis of preparation and accounting policies (continued)
Page 15 of 48
Annual Report 2012 Coca-Cola Hellenic
For cash-settled share-based payments, a liability equal to the portion of the vested stock appreciation rights is recognised at the current fair value determined at each balance sheet date using the same model and inputs as used for determining fair value of stock options.
In addition, the Company operates a stock purchase plan, an equity compensation in which eligible employees can participate. The Company makes contributions to a trust for participating employees and recognises expense to the income statement over the vesting period of the contributed shares. Any unvested shares held by the trust are owned by the Company and are recorded at cost on the balance sheet within equity as shares held for equity compensation plan until they vest.
Termination benefits
Termination benefits are payable whenever an employee’s employment is terminated before the normal retirement date or whenever an employee accepts voluntary redundancy in exchange for these benefits. The Company recognises termination benefits at the earlier of the following dates: a) when the Company can no longer withdraw the offer of those benefits and b) when the Company recognises costs for restructuring that is within the scope of IAS 37 Provisions, Contingent Liabilities and Contingent Assets and involves the payment of termination benefits. In the case of an offer made to encourage voluntary redundancy, the termination benefits are measures based on the number of employees expected to accept the offer.
Taxes
The current income tax charge is calculated on the basis of the tax laws enacted or substantively enacted at the balance sheet date. Management periodically evaluates positions taken in tax returns with respect to situations in which applicable tax regulations are subject to interpretation and establishes provisions where appropriate on the basis of amounts expected to be paid to the tax authorities.
Deferred tax is provided using the liability method for all temporary differences arising between the tax bases of assets and liabilities and their carrying values for financial reporting purposes. However, the deferred tax liabilities are not recognised if they arise from the initial recognition of goodwill; deferred tax is not accounted for if it arises from initial recognition of an asset or liability in a transaction other than a business combination that at the time of the transaction affects neither accounting nor taxable profit or loss. Tax rates enacted or substantially enacted at the balance sheet date are those that are expected to apply when the deferred tax asset is realised or deferred tax liability is settled.
Deferred tax assets are recognised to the extent that it is probable that future taxable profit will be available against which the temporary differences can be utilised.
Deferred tax is provided on temporary differences arising on investments in subsidiaries and joint arrangements, except where the timing of the reversal of the temporary difference can be controlled by the Company, and it is probable that the temporary difference will not reverse in the foreseeable future.
Tax is recognised in the income statement, except to the extent that it relates to items recognised in other comprehensive income or in equity. In this case the tax is also recognised in other comprehensive income or directly in equity respectively.
Deferred tax assets and deferred tax liabilities are offset if a legally enforceable right exists to set off current tax assets against current income tax liabilities and the deferred taxes relate to the same taxation authority.
Franchise incentive arrangements
TCCC, at its sole discretion, provides the Company with various incentives, including contributions toward the purchase of cold drink equipment. The terms and conditions of these arrangements require reimbursement if certain conditions stipulated in the agreements are not met, including minimum volume through-put requirements. Support payments received from TCCC for the placement of cold drink equipment are deducted from the cost of the related asset.

Notes to the Financial Statements (continued)
1. Basis of preparation and accounting policies (continued)
Page 16 of 48
Annual Report 2012 Coca-Cola Hellenic
Share capital
There is only one class of shares, ordinary shares. When new shares are issued, they are recorded in share capital at their par value. The excess of the issue price over the par value is recorded to the share premium reserve.
Incremental external costs directly attributable to the issue of new shares or to the process of returning capital to shareholders are recorded in equity as a deduction, net of tax, in the share premium reserve.
The consideration paid for the purchases of the company’s equity share capital (treasury shares), including any directly attributable incremental costs (net of income taxes) is deducted from equity attributable to the company’s equity holders until the shares are cancelled or reissued. Where such shares are subsequently reissued, any consideration received, net of any directly attributable incremental transaction costs and the related income tax effects, is included in equity attributable to the company’s equity holders.
Dividends
Dividends are recorded in the Company’s financial statements in the period in which they are approved by the Company’s shareholders, with the exception of the statutory minimum dividend.
Under Greek corporate legislation, companies are annually required to declare dividends of at least 35% of unconsolidated adjusted after-tax IFRS profits. This statutory minimum dividend is recognised as a liability at the balance sheet date.
Comparative figures
Comparative figures have been reclassified and adjusted where necessary to conform with changes in presentation in the current year and account for the change in pension accounting discussed below.
Changes in accounting policy
In 2012 the Company has early adopted IFRS 12 Disclosures of Interests in Other Entities and IAS 27 Separate Financial Statement.
At the same time, the Company has early adopted the revised IAS 19 Employee Benefits. This resulted in the Company changing its accounting policy for defined benefit plans. Under the revised IAS 19, past service costs are recognized immediately in the income statement and the expected return on plan assets is calculated using the same interest rate as applied for the purpose of discounting the benefit obligation.
The Company has also early adopted the IAS 1 Presentation of Items of Other Comprehensive income - Amendments to IAS 1 Presentation of Financial Statements. The amendments change the grouping of items presented in other comprehensive income between items that may be reclassified to the income statement at a future point in time and those that will not be reclassified.
The Company has applied the above mentioned changes in accounting policies at the beginning of the earliest period presented in accordance with transitional provisions of the amended standards. The impact from the adoption of IAS 19 revised was €0.5m (2011: nil, 2010: nil). Adoption of the other standards did not have any effect in the Company’s financial statements

Notes to the Financial Statements (continued)
1. Basis of preparation and accounting policies (continued)
Page 17 of 48
Annual Report 2012 Coca-Cola Hellenic
Accounting pronouncements adopted in 2012
In the current period, the Company has adopted all of the new and revised standards and interpretations which were issued by the IASB and the International Financial Reporting Interpretations Committee (‘IFRIC’) of the IASB, that are relevant to its operations and effective for accounting periods beginning on 1 January 2012. None of these standards and interpretations had a significant effect on the financial statements of the Company. The revised standards and interpretations are as follows:
Amendment to IFRS 7, Financial Instruments: Disclosures - The amendments require additional disclosures of the full or partial derecognition of financial assets that are transferred to a counterparty under certain conditions.
Accounting pronouncements not yet adopted
At the date of approval of these financial statements, the following standards and interpretations relevant to the Company’s operations were issued but not yet effective and not early adopted:
IFRS 9, Financial Instruments addresses the classification, measurement and recognition of financial assets and liabilities. IFRS 9 was issued in November 2009 and October 2010 and it replaces parts of IAS 39, Financial Instruments: Recognition and Measurement that relate to the classification and measurement of financial instruments. The standard introduces new requirements for classifying and measuring financial assets and eliminates the available-for-sale and held-to-maturity categories. It separates financial assets into two categories; those measured at amortised cost and those measured at fair value. For financial liabilities the standard retains most of the IAS 39 requirements, the main change is that, in cases where the fair value option is taken for financial liabilities, the part of a fair value change due to an entity’s own credit risk is recorded in other comprehensive income rather than the income statement, unless this creates an accounting mismatch. IFRS 9 will be effective for annual periods beginning on or after 1 January 2015. The standard has not yet been adopted by the EU. The Company is currently evaluating the impact this standard will have on its financial statements.
In May 2011 the IASB issued IFRS 13 Fair Value Measurement which is effective for annual periods beginning on or after 1 January 2013. The new standard defines fair value and establishes a single framework for measuring fair value where that is required by other standards and introduces consistent requirements for disclosures on fair value measurements. The standard applies to both financial and non-financial assets and liabilities which are measured at fair value. The Company is currently evaluating the impact this standard will have on its financial statements.
In December 2011 the IASB issued an amendment to IFRS 7 Financial Instruments: Disclosures—Offsetting Financial Assets and Financial Liabilities which is effective for annual reporting periods beginning on or after 1 January, 2013. The new disclosures will require entities to disclose gross amounts subject to rights of set-off, amounts set off in accordance with the accounting standards, and the related net credit exposure. The amendment will not have a significant impact on the Company’s financial statements.
In December 2011 the IASB issued an amendment of IAS 32 Financial Instruments: Presentation which is effective
for annual reporting periods beginning on or after 1 January 2014. This amendment to the application guidance in IAS 32 clarifies some of the requirements for offsetting financial assets and financial liabilities on the statement of financial position. The Company is currently evaluating the impact the amendments will have on its financial statements.
In May 2012 the IASB issued its annual improvements to IFRS (2009-2011cycle). The effective date of the amendments is 1 January 2013. The Company is currently evaluating the impact the amendments will have on its financial statements. The amendments, which have not yet been adopted by the EU, are outlined below:
Amendment to IAS 1 Presentation of Financial Statements - Clarification of the requirements for comparative information: The amendment clarifies the difference between voluntary additional comparative information and the minimum required comparative information. Generally, the minimum required comparative period is the previous period. An entity must include comparative information in the related notes to the financial statements when it voluntarily provides comparative information beyond the minimum required comparative period. The additional comparative period does not need to contain a complete set of financial statements. In addition, the opening

Notes to the Financial Statements (continued)
1. Basis of preparation and accounting policies (continued)
Page 18 of 48
Annual Report 2012 Coca-Cola Hellenic
statement of financial position (known as the third balance sheet) must be presented in the following circumstances: when an entity changes its accounting policies; makes retrospective restatements or makes reclassifications, and that change has a material effect on the statement of financial position. The opening statement would be at the beginning of the preceding period. For example, the beginning of the preceding period for a 31 December 2014 year-end would be 1 January 2013. However, unlike the voluntary comparative information, the related notes are not required to accompany the third balance sheet. IAS 16 Property, Plant and Equipment - Classification of servicing equipment: The amendment clarifies that major spare parts and servicing equipment that meet the definition of property, plant and equipment are not inventory.
IAS 32 Financial Instruments: Presentation - Tax effect of distributions to holders of equity instruments: The amendment clarifies that income taxes arising from distributions to equity holders are accounted for in accordance with IAS 12 Income Taxes. The amendment removes existing income tax requirements from IAS 32 and requires entities to apply the requirements in IAS 12 to any income tax arising from distributions to equity holders.
IAS 34 Interim Financial Reporting - Interim financial reporting and segment information for total assets and liabilities. The amendment clarifies the requirements in IAS 34 relating to segment information for total assets and liabilities for each reportable segment to enhance consistency with the requirements in IFRS 8 Operating Segments. Total assets and liabilities for a particular reportable segment need to be disclosed only when the amounts are regularly provided to the chief operating decision maker and there has been a material change in the total amount disclosed in the entity’s previous annual financial statements for that reportable segment.
Notes to the Financial Statements (continued)
Page 19 of 48
Annual Report 2011 Coca-Cola Hellenic
2. Segmental Analysis
The Company has one business, being the holding company of companies with activities in the production, sale and distribution of non-alcoholic, ready-to-drink beverages, and operates as one geographical segment.
3. Goodwill
Goodwill arose in the Company as a result of its merger with two subsidiaries, PET Plastics S.A. and Cretan Bottling Company in 1997 and 2002 respectively. Due to the spin-off of the Greek Operations sector the balance of goodwill at 31 December 2012 is nil (refer to Note 1).
2012
€ million 2011
€ million Cost & Net book value As at 1 January ................................................................................................................................................................ 7.5 7.5
Spin-off of Greek Operations sector (refer to Note 1) ................................................................................................ (7.5) — As at 31 December ................................................................................................................................ — 7.5
The Company conducted a test for impairment of goodwill during 2011 in accordance with IAS 36 Impairment of
Assets annually and whenever there was an indication of impairment. No impairment was indicated from the impairment tests of 2011. For impairment testing purposes the Company is considered as one cash-generating unit.
The recoverable amount of the operation had been determined through a value-in-use calculation. That calculation used cash flow projections based on financial budgets approved by the Board of Directors covering a three-year period. Due to the nature of the Company’s main business activities, cash flow projections had been extended over ten years. Cash flow projections for years four to ten have been projected by management based on operation and market specific high-level assumptions including growth rates, discount rates, forecasted selling prices and direct cost. Cash flows beyond the ten year period (the period in perpetuity) had been extrapolated during 2011, using an estimated growth rate in perpetuity of 2.0%. Other key assumptions used during 2011 were an average gross margin of 40.5% and a discount rate of 19.8%.
Management determined gross margin based on past performance, expectations for the development of the market and expectations about raw material costs. The growth rate used in perpetuity reflected the forecasts in line with management beliefs. These forecasts exceeded, in some cases, those expected for the industry in general, due to the strength of our brand portfolio. Management estimated discount rates using rates that reflected current market assessments of the time value of money and risks specific to Greece.

Notes to the Financial Statements (continued)
Page 20 of 48
Annual Report 2012 Coca-Cola Hellenic
4. Property, plant and equipment
Land and Plant and Returnable Assets under buildings equipment containers construction Total € million € million € million € million € million
Cost As at 1 January 2012 ................................................................ 82.5 327.1 21.7 5.0 436.3 Additions ................................................................................................ — 1.0 0.5 5.7 7.2 Disposals and write offs ................................................................ — (0.3) (1.0) — (1.3) Spin-off of Greek Operations sector (refer to Note 1)....... (79.2) (324.6) (21.2) (7.9) (432.9) Reclassifications ................................................................ 0.8 1.8 — (2.6) — As at 31 December 2012 ................................................................ 4.1 5.0 — 0.2 9.3 Depreciation and impairment
As at 1 January 2012 ................................................................ 31.4 245.5
10.1 — 287.0 Charge for the year ................................................................ 0.4 6.0 0.9 — 7.3 Disposals and write offs ................................................................ — (0.2) (1.0) — (1.2) Spin-off of Greek Operations sector (refer to Note 1) ................................ (28.9) (247.5) (10.0) — (286.4) As at 31 December 2012 ................................................................ 2.9 3.8 — — 6.7 Net book value as at 1 January 2012 ................................................................ 51.1 81.6 11.6 5.0 149.3
Net book value as at 31 December 2012 ................................ 1.2 1.2 — 0.2 2.6
Cost As at 1 January 2011 ................................................................ 80.6 319.9 22.7 3.7 426.9 Additions ................................................................................................ — 7.4 0.4 8.2 16.0 Disposals and write offs ................................................................ — (5.2) (1.4) — (6.6) Reclassifications ................................................................ 1.9 5.0 — (6.9) — As at 31 December 2011 ................................................................ 82.5 327.1 21.7 5.0 436.3 Depreciation and impairment As at 1 January 2011 ................................................................ 30.1 222.5 7.5 — 260.1 Charge for the year ................................................................ 1.3 23.7 1.6 — 26.6 Impairment ................................................................................................ — 5.2 2.4 — 7.6 Disposals and write offs ................................................................ — (5.9) (1.4) — (7.3) As at 31 December 2011 ................................................................ 31.4 245.5 10.1 — 287.0
Net book value as at 1 January 2011 ................................................................ 50.5 97.4 15.2 3.7 166.8 Net book value as at 31 December 2011 ................................ 51.1 81.6 11.6 5.0 149.3 Assets under construction at 31 December 2012 include advances for equipment purchases of nil (2011: €1.6m). Impairment of plant and equipment of €5.2m and of returnable containers €2.4m during 2011 relates to restructuring initiatives of the Company.

Notes to the Financial Statements (continued)
Page 21 of 48
Annual Report 2012 Coca-Cola Hellenic
5. Investments in subsidiaries and joint arrangements The effective interest held in and the carrying value of the investments in subsidiaries and joint arrangements at 31 December are:
Effective Effective Carrying Carrying
interest interest value value
Country of held held 2012 2011
incorporation 2012 2011 € million € million
Brewinvest S.A. ..................................................... Greece 50% 50% 0.3 0.3 Coca-Cola HBC Greece SAIC ............................... Greece 100% 100% 134.2 14.1 Tsakiris S.A. .......................................................... Greece 100% 100% 16.1 16.1 3E (Cyprus) Ltd ..................................................... Cyprus 100% 100% 1,071.0 1,493.6
Total investments in subsidiaries and joint arrangements ................................................................ 1,221.6 1,524.1 The above list contains direct investments in subsidiaries and joint arrangements only. Refer to Notes 30 and 31 for a list of the principal direct and indirect interests in subsidiaries and joint arrangements.
Changes in the carrying amounts of investment in subsidiaries and joint arrangements were as follows:
2012
€ million 2011
€ million
As at 1 January .............................................................................................................................. 1,524.1 1,704.9 Increase of investment .................................................................................................................. 120.1 — Return of share capital .................................................................................................................. (425.0) (183.5) Increase in stock options attributable to subsidiaries .................................................................... 2.4 2.7 As at 31 December ................................................................................................................................ 1,221.6 1,524.1 During 2012, 3E (Cyprus) Ltd. returned €425.0m (2011: €183.5m) to the Company as a result of the reduction in its share capital. As a result of the spin-off of the Greek Operations sector to the wholly owned subsidiary Coca-Cola HBC Greece SAIC, investments of Coca-Cola Hellenic increased by €120.1m.
6. Available-for-sale financial assets
Movements in available-for-sale financial assets are as follows:
2012 2011 € million € million
As at 1 January .................................................................................................................................... 0.6 1.0
Purchases ............................................................................................................................................ 0.2 —
Unrealised gains/(losses) taken to other comprehensive income ........................................................ 0.3 (0.4)
As at 31 December ................................................................................................................................ 1.1 0.6
Available-for-sale financial assets relate to listed equities €0.9m (2011: €0.5m) and other unlisted equities of €0.2m (2011: €0.1m). The fair values of available-for-sale financial assets are based on quoted market prices, where available, or discounted cash flow projections where quoted market prices are unavailable.

Notes to the Financial Statements (continued)
Page 22 of 48
Annual Report 2012 Coca-Cola Hellenic
7. Financial instruments
Categories of financial instruments at 31 December were as follows:
2012
Loan and Available-
receivables for-sale Total
Assets € million € million € million
Investments ................................................................ — 1.1
1.1 Trade and other receivables ................................ 10.8 — 10.8 Cash and cash equivalents ................................ 0.4 — 0.4 Total ................................................................ 11.2 1.1 12.3 Liabilities
held at
amortised cost Total Liabilities € million € million
Trade and other payables ................................................................ 12.0 12.0 Borrowings ................................................................................................ 12.1 12.1 Total ................................................................................................ 24.1 24.1 2011 Loan and Available- receivables for-sale Total Assets € million € million € million
Investments ................................................................ — 0.6 0.6 Trade and other receivables ................................ 166.7 — 166.7 Cash and cash equivalents ................................ 0.3 — 0.3 Total ................................................................ 167.0 0.6 167.6
Liabilities
held at
amortised
cost Total
Liabilities € million € million
Trade and other payables ................................................................ 104.2 104.2 Borrowings ................................................................................................ 390.5 390.5 Total ................................................................................................ 494.7 494.7 With respect to derivative financial instruments, credit risk arises from the potential failure of counterparties to meet their obligations under the contract or arrangement. The Company does not have any derivative financial instruments.
Forward foreign exchange contracts
The notional principal amounts of the outstanding forward foreign exchange contracts at 31 December 2012 totalled nil (2011: €1.5m).

Notes to the Financial Statements (continued)
Page 23 of 48
Annual Report 2012 Coca-Cola Hellenic
8. Deferred tax
Deferred tax assets and liabilities are offset when there is a legally enforceable right to offset current tax assets against current tax liabilities and when the deferred taxes relate to the same fiscal authority. The following amounts, determined after appropriate off-setting, are shown in the balance sheet:
2012 2011 2010 € million € million € million
Deferred tax assets: To be recovered after more than 12 months ................................................................ 3.4 5.3 6.6 To be recovered within 12 months ................................................................................................ 0.8 12.8 9.3
4.2 18.1 15.9 2012 2011 2010 Deferred tax liabilities: € million € million € million
To be settled after more than 12 months ................................................................................................ (1.3) (2.9) (4.2) To be settled within 12 months ................................................................................................ (0.2) — —
(1.5) (2.9) (4.2)
Deferred tax assets (net) ................................................................................................ 2.7 15.2 11.7 The movements in deferred tax assets and liabilities during the year, after offsetting balances within the same tax jurisdiction, are as follows:
2012 2011 2010 € million € million € million
As at 1 January ................................................................................................................................ 15.2 11.7 13.9 Tax (charge)/credited to the income statement ................................................................ (1.5) 2.5 (1.0) Tax credited to equity ................................................................................................................................ 1.2 1.0 (1.2) Spin-off of Greek Operations sector (refer to Note 1) ................................................................ (12.2) — — As at 31 December ................................................................................................................................ 2.7 15.2 11.7
The movements in deferred tax assets and liabilities, at 31 December are as follows:
Tax in excess Capital
of book Other current investments
depreciation assets incentives Other Total
Deferred tax liabilities € million € million € million € million € million
As at 1 January 2011 ................................ (2.1) — (2.1) — (4.2) Tax charge to the income statement ................................................................ (0.1) — — —
(0.1)
Transfers between deferred tax assets and liabilities ................................ — — — 1.4
1.4
As at 31 December 2011 ................................ (2.2) — (2.1) 1.4 (2.9) Transfers between deferred tax assets and liabilities ................................ 2.2 5.8 — (1.4)
6.6
Spin-off of Greek Operations sector (refer to Note 1) ................................ — (6.0) 0.8 —
(5.2)
As at 31 December 2012 ................................ —
(0.2) (1.3) —
(1.5)

Notes to the Financial Statements (continued)
Page 24 of 48
Annual Report 2012 Coca-Cola Hellenic
8. Deferred tax (continued) Tax losses Other Other Tax in excess
carried current current of book forward Provisions liabilities assets Other depreciation Total Deferred tax assets € million € million € million € million € million € million € million As at 1 January 2011 ................................ — 6.6 4.1 5.2 — — 15.9
Tax credited/(charge) to the income statement ................................
1.5
(0.9)
1.4
0.6 — — 2.6
Taken to equity ................................ — (0.4) — — 1.4 — 1.0
Transfers between deferred tax assets and liabilities ................................ —
— — — (1.4) — (1.4)
As at 31 December 2011 ................................ 1.5 5.3 5.5 5.8 — — 18.1
Tax credited/(charge) to the income statement ................................
(0.6) (0.4)
(0.4) — — (0.1) (1.5)
Taken to equity ................................ — 1.2 — — — — 1.2
Transfers between deferred tax assets and liabilities ................................ — — — (5.8) 1.4 (2.2) (6.6)
Spin-off of Greek Operations sector (refer to Note 1) ................................................................ — (4.7) (4.3) — — 2.0 (7.0)
As at 31 December 2012 ................................
0.9
1.4
0.8 — 1.4 (0.3) 4.2 9. Inventories
Inventories consisted of the following at 31 December: 2012 2011 € million € million
Finished goods ................................................................................................................................................................ — 11.0 Raw materials and work in progress ................................................................................................................................ — 11.9 Consumables ................................................................................................................................................................ — 3.7 Total inventories ................................................................................................................................................................ — 26.6 The amount of inventories recognized as an expense during 2012 was €50.8m (2011: €262.5m, 2010: €264.0m). During 2012 provision of obsolete inventories recognised as an expense amounted to €1.8m (2011: €1.3m, 2010: €0.4m), whereas provision reversed in the period amounted to nil (2011: nil, 2010: €0.4m). 10. Trade receivables
Trade receivables consisted of the following at 31 December: 2012 2011 € million € million
Trade receivables ................................................................................................................................................................ 0.5 164.3 Less: Provision for doubtful debts ................................................................................................................................ — (35.4)
Total trade receivables ................................................................................................................................ 0.5 128.9 The credit period given to customers ranges from 7 days to 60 days depending on the customer type. Interest is not charged for late payment.

Notes to the Financial Statements (continued)
Page 25 of 48
Annual Report 2012 Coca-Cola Hellenic
10. Trade receivables (continued) The Company provides for all receivables that are considered non-collectible on a specific basis after considering the circumstances of each case. Before accepting any new credit customers, the Company investigates the potential customer’s credit quality (through external agents) and defines credit limits for each customer. Customers are reviewed on an ongoing basis and credit limits adjusted accordingly. During 2012, the total receivable from Partner Ballkanik amounted to €0.4m and represented more than 5% of the trade receivables for the Company (2011: €10.0m related to Carrefour). The Company's exposure to credit risk is managed by established policies and procedures regarding financial risk management as described in Note 25. The trade receivables are as follows:
2012 2011
€ million € million
Due within due date ................................................................................................................................ 0.4 99.0 Past due ................................................................................................................................................................ 0.1 65.3 Less: Provision for doubtful debts past due ................................................................................................ — (35.4)
Total trade receivables ................................................................................................................................ 0.5 128.9 As at 31 December 2012, the Company held collateral, in the form of mortgages, bank guarantees, as security against trade receivables with a carrying amount of nil (2011: €14.9m).
As at 31 December 2012, trade receivables of €0.1m (2011: €29.9m) were past due but not impaired. The ageing analysis of these trade receivables is as follows: 2012 2011
€ million € million
Up to 3 months ................................................................................................................................................................ — 19.5 3 to 6 months ................................................................................................................................................................ 0.1 3.5 6 to 9 months ................................................................................................................................................................ — 1.5 More than 9 months ................................................................................................................................ — 5.4
0.1 29.9 As at 31 December 2012, trade receivables of nil (2011: €35.4m) were past due and impaired or provided for. The amount of the provision was nil (2011: €35.4m). The ageing analysis of these receivables is as follows: 2012 2011
€ million € million
Up to 3 months ................................................................................................................................................................ — 9.3 3 to 6 months ................................................................................................................................................................ — 0.2 6 to 9 months ................................................................................................................................................................ — 0.2 More than 9 months ................................................................................................................................ — 25.7
— 35.4 The movement in the provision for doubtful debts during the year is as follows: 2012 2011 2010
€ million € million € million
As at 1 January ................................................................................................................................ (35.4) (26.5) (21.6) Amounts written off during the year.................................................................................. — 0.1 1.2 Increase in allowance recognised in the income statement ............................................... (1.2) (9.0) (6.1) Spin-off of Greek Operations sector (refer to Note 1) ................................................................ 36.6 — —
As at 31 December ................................................................................................................................ — (35.4) (26.5) The recording and release of provision for impaired receivables are recorded within operating expenses.

Notes to the Financial Statements (continued)
Page 26 of 48
Annual Report 2012 Coca-Cola Hellenic
11. Other receivables
Other receivables consisted of the following at 31 December:
2012 2011 € million € million
Prepayments ................................................................................................................................................................ 0.4 1.8 Receivables from subsidiaries (Note 29) ................................................................................................ 10.1 20.5 Receivables from related parties (Note 29) ................................................................................................ — 12.1 Other ................................................................................................................................................................ 0.3 6.0
Total other receivables ................................................................................................................................ 10.8 40.4 The receivables from subsidiaries and related parties, net of the provision for doubtful debts, are as follows:
2012 2011
€ million € million
Due within due date ................................................................................................................................ 9.9 30.2 Past due ................................................................................................................................................................ 0.2 2.4 Total receivables from subsidiaries and related parties 10.1 32.6 As at 31 December 2012, subsidiaries and related parties receivables of €0.2m (2011: €2.4m) were past due but not impaired, due to the fact that the amounts are considered recoverable. The ageing analysis of these related party receivables is as follows:
2012 2011
€ million € million
Up to 3 months ................................................................................................................................................................ 0.2 0.9 3 to 6 months ................................................................................................................................................................ — 0.6 6 to 9 months ................................................................................................................................................................ — 0.1 More than 9 months ................................................................................................................................ — 0.8 0.2
0.2 2.4
12. Cash and cash equivalents
Cash and cash equivalents of €0.4m and €0.3m at 31 December 2012 and 2011 respectively, comprise of cash at bank and in hand. All cash and cash equivalents are held in euro.

Notes to the Financial Statements (continued)
Page 27 of 48
Annual Report 2012 Coca-Cola Hellenic
13. Borrowings The Company held the following borrowings at 31 December:
2012 2011
€ million € million
Short-term borrowings from subsidiaries ................................................................................................ 12.1 5.8
Total borrowings falling due within one year ................................................................................................ 12.1 5.8
Long-term borrowings from subsidiaries ................................................................................................ — 384.7
Total borrowings falling due after one year ................................................................................................ — 384.7
Total borrowings ................................................................................................................................ 12.1 390.5 The short-term and long-term notes of the Company were transferred to the Greek Operations sector after the spin-off (refer to Note 1).
Borrowings from subsidiaries in 2011 comprised of three loans with Coca-Cola HBC Finance plc, an indirect subsidiary of the Company and are denominated in Euro.
The long-term loan of €305.9m, which was renewed on 23 November 2011, was repayable on 31 December 2017. This loan carried an interest rate of 3-month EURIBOR plus 0.20% until 25 December 2009, and from then on the loan carried an interest rate of 6-month EURIBOR plus 0.75%. From January 2011 this loan carried the average quarterly borrowing cost of the lender Q1: 4.06%, Q2: 3.85%, Q3: 2.66%, Q4: 4.16%. For Q1 2012 the relevant interest rate was 4.15%. An amount of €225.0m was repaid in Q1 2012 and the remaining amount of the loan was transferred to the Greek Operations sector after the spin-off (refer to Note 1).
In addition, during 2011 a long-term loan of €74.7m was issued on 8 December 2009, the first withdrawal took place in June 2010, it was renewed on 23 November 2011 and was repayable on 31 December 2017. This loan carried the average quarterly borrowing cost of the lender Q1: 4.06%, Q2: 3.85%, Q3: 2.66%, Q4: 4.16%. In Q1 2012 the loan was fully repaid. In Q1 2012 the relevant interest cost was 4.15%.
The long-term borrowings from subsidiaries in 2011 of €384.7m include €4.1m accrued interest on the above loans.
Also in 2011, a short-term loan amounting to €5.7m carried an interest rate of LIBOR plus 0.25%. The loan balance of 2011 was fully repaid in Q1 2012. The new balance of the loan formed as at 30 March 2012 was transferred to the Greek Operations sector after the spin-off. In addition during 2012 a short term loan of €12.0m (2011: nil) was received from a loan agreement issued on 15 April 2009 and is repayable on 31 December 2013. This loan carries the average quarterly borrowing cost of the lender Q3: 3.60%, Q4: 3.58%.
The accrued interest for the short-term loan is €0.1m in 2012 (2011: €0.1m).
During 2012, the total repayments of borrowings amounted to €398.6m (2011: €283.0m, 2010: €887.7m), and total proceeds amounted to €123.8m (2011: €292.2m, 2010: €442.1m).
The weighted average interest rate on borrowings from subsidiaries in 2012 is 3.91% (2011: 3.56%, 2010: 3.53%).
Short term and long term borrowings fair value equals carrying value.
The exposure of the company’s borrowings to interest rate changes and the contractual re-pricing dates at the end of the reporting period were as follows:
2012 2011 € million € million
6 months or less ................................................................................................................................................................ 12.1 390.5

Notes to the Financial Statements (continued)
Page 28 of 48
Annual Report 2012 Coca-Cola Hellenic
14. Trade and other payables Trade and other payables consisted of the following at 31 December:
2012 2011 € million € million
Trade payables ................................................................................................................................................................ 2.8 22.6 Accrued liabilities ................................................................................................................................................................ 4.1 48.5 Payables to related parties (refer to Note 29) ................................................................................................ — 7.5 Payables to subsidiaries (refer to Note 29) ................................................................................................ 0.2 1.9 Deposit liabilities ................................................................................................................................................................ — 6.7 Other tax and social security liabilities ................................................................................................................................ 0.9 6.7 Salaries and employee related payable ................................................................................................................................ 0.5 6.2 Current portion of employee benefit provision (refer to Note 15) ................................................................ 3.3 7.7 Dividends payables ................................................................................................................................ 0.1 0.1 Deferred income ................................................................................................................................................................ — 7.6 Other payables ................................................................................................................................................................ 1.0 4.1
Total trade and other payables ................................................................................................................................ 12.9 119.6
15. Employee benefits Employee benefits consisted of the following at 31 December: 2012 2011 € million € million
Defined benefit plans Employee leaving indemnities ................................................................................................................................ 4.1 24.9 Pension plans ................................................................................................................................................................ 0.1 (0.1) Total defined benefits plans ................................................................................................................................ 4.2 24.8 Other employee benefits Long term incentive plan ................................................................................................................................2.6 1.9 Other employee benefits ................................................................................................................................ 3.3 7.7 Total other employee benefits ................................................................................................................................5.9 9.6 Total employee benefits obligations ................................................................................................ 10.1 34.4 Employee benefit obligations at 31 December are split between current and non-current as follows:
2012 2011
€ million € million
Current ................................................................................................................................................................3.3 7.7 Non-current ................................................................................................................................................................6.8 26.7 Total employee benefits obligations ................................................................................................ 10.1 34.4
Employees of Coca-Cola Hellenic are entitled to employee leaving indemnities, generally based on each employee’s length of service, employment category and remuneration. Coca-Cola Hellenic also sponsors a defined benefit pension plan.

Notes to the Financial Statements (continued)
Page 29 of 48
Annual Report 2012 Coca-Cola Hellenic
15. Employee benefits (continued) Reconciliation of defined benefit obligations:
2012 2011 € million € million
Present value of defined benefit obligation at 1 January ................................................................................................ 26.1 32.4 Current service cost ................................................................................................................................ 0.7 1.9 Interest cost ................................................................................................................................................................ 0.4 1.5 Curtailment/settlement ................................................................................................................................ 1.1 2.7 Benefits paid ................................................................................................................................................................ (3.4) (10.3) Remeasurements: -Loss from change in financial assumptions......................................................................................... 3.7 (1.9) -Experience adjustments....................................................................................................................... (0.3) (0.2) Past service cost.................................................................................................................................... (0.5) — Adjustment due to spin-off of Greek Operations sector (refer to Note 1)............................................ (22.9) —
Present value of defined benefit obligation at 31 December ................................................................ 4.9 26.1 Reconciliation of plan assets:
2012 2011
€ million € million
Fair value of plan assets at 1 January ................................................................................................................................ 1.3 2.0 Interest income on plan assets .................................................................................................................... — 0.1 Actual employer’s contributions ................................................................................................................................ — 0.1 Actual benefits paid ................................................................................................................................ (0.6) (0.9)
Fair value of plan assets at 31 December ................................................................................................ 0.7 1.3
The present value and funded status of defined benefit obligations were as follows at 31 December:
2012 2011
€ million € million Deficit of funded plan ................................................................................................................................................................ 0.8 1.2 Fair value of plan assets ................................................................................................................................ (0.7) (1.3)
0.1 (0.1) Present value of unfunded defined benefit obligation ................................................................................................ 4.1 24.9 Defined benefit obligations ................................................................................................................................ 4.2 24.8

Notes to the Financial Statements (continued)
Page 30 of 48
Annual Report 2012 Coca-Cola Hellenic
15. Employee benefits (continued) The movement in the defined benefit obligation recognised on the balance sheet was as follows:
2012 2011
€ million € million
Defined benefit obligation as at 1 January ................................................................................................ 24.8 30.3 Expense recognised in the income statement ................................................................................................ 1.7 6.1 Employer contributions ................................................................................................................................ — (0.1) Benefits paid .......................................................................................................................... (2.8) (9.4) Remeasurements recognised in OCI ................................................................................................ 3.4 (2.1) Adjustment due to spin-off of Greek Operations sector (refer to Note 1) ................................ (22.9) —
As at 31 December ................................................................................................................................ 4.2 24.8
The assumptions used in computing the defined benefit obligation comprised the following for the years ended 31 December:
2012 2011
% %
Discount rate ................................................................................................................................ 3.00 4.75 Rate of compensation increase................................................................................................ 2.50 2.50 The expense recognised in the income statement comprised the following for the years ended 31 December:
2012 2011 2010
€ million € million € million
Service cost ................................................................................................ 1.3 4.7 4.7 Net interest cost on defined benefit liability/(asset) ................................................................ 0.4 1.4 2.1
Total ................................................................................................................................ 1.7 6.1 6.8 Defined benefit plan expenditure is included in staff costs and presented in cost of goods sold and operating expenses.
Plan assets are invested as follows:
2012 2011
% %
Asset category Debt securities ................................................................................................................................ 100 100
Total ................................................................................................................................................................ 100 100 The total employer contributions expected to be paid in 2013 is nil. Defined contribution plans
The expense recognised in the income statement in 2012 for the defined contribution plan is €1.0m (2011: €2.0m, 2010: €1.3m). This is included in staff costs and recorded in cost of goods sold and operating expenses.

Notes to the Financial Statements (continued)
Page 31 of 48
Annual Report 2012 Coca-Cola Hellenic
16. Share capital and share premium
Number of
shares Share Share
(authorised Capital Premium Total
and issued) € million € million € million
As at 1 January 2010 ................................................................................................ 365,539,075 182.8 1,113.8 1,296.6 Shares issued to employees exercising stock options ................................ 597,365 0.3 5.4 5.7 Balance as at 31 December 2010 ................................................................ 366,136,440 183.1 1,119.2 1,302.3
Shares issued to employees exercising stock options ................................ 405,568 0.2 4.5 4.7 Capitalisation of share premium reserve ................................................................ — 549.7 (549.7) — Expenses related to share capital increase (net of tax of €1.2m) ................................ — — (4.8) (4.8) Return of capital to shareholders ................................................................ — (183.2) — (183.2) Balance as at 31 December 2011 ................................................................ 366,542,008 549.8 569.2 1,119.0
Shares issued to employees exercising stock options ................................ 11,499 — 0.1 0.1 Reduction of share capital to extinguish accumulated losses of the parent company ................................................................ — (55.0) — (55.0) Return of capital to shareholders ................................................................ — (124.6) — (124.6) Balance as at 31 December 2012 ................................................................ 366,553,507 370.2 569.3 939.5
During 2010, Coca-Cola Hellenic’s Board of Directors resolved to increase the share capital of the Company by issuing 163,354, 161,663, 102,700 and 169,648 new ordinary shares, on 26 February, 17 May, 24 August and 25 November 2010 respectively following the exercise of stock options by option holders pursuant to the Company’s stock option plan. Total proceeds from the issues of the shares were €5.7m.
During 2011, Coca-Cola Hellenic’s Board of Directors resolved to increase the share capital of the Company by issuing 354,512, 21,994, 28,749 and 313 new ordinary shares as announced on 16 March, 24 June, 1 September and 13 December 2011 respectively, following the exercise of stock options by option holders pursuant to the Company’s stock option plan. Total proceeds from the issues of the shares were €4.7m.
During 2012, Coca-Cola Hellenic’s Board of Directors resolved to increase the share capital of the Company by issuing 5,334 and 6,165 new ordinary shares as announced on 21 March and 27 September respectively, following the exercise of stock options by option holders pursuant to the Company’s stock option plan. Total proceeds from the issues of the shares were €0.1m.
On 6 May 2011, the Annual General Meeting of shareholders resolved to reorganise its share capital. The Company’s share capital increased by an amount equal to €549.7 million. The increase was performed by capitalising the share premium reserve and increasing the nominal value of each share from €0.50 to €2.00. The Company’s share capital was subsequently decreased by an amount equal to €183.2 million by decreasing the nominal value of each share from €2.00 to €1.50, and distributing such €0.50 per share difference to shareholders in cash.
On 25 June 2012, the Annual General Meeting of shareholders resolved to decrease the share capital of the Company by the amount of €124.6 million by decreasing the nominal value of the Company’s share by €0.34 per share, from €1.50 to €1.16 per share, and the return of the amount of the decrease to the Company’s shareholders in cash, i.e. a return of €0.34 per share. Furthermore, on the same date, it was resolved to decrease the share capital of the Company by the amount of €55.0 million by decreasing the nominal value of the Company’s share by €0.15 per share, from €1.16 to €1.01 per share, in order to extinguish accumulated losses of the parent company Coca-Cola Hellenic Bottling Company S.A. in an equal amount.
The share capital on 31 December 2012 amounts to €370.2 million and is comprised of 366,553,507 shares with a nominal value of €1.01 each. Each share provides the right to one vote at general meetings of Coca-Cola Hellenic and entitles the holder to dividends declared by Coca-Cola Hellenic.

Notes to the Financial Statements (continued)
Page 32 of 48
Annual Report 2012 Coca-Cola Hellenic
17. Reserves The reserves of the Company at 31 December were as follows:
2012 2011 2010 € million € million € million
Treasury shares ................................................................................................................................ (54.3) (55.5) (57.2) Other reserves Tax-free reserve ................................................................................................................................ 84.0 251.3 251.3 Statutory reserve ................................................................................................................................ 55.7 55.7 55.7 Stock option reserve................................................................................................................................ 51.9 45.6 37.5 Available-for-sale financial assets valuation reserve ................................................................ 0.6 0.4 0.9 Total other reserves ................................................................................................................................ 192.2 353.0 345.4 Total reserves ................................................................................................................................ 137.9 297.5 288.2
Treasury shares
On 30 April 2009, the Board of Directors of Coca-Cola Hellenic resolved to buy-back a maximum of 5% of its paid-in share capital during the period that is 24 months from the date of the Extraordinary General Meeting of 27 April 2009 which approved a share buy-back programme pursuant to Article 16 of Codified Law 2190/1920 (i.e. until 26 April 2011). Based on the Company’s capitalisation at that time, the maximum amount that may be bought back pursuant to the programme was 18,270,104 shares. Purchases under the programme were subject to a minimum purchase price of €1.00 per share and a maximum purchase price of €20.00 per share. This programme expired on 26 April 2011.
Applicable law does not require any actual use of such approved share buy-back programmes. The Company may therefore, in its sole discretion, decide not to buy back any shares or to buy fewer shares than the maximum permissible number approved under the programme. The purchase of shares pursuant to the share buy-back programme is dependent upon a number of factors including, without limitation, the relative attractiveness of alternative investment opportunities and the availability of funds. As at 31 December 2012, 3,430,135 shares had been held by the Company pursuant to the share buy-back programme for a total value of €54.3m, bringing the shares in circulation to 363,123,372 (2011: 3,430,135 shares held for a total value of €55.5m, 2010: 3,430,135 shares held for a total value of €57.2m).
Other reserves
Tax-free reserve
The tax-free reserve includes investment tax incentive and other tax-free or partially taxed reserves of the Company. The tax-free reserve may be distributed if taxed, where applicable.
Statutory reserves
The statutory reserve is based on Greek law and cannot be distributed.
Stock option reserve
This reserve represents the cumulative charge to the income statement and the investments in subsidiaries for employee stock option awards.
Available-for-sale financial assets valuation reserve
The available-for-sale financial assets valuation reserve reflects changes in the fair values of available-for-sale financial assets. Amounts in this reserve are reclassified to profit or loss upon sale or impairment of the related investments.

Notes to the Financial Statements (continued)
Page 33 of 48
Annual Report 2012 Coca-Cola Hellenic
18. Total operating expenses
(a) Total operating expenses for the years ended 31 December comprised:
2012 2011 2010 € million € million € million
Management fee income (refer to Note 29) ................................................................................................ (28.7) (30.9) (20.4) Selling expenses ................................................................................................................................ 24.1 104.9 115.8 Delivery expenses ................................................................................................................................ 10.2 45.1 52.5 Administrative expenses ................................................................................................................................ 46.9 67.3 60.5 (Gain) / loss on fair value of cash flow hedge ................................................................................................ — (0.2) (0.2) Stock option expense (refer to Note 23) ................................................................................................ 3.9 5.4 4.4 Total operating expenses ................................................................................................ 56.4 191.6 212.6 (b) Staff costs Staff costs were analysed as follows:
2012 2011 2010
€ million € million € million
Wages and salaries ................................................................................................................................ 43.2 85.4 95.5 Social security costs ................................................................................................................................ 7.5 19.0 21.4 Pension and other employee benefits ................................................................................................ 7.2 18.4 16.4 Termination benefits ................................................................................................................................ 4.2 19.1 18.8
Total staff costs ................................................................................................................................ 62.1 141.9 152.1 Staff costs included in operating expenses amounted to €50.7m in 2012 (2011: €113.6m, 2010: €120.7m). Staff costs included in cost of goods sold amounted to €11.4m in 2012 (2011: €28.3m, 2010: €31.4m). The average number of full-time equivalent employees in 2012 was 191 following the spin-off of the Greek Operations sector. The average number of full-time equivalent employees in 2011 was 2,221 (2010: 2,472). 19. Restructuring costs
As part of the effort to optimize its cost base and sustain competitiveness in the market place, the Company undertook restructuring initiatives in 2012 which amounted to €5.2m (2011: €26.7m, 2010: €19.5m) before tax. The restructuring concerns mainly employees’ costs of the Greek Operations sector which was spun-off. 20. Finance costs, net Finance costs, net for the year ended 31 December comprised:
2012 2011 2010 € million € million € million
External interest income ................................................................................................................................ — — (0.2) External interest expense ................................................................................................................................ — 0.1 0.2 Interest expense charged by subsidiaries (refer to Note 29) ................................................................ 2.0 14.6 28.3 Finance cost, net ................................................................................................................................ 2.0 14.7 28.3

Notes to the Financial Statements (continued)
Page 34 of 48
Annual Report 2012 Coca-Cola Hellenic
21. Tax
The tax on the Company’s profit before tax differs from the theoretical amount that would arise using the Greek corporate tax rate as follows:
2012 2011 2010 € million € million € million
(Loss) / profit before tax per the income statement ................................................................ (37.1) (36.9) 2.1 Tax calculated at a tax rate of 20% (2011: 20%, 2010: 24%) ................................................................ (7.4) (7.4) 0.5 Additional local taxes ................................................................................................................................ — (0.4) 21.2 Expenses non-deductible for tax purposes ................................................................................................ 2.5 4.5 8.9 Changes in tax laws and rates ................................................................................................ — 1.2 — Other ................................................................................................................................ 1.1 — 1.4
Income tax charge per the income statement ................................................................ (3.8) (2.1) 32.0 On 6 May 2010, the Greek Government enacted the ‘Extraordinary Contribution of Social Responsibility’ (Law Nr. 3845/2010). According to article 5, the ‘Extraordinary Social Contribution Tax’ was applied retrospectively on the Company's 2009 total net income. The amount of such ‘Extraordinary Social Contribution Tax’ applicable to 2009 was €21.2m. As a result the Company recorded a tax charge of €21.2m in 2010, which was paid in January 2011. During 2008, the tax audit for the unaudited tax years 2003 up to and including 2006 was completed and during 2010, the tax audit for the unaudited tax years 2007 up to and including 2008 was completed. For the years 2003 to 2008 there are pending tax litigations before the administrative courts. In May 2012, the tax audit for the unaudited tax years 2009 and 2010 was completed. The income tax charge for the years ended 31 December is as follows: 2012 2011 2010 € million € million € million
Current tax charge ................................................................................................................................ (5.3) 0.4 31.0 Deferred tax charge (refer to Note 8) ................................................................................................ 1.5 (2.5) 1.0
Total income tax charge ................................................................................................ (3.8) (2.1) 32.0
22. Shares held for equity compensation plan
The Company operates a stock purchase plan, the Coca-Cola Hellenic Stock Purchase Plan, which is an equity compensation plan in which eligible employees may participate.
Under the terms of this plan, employees have the opportunity to invest 1% to 15% of their salary in ordinary Coca-Cola Hellenic shares by contributing to the plan monthly. Coca-Cola Hellenic match up to a maximum 5% of the employee’s salary by way of contribution, which is made in December, and matching shares purchased in December vest immediately.
The charge to the income statement totaled €0.6m for the year ended 31 December 2012 (2011: €1.4m, 2010: €1.3m).

Notes to the Financial Statements (continued)
Page 35 of 48
Annual Report 2012 Coca-Cola Hellenic
23. Stock option compensation plans
Coca-Cola Hellenic operates an equity compensation plan, under which senior managers are granted awards of stock options, based on performance, potentiality and level of responsibility. Options are granted at an exercise price equal to the closing price of the Company’s shares trading on the Athens Exchange on the day of the grant1. Options vest in one-third increments each year for three years and can be exercised for up to ten years from the date of award. When the options are exercised, the proceeds received, net of any transaction costs, are credited to share capital (at the nominal value) and share premium.
The following table summarises information regarding outstanding stock options exercisable at 31 December 2012 and stock options exercised during 2012:
Exercise Vesting Number of price after Vesting dates for End of stock the capital status further option options return (€) 2012 increments period outstanding
2003-2004 Stock Option Plan/2003 Grant ................................ 8.83 fully
vested - - - 14.12.2013 3,250
2003-2004 Stock Option Plan/2004 Grant ................................ 10.08 fully
vested - - - 02.12.2014 86,827
2005-2009 Plan/2005 Grant ................................ 13.19 fully
vested - - - 01.12.2015 571,883
2005-2009 Plan/2006A Grant ................................ 14.23 fully
vested - - - 20.03.2016 50,001
2005-2009 Plan/2006 Grant ................................ 16.37 fully
vested - - - 12.12.2016 1,050,401
2005-2009 Plan/2007 Grant ................................ 26.41 fully
vested - - - 12.12.2017 1,274,450
2005-2009 Plan/2008A Grant ................................ 22.20 fully
vested - - - 19.06.2018 30,000
2005-2009 Plan/2008 Grant ................................ 9.02 fully
vested - - - 10.12.2018 1,333,341
2009-2011 Plan/2009 Grant ................................ 15.70 fully
vested - - - 09.12.2019 1,646,967
2009-2011 Plan/2010A Grant ................................ 19.16 two thirds 18.03.2013 - - 17.03.2020 30,000
2009-2011 Plan/2010 Grant ................................ 19.31 two thirds 09.12.2013 - - 08.12.2020 1,913,100
2009-2011 Plan/2011A Grant ................................ 18.53 one third 16.03.2013 16.03.2014 - 15.03.2021 75,000
2009-2011 Plan/2011B Grant ................................ 18.16 one third 24.06.2013 24.06.2014 - 23.06.2021 3,333
2009-2011 Plan/2011 Grant ................................ 11.98 one third 16.12.2013 16.12.2014 - 15.12.2021 1,632,500
Total ................................................................................................ 9,701,053
1 From December 2008 the exercise price of stock options is determined by reference to the share price of the Company’s share at the close of trading on the date of the grant instead of the weighted average share price during the ten working days prior to the date of the grant.

Notes to the Financial Statements (continued)
Page 36 of 48
Annual Report 2012 Coca-Cola Hellenic
23. Stock option compensation plans (continued) A summary of stock option activity in 2012 under all plans is as follows:
Weighted Weighted Weighted Weighted average average average average Number exercise price exercise price Number exercise price exercise price of stock before the after the of stock before the after the options capital return capital return options capital return capital return 2012 2012 (€) 2012 (€) 2011 2011 (€) 2011 (€)
Outstanding at January 1 ................................ 9,767,302 16.55 n/a 8,759,862 17.65 n/a Granted ................................................................ n/a n/a n/a 1,717,500 n/a 12.64 Exercised ................................................................ (11,499) 9.36 9.02 (405,568) 11.69 11.19 Expired ................................................................ n/a n/a n/a (3,151) 8.19 7.69 Forfeited ................................................................ (54,750) 21.81 21.47 (301,341) 19.48 18.98
Outstanding at December 31 ................................ 9,701,053 n/a 16.19 9,767,302 n/a 16.55
Exercisable at December 31 ................................ 7,914,981 n/a 16.50 6,192,606 n/a 17.04
Number Weighted of stock average options exercise price 2010 2010 (€)
Outstanding at January 1 ................................ 7,415,442 16.33 Granted ................................................................ 2,010,100 20.15 Exercised ................................................................ (597,365) 9.59 Expired ................................................................ (1,453) 8.29 Forfeited ................................................................ (66,862) 18.08
Outstanding at December 31 ................................ 8,759,862 17.65
Exercisable at December 31 ................................ 5,001,036 17.77
The charge to the income statement for employee stock option awards for 2012 amounted to €3.9m (2011: €5.4m, 2010: €4.4m).
As a result of the capital return (refer to Note 16) of €0.34, a corresponding €0.34 reduction was made to the exercise price of each unexercised stock option under each plan. The modification to the exercise price ensured the intrinsic value of each stock option was retained and did not result in incremental fair value for any of the unexercised stock options. Incremental fair value is calculated using the binomial stock option valuation model and represents the difference between the fair value of an option immediately after the modification and the original fair value of the respective option, measured immediately before the modification.
The Company adopted the employee stock option plan on 13 December 2001. Previously, the Company had issued stock appreciation rights to certain of its employees, including employees who previously held options in CCB. Upon adoption of the stock option plan, all such rights, except those held by retirees and employees located in countries where granting and exercising stock options was impractical or not permitted, were converted into stock options carrying over the same exercise prices, vesting periods and expiration dates.

Notes to the Financial Statements (continued)
Page 37 of 48
Annual Report 2012 Coca-Cola Hellenic
23. Stock option compensation plans (continued)
Equity settled share based payments are measured at fair value at the date of grant using a binomial stock option valuation model. For the year of 2012 there have been no grants. For prior years, the inputs into the model are as follows:
2011 2010
Weighted average fair value of options granted ................................................................ €2.9 €5.2 Risk free interest rates ................................................................................................ 2.4% 3.0% Expected volatility ................................................................................................................................ 33.2% 32.2% Dividend yield ................................................................................................................................ 2.5% 1.5% Expected life ................................................................................................................................ 4.1 years 4.0 years The weighted average remaining contractual life of share options outstanding under the stock option compensation plans at 31 December 2012 was 6.5 years (2011: 7.5 years, 2010: 7.8 years).
24. Dividends
The reported net results of the Company’s statutory accounts do not allow for 2012 and 2011 statutory minimum annual dividend payment. As a result the Company has not recorded a dividend liability in respect of 2012 and 2011.
During 2010, a dividend of €0.30 per share totalling €102.0m was paid.
25. Financial risk management
Financial risk factors
The Company’s activities expose it to a variety of financial risks: market risk (including foreign currency risk, interest rate risk, commodity price risk), credit risk, liquidity risk and capital risk. The Company’s overall risk management programme focuses on the volatility of financial markets and seeks to minimise potential adverse effects on the Company’s cash flows. The Company uses derivative financial instruments to hedge certain risk exposures.
Risk management is carried out by the Group Treasury in a controlled manner, consistent with the Board of Directors’ approved policies. Group Treasury identifies, evaluates and hedges financial risks in close co-operation with the Group’s subsidiaries. The Board of Directors has approved the Treasury Policy and Chart of Authority, which together provide the control framework for all treasury and treasury related transactions.
Market Risk
Foreign currency risk
The Company is exposed to the effect of foreign currency risk on future commercial transactions, recognised monetary assets and liabilities that are denominated in currencies other than the entity’s functional currency. Forward foreign exchange contracts are used to hedge a portion of the Company’s foreign currency risk. The majority of the forward foreign exchange contracts have maturities of less than one year after the balance sheet date. The foreign currency risk arising from the investment in foreign operations is not hedged.
Management has set up a policy that requires the Company to manage the foreign exchange risk against its functional currency. To manage the foreign exchange risk arising from future commercial transactions and recognised monetary assets and liabilities, the Company uses forward contracts transacted with Group Treasury. Foreign exchange risk arises when future commercial transactions or recognised monetary assets or liabilities are denominated in a currency that is not the Company’s functional currency. The Company’s Treasury’s risk management policy is to hedge between 25% and 80% of anticipated cash flows in each major foreign currency for the subsequent twelve months. The Company designates contracts with Group Treasury as fair value hedges or cash flow hedges, as appropriate.

Notes to the Financial Statements (continued)
Page 38 of 48
Annual Report 2012 Coca-Cola Hellenic
25. Financial risk management (continued)
No material exchange gains or losses have been resulted for the period ended 31 December 2012. Included in the income statement is an amount of nil (2011: €0.2m, 2010: €0.2m) for such exchange gains.
Interest rate risk
The Company’s interest risk arises from long term intercompany borrowings. Borrowings issued at variable rates expose the Company to cash flow interest rate risk. There are no borrowings issued at fixed rates. During 2012 and 2011, the Company’s borrowings at variable rate were denominated in Euro.
The sensitivity analysis in the following paragraph has been determined based on exposure to interest rates of floating rate liabilities. The sensitivity analysis is based on a 100 basis point increase or decrease in interest rates. Management has determined this change in interest rates to be a reasonable estimate of possible outcomes.
If interest rates had been 100 basis points higher and all other variables were held constant, the Company’s profit for the year ended 31 December 2012 would have decreased by €0.5m (2011: €3.9m, 2010: €8.0m). If interest rates had been 100 basis points lower and all other variables were held constant, the Company’s profit for the year ended 31 December 2012 would have increased by €0.5m (2011: €3.9m, 2010: €8.0m).
Commodities price risk management
Following the spin-off of the Greek Operations sector the Company had no exposure to commodities price changes.
Credit risk
The Company’s maximum exposure to credit risk in the event that counterparties fail to perform their obligations at 31 December 2012 in relation to each class of recognised financial asset, is the carrying amount of those assets as indicated on the balance sheet.
If credit is granted to customers, their credit quality is normally assessed using external agencies and historic experience. Credit limits are set accordingly. Further information regarding credit risk exposure is shown within Notes 10 and 11.
With respect to derivative financial instruments, credit risk arises from the potential failure of counterparties to meet their obligations under the contract or arrangement. The Company’s maximum credit risk exposure for each derivative instrument is the carrying amount of the derivative (refer to Note 7). The Company does not have any derivative financial instruments.
Liquidity risk
The Company actively manages liquidity risk to ensure there are sufficient funds available for any short-term and long-term commitments. Bank overdrafts and bank facilities, both committed and uncommitted, are used to manage this risk.
Ultimate responsibility for liquidity risk management rests with the Board of Directors, which has built an appropriate liquidity risk management framework for the management of the Company’s short, medium and long-term funding and liquidity requirements. The Company manages liquidity risk by maintaining adequate cash reserves and committed banking facilities, access to the debt capital markets, and by continuously monitoring forecasted and actual cash flows.

Notes to the Financial Statements (continued)
Page 39 of 48
Annual Report 2012 Coca-Cola Hellenic
25. Financial risk management (continued)
The following tables detail the Company’s remaining contractual maturities for its financial liabilities. The tables include both interest and principal undiscounted cash flows assuming that interest rates remain constant from 31 December 2012.
€ million € million € million € million up to 1 year 1–2 yrs 2–5 yrs over 5 years
Borrowings ................................................................................................ 12.6 — — — Trade and other payables ................................................................ 12.0 — — —
As at 31 December 2012 ................................................................ 24.6
—
—
— Borrowings ................................................................................................ 21.6 19.9 47.5 396.4 Trade and other payables ................................................................ 104.2 — — —
As at 31 December 2011 ................................................................ 125.8 19.9 47.5 396.4 Capital risk
The Company’s objectives when managing capital are to safeguard the Company’s ability to continue as going concern and to maintain an optimal capital structure to reduce the cost of capital.
In order to maintain or adjust the capital structure, the Company may increase or decrease debt, issue or buy back shares, adjust the amount of dividends paid to shareholders, or return capital to shareholders.
The Company monitors its capital structure on the basis of the gearing ratio. This ratio is calculated as net debt divided by total capital. Total capital is calculated as “Total equity” plus “Net debt” as shown in the balance sheet. The gearing ratios at 31 December 2012 and 2011 were as follows:
2012 2011 € million € million
Total borrowings (refer to Note 13) ................................................................................................................................ 12.1 390.5 Less: Cash and cash equivalents (refer to Note 12) ................................................................................................ (0.4) (0.3) Net debt ................................................................................................................................................................ 11.7 390.2 Total equity ................................................................................................................................................................ 1,208.4 1,360.8
Total capital ................................................................................................................................................................ 1,220.1 1,751.0
Gearing ratio ................................................................................................................................................................ 1% 22%
The gearing ratio is managed at a Group Level.

Notes to the Financial Statements (continued)
Page 40 of 48
Annual Report 2012 Coca-Cola Hellenic
25. Financial risk management (continued)
Fair values of financial assets and liabilities
For financial instruments such as cash, deposits, investments, short-term borrowings and other financial liabilities (other than long-term borrowings), carrying values are a reasonable approximation of their fair values. For long term borrowing fair value approximates book value given that these borrowings are held at floating interest rates.
The fair value of debtors and creditors approximates to their book values unless otherwise stated.
According to the fair value hierarchy, the financial instruments measured at fair value are classified as follows:
Level 1
The fair value of available-for-sale listed equity securities is based on quoted market prices at 31 December 2012 and 2011.
Level 2
The fair value of forward contracts is calculated by reference to forward exchange rates at 31 December 2012 and 2011 for contracts with similar maturity dates.
Level 3
The fair value of available-for-sale unlisted investments is determined through the use of estimated discounted cash flows.
The following table provides the fair value hierarchy in which fair value measurements are categorised for assets and liabilities at 31 December 2012:
Level 1 Level 2 Level 3 Total € million € million € million € million
Available-for-sale financial assets Equity securities …………………………………………………... 1.1 — — 1.1 Total financial assets ……………………………………………….. 1.1 — — 1.1 Note that all of the resulting fair value estimates are included in level 1.
The following table provides the fair value hierarchy in which fair value measurements are categorised for assets and liabilities at 31 December 2011:
Level 1 Level 2 Level 3 Total
€ million € million € million € million
Available-for-sale financial assets Equity securities …………………………………………………... 0.6 — — 0.6 Total financial assets ……………………………………………….. 0.6 — — 0.6
Note that all of the resulting fair value estimates are included in level 1.

Notes to the Financial Statements (continued)
Page 41 of 48
Annual Report 2012 Coca-Cola Hellenic
26. Contingencies
The Greek Competition Authority issued a decision on 25 January 2002, imposing a fine on the Company of approximately €2.9m for certain discount and rebate practices and required changes to the Company’s commercial practices with respect to placing coolers in certain locations and lending these assets free of charge. On 16 June 2004, the fine was reduced on appeal to €1.8m. On 29 June 2005, the Greek Competition Authority requested that the Company provide information on its commercial practices as a result of a complaint by certain third parties regarding the Company’s compliance with the decision of 25 January 2002. On 7 October 2005, the Company was served with notice to appear before the Greek Competition Authority. On 14 June 2006, the Greek Competition Authority issued a decision imposing a daily penalty of €5,869 for each day that the Company allegedly failed to comply with the decision of 25 January 2002. On 31 August 2006, the Company deposited an amount of €8.9m, reflecting the amount of the fine and applicable tax, with the Greek authorities. As a result of this deposit, the Company increased the charge to its 2006 financial statements in connection to this case. On 23 November 2007, the Court of Appeals partly reversed and partly upheld the decision of the Greek Competition Authority reducing the amount of the fine to €5.9m. The reduction of the fine by €2.8m was recognized in the Company’s 2007 income statement. The Company has appealed the decision of the Court of Appeals to the extent it upholds the fine, to the Supreme Administrative Court of Greece. The Company believes that it has substantial legal grounds for its appeal against the judgment of the Court of Appeals. The Greek Competition Authority and one of the Company’s competitors have also appealed the decision of the Court of Appeals. There have been no material developments in the applicable litigation. Since 2008 when the case was first referred to the Supreme Administrative Court of Greece, hearings have been postponed due to the backlog of pending cases before the Court. Utilizing advice from outside legal counsel, we consider the risk of an increase to the amount of the fine and the possibility of further cash outflows as remote.
In relation to the Greek Competition Authority’s decision of 25 January 2002, one of the Company’s competitors has filed a lawsuit claiming damages in an amount of €7.7m. The court of first instance heard the case on 21 January 2009 and subsequently rejected the lawsuit. The plaintiff has appealed the judgment. At present, it is not possible to predict the final outcome of this lawsuit or quantify the likelihood or materiality of any potential liability arising from it. We have not provided for any losses related to this case.
On 1 February 2012, the Greek Competition Commission conducted an inspection of the Company's Greek
operations as part of an investigation into the sparkling, juice and water categories. The Company has a policy of strict compliance with Greek and EU competition law and it is cooperating fully with the Commission.
The Company is also involved in various other legal proceedings. Management believes that any liability to the
Company that may arise as a result of these pending legal proceedings will not have a material adverse effect on the results of operations, cash flows, or the financial condition of the Company taken as a whole.
The tax filings of the Company are routinely subjected to audit by tax authorities. These audits may result in
assessments of additional taxes. The Company provides additional tax in relation to the outcome of such tax assessments, to the extent that a liability is probable and estimable.
Under various debt programs the Company is a guarantor up to a maximum of €5,182.0m in 2012 (2011: €4,195.0m) of which €1,911.5m had been issued under these programs (2011: €2,045.0m).
Notes to the Financial Statements (continued)
Page 42 of 48
Annual Report 2012 Coca-Cola Hellenic
27. Commitments (a) Operating leases The total of future minimum lease payments under non-cancellable operating leases at 31 December was as follows:
2012 2011 € million € million
Less than one year ................................................................................................................................ 1.0 4.5 Later than one year but less than five years ................................................................................................ 1.6 2.3
Future minimum lease payments ................................................................................................................................ 2.6 6.8 The total operating lease charges included within operating expenses for the year ended 31 December were as follows:
2012 2011 2010 € million € million € million
Plant and equipment................................................................................................................................ 1.2 6.4 6.5 Property ................................................................................................................................ 0.4 1.9 2.0
Total operating lease charges ................................................................................................ 1.6 8.3 8.5 (b) Capital commitments
At 31 December 2012 the Company did not have capital commitments (2011: €5.6m). (c) Long-term purchase commitments At 31 December 2012 the Company did not have commitments to purchase raw materials and receive services (2011: €46.2m). 28. Directors’ and senior management remuneration
The total remuneration paid to or accrued for directors and the senior management team during 2012 amounted to €9.2m (2011: €12.4, 2010: €10.8m). Out of this, the amount paid or accrued for stock option grants during 2012 was €2.2m (2011: €3.8m, 2010: €3.4m). Pension and post employment benefits for directors and the senior management team during 2012 amounted to €0.5m (2011: €0.6m, 2010: €0.6m).

Notes to the Financial Statements (continued)
Page 43 of 48
Annual Report 2012 Coca-Cola Hellenic
29. Related party transactions
a) Transactions with direct and indirect subsidiaries
The Company owns directly and indirectly, shareholdings in the subsidiaries and joint arrangements as shown in Notes 30 and 31 respectively.
The Company had the following transactions with subsidiary undertakings:
2012 2011 2010
€ million € million € million
Purchase of raw materials and finished goods ................................................................ (36.2) (130.0) (110.1) Interest expense ................................................................................................................................ (2.0) (14.6) (28.3) Other purchases and expenses ................................................................................................ (0.5) (1.4) (2.3) Sales of raw materials and finished goods ................................................................ 5.1 25.7 17.9 Management fee income ................................................................................................ 28.7 30.9 20.4 Sales of services (Royalties) ................................................................................................ 4.4 — — Rental income and other cost recharges ................................................................................................ 2.2 3.9 3.2
At 31 December, the Company had the following balances with subsidiary undertakings:
2012 2011 € million € million
Payables to subsidiaries ................................................................................................................................ 0.2 1.9 Interest accrual on loan from subsidiaries ................................................................................................ 0.1 4.2 Receivables from subsidiaries................................................................................................................................ 10.1 20.5 Total borrowing from subsidiaries (net of accrued interest) ................................................................ 12.0 386.3 b) The Coca-Cola Company
As at 31 December 2012, TCCC indirectly owned 23.2% (2011: 23.2%, 2010: 23.2%) of the issued share capital of Coca-Cola Hellenic. TCCC considers Coca-Cola Hellenic to be a ‘key bottler’ and has entered into bottler’s agreements with Coca-Cola Hellenic. All the bottler’s agreements entered into by TCCC and Coca-Cola Hellenic are Standard International Bottler’s (‘SIB’) agreements. The terms of the bottler’s agreements grant Coca-Cola Hellenic the right to produce and the exclusive right to sell and distribute the beverages of TCCC in Greece. Consequently, Coca-Cola Hellenic is obliged to purchase all its requirements for concentrate for TCCC’s beverages from TCCC, or its designee, in the ordinary course of business. On 10 October 2012, TCCC agreed to extend the term of the bottlers’ agreements for a further ten years until 2023. On 29 December 2008, Kar-Tess Holding and TCCC agreed to extend their existing shareholders’ agreement, whereby it is agreed that the combined shareholdings of Kar-Tess Holding and TCCC will not fall below 44% for the period up to January 2014 and not below 40% for the period thereafter until 31 December 2018.
TCCC owns or has applied for the trademarks that identify its beverages in all of Greece. TCCC has authorised Coca-Cola Hellenic to use the trademark ‘Coca-Cola’ in its corporate name.
Total purchases of concentrate, finished products and other materials from TCCC and its subsidiaries during 2012 amounted to €18.5m (2011: €99.8m, 2010: €105.5m).

Notes to the Financial Statements (continued)
Page 44 of 48
Annual Report 2012 Coca-Cola Hellenic
29. Related party transactions (continued)
TCCC makes discretionary marketing contributions to the Company. The participation in shared marketing agreements is at TCCC’s discretion and, where co-operative arrangements are entered into, marketing expenses are shared. Such arrangements include the development of marketing programs to promote TCCC’s beverages. Total net contributions received from TCCC for marketing and promotional incentives during the year amounted to €0.3m (2011: €9.1m, 2010: €20.0m) and €0.6m regarding the cost of sales (2011:nil, 2010:nil). Contributions for price support and marketing and promotional campaigns in respect of specific customers are recorded in net sales revenue as an offset to promotional incentives paid to customers. In 2012, such contributions made by TCCC to Coca-Cola Hellenic totaled €0.9m (2011: €16.4m, 2010: €23.9m) and the contributions of Coca-Cola Hellenic to TCCC totaled nil (2011: €6.3m, 2010: €3.9m) regarding the marketing expenses and nil (2011: €1.0m, 2010: nil) regarding the cost of sales. TCCC has also customarily made additional payments for marketing and advertising directly to suppliers as part of the shared marketing arrangements. The proportion of direct and indirect payments, made at TCCC’s discretion, will not necessarily be the same from year to year.
During the year, the Company sold nil finished goods and raw materials to TCCC (2011: €0.2m, 2010: €0.1m) and incurred nil other expenses (2011: €1.5m, 2010: nil).
As at 31 December 2012, the Company had a total amount due from TCCC of nil (2011: €11.3m, 2010: €6.4m), and a total amount due to TCCC of nil of trade and other payables (2011: €5.6m, 2010: €11.0m) and nil of other liabilities (2011: €7.6m, 2010: nil).
(c) Frigoglass S.A. (‘Frigoglass’)
Frigoglass, a company listed on the Athens Exchange, is a manufacturer of coolers, glass bottles and crowns. Frigoglass is related to Coca-Cola Hellenic by way of 44.1% ownership by the parent of Kar-Tess Holding (see below). Frigoglass has a controlling interest in Frigoglass Industries Limited, a company in which Coca-Cola Hellenic has a 23.9% effective interest, through its investment in Nigerian Bottling Company plc.
The Company entered into a supply agreement with Frigoglass for the purchase of cooling equipment in 1999. The supply agreement was extended in 2004 and, most recently, in 2008, on substantially similar terms. Coca-Cola Hellenic has the status of most favoured customer of Frigoglass, on a non-exclusive basis, provided that it obtains at least 60% (at prices which are negotiated on an annual basis and which must be competitive) of its annual requirements for cooling equipment. The current agreement expires on 31 December 2013.
During the year, the Company made purchases of €0.7m (2011: €6.1m, 2010: €7.1m) of coolers, glass bottles and crowns from Frigoglass and its subsidiaries and incurred maintenance and other expenses of €0.7m (2011: €4.8m, 2010: €5.1m). In addition the Company recorded other income of €0.1m (2011: €0.5m, 2010: €0.5m). As at 31 December 2012, Coca-Cola Hellenic owed nil (2011: €1.9m, 2010: €2.4m) to, and was owed nil (2011: €0.7m, 2010: €1.1m) by Frigoglass.
(d) Directors
Mr George A. David, Mr Haralambos K. Leventis, Mr Anastasios P. Leventis and Mr Anastassis G. David have been nominated by Kar-Tess Holding to the board of Coca-Cola Hellenic. Mr Irial Finan and Mr John Hunter have been nominated by TCCC to the board of Coca-Cola Hellenic. There have been no transactions between Coca-Cola Hellenic and the directors except for remuneration (refer to Note 28).
(e) Other
Beverage Partners Worldwide (‘BPW’)
BPW is a 50/50 joint arrangement between TCCC and Nestlé. During 2012, the Company purchased inventory from BPW amounting to €0.4m (2011: €6.0m, 2010: €3.8m). As at 31 December 2012, Coca-Cola Hellenic owed nil (2011: nil, 2010: nil).

Notes to the Financial Statements (continued)
Page 45 of 48
Annual Report 2012 Coca-Cola Hellenic
29. Related party transactions (continued)
Kar-Tess Holding
As at 31 December 2012, Kar-Tess Holding owned 23.3% (2011: 23.3%, 2010: 23.3%) of the issued share capital of Coca-Cola Hellenic.
On 6 December, 2010 Kar-Tess Holding transferred 22,453,254 of Coca-Cola Hellenic shares and voting rights representing 6.13% of the total number of shares and voting rights of Coca-Cola Hellenic by transferring its 100% owned subsidiaries under the trade names “Sammy LLC”, “Lucky 70 LLC”, “Zoe 20 LLC”, “Kooky LLC”, “Utopia Business Company Ltd.”, “Harmonia Commercial S.A.”, “Ice Cold Holdings Limited” and “Red & White Holdings Limited” to entities and individuals, who were either ultimate beneficial owners of Kar-Tess Holding or have been nominated by them. None of the above persons owns individually more than 2% of the outstanding shares and voting rights of Coca-Cola Hellenic.
There were no significant transactions with other related parties for the year ended 31 December 2012, 2011 and 2010.

Notes to the Financial Statements (continued)
Page 46 of 48
Annual Report 2012 Coca-Cola Hellenic
30. List of principal Group companies
The following are the principal Group companies of Coca-Cola Hellenic at 31 December:
% ownership
Country of registration 2012 2011 2010
3E (Cyprus) Limited ...............................................................................Cyprus 100.0% 100.0% 100.0% AS Coca-Cola HBC Eesti ................................................................Estonia 100.0% 100.0% 100.0% Bankya Mineral Waters Bottling Company EOOD ................................Bulgaria 100.0% 100.0% 100.0% Brewinvest S.A. Group(1) ................................................................Greece 50.0% 50.0% 50.0% BrewTech B.V. Group(1),(2) ................................................................The Netherlands 50.0% — — CC Beverages Holdings II B.V. ..............................................................The Netherlands 100.0% 100.0% 100.0% CCB Management Services GmbH ........................................................Austria 100.0% 100.0% 100.0% CCHBC Armenia CJSC ................................................................Armenia 90.0% 90.0% 90.0% CCHBC Bulgaria AD ................................................................Bulgaria 85.4% 85.4% 85.4% CCHBC Insurance (Guernsey) Limited ..................................................Guernsey 100.0% 100.0% 100.0% CCHBC IT Services Limited ................................................................Bulgaria 100.0% 100.0% 100.0% Coca-Cola Beverages Austria GmbH .....................................................Austria 100.0% 100.0% 100.0% Coca-Cola Beverages Belorussiya ..........................................................Belarus 100.0% 100.0% 100.0% Coca-Cola Beverages Ceska republika, s.r.o. ................................Czech Republic 100.0% 100.0% 100.0% Coca-Cola Beverages Ukraine Ltd .........................................................Ukraine 100.0% 100.0% 100.0% Coca-Cola Bottlers Chisinau S.R.L. .......................................................Moldova 100.0% 100.0% 100.0% Coca-Cola Bottlers Iasi Srl ................................................................Romania 99.2% 99.2% 99.2% Coca-Cola Bottling Company (Dublin) Limited................................Republic of Ireland 100.0% 100.0% 100.0% Coca-Cola HBC Balkan Holding B.V. (3) ...............................................The Netherlands — 100.0% 100.0% Coca-Cola HBC-Srbija d.o.o. (4) ..............................................................Serbia 100.0% 100.0% 91.2% Coca-Cola HBC B-H d.o.o. Sarajevo .....................................................Bosnia and Herzegovina 100.0% 100.0% 100.0% Coca-Cola HBC Finance B.V. ................................................................The Netherlands 100.0% 100.0% 100.0% Coca-Cola HBC Finance plc ................................................................England and Wales 100.0% 100.0% 100.0% Coca-Cola HBC Greece S.A.I.C. (5) .......................................................Greece 100.0% 100.0% 100.0% Coca-Cola HBC Hrvatska d.o.o. .............................................................Croatia 100.0% 100.0% 100.0% Coca-Cola HBC Hungary Ltd ................................................................Hungary 100.0% 100.0% 100.0% Coca-Cola HBC Ireland Limited ............................................................Republic of Ireland 100.0% 100.0% 100.0% Coca-Cola HBC Italia S.r.l. ................................................................Italy 100.0% 100.0% 100.0% Coca-Cola HBC Kosovo L.L.C. .............................................................Kosovo 100.0% 100.0% 100.0% Coca-Cola HBC Northern Ireland Limited ................................Northern Ireland 100.0% 100.0% 100.0% Coca-Cola HBC Polska sp. z o.o. ...........................................................Poland 100.0% 100.0% 100.0% Coca-Cola HBC Romania Ltd ................................................................Romania 100.0% 100.0% 100.0% Coca-Cola HBC Slovenija d.o.o. ............................................................Slovenia 100.0% 100.0% 100.0% Coca-Cola HBC Slovenska republika, s.r.o. ................................Slovakia 100.0% 100.0% 100.0% Coca-Cola HBC Switzerland Ltd (6) .......................................................Switzerland 99.9% 99.9% 99.9% Coca-Cola Hellenic Bottling Company-Crna Gora d.o.o.,
Podgorica(4) .........................................................................................Montenegro 100.0% 100.0% 91.2% Coca-Cola Hellenic Business Service Organization (7) ...........................Bulgaria 100.0% 100.0% — Coca-Cola Hellenic Procurement GmbH ................................................Austria 100.0% 100.0% 100.0% Deepwaters Investments Ltd ................................................................Cyprus 50.0% 50.0% 50.0% Dunlogan Limited(8) ................................................................................Northern Ireland — 100.0% 100.0% Lanitis Bros Ltd ......................................................................................Cyprus 100.0% 100.0% 100.0% LLC Coca-Cola HBC Eurasia ................................................................Russia 100.0% 100.0% 100.0% MTV West Kishinev Bottling Company S.A. ................................Moldova 100.0% 100.0% 100.0% Multon Z.A.O. Group(1) (9)................................................................Russia 50.0% 50.0% 50.0% Nigerian Bottling Company Ltd (10) ........................................................Nigeria 100.0% 100.0% 66.4% Panpak Limited(11) ...................................................................................Republic of Ireland — 100.0% 100.0% SIA Coca-Cola HBC Latvia................................................................Latvia 100.0% 100.0% 100.0% Star Bottling Limited ..............................................................................Cyprus 100.0% 100.0% 100.0% Star Bottling Services Corp. ................................................................British Virgin Islands 100.0% 100.0% 100.0% Tsakiris S.A. ...........................................................................................Greece 100.0% 100.0% 100.0%

Notes to the Financial Statements (continued)
Page 47 of 48
Annual Report 2012 Coca-Cola Hellenic
% ownership
Country of registration 2012 2011 2010
UAB Coca-Cola HBC Lietuva................................................................Lithuania 100.0% 100.0% 100.0% Valser Services AG(7) ................................................................Switzerland 99.9% 99.9% — Vendit Ltd (12) ..........................................................................................Republic of Ireland 100.0% 100.0% 100.0% Yoppi Hungary Kft. ................................................................................Hungary 100.0% 100.0% 100.0%
(1) Joint arrangement.
(2) The BrewTech B.V Group of companies is engaged in the bottling and distribution of soft drinks and beer in FYROM. In 2010, 2011 and up until April 2012 Brewtech B.V. Group formed part of the Brewinvest S.A Group.
(3) CCHBC Balkan Holding BV was merged into its parent company, CC Beverages Holdings II BV, effective 14 November 2012.
(4) On 25 June 2010, the Group initiated a tender offer to purchase all of remaining shares of the non-controlling interest in Coca-Cola HBC – Srbija A.D., Zemun (‘’CCH Serbia’’). The tender offer was completed on 2 August 2010 and resulted in the Group increasing its stake in CCH Serbia to 91.2% as of 31 December 2010. In 2011, the Group acquired all the remaining interest in the subsidiary (refer to Note 28).
(5) Effective from 1 August 2012, Elxym S.A. has been renamed to “Coca-Cola HBC Greece S.A.I.C”. On 25 June 2012, CCH’s annual general meeting of shareholders approved the transfer of Greek operations’ operating assets and liabilities to Coca-Cola HBC Greece S.A.I.C, in accordance with Greek Law 2166/1993. In connection therewith, the transformation balance sheet of 31 March 2012, the respective audit report and the draft deed relating to the transaction were approved and the necessary authorisations for its execution and submission to the competent authorities were granted.
(6) During 2010, Coca-Cola Beverages A.G. was renamed to Coca-Cola HBC Switzerland Ltd.
(7) Incorporated in 2011.
(8) On September 2012, Dunlogan Limited was merged with CC Beverages Holdings II B.V.
(9) On 20 April, 2011 the Group along with TCCC, acquired through Multon Z.A.O., MS Foods UAB, a company that owns 100% of the equity of Vlanpak FE, a fruit juice and nectar producer in Belarus (refer to Note 28).
(10) On 8 June 2011, the Board of Directors of the Company’s subsidiary Nigerian Bottling Company plc (“NBC”) resolved to propose a scheme of arrangement between NBC and its minority shareholders, involving the cancellation of part of the share capital of NBC. The transaction was approved by the Board of Directors and General Assembly of NBC on 8 June 2011 and 22 July 2011 respectively and resulted in acquisition of the remaining 33.6% of the voting shares of NBC bringing the Group’s interest in the subsidiary to 100%. The transaction was completed in September 2011 (refer to Note 28).
(11) Dissolved, effective 7 March 2012.
(12) Dissolved, effective 1 January 2013.

Notes to the Financial Statements (continued)
Page 48 of 48
Annual Report 2012 Coca-Cola Hellenic
31. Joint arrangements
The Company has a joint arrangement with Heineken that is conducted through a number of legal entities, being the Brewinvest S.A. Group of companies. The Brewinvest S.A. Group of companies is engaged in the bottling and distribution of beer in Bulgaria. Brewinvest S.A. is incorporated in Greece and the Company owns 50% (2011 and 2010: 50% respectively) of its share capital. Up to April 2012 the Brewinvest SA Group of companies included the Brewtech B.V. Group of companies which is engaged in the bottling and distribution of soft drinks and beer in FYROM.
32. Post Balance Sheet Events
By virtue of a tax law that was enacted in Greece on 23 January 2013, the Greek corporate income tax rate was increased to 26% (from 20%) for accounting years starting as of 1 January 2013 onwards. This rate increase had not been substantively enacted at the balance sheet date and, therefore, is not included in the 2012 financial statements. The effect of the changes enacted by Parliament on 23 January 2013 would be to increase the deferred tax asset provided at the balance sheet date by €0.8m.
On 22 February 2013, Coca-Cola HBC AG (“CCHBC”) announced that the existing shareholders’ agreement of Kar-Tess Holding and TCCC, as well as the relationship agreement relating to Coca-Cola Hellenic entered into in connection with the acquisition of Coca-Cola Beverages plc by Hellenic Bottling Company S.A. in 2000, will terminate upon settlement of the voluntary share exchange offer and will not be renewed in relation to CCHBC.
Chairman of the Board of Directors
Chief Executive Officer
Head of Financial Reporting
George A. David Passport C 034870/95
Dimitris P. Lois I.D. AH 523991
Evangelos S. Kontogiorgis I.D. X 565769
E.C.G Licence Nr. A/34019

Annual Report 2012 Coca-Cola Hellenic
7. Published Annual Condensed Financial Statements, Notes and Information for the year
ended 31 December 2012


Annual Report 2012 Coca-Cola Hellenic
8. Information Disclosure pursuant to article 10 of Law 3401/2005

Page 1 of 5
Annual Report 2012 Coca-Cola Hellenic
Information Disclosure pursuant to article 10 of Law 3401/2005
The following announcements / notifications have been sent to the Daily Price Bulletin and are posted in the website of the Athens Stock Exchange and of the Company www.coca-colahellenic.com: Announcement / Notification Date Notification of transactions 24 December 2012 Notification of transactions 19 December 2012 Coca-Cola Hellenic Bottling Company S.A. announces the publication of supplementary
prospectus relating to the EUR 3,000,000,000 Euro Medium Term Note Programme of Coca-Cola HBC Finance B.V. 3 December 2012
Results for the nine months ended 28 September 2012 8 November 2012 Financial statements in PDF format 8 November 2012 Financial statements in PDF format 8 November 2012 Financial statements in PDF format 8 November 2012 Financial statements in PDF format 8 November 2012 Financial Statements according to IFRS 8 November 2012 Financial Statements according to IFRS 8 November 2012 Coca-Cola Hellenic Bottling Company S.A. announcement according to the provisions of
law 3556/2007 15 October 2012 Coca-Cola Hellenic Bottling Company S.A. conference call invitation for analysts and
investors for the first nine month 2012 financial results on Thursday 8 November 2012 12 October 2012 Notification of decision regarding submission of public share purchase offer in accordance
with regulatory requirements 11 October 2012 Coca-Cola Hellenic’s response to proposed voluntary share exchange offer by Coca-Cola
HBC AG 11 October 2012 Introduction of shares resulting from share capital increase following the exercise of stock
option 1 October 2012 Information pursuant to article 4 para. 2 f of law 3401/2005 regarding the admission for
listing of shares of the company pursuant to stock option plans for the company’s employees and for the employees of its affiliated companies 27 September 2012
Notification of transactions 20 September 2012 Notification of transactions 20 September 2012 Notification of transactions 20 September 2012 Notification of transactions 20 September 2012 Notification of transactions 20 September 2012 Notification of transactions 20 September 2012 Notification of transactions 20 September 2012 Notification of transactions 20 September 2012 Notification of transactions 20 September 2012 Notification of transactions 20 September 2012 Notification of transactions 20 September 2012 Notification of transactions 20 September 2012 Coca-Cola Hellenic Bottling Company S.A. responds to media comments 17 September 2012 Coca-Cola Hellenic Bottling Company S.A. announces the publication of supplementary
prospectus relating to the EUR 3,000,000,000 Euro Medium Term Note Programme of Coca-Cola HBC Finance B.V. 27 August 2012
Results for the six months ended 29 June 2012 21 August 2012 Financial statements in PDF format 21 August 2012 Financial statements in PDF format 21 August 2012 Financial statements in PDF format 21 August 2012 Financial statements in PDF format 21 August 2012 Financial statements in PDF format 21 August 2012 Notification of transactions 21 August 2012 Notification of transactions 21 August 2012 Notification of transactions 21 August 2012

Page 2 of 5
Annual Report 2012 Coca-Cola Hellenic
Announcement / Notification Date Notification of transactions 21 August 2012 Notification of transactions 21 August 2012 Notification of transactions 21 August 2012 Notification of transactions 21 August 2012 Notification of transactions 21 August 2012 Notification of transactions 21 August 2012 Notification of transactions 21 August 2012 Notification of transactions 21 August 2012 Notification of transactions 21 August 2012 Notification of transactions 21 August 2012 Notification of transactions 21 August 2012 Financial Statements according to IFRS 21 August 2012 Financial Statements according to IFRS 21 August 2012 Coca-Cola Hellenic Bottling Company S.A. announces regulatory approval of internal
corporate structure changes 1 August 2012 Coca-Cola Hellenic Bottling Company S.A. announces the change of the Company’s
distinctive title, the decrease of its share capital and the procedure for the return of capital to its shareholders 31 July 2012
Notification of transactions 20 July 2012 Notification of transactions 20 July 2012 Notification of transactions 20 July 2012 Notification of transactions 20 July 2012 Notification of transactions 20 July 2012 Notification of transactions 20 July 2012 Notification of transactions 20 July 2012 Notification of transactions 20 July 2012 Notification of transactions 20 July 2012 Notification of transactions 20 July 2012 Notification of transactions 20 July 2012 Notification of transactions 20 July 2012 Notification of transactions 20 July 2012 Notification of transactions 20 July 2012 Coca-Cola Hellenic Bottling Company S.A. announces the publication of supplementary
prospectus relating to the EUR 3,000,000,000 Euro Medium Term Note Programme of Coca-Cola HBC Finance B.V. 13 July 2012
Coca-Cola Hellenic Bottling Company S.A. schedules first half 2012 financial results and conference call date 12 July 2012
Coca-Cola Hellenic publishes its ninth CSR report and announces the completion of its water stewardship programme across its operations 28 June 2012
Coca-Cola Hellenic Bottling Company S.A. announces resolutions of the Annual General Meeting of shareholders held on 25 June 2012 25 June 2012
Notification of transactions 18 June 2012 Notification of transactions 18 June 2012 Notification of transactions 18 June 2012 Notification of transactions 18 June 2012 Notification of transactions 18 June 2012 Notification of transactions 18 June 2012 Notification of transactions 18 June 2012 Notification of transactions 18 June 2012 Notification of transactions 18 June 2012 Notification of transactions 18 June 2012 Notification of transactions 18 June 2012 Notification of transactions 18 June 2012 Notification of transactions 18 June 2012 Notification of transactions 18 June 2012 Notification of transactions 18 June 2012 Notification of transactions 18 June 2012

Page 3 of 5
Annual Report 2012 Coca-Cola Hellenic
Announcement / Notification Date Notification of transactions 1 June 2012 Coca-Cola Hellenic Bottling Company S.A. announcement according to the provisions of
law 3556/2007 1 June 2012 Notification of transactions 29 May 2012 Notification of transactions 16 May 2012 Notification of transactions 16 May 2012 Notification of transactions 16 May 2012 Notification of transactions 16 May 2012 Notification of transactions 16 May 2012 Notification of transactions 16 May 2012 Notification of transactions 16 May 2012 Notification of transactions 16 May 2012 Notification of transactions 16 May 2012 Notification of transactions 16 May 2012 Notification of transactions 16 May 2012 Notification of transactions 16 May 2012 Notification of transactions 16 May 2012 Notification of transactions 16 May 2012 Notification of transactions 16 May 2012 Notification of transactions 16 May 2012 Coca-Cola Hellenic Bottling Company S.A. announces the publication of supplementary
prospectus relating to the EUR 3,000,000,000 Euro Medium Term Note Programme of Coca-Cola HBC Finance B.V. 14 May 2012
Financial statements in PDF format 10 May 2012 Financial statements in PDF format 10 May 2012 Financial statements in PDF format 10 May 2012 Financial statements in PDF format 10 May 2012 Results for the three months ended 30 March 2012 10 May 2012 Results for the three months ended 30 March 2012 10 May 2012 Financial Statements according to IFRS 10 May 2012 Financial Statements according to IFRS 10 May 2012 Coca-Cola Hellenic announces proposal for a capital return of €0.34 per share and other
transactions 9 May 2012 Coca-Cola Hellenic Bottling Company S.A. announces revised 2012 Financial Calendar 9 May 2012 Coca-Cola Hellenic Bottling Company S.A. proposes amendments to articles 1 and 3 of its
Articles of Association 9 May 2012 Invitation to the Shareholders of the Societe Anonyme under the trade name “COCA-
COLA HELLENIC BOTTLING COMPANY S.A.” to an Annual General Meeting 9 May 2012 Notification of transactions 19 April 2012 Notification of transactions 19 April 2012 Notification of transactions 19 April 2012 Notification of transactions 19 April 2012 Notification of transactions 19 April 2012 Notification of transactions 19 April 2012 Notification of transactions 19 April 2012 Notification of transactions 19 April 2012 Notification of transactions 19 April 2012 Notification of transactions 19 April 2012 Notification of transactions 19 April 2012 Notification of transactions 19 April 2012 Notification of transactions 19 April 2012 Notification of transactions 19 April 2012 Coca-Cola Hellenic Bottling Company S.A. announces the publication of supplementary
prospectus relating to the EUR 3,000,000,000 Euro Medium Term Note Programme of Coca-Cola HBC Finance B.V. 11 April 2012
Coca-Cola Hellenic Bottling Company S.A. conference call invitation for analysts and investors for the first three month 2012 financial results on Thursday 10 May 2012 10 April 2012

Page 4 of 5
Annual Report 2012 Coca-Cola Hellenic
Announcement / Notification Date Coca-Cola Hellenic Bottling Company S.A. announces filings with the U.S. Securities and
Exchange Commission 2 April 2012 Coca-Cola Hellenic Bottling Company S.A. announces effective date of Chief Financial
Officer succession 2 April 2012 Coca-Cola Hellenic Bottling Company S.A. announces internal corporate structure
changes 28 March 2012 Financial statements in PDF format 23 March 2012 Financial statements in PDF format 23 March 2012 Financial statements in PDF format 23 March 2012 Financial statements in PDF format 23 March 2012 Coca-Cola Hellenic Bottling Company S.A. announces filings with Hellenic Capital
Market Commission 23 March 2012 Financial Statements according to IFRS 23 March 2012 Financial Statements according to IFRS 23 March 2012 Financial Statements according to IFRS 23 March 2012 Financial Statements according to IFRS 23 March 2012 Introduction of shares resulting from share capital increase following the exercise of stock
option 20 March 2012 Introduction of shares resulting from share capital increase following the exercise of stock
option 19 March 2012 Notification of transactions 16 March 2012 Notification of transactions 16 March 2012 Notification of transactions 16 March 2012 Notification of transactions 16 March 2012 Notification of transactions 16 March 2012 Notification of transactions 16 March 2012 Notification of transactions 16 March 2012 Notification of transactions 16 March 2012 Notification of transactions 16 March 2012 Notification of transactions 16 March 2012 Notification of transactions 16 March 2012 Notification of transactions 16 March 2012 Notification of transactions 16 March 2012 Notification of transactions 16 March 2012 Notification of transactions 16 March 2012 Information pursuant to article 4 para. 2 f of law 3401/2005 regarding the admission for
listing of shares of the company pursuant to stock option plans for the company’s employees and for the employees of its affiliated companies 8 March 2012
Notification of transactions 5 March 2012 Notification of transactions 5 March 2012 Notification of transactions 1 March 2012 Notification of transactions 16 February 2012 Notification of transactions 16 February 2012 Notification of transactions 16 February 2012 Notification of transactions 16 February 2012 Notification of transactions 16 February 2012 Notification of transactions 16 February 2012 Notification of transactions 16 February 2012 Notification of transactions 16 February 2012 Notification of transactions 16 February 2012 Notification of transactions 16 February 2012 Notification of transactions 16 February 2012 Notification of transactions 16 February 2012 Notification of transactions 16 February 2012 Results for the year ended 31 December 2011 15 February 2012 Results for the year ended 31 December 2011 - REVISION 15 February 2012 Coca-Cola Hellenic Bottling Company S.A. announces the financial calendar of 2012 15 February 2012

Page 5 of 5
Annual Report 2012 Coca-Cola Hellenic
Announcement / Notification Date Coca-Cola Hellenic Bottling Company S.A. announcement according to the provisions of
law 3556/2007 25 January 2012 Coca-Cola Hellenic Bottling Company S.A. conference call invitation for analysts and
investors for the 2011 full year financial results on Wednesday 15 February 2012 19 January 2012 Notification of transactions 18 January 2012 Notification of transactions 18 January 2012 Notification of transactions 18 January 2012 Notification of transactions 18 January 2012 Notification of transactions 18 January 2012 Notification of transactions 18 January 2012 Notification of transactions 18 January 2012 Notification of transactions 18 January 2012 Notification of transactions 18 January 2012 Notification of transactions 18 January 2012 Notification of transactions 18 January 2012 The annual financial statements, the audit reports of the independent auditors and the Board of Directors reports of the subsidiary companies that prepare financial statements in accordance with the International Financial Reporting Standards can be found on the Company’s website www.coca-colahellenic.com.