coca-cola jeffery morse brandman university · financial analysis project – final paper 3...
TRANSCRIPT

RUNNING HEAD: FINANCIAL ANALYSIS PROJECT – FINAL PAPER 1
Financial Analysis Final
Coca-Cola
Jeffery Morse
Brandman University
Author Note
For correspondence concerning this paper, Jeffery Morse can be reached at
FINANCIAL ANALYSIS PROJECT – FINAL PAPER 2
Financial Analysis Final Coca-Cola
Purpose of Analysis
In describing this firms industry and specific lines of business one must realize that firms,
themselves, have value and this value needs to be understood by the managers of said firm. The
purpose of this paper is to prepare a Financial Statement Analysis that demonstrates a business’s
model and strategy in its environment; to analyze the sustainability of the profits generated by
that strategy. The content of the firm’s annual report and other business operations reports will
provide data through which application of financial analysis techniques will be performed. This
data is available in Appendix 1 and will as linked in the references (Coke, 2017). Specific
analysis techniques include vertical, horizontal, and trend analysis will be used. These will
evaluate business performance through ratio analysis aside industry comparison. One of the final
goals of this paper will be to provide an analysis sufficiently detailed for one to decide
investment is wise. Understanding the risk and profitability a company represents may be shown
through any of the reported financial information in their respective areas. With this is mind,
annual reports play a vital role in the identification of overall performance. Lastly, this paper
may be seen as an extension of a previous paper written by Jennifer M. Harding (2014) who used
the same company, however, the time frame of her paper was 2011-2013 and different topics
were addressed. This paper will analyze Coca-Cola, from years 2013 thru 2016 alongside of
PepsiCo. Coca-Cola, one of the most recognizable brands in the world and a firm with much
history, was selected due to the overabundance of available data online. This is a popular
company; it’s popularity was not so much spurned by the product but by the brilliant marketing
of the firm. From the “I’d like to buy the world a coke” theme song, to mean Joe Green

FINANCIAL ANALYSIS PROJECT – FINAL PAPER 3
becoming a softy for a coke, marketing strategies have made Coca-Cola the largest beverage
company in the world (CNBC, 2009). “So have a Coke and a smile.”
Business Strategy
Company Background and History
An American multinational beverage corporation Coca-Cola is a manufacturer, marketer,
and retailer of soft drinks and concentrated syrups. Further, Coca Cola’s distribution centers
partner with several other companies in need of product dissemination. Coca-Cola’s inventor
was John Stith Pemberton, known as "Doc" Pemberton, a pharmacist presiding in Columbus
Georgia. The plan was to add caffeine and cocaine into a soft drink. It is said that Doc had
incurred a sword injury while in battle which required medication. This lead to the soft drink we
know today which then was dispersed from a fountain (Allen, 2005). Little was it understood
that they would fulfill an edict set forth by--George I Louis--Duke of Saxony in 1705-1727 who
ordered the alchemist Bӧtgen to change lead to gold (Grabbe, 1942). In 1889 the Coca-Cola
brand was bought by Asa Griggs Candler from the “Doc” as a result of his impending death. Mr.
Griggs incorporated Coca-Cola Company in 1892 and by the turn of the century was claimed to
be the richest man in Atlanta (Pendergrast, 2013). The company model was a franchised bottling
system dating from 1889 when Mr. Griggs thought there no money to be had in the bottling of
the product. However, soon when the bottled version outsold the fountain it was thought that a
poor business decision was made (CNBC, 2009). As a result, when economic hardship began to
fall upon franchised bottling companies Coke began purchasing up franchises and today owns
over 35% of its own bottling companies. Muhtar A. Kent is currently the Chairman and Chief
Executive Officer (CEO) of The Coca-Cola Company. Kent feels that Coke has a historical
heritage in the US and is working to reclaim its position. Using marketing research he is

FINANCIAL ANALYSIS PROJECT – FINAL PAPER 4
returning to the “former things that worked well” like the iconic bottle shape. It is estimated that
the return to the shape alone produced a one million bottle increase in sales (CNBC, 2009).
Major Operations
Because of the remaining 17 main bottling franchises in U.S Coca-Cola does not own or control
all of their bottling franchises. From a legal or managerial perspective, the company is not a
single entity. Though the brand "Coca-Cola," makes a singular appearance in actuality bottling is
done through multiple local channels to keep it as close to the consumer as possible. Coca-Cola
itself began only selling concentrates for its core products—70% of which is in the sparkling
water category. Coca-Cola’s partners used to manufacture, bottle, merchandise and distribute
Coca-Cola branded beverages to customers. At the same time, these distributors delivered all the
non-carbonated pre-bottled items such as vitamin water and smart water which the company
recently purchased for 4.2 billion dollars (CNBC, 2009).
Distribution
Coca-Cola’s portfolio includes an amazing assortment of brands. These brands include
Vitamin Water, Smart Water, Fanta, Sprite, Powerade, Minute Maid, Simply, Monster brands, as
well as all the Coca-Cola, labeled diet drinks, and flavored versions. Over 500 brands in total--70
in the U.S. alone (CNBC, 2009). On July 23, 2016, Pepsi announced that it was teaming up with
Starbucks in a distribution venture to seize the growing cold coffee movement (Starbucks.com,
2016). As a result in 2017, Coca-Cola announced that it had teamed up with Duncan Donuts in
their 2.3 billion dollar profitable ready-to-drink coffees venture (Coke, 2017). The world’s
largest beverage distribution system, consumers in 206 countries will enjoy ready-to-drink
coffees with the same availability they enjoy Coca-Cola—which is at a rate of 1.9 billion
servings or 100 million gallons every day (CNBC, 2009; Profile, 2014).

FINANCIAL ANALYSIS PROJECT – FINAL PAPER 5
Beverages bearing the trademarks "Coca-Cola" or "Coke" account for approximately
73% of total sales (Appendix 3). According to the 2016 Coca-Cola at a glance page, Coca-Cola
had the following sales:
20% in North America
28% in Latin America
29% Europe, Middle East, and Africa
23% in Asia Pacific
In 2010, it was publicized that Coca-Cola had become the first brand to top £1 billion in annual
UK sales (Harding, 2014). As a result of Cokes resilience and progress orientated vision, Coke is
the best-selling soft drink in countries like Africa where being a vendor could be the difference
between life or death. As a result of such efforts, Coca-Cola was recognized in 2010 as the
number one global brand (Harding, 2014). In the Middle-East Pepsi-Cola is holding 75% of the
market share, but Coke is still a contender with 25% and also enjoyed double-digit growth in
2003 (Profile,2014). Cokes downfall started with the “Pepsi Challenge” which heralded Coca-
Cola’s greatest blunder--namely changing the formula in 1985 (CNBC, 2009). In way of
competitors, in Scotland, the locally produced Irn-Bru was more popular than Coke 2005.
However, figures show that both Coca-Cola and Diet Coke are now outselling all competitors
there. Peru has a similar story. Inca Kola in times past had been the popular choice. This
prompted Coca-Cola to enter in negotiations with Inca resulting in a purchase of approximately
20% of its stakes in 1999 (Times, 1999). Currently, that figure has risen to about 50% (Harding,
2014). Japan likes its tea and coffee more than soft drinks, however, their best selling brand,
Georgia, is included as one of the 500 brands owned by Coca-Cola.
Coca-Cola has been a publicly traded since 1919 according to annual reports in

FINANCIAL ANALYSIS PROJECT – FINAL PAPER 6
Appendix 1. At that time the price was $40 per share. If all dividends were reinvested that share
would be worth an amount above $9.8 million dollars. One of the 30 stocks which makes up the
Dow Jones list, which is commonly referenced as the performance stock of the stock market,
Coca-Cola claimed this fame in 1987, 1932 and 1935 (Harding, 2014). Coca-Cola has paid
increasing dividends each year congruently for 49 years (Appendix 1; Company Records,
2). Stock can be purchased through Computershare Trust Company.
In the way of description it is thought the best definition is offered by Coke in it's 2016
10k which states, “We make our branded beverage products available to consumers throughout
the world through our network of Company-owned or -controlled bottling and distribution
operations as well as independent bottling partners, distributors, wholesalers, and retailers — the
world's largest beverage distribution system. Beverages bearing trademarks owned by or licensed
too Coke account for more than 1.9 billion of the approximately 59 billion servings of all
beverages consumed worldwide every day”(Coke, 2017).
The risks facing this company are many. It is beyond the purview of this paper to address
them all. Some of the risks addressed are Obesity and other health concerns, the fluctuation of
foreign currency, increase in the cost, disruption of the supply of fuels, inability to achieve
overall long-term growth objectives, global credit market conditions, default by or failure of one
or more of counterparty financial institutions. Mostly these topics will be addressed during
separate parts of this analysis—for now, the following is offered.
Obesity and other health concerns remain at the top of the list for Coke. Governmental
regulations regarding the packaging, marketing, and labeling of sugar-sweetened beverages
affect the overall profitability of sugar based products. In addition, obesity in the US has
spurned negative publicity for the products of Coca-Cola.

FINANCIAL ANALYSIS PROJECT – FINAL PAPER 7
In 2014 thru 2016 hyperinflation has been occurring in Venezuela (Coke, 2017; Insider,
2017). This and other fluctuations in foreign currency has brought financial hardship toward
Coca-Cola. This resulted in a capital source change that may result in the end of the firm. In turn,
this will also have an effect on global credit and may even result in default or failure of one or
more of Cokes counterparties.
The increase in the cost of fuel is a major player for coke as it is the biggest distribution
platform worldwide. Higher fuel prices mean higher costs and lower profits for a company that
is already struggling to pay its bills.
Failure to meet its growth projections may result in the selling off of capital and assets in
order to stay afloat. In an economic current, a firm must have forward momentum in order to
just remain—the alternative is being swept away by the current. As a result, Coca- Cola
purchased major shares in Monster and Keurig. The purchase of two major brand names
increases the debt-equity ratio severely. These and the other topic will be addressed as this
analysis goes forward. The question of why the firms return on equity will or will not revert to its
cost of capital will also be addressed.
Nonalcoholic Drink Industry Defined
Nonalcoholic drinks or beverages are basically any drink that has no alcohol. Bottling
facilities are those companies that bottle, package, and distribute beverages; "bottling facilities
differ in the types of bottling lines they operate and the types of products they can run" (Sharma,
2014). Other bits of required information include the knowledge if said beverage is canned or
bottled, hot-fill or cold-fill, and natural or conventional. Innovations in the beverage industry,
non-alcoholic beverages are mostly catalyzed by requests. This is done on location at the plant.
Also included in this category are processing, packing, and beverage plants (Sharma, 2014).

FINANCIAL ANALYSIS PROJECT – FINAL PAPER 8
Accounting
Competition: Many of Cokes competitors were mentioned above. In further definition,
Coca-Cola competes with others in the nonalcoholic segment of the commercial beverages
industry. This segment is highly competitive. These include firms like Pepsi-Cola who competes
in multiple geographic areas. Pepsi products include non-alcoholic sparkling beverages; water
products, flavored and enhanced water products; fruit drinks and diluties and several other
products (Profile, 2014). A short list of other competitors is Kraft Foods Inc, Nestlé, Snapple
Group, Inc. Groupe Danone. and Dr. Pepper to name a few (Profile, 2014).
Competitive factors for these areas include programs pricing, advertising, product
innovation, production techniques, new packaging, and vending (Coke, 2017, Appendix 1,3).
The competitive strengths for Coke are historical value, 20 billion dollar brands, a worldwide
network for distribution and bottling. Coca-Cola’s competitive challenges include a strong
competition in all the world, but the growing change in food preference and health iconify the
hurdle that appears to be its largest. With the growing trend of health, and soft drinks being
vilified as a culprit of poor health Coke is forced to grow into other markets such as Vita Coco—
a 100% pure coconut water drink (CNBC, 2009; Company records, 2). Out of Cokes competitor
PepsiCo is thought to be its main rival, as such, this analysis compares the two.
Accounting: In an analysis of this firm’s accounting a reflection of the underlying
business reality is exposed. The reality is this firm is under attack by several culprits. With the
changing tastes of the world from sugar based beverages to health—a trend that is only going to
increase, the added fluctuations of world currency heralding the end of Coke, there is the
addition of the financial times reported restructuring of Coca-Cola (structure, 2017). The plan
now is for Coke to produce its own product –not just the syrup—and distribute it through six
FINANCIAL ANALYSIS PROJECT – FINAL PAPER 9
main bottling companies (Times, 2014). This has produce further financial hardship and resulted
in the loss of jobs for many employed by Coke. In addition to all this, Coke has a reported $587
million dollars in off-balance debt (Coke, 2017). VIE’s are the reported source. Compiling the
debt, is the acquisition of Monster and Keurig along with the team up with Duncan brings in off-
balance debt yet to be seen. Also, the former enduring business model still is active in places
throughout the world. Lawsuits resulting from vendor inefficiencies have price tags for Coke that
have yet to be announced. This may be one of many reasons this firm is in restructuring mode.
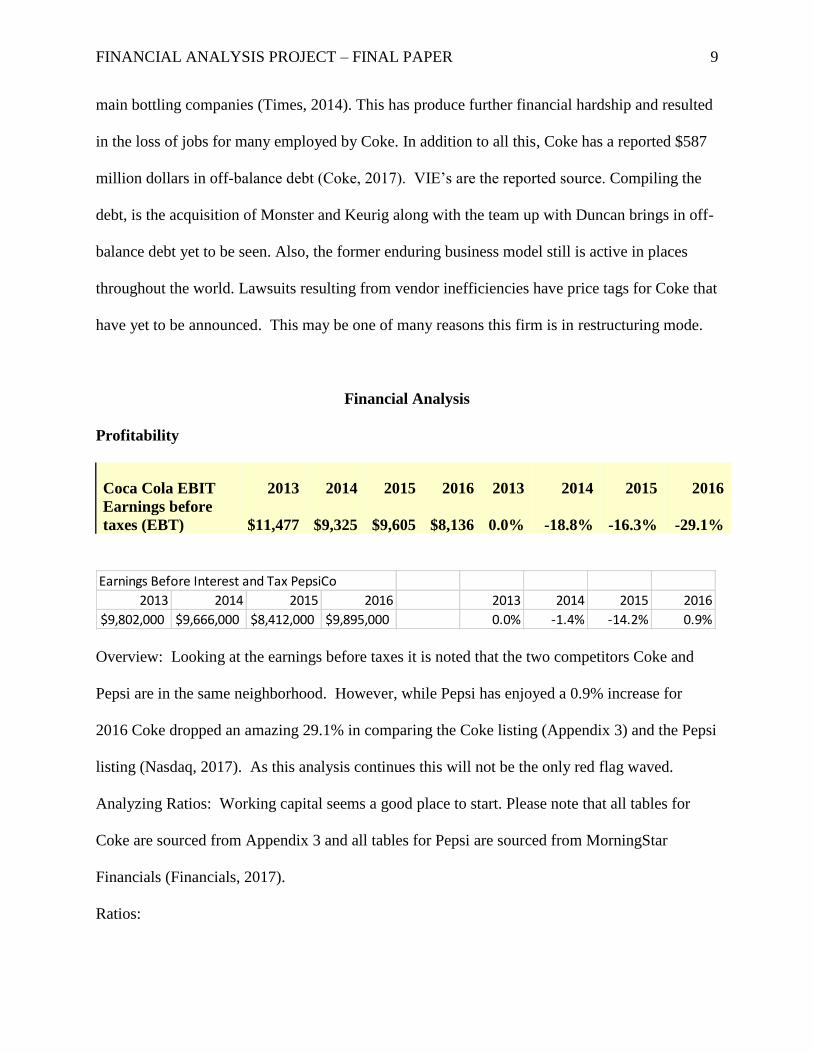
Financial Analysis
Profitability
Coca Cola EBIT 2013 2014 2015 2016 2013 2014 2015 2016
Earnings before
taxes (EBT) $11,477 $9,325 $9,605 $8,136 0.0% -18.8% -16.3% -29.1%
Overview: Looking at the earnings before taxes it is noted that the two competitors Coke and
Pepsi are in the same neighborhood. However, while Pepsi has enjoyed a 0.9% increase for
2016 Coke dropped an amazing 29.1% in comparing the Coke listing (Appendix 3) and the Pepsi
listing (Nasdaq, 2017). As this analysis continues this will not be the only red flag waved.
Analyzing Ratios: Working capital seems a good place to start. Please note that all tables for
Coke are sourced from Appendix 3 and all tables for Pepsi are sourced from MorningStar
Financials (Financials, 2017).
Ratios:
Earnings Before Interest and Tax PepsiCo
2013 2014 2015 2016 2013 2014 2015 2016
$9,802,000 $9,666,000 $8,412,000 $9,895,000 0.0% -1.4% -14.2% 0.9%

FINANCIAL ANALYSIS PROJECT – FINAL PAPER 10
Working capital
Working Capital is a measure of both short-term financial health and efficiency. Working
capital is abbreviated WC and represents operating liquidity.
Working capital = current assets – current liabilities
Working capital is reported to be improving from 2011-2013 in Ms. Hardings Paper,
however, in this analysis, those numbers seem incorrect. WC for Coke suffered a major
slump in 2014 but has been on the rise since.
2016 2015 2014 2013
Working Capital 7478.00 6466.00 612.00 3493.00
Current ratio
The Current ratio indicates whether a company has sufficient current assets to cover current
liabilities. The formula for the current ratio is:
Current ratio=Current Assets/Current Liabilities
Coca-Cola’s current ratio from 2011-13 was increasing.
Current ratio 2011=1.05, 2012=1.09, 2013=1.13 (Harding, 2014).
This paper finds this continuing to increase.
2016
2015 2014 2013
Current Ratio Coke 1.28
1.24 1.02 1.13
Liquidity/Financial Health PepsiCo 2016 2015 2014 2013
Current Ratio 1.28 1.31 1.14 1.24
Since the industry average is 1 the firm seems to be over-performing in its industry and is
currently in a dead heat with its competitor.

FINANCIAL ANALYSIS PROJECT – FINAL PAPER 11
Quick ratio
The quick ratio indicates whether a firm has sufficient quick assets to cover current
liabilities. A quick ratio of 1.5 means that a company has $1.50 of liquid assets for each $1
of current liabilities. The higher the quick ratio, the better the company's position.
Quick ratio = (current assets – inventories) / current liabilities, or
= (cash and equivalents + marketable securities + AR) / current liabilities
Ms. Harding found Quick ratio 2011=0.92 2012= 0.97 2013=1
This analysis found
2016 2015 2014 2013
Quick Ratio Coke 0.84 0.74 0.67 0.73
2.1
Cash + Marketable Securities + Short term
Recievables / Current Laibilites
Liquidity/Financial Health Pepsi 2016 2015 2014 2013
Quick Ratio 1.08 1.03 0.85 0.93
Coca-Cola’s quick ratio is still improving after the 2014 drop. The firm's overall
performance is high compared to the industrial average of 0.59. Since a higher ratio is better
it seems Pepsi is outperforming Coke in the quick ratio test.
Receivable Turnover
Receivable turnover indicates how many times receivables are collected in a given period.
Accounts receivable turnover = Net Credit Sales / Average Accounts Receivable
Harding reported an increase for 2011-2013
Accounts receivable turnover 2011=9.46 2012=10.09 2013=9.62
2016 2015 2014 2013

FINANCIAL ANALYSIS PROJECT – FINAL PAPER 12
Receivables Turn Over
Ratio 10.74 10.54 9.85 9.62
Pepsico 2016 2015 2014 2013
Receivables Turn Over 11.21 11.15 11.12 10.86
For 2013-2016 things are slowing. The ratio is increasing even through the slump of 2014
and is about the industry average of 9.32. Further, Pepsico is outperforming Coke here, since
a higher number indicates better efficiency. One might think Coca Cola should be higher
than Pepsico as they have much more debt, since is not the case it could indicate this is an
area of concern.
Average collection period
ACP indicates how many days it takes on average to collect on credit sales. ACP is
calculated: Average Collection Period = (Days x AR) / Credit Sales
Average collection period 2011=38.58 2012=36.18 2013=37.96 Improving
2016 2015 2014 2013
Average Collection Period 34.0 34.6 37.1 37.9
2016 2015 2014 2013
Average Collection Period
Pepsico
39 37 36 38
The average collection period was improving from 2011-2013 according to Harding.
This analysis also shows continued improvement showing a 4.5 point drop from 2011.
Albeit, the industry average of 31.2 is still not met. This could be due to its emphasis on
syrup distribution instead of bottling the product. On the flip side, Coke is outperforming
PepsiCo here.
FINANCIAL ANALYSIS PROJECT – FINAL PAPER 13
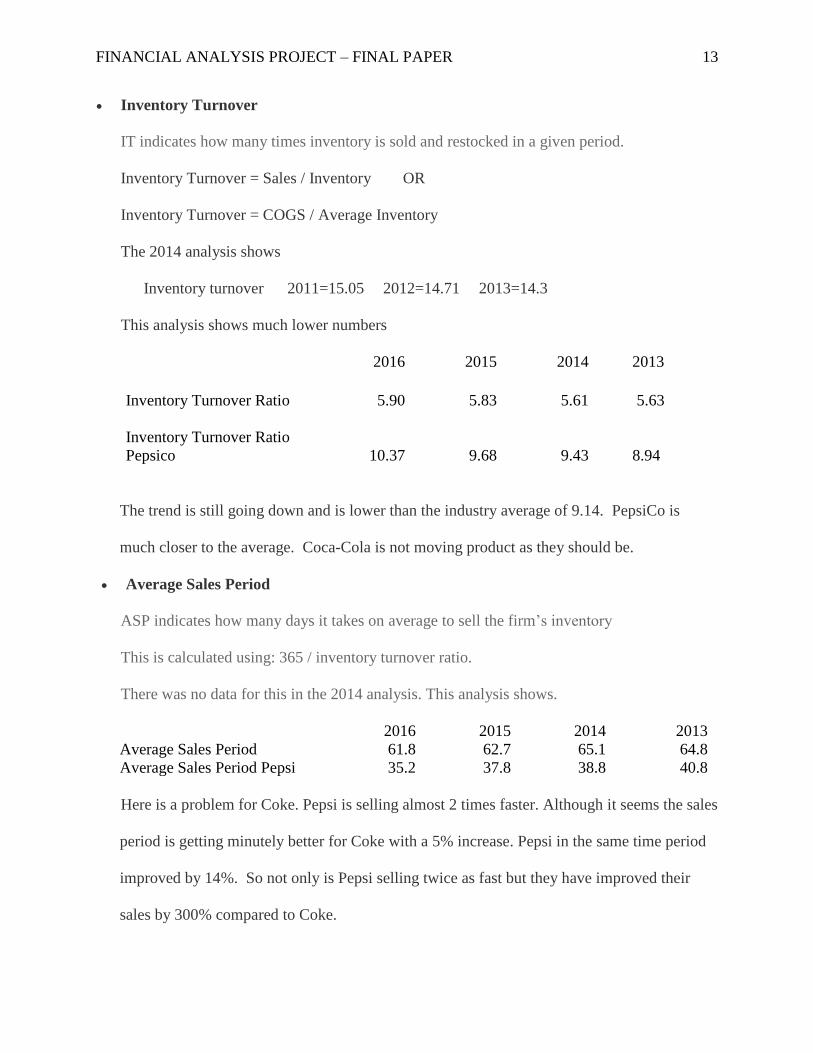
Inventory Turnover
IT indicates how many times inventory is sold and restocked in a given period.
Inventory Turnover = Sales / Inventory OR
Inventory Turnover = COGS / Average Inventory
The 2014 analysis shows
Inventory turnover 2011=15.05 2012=14.71 2013=14.3
This analysis shows much lower numbers
2016 2015 2014 2013
Inventory Turnover Ratio 5.90 5.83 5.61
5.63
Inventory Turnover Ratio
Pepsico 10.37 9.68 9.43
8.94
The trend is still going down and is lower than the industry average of 9.14. PepsiCo is
much closer to the average. Coca-Cola is not moving product as they should be.
Average Sales Period
ASP indicates how many days it takes on average to sell the firm’s inventory
This is calculated using: 365 / inventory turnover ratio.
There was no data for this in the 2014 analysis. This analysis shows.
2016 2015 2014 2013
Average Sales Period 61.8 62.7 65.1 64.8
Average Sales Period Pepsi 35.2 37.8 38.8 40.8
Here is a problem for Coke. Pepsi is selling almost 2 times faster. Although it seems the sales
period is getting minutely better for Coke with a 5% increase. Pepsi in the same time period
improved by 14%. So not only is Pepsi selling twice as fast but they have improved their
sales by 300% compared to Coke.

FINANCIAL ANALYSIS PROJECT – FINAL PAPER 14
Debts to Assets Ratio
DAR indicates the percentage of assets funded by creditors. Nothing was reported in the
Harding analysis for 2011-2013. DAR= liabilities / total assets.
This analysis shows
2016 2015 2014 2013
Debt Ratio (debt to assets) 73.39% 71.37% 66.79% 62.87%
Debt Ratio Pepsi 84.83% 82.89% 75.27% 68.66%
Coke is borrowing more and more this ratio is very high. However, Pepsi is in a higher Debt
ratio than Coke. This trend is worrisome and foretells possible bankruptcy.
Debt to Equity
DE indicates the amount of debt incurred for each dollar that owners provide. This may
indicate what the company is using to finance its assets.
The 2014 analysis shows using this formula
Debt/Equity Ratio = Total Liabilities / Stockholder’s Equity
Ratio of Liabilities to S.E. 2011=136% 2012=145% 2013=151%
This analysis shows
2016 2015 2014 2013
Debt to Equity 275.84% 249.31% 201.11% 169.30%
Debt-Equity
Pepsi 278.41% 252.56% 203.51% 171.47%
This is a bit higher than what the 2014 analysis shows. In any case, this is not good.
Since the debt/equity ratio of Coca-Cola = 277%, for every dollar that shareholders
own Coca-Cola owes $2.77 to creditors. This percentage is a black hole as the company
increasingly underperforms and barrows. Bankruptcy is becoming more of a reality. The

FINANCIAL ANALYSIS PROJECT – FINAL PAPER 15
industry average is 133.61%. Both companies are over double that. Pepsi is also gaining risk
as they are climbing higher than Coke.
Ratio of fixed assets to long-term liabilities
The fixed assets to long-term liabilities ratio is a solvency measurement. When long-term
debts are secured with fixed assets creditors show interest in this proportion. It is found by
dividing fixed assets by long-term debt.
Ratio = Fixed assets / long-term liabilities.
The Harding analysis shows.
Fixed assets to L.T. liabilities 2011=2.86 2012=2.76 2013=2.6
This analysis shows
2016 2015 2014 2013
fixed assets to long term debt 35.83% 44.25% 76.76% 78.14%
Same for Pepsi 55.20% 55.86% 72.39% 76.34%
The discrepancy must be from a different method or formula. This ratio has been improving
for Coca-Cola. The firm seems to be already selling off fixed assets. While the numbers are
improving, in the long run they will run out of fixed assets to cover their large debts. In
comparison with Pepsi Coke is outperforming.
Profit Margin Ratio
PMR indicates the profit generated for each dollar in net sales.
Net profit margin = Net income / net sales
By dividing net profit by total revenue then showing a percentage of revenue the bottom line
is much easier to see. Here the 2014 analysis compared to the 2017 analysis a continued
decreasing trend.

FINANCIAL ANALYSIS PROJECT – FINAL PAPER 16
Profit Margin Ratio 2011=25.30% 2012= 26.90% 2013=28.40%
This analysis is
2016 2015 2014 2013
Profit Margin 20.61% 19.70% 21.11% 21.83%
Operating Margin Pepsi 15.6% 13.2% 14.4% 14.6%
Once again a discrepancy is shown in the Harding data. However, this analysis data was
checked with Morningstar financials and are correct. Some very interesting outcomes include
the fact that though Coke has a much higher profit margin than Pepsi their margin has been
falling. In opposition, Pepsi’s margin is lower but is on the rise. According to Harding, the
industry average is 18%. Pepsi is not making the average. Coke, however, is still
comfortably about the average.
Gross profit margin
GPM is a financial measure that indicates the gross margin generated for each dollar in net
sales. GPM has this formula.
Gross Profit Margin = Gross Margin / Net Sales Or (Revenues-COGS)/Revenue
The 2014 analysis gives
Gross profit margin 2011=61.20% 2012=60.90% 2013=61.20%
This analysis gives
2016 2015 2014 2013
Gross Profit Margin 60.67% 60.53% 61.11% 60.68%
Gross Margin Pepsi 53.0% 53.2% 54.4% 55.1%
Another discrepancy in the Harding Data, data according to Morningstar is: 60.9, 60.3, and
2013 is 60.7. This data confirms this analysis and shows errors in Hardings data.
FINANCIAL ANALYSIS PROJECT – FINAL PAPER 17
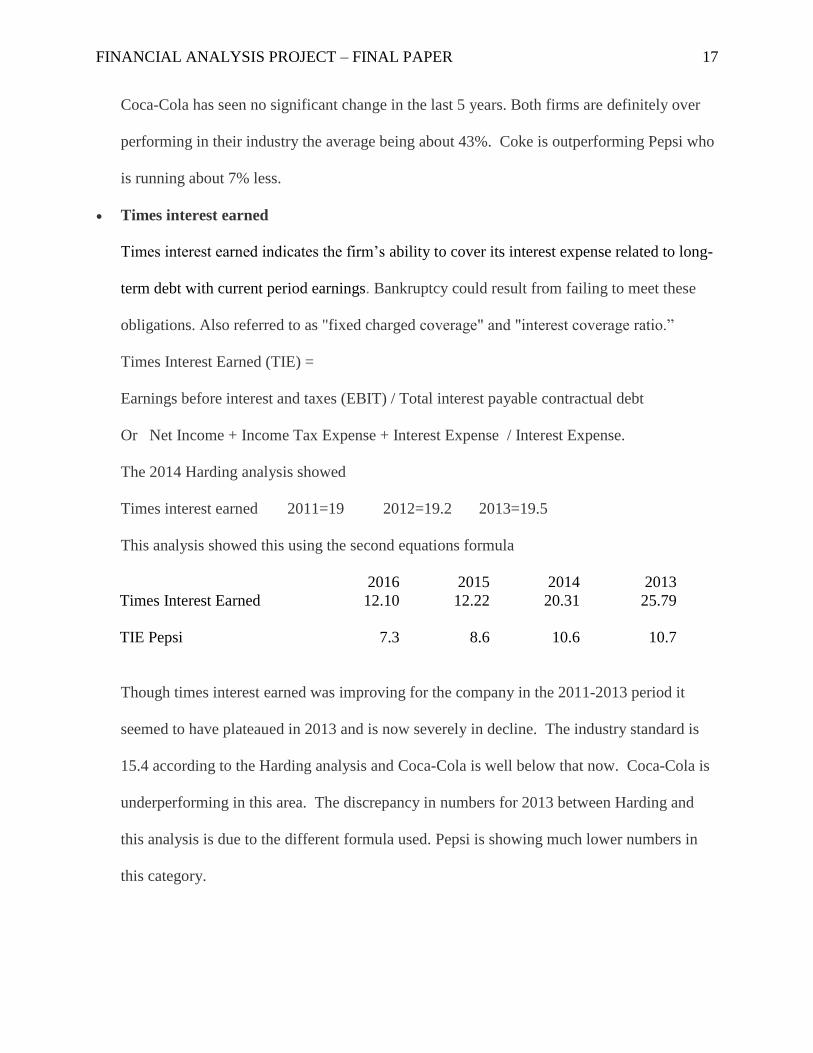
Coca-Cola has seen no significant change in the last 5 years. Both firms are definitely over
performing in their industry the average being about 43%. Coke is outperforming Pepsi who
is running about 7% less.
Times interest earned
Times interest earned indicates the firm’s ability to cover its interest expense related to long-
term debt with current period earnings. Bankruptcy could result from failing to meet these
obligations. Also referred to as "fixed charged coverage" and "interest coverage ratio.”
Times Interest Earned (TIE) =
Earnings before interest and taxes (EBIT) / Total interest payable contractual debt
Or Net Income + Income Tax Expense + Interest Expense / Interest Expense.
The 2014 Harding analysis showed
Times interest earned 2011=19 2012=19.2 2013=19.5
This analysis showed this using the second equations formula
2016 2015 2014 2013
Times Interest Earned 12.10 12.22 20.31 25.79
TIE Pepsi 7.3 8.6 10.6 10.7
Though times interest earned was improving for the company in the 2011-2013 period it
seemed to have plateaued in 2013 and is now severely in decline. The industry standard is
15.4 according to the Harding analysis and Coca-Cola is well below that now. Coca-Cola is
underperforming in this area. The discrepancy in numbers for 2013 between Harding and
this analysis is due to the different formula used. Pepsi is showing much lower numbers in
this category.

FINANCIAL ANALYSIS PROJECT – FINAL PAPER 18
Return on assets (ROA)
ROA indicates how much net income was generated from each dollar in average assets
invested. Both current and fixed assets are considered. The lower the total asset turnover
ratio the slower firm's sales are. The formula is:
Total asset turnover = Net Sales/Total Assets = # Times.
The 2014 analysis shows
Total asset turnover 2011=1.58 2012=1.56 2013=1.52
This analysis shows
2016 2015 2014 2013
Total Asset Turnover
(return on assets) 0.48 0.49 0.50 0.52
Asset Turnover Pepsi 0.87 0.90 0.90 0.87
Once again a discrepancy. As a result, conformation of the 2016 figures was made with
“Stock-analysis-on-net” (stock, 2017) and they match. It seems a “1” was unintentionally put
in front of the ratio in the 2014 analysis. The industry average is about 0.76 which is well
above the Coca-Cola ratios. Coke has been in decline for 5 years now. Numbers in 2011
were .58 and in 2016 they were .48.
There seems to be a problem with one or more of the items or categories comprising total
assets - inventory, receivables, or fixed assets. Coke is underperforming. Pepsi is above the
industry average and is neither in decline or increase.
Return on total shareholder’s equity (return on equity)
ROE is a ratio of shareholders equity to net income. This is a measure of a corporation's
profitability. It reveals the profit a company generates through money the shareholders have
invested. The formula is:

FINANCIAL ANALYSIS PROJECT – FINAL PAPER 19
Return on Equity = Net Income/Shareholder's Equity
2014 analysis shows
Rate earned on total S.E. 2011=27% 2012=27% 2013=26%
This analysis shows
2016 2015 2014 2013
Return on Total SH Equity 28.40% 28.83% 23.50% 26.00%
Return on Equity Pepsi 58.68% 37.24% 31.24% 28.96%
Coca-Cola was in decline until 2014 the shot up drastically. Unfortunately, since the
industry standard reported by Harding is 36% Coke is still underperforming in its industry.
However, PepsiCo has been above average for 2015 and 2016. In 2016 there seems to be a
22% increase. This is almost double what Coke is showing.
Return on common shareholder’s equity
This indicates how much net income was generated from each dollar of common
shareholders’ equity. Rate earned on common stockholder’s equity =
(Net income - preferred dividends) / average common stockholders' equity.
It should be noted that Coca-Cola is reporting no preferred outstanding stock. Therefore the
equation is reduced to Net income / average common stockholders' equity.
The 2014 analysis shows
Rate earned on common S.E. 2011=42% 2012=42% 2013=42%
This analysis shows
2016 2015 2014 2013
Return on Common SH
Equity 26.95% 26.37% 22.44% 26.15%

FINANCIAL ANALYSIS PROJECT – FINAL PAPER 20
The discrepancy is no doubt due to the lack of preferred stock.
There seems to be a slight increase but when compared to the industry average of 63% Coke
is severely underperforming here. Since this is dealing with how much investors make this is
bad news. Since there is no preferred stock there is no comparison needed.
Earnings per share on common stock
EPS indicates how much net income was earned for each share of common stock. Earnings
per share is an indicator of profitability and are calculated as:
(Net income – Dividends on preferred stock) / weighted average common shares outstanding
OR
(Net income – Dividends on preferred stock) / Average outstanding shares
The 2014 analysis shows
Earnings per share on common stock 2011=1.9 2012=2.01 2013=1.95
This analysis shows
2016 2015 2014 2013
Earnings Per Share 1.66 1.70 1.63 1.95
Earnings Per Share PepsiCo 4.36 3.67 4.27 4.32
I am happy to see congruency. Earnings per share were increasing for Coca-Cola to 2013
then a drastic downward turn. In 2016 it has dropped by almost 30 cents. The good news is
that Coke is still outperforming the industry average of 1.52. However, PepsiCo is
outperforming Coke and is consistently showing prices over double.

FINANCIAL ANALYSIS PROJECT – FINAL PAPER 21
Other Ratios showing trends
2016 2015 2014 2013
Year-end common stock
price (Mark Cap) $41.46 $42.96 $42.96 $40.66
Market Capitalization $177,780.48 $185,759.04 $187,563.36 $179,554.56
Price-to Earnings Ratio 27.14 25.22 26.33 20.82
Price-to-Cash Flow Ratio 0.42% 0.37% 0.38% 0.30%
Market-to-Book Ratio 0.05% 0.05% 0.05% 0.05%
All these are increasing there may show hope of recovery from the astoundingly high debt
/asset ratio and other signs of impending bankruptcy.
Coca-Cola Financials 2013-2016
Please refer to Appendix (3) for the incomes statement, the balance sheet, the common
income statement, the common balance sheet, the percent change income statement, and the
Calculated Data: Ratios
2016 2015 2014 2013
Liquidity ratios
Current Ratio 1.28 1.24 1.02 1.13
Quick Ratio 0.84 0.74 0.67 0.73
Working Capital 7478.00 6466.00 612.00 3493.00
Asset Management ratios
Recievables turn Over Ratio 10.74 10.54 9.85 9.62
Inventory Turnover Ratio 5.90 5.83 5.61 5.63
Average Collection Period 34.0 34.6 37.1 37.9
Average Sales Period 61.8 62.7 65.1 64.8
Fixed Asset Turnover 3.94 3.52 3.14 3.13
Total Asset Turnover (return on assets) 0.48 0.49 0.50 0.52
Debt Management ratios
Debt Ratio (debt to assets) 73.39% 71.37% 66.79% 62.87%
Debt to Equity 277.73% 251.36% 202.71% 170.67%
Times Interest Earned 12.10 12.22 20.31 25.79
Times Interest Earned(alt) 11.10 11.22 19.31 24.79
EBITDA Coverage Ratio 18.42 17.51 20.08 19.55
Profitability ratios
Profit Margin 20.61% 19.70% 21.11% 21.83%
Gross Profit Margin 60.67% 60.53% 61.11% 60.68%
Basic Earning Power 9.32% 10.67% 10.13% 12.74%
Return on Assets 7.51% 8.18% 7.74% 9.58%
Return on Common SH Equity 26.95% 26.37% 22.44% 26.15%
Return on Total SH Equity 28.40% 28.83% 23.50% 26.00%
Earnings Per Share 1.66 1.70 1.63 1.95
Market Value ratios
Market Capitalization $177,780.48 $185,759.04 $187,563.36 $179,554.56
Price-to Earnings Ratio 27.14 25.22 26.33 20.82
Price-to-Cash Flow Ratio 0.42% 0.37% 0.38% 0.30%
Market-to-Book Ratio 0.05% 0.05% 0.05% 0.05%

FINANCIAL ANALYSIS PROJECT – FINAL PAPER 22
percent change balance sheet. Further, a link is provided for the annual statements for Coca Cola
(Coke, 2017).
The liquidity, operating efficiency and financial strengths of the Coca-Cola firm are
measured using key financial ratios. This helps to find the overall strength, efficiency and
liquidity conditions of the firm. These ratios also provide invaluable interpretation for each ratio
by finding weak areas, danger signals or just by increasing efficiency (Sharma, 2014). Ratios are
post-mortem analysis. They acquire no clue about the future; they foretell no prophetic
foreshadow of a firm's future. For this reason ratio analysis should be viewed only as an island
for analysis rather than as an encompassing fortune tactic (Sharma, 2014).
From this analysis it seems that there is gross profit is high, to add to this, the operating
ratio is close to prime levels when compared to industry averages. In the big picture, the liquidity
position of the firm looks good. However, the firm is hemorrhaging money. Coke must try to
improve its profit margin. The difference between the gross margin and the net margin is too
great and the net margin is below industry averages. Finally, the debt ratio is growing out of
control, as a result, the debt-equity ratio tells for every one dollar of equity the firm owes three to
the bank. In fixing these issues investment and overall efficiency may improve. The business
environment of the company is not good--whatever happened in 2014 might end up being Cokes
death sentence. The growing Debt to Assets, and Debt to Equity alongside the falling Debt to
fixed assets seems to make Coke appear to be scrambling and selling off assets in an attempt to
stop a trend that may end in bankruptcy. To add to this they are being out sold and out
maneuvered by their competitors.
Growing health concerns (increasing obesity and diabetes), as well as a desire for better
American nutrition, has negatively affected the soft drink industry. Soft drinks have plummeted

FINANCIAL ANALYSIS PROJECT – FINAL PAPER 23
from 60% down to 35% of the total US beverage volume as a result of the population's desire for
health (Seghetti, 1). Carbonated soft drink companies such as Coca-Cola have been under fire by
schools and governments alike. Recent trends have led to regulation from the government. New
York City limited volume size in 2013. To add to this school have dropped soda from the menu
all but entirely or at least transferred to diet beverages, sports drinks, juices or just plain water.
Coca-Cola faces increasing prices for the commodities that are required in production
(Seghetti, 2). As a result, Coca-Cola has been increasing shelf prices in an attempt to remain
profitable. Add to these problems the fluctuating price of fuel and the increasing cost of delivery
and Coke is poised to face a very big battle (Seghetti, 2014). Coke has no choice it must move
from the carbonated beverage centered operation to something that is in step with the times if
they plan on remaining viable.
In the fiscal year 2014, Coca-Cola reported very strong financial operating revenues of
$46 billion, and a market cap of 42.96. Throughout the year, Coca-Cola began to fall as losses
accumulated due partly to hyperinflation in Venezuela. Added losses of approximately 1.2
billion in 2014 and 2016 were further nails for the coffin. This was the highest volume reduction
for the company in the last five years. As a result, Coca-Cola has reduced its investments from
3+ billion in both 2014 and 2015 to approximately 1 billion in 2016. Increases of long-term debt
has become its main financial operating resource. Though they had reduced debt by over $450
million in the 10 years previous to 2013 as shown in the historical Coke chart. Annual cash flows
are currently being sucked up by long-term debt interest. Capitalization is on the low end and in

FINANCIAL ANALYSIS PROJECT – FINAL PAPER 24
2016 is at a low for the past four years.
2016 2015 2014 2013
Year-end common stock price
(Mark Cap) $41.46 $42.96 $42.96 $40.66
Market Capitalization $177,780.48 $185,759.04 $187,563.36 $179,554.56
If only net margins, positive operating and gross margins are the only data used it looks
as if Coca-Cola is operating profitably. While the truth is that the firm converts revenues to gross
profits at a rate greater than the median percentage, it fails to do so for net profits (Seghetti,
2014). The firm’s 60.67% operating margin and 20.21% net profit margin is at about 25% which
is far lower than the average. To add to this Coca-Cola continues to see earnings drop even when
positive growth in revenue occurs. In the years 2004-2010 Coca-Cola was heavily lagging
behind. This trend is a deal breaker for investors. If a firm is still losing money in the face of
increased gross profits the firm may be too far gone to save.
2013 2014 2015 2016 2013 2014 2015 2016
Net
Operating
Revenues $46,854 $45,998 $44,294 $41,863 0.0% -1.8% -5.5% -10.7%
Net Op Income $10,228 $9,708 $8,728 $8,626 0.0% -5.1% -14.7% -15.7%
Interest expense $463 $483 $856 $733 0.0% 4.3% 84.9% 58.3%
Consolidated
Net Income $8,626 $7,124 $7,366 $6,550 0.0% -17.4% -14.6% -24.1%

FINANCIAL ANALYSIS PROJECT – FINAL PAPER 25
In previous years 2004-2010, the company had a growth rate of about 5% (Hardin, 2014).
However, in the last 4 year, there has been a decline of 10% in revenue, 15.7% in net operating
income with a congruent increase of 58.3% in interest expense. The Company has a debt to total
capital ratio of 73% this is high when compared to industry averages. Though Coca-Cola was
moving in the right direction by decreasing its debt ratio in former years in the past 4 years it has
increased from 63% to 73% (Seghetti, 2014). When compared with competitors that are similar
in market capitalization, the company’s quick ratio seem high. With a quick ratio of 1.07
currently shown. However, in this analysis using the formula given about we found all ratios to
be less than 1.
2016 2015 2014 2013
Liquidity ratios
Current Ratio 1.28 1.24 1.02 1.13
Quick Ratio 0.84 0.74 0.67 0.73
WikiInvest.com Quick Ratio Compare

FINANCIAL ANALYSIS PROJECT – FINAL PAPER 26
Further, the interest coverage ratio is 11.10 the company should be able to repay debt.
However, as these debts rise this lowers. Looking at Coca-Cola’s cash conversion cycle it seems
the firm is revisiting numbers from the past after big increases in 2014 and 2013. Although this is
revealing a sign that the firm takes a longer time than its competitors it is still a 100%
improvement from 2013.
From 2004 - 2010 Coca-Cola showed steps in reducing its dependence on debt while
increasing liquidity (Harding, 2014). It's LT Debt/Equity ratio is back to it was in 2010 basically.
Pondering the liquidity ratios, notice ROA and ROC are coming down while ROE is going up.
This seems to be a strange occurrence but is due to the heaving sales of stock for financing.
Dec 31,
2016
Dec 31,
2015
Dec 31,
2014
Dec 31,
2013
Selected Financial Data (USD $ in
millions)
Net operating profit after taxes (NOPAT) 5,782 7,572 7,253 9,244
Invested capital 79,169 77,538 76,173 75,127
Ratio
ROIC 7.30% 9.77% 9.52% 12.30%
2016 2015 2014 2013
Times Interest
Earned(coverage ratio) 11.10 11.22 19.31 24.79
Return on
Assets 7.51% 8.18% 7.74% 9.58%
Return on Common SH Equity 26.95% 26.37% 22.44% 26.15%

FINANCIAL ANALYSIS PROJECT – FINAL PAPER 27
Sales per Employee $ 269,708 277,422 281,339 286,600 290,689
Y / Y Revenue Change-11.32 % -5.91 % -6.95 % -5.08 % -4.01 %
Revenue per employee has been on a constant fall as well. Especially in 2017, the newest
stats show an 11% decrease. This is possibly showing a trend headed for failure.
Dividend payments, share issuance and repurchase, and borrowing is among Coca Cola’s
chief financing activities. In 2014 the current yield on Coca-Cola bonds was about 3.03%,
however, is bouncing back from a low in August of 2015 of about 1.25% to a current amount of
2.40%.
Return on Total SH Equity 28.40% 28.83% 23.50% 26.00%
Dec 31, 2016 Dec 31, 2015 Dec 31, 2014 Dec 31, 2013 Dec 31, 2012
Turnover Ratios
Inventory turnover 6.16 6.02 5.77 5.62 5.84
Receivables turnover 10.86 11.24 10.30 9.62 10.09
Payables turnover 6.14 6.25 8.56 9.53 9.68
Working capital turnover 5.60 6.85 75.16 13.41 19.15
Average No. of Days
Average inventory processing period 59 61 63 65 63
Add: Average receivable collection period 34 32 35 38 36
Operating cycle 93 93 98 103 99
Less: Average payables payment period 59 58 43 38 38
Cash conversion cycle 34 35 55 65 61

FINANCIAL ANALYSIS PROJECT – FINAL PAPER 28
Coca Colas stock in 2014 of $40.88 was short felt as the price keeps an average climb
through the years. Today Coca-Cola stock is about 43.88 but significant lows have been
registered through the years. In 2013 a low was registered around 36 and in 2014 and 2015 about
37. (Quicktake, 2017). Coca-Cola continues to routinely prefer debt financing as a way to lower
overall capital costs, although this may increase their return on shareowners' equity. This is
beginning to prove a burdensome choice as Coca-Cola’s interest expense is skyrocketing and in
the end, may affect their credit rating. Coca-Cola’s capital structure has dramatically changed.
In 2014 it consisted of 54.2% debt and 45.8% equity. For 2016 the firm reported 73.57% debt
and 26.43% equity, on the other hand, Morningstar reports debt at 67.5% and equity ar 32.5%
with 31.5 in billion outstanding debt. That is almost a 50% increase in debt (Quicktake, 2017).
morningstar.com

FINANCIAL ANALYSIS PROJECT – FINAL PAPER 29
The global existence of Coca-Cola, along with their capital position, gives Coke right of entry
into world financial markets, in turn, this enables Coke to raise funds at an operative cost. In like
manner, active management, a mix of long-term/ short-term debt, as well as a mix of fixed-rate/
variable-rate debt, helps to lower overall borrowing costs. As a result, Coca-Cola’s debt
management policies can result in current liabilities almost exceeding current assets as foretold
by the Harding analysis.
The graph illustrated compares Coca Cola’s stock price trends with the major competitors
in the beverage industry, Pepsi, Nestle, and Starbucks. This graph shows the trends between
2013 and 2017 (Finance, 2017).
Coca-Cola Strengths (WSJ, 3)

FINANCIAL ANALYSIS PROJECT – FINAL PAPER 30
Conclusion
From an investor perspective the use of ratio analysis has been performed to evaluate the current
and past performance of the Coca-Cola. An assessment of sustainability has been done. The
prognosis is not good for reasons explained earlier in this analysis. The merger with Monster,
and Duncan is not showing the results hoped for as listed in the Harding analysis. While gross
profits did rise, net profits remain in decline while Coke sells off its assets to pay for long term
debt interest expenses. Share prices are in decline and the firm is facing the fight of its life to
remain. Currently I would not invest in Coke. The gamble of the re-organization combined with
the purchase of Monster and Duncan put a financial strain on the company. While in the midst of
that strain hyperinflation in Venezuela brought financial loss which resulted in a leverage if near
75% for the company. The next 5 years should tell the tail. If Coke is able to return to growth in
the net profit area the company may again be a viable investment as the gross profit percentages
are amazing.

FINANCIAL ANALYSIS PROJECT – FINAL PAPER 31
References
Allen, F. (2005). Soft Drink. American Heritage, 56(5), 74-75. (American Psychological Assoc.)
Coca-Cola (2016) world at a glance. Profit and distribution ratio’s 2016
http://www.coca-colacompany.com/our-company/infographic-coca-cola-at-a-glance
Coke (2017, 2014). The Coca-Cola Company. Company Records. Retrieved from
http://www.coca-colacompany.com/our-company/company-reports
Dunkin (2017) DUNKIN DONUTS BOTTLED ICED COFFEE HITS THE MARKET 2017 by
journey staff. http://www.coca-colacompany.com/coca-cola-unbottled/new-dunkin-
donuts-bottled-iced-coffee-now-arriving-at-retailers
Finance (2014) Yahoo Finance Chart. Retrieved from
http://finance.yahoo.com/echarts?s=KO+Interactive#symbol=KO;range
Retrieved from http://www.scribd.com/doc/167352637/Financial-Analysis-Comparative-
Analysis-Of-Coca-Cola-And-Pepsi
Financials (2017) PepsiCo Financials. http://financials.morningstar.com/ratios/r.html?t=PEP
Pepsi.
Forbes (2014). Coca-Cola Buys Stake in Monster Beverage for $2 Billion. Retrieved from
http://www.forbes.com/sites/maggiemcgrath/2014/08/14/coca-cola-buys-stake-in-
monster-beverage-for-2-billion/
Grabbe, Paul (1942) The Story of Orchestral Music and its Times, Published by Gosset and
Dunlap 1942
Harding, Jenifer (2014) Financial_Analysis_Project_Final_Paper
https://www.academia.edu/8631334/Financial_Analysis_Project_Final_Paper

FINANCIAL ANALYSIS PROJECT – FINAL PAPER 32
Insider (2017) Venezuala HyperInflation http://www.businessinsider.com/venezuela-
hyperinflation-chart-2017-4
Nasdaq (2017) PepsiCo Data, http://www.nasdaq.com/symbol/pep/financials?query=income-
statement.
Pendergrast, Mark (2013) For God, Country, and Coca-Cola Published by Basic Books ISBN
198-0-46504-699-7
Profile (2014). Retrieved from http://finance.yahoo.com/q/pr?s=KO+Profile
Quicktake (2014, 2017). Coca-Cola Co. Retrieved from
http://quicktake.morningstar.com/stocknet/bonds.aspx?symbol=ko
Seghetti, Nicole. (November 22, 2013). Biggest Risks Facing Coca-Cola. Retrieved from
http://www.fool.com/investing/general/2012/11/22/the-biggest-risks-facing-coca-
cola.aspx
Sharma, Arhi. (2014). Financial Analysis:Comparative analysis of Pepsi and Coca-Cola.
Starbuck (2015) July 23 Starbucks.com
https://news.starbucks.com/news/starbucks-and-pepsico-agreement-for-rtd-beverages-in-
latin-america
Stock, (2017) Coke Ratios https://www.stock-analysis-on.net/NYSE/Company/Coca-Cola-
Co/Ratios/Long-term-Investment-Activity#Total-Asset-Turnover
Structure (2017) Coke restructures to sell not syrup but produce its own product.
https://www.ft.com/content/23bf64f4-638a-11e3-a87d-00144feabdc0

FINANCIAL ANALYSIS PROJECT – FINAL PAPER 33
Times (1999) COMPANY NEWS; COCA-COLA AGREES TO BUY HALF OF INCA KOLA
PERU By BLOOMBERG NEWSFEB. 24, 1999
http://www.nytimes.com/1999/02/24/business/company-news-coca-cola-agrees-to-buy-
half-of-inca-kola-peru.html
Western Esotericism in Scandinavia Henrik Bogdan, Olav Hammer 2016
Videos
CNBC (2009) Originals Coca Cola The Real Story Behind The Real Thing 2009 PDTV XviD
Ekolb. https://www.youtube.com/watch?v=A9GYA9eU84c

FINANCIAL ANALYSIS PROJECT – FINAL PAPER 34
Apendix 1

FINANCIAL ANALYSIS PROJECT – FINAL PAPER 35

FINANCIAL ANALYSIS PROJECT – FINAL PAPER 36
Apendix 2 Finacials 2011-2013 Harding
Coca-Cola Common Size Income Statement
2013 2012 2011
Net Operating Revenues 100.00 100.00 100.00
Cost of Goods Sold -39.32 39.68 -39.14
Gross Profit 60.68% 60.32% 60.86%
Selling, general and Admin. Expenses -36.94 36.94 -37.47
Other operating charges -1.91 -.93 -1.57
Operating Income 21.83% 22.45% 21.82%
Interest income 1.14 .98 1.04
Interest expense -.99 -.83 -.90
Equity income, net 1.28 1.71 1.48
Other income (loss), net 1.23 .29 1.14
Income before income taxes 24.50% 24.59% 24.58%
Income taxes -6.08 -5.67 -6.03
Consolidated net income 18.41% 18.92% 18.55%
Net income attributable to non controlling interests -.09 -.14 -.13
Net income attributable to shareowners 18.32% 18.78% 18.42%
2011-2013 Ratios Harding Analysis
2011 2012 2013 Status Industry average
Working capital 25,497 30,328 31,304 Improving 23,500

FINANCIAL ANALYSIS PROJECT – FINAL PAPER 37
Cash flows from operations, investments and other financial activities:
2013 2012 2011
Net Income 8626.00 9086.00 8634.00
Depreciation/Amortization and depletion 1977.00 1982.00 1954.00
Net Change from Assets/Liabilities -932.00 1080.00 -1893.00
Net cash from Discontinued Operations 0.00 0.00 0.00
Ratio of fixed assets to L.T.
liabilities
2.86 2.76 2.60 Improving 2.2
Ratio of liabilities to S.E. 1.36 1.45 1.51 Decreasing 1.22
Total asset turnover 1.58 1.56 1.52 Decreasing 2.3
Current ratio 1.05 1.09 1.13 Increasing 1
Quick ratio .92 .97 1.0 Increasing .59
Rate earned on total assets 11% 11% 10% Decreasing 11.8%
Earnings per share on common
stock
1.90 2.01 1.95 Increasing 1.52
Accounts receivable turnover 9.46 10.09 9.62 Improving 9.32
Average collection period 38.58 36.18 37.96 Improving 31.2
Times interest earned 19 19.2 19.5 Improving 15.4
Inventory turnover 15.05 14.71 14.30 Decreasing 15.5
Net profit margin 25.3% 26.9% 28.4% n/a 18%
Gross profit margin 61.2% 60.9% 61.2% n/a 43%
Rate earned on common S.E. .42 .42 .42 n/a .63
Rate earned on total S.E. .27 .27 .26 decreasing .36

FINANCIAL ANALYSIS PROJECT – FINAL PAPER 38
Other operation activities 871.00 657.00 779.00
Net case from operating activities 10542.00 10645.00 9474.00
Property and equipment 2439.00 2637.00 -2819.00
Acquisition/disposition of subsidiaries 519.00 654.00 -415.00
Investments -1991.00 -9234.00 803.00
Other investing activities -303.00 -187.00 -93.00
Net cash from investing activities -4214.00 -11404.00 -2524.00
Uses of funds:
2013 2012 2011
Issuance (repurchase) of capital stock -3054.00 -3070.00 -2944.00
Issuance (repayment) of debt 4711.00 4218.00 4965.00
Increase (decrease) short-term debt 0.00 0.00 0.00
Payment of dividends and other distributions -4969.00 -4595.00 -4300.00
Other financing activities 17.00 100.00 45.00
Net cash from financing activities -3745.00 -3347.00 -2234.00
Effect of exchange rate changes -611.00 -255.00 -430.00
Net change in cash and equivalents 1972.00 -4361.00 4286.00
Cash at beginning of period 8442.00 12803.00 8517.00
Cash at end of period 10414.00 8442.00 12803.00
Diluted net EPS 1.90 1.97 1.85

FINANCIAL ANALYSIS PROJECT – FINAL PAPER 39
Appendix 3 Financials 2013-2016 from This analysis Spreadsheet.
Balance Sheets
(in millions of dollars)
Assets 2013 2014 2015 2016
Cash and equivalents $10,414.00 $8,958.00 $7,309 $8,555
Short-term investments $6,707.00 $9,052.00 $8,322 $9,595
Total Cash $17,121.00 $18,010.00 $15,631 $18,150
Marketable Securtities $3,147.00 $3,665.00 $4,269 $4,051
Accounts receivable $4,873.00 $4,466.00 $3,941 $3,856
Inventories $3,277.00 $3,100.00 $2,902 $2,675
Prepaid Expenses and Other $2,886.00 $3,066.00 $2,752 $2,481
Assets held for sale $0.00 $679.00 $3,900 $2,797
Total current assets $31,304.00 $32,986.00 $33,395 $34,010
Equity Method Investments $10,393.00 $9,947.00 $12,318 $16,260
Other Investments $1,119.00 $3,678.00 $3,470 $989
Other Assets $4,661.00 $4,407.00 $4,110 $4,248
Net plant and equipment $14,967.00 $14,633.00 $12,571 $10,635
Trademarks indefinite $6,744.00 $6,533.00 $5,989 $6,097
Bottlers Franchise rights Indef $7,415.00 $6,689.00 $6,000 $3,676
Goodwill $12,312.00 $12,100.00 $11,289 $10,629
Other Intangable $1,140.00 $1,050.00 $854 $726
Total assets $90,055.00 $92,023.00 $89,996 $87,270
Liabilities and equity
Accounts payable $9,577.00 $9,234.00 $9,660 $9,490
Notes payable $16,901.00 $19,130.00 $13,129 $12,498
Long -term debt current mat $1,024.00 $3,552.00 $2,676 $3,527
Accruaed Income tax $309.00 $400.00 $331 $307
Laibilities held for sale $0.00 $58.00 $1,133 $710
Total current liabilities $27,811.00 $32,374.00 $26,929 $26,532
Long-term Debts $19,154.00 $19,063.00 $28,311 $29,684
Other Liabilities $3,498.00 $4,389.00 $4,301 $4,081
Deferred Income Tax $6,152.00 $5,636.00 $4,691 $3,753
Total debt $56,615.00 $61,462.00 $64,232 $64,050
0

FINANCIAL ANALYSIS PROJECT – FINAL PAPER 40
Income Statements
(in millions of dollars)
2013 2014 2015 2016
Net Operating Revenues $46,854.00 $45,998.00 $44,294.0 $41,863.0
Costs of Goods sold $18,421.00 $17,889.00 $17,482.0 $16,465.0
Gross Profit. (EBITDA) $28,433.00 $28,109.00 $26,812.0 $25,398.0
Gen Admin Expense $17,310.00 $17,218.00 $16,427.0 $15,262.0
Other operating charges $895.00 $1,183.00 $1,657.0 $1,510.0
Net Op Income $10,228.00 $9,708.00 $8,728.0 $8,626.0
Interest income $534.00 $594.00 $613.0 $642.0
Interest expense $463.00 $483.00 $856.0 $733.0
Equity Income (loss) $602.00 $769.00 $489.0 $835.0
Onther income (loss) $576.00 ($1,263.00) $631.0 -$1,234.0
Earnings before taxes (EBT) $11,477.00 $9,325.00 $9,605.0 $8,136.0
IncomeTaxes $2,851.00 $2,201.00 $2,239.0 $1,586.0
Consolodated Net Income $8,626.00 $7,124.00 $7,366.0 $6,550.0
Less Net imcome attributable $42.00 $26.00 $15.0 $23.0
Net Income Attrib to Shareholders $8,584.00 $7,098.00 $7,351.0 $6,527.0
Basic Net income Per Share $1.94 $1.62 $1.7 $1.5
Diluted net income per share $1.90 $1.60 $1.7 $1.5
average shares outstanding $4,434.00 $4,387.00 $4,352.0 $4,317.0
Effect of dilutive securities $75.00 $63.00 $53.0 $50.0
Average shares outstanding with dilution $4,509.00 $4,450.00 $4,405.0 $4,367.0