coca cultivation in the andean region...june 2007 coca cultivation in the andean region a survey of...
TRANSCRIPT

June
200
7
COCA CULTIVATION IN THE ANDEAN REGION
A survey of Bolivia, Colombia, Ecuador and Peru
Governmentof Peru
Governmentof Bolivia
Governmentof Colombia
Governmentof Ecuador

UNODC's Illicit Crop Monitoring Programme (ICMP) promotes the development and maintenance of a global network of illicit crop monitoring systems in the context of the illicit crop elimination objective set by the United Nations General Assembly Special Session on Drugs. It provides overall coordination and direct technical support and supervision to UNODC supported annual illicit crop surveys at the country level.
This reports presents the results of the annual coca cultivation surveys in Bolivia, Colombia, and Peru, which were conducted jointly by UNODC (ICMP) and the respective Governments with a regional perspective.
The implementation of UNODC's Illicit Crop Monitoring Programme in the Andean region was made possible thanks to financial contributions from the Governments of Austria, Colombia, France, the Netherlands, Turkey, the United Kingdom, the United States of America, and from the European Commission.
This report and other ICMP survey reports can be downloaded from:
www.unodc.org/unodc/en/crop_monitoring.html
The boundaries, names and designations used in all maps in this document do not imply official endorsement or acceptance by the United Nations.
This document has not been formally edited.

i
CONTENTS
PART 1. REGIONAL OVERVIEW .............................................................................................5 1 COCA CULTIVATION IN THE ANDEAN REGION.................................................................... 7 2 POTENTIAL COCAINE PRODUCTION ..................................................................................... 10 3 COCAINE SEIZURES AND CLANDESTINE LABORATORIES .............................................. 11 4 FARM-GATE PRICES OF COCA PRODUCTS ........................................................................... 12 5 FARM-GATE VALUE OF COCA CULTIVATION..................................................................... 14
PART 2. BOLIVIA COCA CULTIVATION SURVEY............................................................15 1 INTRODUCTION........................................................................................................................... 20 2 FINDINGS...................................................................................................................................... 22
PART 3. COLOMBIA COCA CULTIVATION SURVEY.......................................................57 1 INTRODUCTION........................................................................................................................... 62 2 FINDINGS...................................................................................................................................... 64
PART 4. ECUADOR COCA CULTIVATION SURVEY.......................................................103 1 INTRODUCTION......................................................................................................................... 107 2 FINDINGS.................................................................................................................................... 109
PART 5. PERU COCA CULTIVATION SURVEY ................................................................113 1 INTRODUCTION......................................................................................................................... 119 2 FINDINGS.................................................................................................................................... 121


iii
PREFACE
The evidence presented in this Survey bears out an argument that UNODC has been making in relation to the world drugs problem: the overall situation is stable, yet fragile.
In 2005, slight decreases in coca cultivation in Bolivia and Peru were offset by an increase in Colombia. In 2006, the reverse occurred. While the regional trend was downward, this time a decrease in Colombia was offset by increases in Bolivia and Peru.
Progress in Colombia can be attributed to record levels of eradication, both aerial and manual. Colombia also continues to seize an impressive amount of its own cocaine, to intercept imports of precursor chemicals, and to destroy drug labs. It is also facing up to the corrupting power of the drugs trade on government, and seeking to break the links between drug trafficking and insurgency.
But as the experience of Bolivia and Peru demonstrate, a long term reduction of the world’s supply of coca depends not only on effective law enforcement, but also on eradicating the poverty that makes farmers vulnerable to the temptation of growing lucrative illicit crops. All Andean countries require greater support for development assistance that can generate growth and create brighter prospects for communities at the beginning of the supply chain. They should also be encouraged to work more closely together to exchange intelligence on trafficking flows and carry out joint operations.
The solution to the Andean coca problem does not rest solely in the region. Andean governments would not be grappling with a problem on this scale if there was no global demand for cocaine. This year alone, the Colombian authorities – at great risk and great expense – have eradicated more than 200,000 hectares of coca: an area twice the size of New York City! Yet they will have to do it again and again unless the world curbs its appetite for cocaine.
Global demand for cocaine is steady, with a decline in the United States offset by a rise in Europe. In these affluent societies, where celebrities are often glamourized for their drug abuse, greater investment is needed in drug prevention and treatment. People who think that they can control the “white lady” should realize, before it is too late, that she is a killer rather than a seductive mistress. Furthermore, the risks that they take are not only to themselves. They are a threat to society if they take drugs and then drive, and they are destroying the lungs of our planet by supporting a trade that is cutting down the Amazon forests.
Meanwhile, countries of the Caribbean, Central America and West Africa are caught in the cross-fire: their societies, already made vulnerable by poverty, are increasingly exposed to the crime of drug trafficking and the tragedy of drug abuse.
In short, recent evidence suggests that the drug problem can be, and is being, contained. To consolidate this progress, it will take a concerted effort at every stage of the drug trade: more effective prevention and treatment to reduce demand; greater technical assistance and regional co-operation to stop trafficking; and comprehensive national drug control plans including law enforcement and social and economic development in order to reduce supply.
Minor annual fluctuations in coca crop surveys are a useful indicator of trends. But the real test is the long-term commitment of societies – and not just governments – to tackle the root causes of drug supply and demand for the sake of a safer and healthier world.
Progress is possible. In recent years, the Golden Triangle of South East Asia – once notorious for opium cultivation – has become almost opium free. Let this be an inspiration to us to eliminate the world’s biggest supply of cocaine.
Antonio Maria Costa Executive Director
UNODC


PART 1. REGIONAL OVERVIEW


Regional Overview
1
FACT SHEET – Andean Coca Surveys for 2006
2005 Variation 2006
Global coca cultivation 159,600 ha -2% 156,900 ha
Colombia 86,000 ha -9% 78,000 ha
Peru 48,200 ha +7% 51,400 ha
Bolivia 25,400 ha +8% 27,500 ha
Ecuador n.a. < 100 ha
Farm-gate value of coca cultivation US$ 1,330 million -12% US$ 1,159 million
Colombia (coca products) US$ 843 million -18% US$ 694 million
Peru (coca leaf) US$ 307 million -7% US$ 285 million
Bolivia (coca leaf) US$ 180 million 0% US$ 180 million
Farm-gate value of coca cultivation in % of GDP1
Colombia 0.7% 0.5%
Peru 0.4% 0.4%
Bolivia 2.1% 2.0%
Global cocaine production 980 mt +0.4% 984 mt
Colombia 640 mt -5% 610 mt
Peru 260 mt +8% 280 mt
Bolivia 80 mt +18% 94 mt
Average wholesale price of cocaine
Colombia (in main cities) US$ 1,860/kg -5% US$ 1,762/kg
Peru (in producing regions) US$ 897/kg -8% US$ 823/kg
Bolivia (in main cities) US$ 1,830/kg +2% US$ 1,870/kg
Ecuador US$ 4,500/kg n.a.
Reported eradication of coca cultivation
Colombia (spraying & manual) 170,060 ha +25% 213,371 ha
Peru (manual) 12,237 ha +4% 12,688 ha
Bolivia (manual) 6,073 ha -17% 5,070 ha
Ecuador (manual)2 18 ha n.a. 8 ha
Reported seizure of cocaine (base and HCl) in South America
379 mt n.a.
Colombia 215 mt -18% 177 mt
Peru 22 mt -10% 20 mt
Bolivia 11 mt +27% 14 mt
Ecuador 43 mt -12% 38 mt3
1 GDP of the respective year as reported by the Government. 2 Reported until September 2006. 3 Source: INCSR 2007.

Regional Overview
2
Map 1: Coca cultivation density in the Andean Region, 2006
80°W
80°W
70°W
70°W
60°W
60°W
20°S
20°S
10°S
10°S
0° 0°
10°N
10°N
PacificOcean
Nariño
AltoHuallaga
Putumayo -Caqueta
ApurimacEne
La Convencionand Lares
BRAZIL
BOLIVIA
ECUADOR
Catatumbo
VENEZUELA
CHILE
Sources: National monitoring systems supported by UNODC - Governments of Bolivia, Colombia and PerúThe boundaries and names shown and the designations used on this map do not imply official endorsement or acceptance by the United Nations
Lake
Titicaca
South America
Peru
Putumayo
Amazonas
Huallaga
Marañon
Ucayali
Ene Urubamba
Purus
Apurimac
Madre de
Dios
Yungas
Cultivation density(ha/km )2
0.1 - 1.01.1 - 4.0> 4.0InternationalboundariesDepartmentboundaries
km
0 250 500
Geographic coordinates WGS 84
Caqueta
Meta -Guaviare
Norte deAntioquia
Colombia
Bolivia
Meta
Vichada
GuaviareM
agda
lena
Atra
toPANAMA
Chapare
PERU
ARGENTINA
PARAGUAY
Beni
Mam
ore
Guapare
Pilcomayo
^La Paz
^Lima
^Bogota
GUYANA
Caribbean Sea
COLOMBIA

Regional Overview
3
Map 2: Bolivia, coca cultivation by region, 2002 to 2006

Regional Overview
4
Map 3: Colombia, coca cultivation by region, 2002 to 2006
PacificOcean
Caribbean Sea
PANAMA
Central
Meta -Guaviare
Putumayo -Caquetá Amazonia
Orinoco
Pacific
Sierra Nevada
Vichada
Vaupés
Valle
Tolima
Sucre
Santander
RisaraldaQuindío
Putumayo
Norte deSantander
Nariño
Meta
Magdalena
La Guajira
Huila
Guaviare
Guainía
Cundinamarca
Córdoba
Chocó
Cesar
Cauca
Casanare
Caquetá
Caldas
Boyacá
Bolívar
Atlántico
AraucaAntioquia
Amazonas
VENEZUELA
PERU
ECUADOR
BRAZIL
Tumaco
Neiva
PuertoAsís
Popayán
Cucutá
Cartagena
Pasto
Cali
Florencia
Medellín
Barranquilla
Bogotá
Mitú
Leticia
Arauca
PuertoCarreño
75°W
75°W 70°W
70°W
5°S
5°S
0° 0°
5°N
5°N
10°N
10°N
South America
Source: Government of Colombia - National monitoring system supported by UNODCThe boundaries and names shown and the designations used in this map do not imply official endorsement or acceptance by the United Nations
y g
Colombia
International boundariesDepartment boundaries
Coca cultivation (ha)
18,8
10
20,5
40
12,1
3017
,220
6,83
0
440
1,90
0
Geographic coordinates WGS 84
1500 300km
2002
2003
2004
2005
2006

Regional Overview
5
Map 4: Ecuador, coca cultivation risk areas, 2006
!A!A!A!A!A
!A
!A!A!A
!A!A
!A
!A
!A
80°W
80°W
75°W
75°W
5°S
5°S
0° 0°
Source: Govermment of Ecuador - National monitoring system supported by UNODCThe boundaries and names shown and designations used on this map do not imply official endorsement or acceptance by the United Nations
COLOMBIA
PacificOcean
^
Guaya
Morona -Santiago
Azuay
El Oro
Chimborazo
Cañar
Cotopaxi
BolivarLos Rios
Manabi
Carchi
Napo
Pichincha
Esmeraldas
Sucumbios
Quito
Pastaza
Golf of Guayaquil
PERU
!Guayaquil
Ibarra
!Nueva Loja
!Cuenca
! Puyo
San Lorenzo!
Northe
rnAn
des
Volcanic Mountain Range
!A
Coca cultivation risk areas
Coca cultivation area inColombia 2006
Loja
Zamora -Chinchipe
International boundaries
Department boundaries
Eradication Points 2005GEMA - DNA
!A
Km
0 150 300
Geographic coordinates WGS84
Esmeraldas
Sucumbíos
South America
Ecuador

Regional Overview
6
Map 5: Peru, coca cultivation by region, 2002 to 2006
Loreto
Ucayali
Puno
Cusco
JuninLima
Arequipa
Ica
Piura
Madre de Dios
Ancash
San Martin
Ayacucho
Huanuco
Pasco
Amazonas
Cajamarca
Tacna
Apurimac
La Libertad
Moquegua
Lambayeque
Tumbes
Huancavelica
80°W
80°W
75°W
75°W
70°W
70°W15
°S
15°S
10°S
10°S
5°S
5°S
0° 0°
Coca cultivation (ha)200220032004
International boundariesDepartment boundaries
OceanPacific
Marañon
AltoHuallaga
Aguaytia
Palcazu - PichisPachitea
ApurimacEne
La Convencionand Lares
San Gaban
InambariTambopata
BRAZIL
BOLIVIA
ECUADOR
Putumayo
COLOMBIA
CHILE
Source: National of monitoring system supported by UNODC - Government of PeruThe boundaries and names shown and the designations used on this map do not imply official endorsement or acceptance by the United Nations
LakeTiticaca
Geographic coordinates WGS 84
South America
Peru
Putumayo
Huall
aga Am
azon
as
Huallaga
Marañon
Ucayali
Ene
Urubamba
Purus
Apurimac
Madre de Dios
Amazonas
^Lima
km
0 150 30020052006
Coca growing areas 2006
2,36
6
446
12,7
47
15,8
13
17,1
65
426
1,57
0
443
375
150

Regional Overview
7
1 COCA CULTIVATION IN THE ANDEAN REGION
In 2006, coca cultivation in the Andean region decreased slightly by 2 per cent from 159,900 hectares in 2005 to only 156,900 hectares in 2006. Cultivation decreases in Colombia were partly offset by increases in Bolivia and Peru. The estimates suggest that the global coca cultivation area has been essentially stable since 2003. However, global coca cultivation continues to be lower than in any year of the 1990s and 29 per cent below the peak level recorded in 2000 (221,300 hectares).
Colombia remained the country with the world's largest coca growing area, representing half of the global area under coca bush. Peru remains the second largest coca cultivating country behind Colombia, and accounted for one third of the global cultivation in 2006. Bolivia, the third largest producer of coca leaf in the world, still trails far behind Colombia, and accounted for only 18 per cent of global coca cultivation.
Figure 1: Coca cultivation in the Andean region (hectares), 1995 to 2006
0
50,000
100,000
150,000
200,000
250,000
1995 1996 1997 1998 1999 2000 2001 2002 2003 2004 2005 2006
Hec
tare
s
Bolivia Colombia Peru
Table 1: Coca cultivation in the Andean region (hectares), 1995 to 2006
1995 1996 1997 1998 1999 2000 2001 2002 2003 2004 2005 2006
% change 2005-2006
Bolivia 48,600 48,100 45,800 38,000 21,800 14,600 19,900 21,600 23,600 27,700 25,400 27,500 8%
Peru 115,300 94,400 68,800 51,000 38,700 43,400 46,200 46,700 44,200 50,300 48,200 51,400 7%
Colombia 50,900 67,200 79,400 101,800 160,100 163,300 144,800 102,000 86,000 80,000 86,000 78,000 -9%
Total 214,800 209,700 194,000 190,800 220,600 221,300 210,900 170,300 153,800 158,000 159,600 156,900 -2%
Source: United States Department of States National Monitoring Systems supported by UNODC

Regional Overview
8
There are no indications of large-scale coca cultivation outside the three main coca growing countries Bolivia, Colombia and Peru, despite evidence of low-level coca bush cultivation in some parts of Ecuador. Preliminary results of a rapid assessment undertaken by UNODC and the Government of Venezuela in 2006 including large parts of the Venezuela-Colombia border area indicate that the extent of coca cultivation on the Venezuelan side is marginal.
Coca cultivation in Colombia declined by 9 per cent from 86,000 hectares in 2005 to only 78,000 hectares in 2006. Overall, despite the increases and decreases observed in recent years, coca cultivation in Colombia has proven to be relatively stable at around 80,000 hectares since 2003. Meta-Guaviare remains the largest cultivation region in Colombia, with almost 21,000 hectares of coca bush, or just over a quarter of the total coca cultivation area, closely followed by the Pacific and Putumayo-Caquetá regions. Considerable decreases in the Meta-Guaviare, Central and Orinoco regions were partly offset by strong increases in the Putumayo-Caquetá region, once the largest cultivation region.
In 2006, the Colombian authorities further intensified their eradication efforts, especially in higher yielding regions such as Meta-Guaviare, Orinoco and Putumayo-Caquetá. The area of coca bush eradicated reached a record level of over 213,000 hectares, which includes about 172,000 hectares of spraying and 41,530 hectares of manual eradication. The cumulative area eradicated in 2006 was 2.7 times larger than the net cultivation area, which indicates an intensity of eradication activities never reached before.
Figure 2: Coca cultivation in Colombia (hectares), 1995 to 2006
0
20,000
40,000
60,000
80,000
100,000
120,000
140,000
160,000
180,000
1995 1996 1997 1998 1999 2000 2001 2002 2003 2004 2005 2006
Hec
tare
s
US Department of State National Monitoring System supported by UNODC
In 2006, coca cultivation in Peru increased by 7 per cent and amounted to 51,400 hectares, which is almost as high as the level reached in 2004. Despite this increase, coca cultivation remained well below the levels registered in the mid 1990s, when Peru was the world's largest cultivator of coca bush.
Although there was only a moderate increase in coca cultivation in the three major cultivating regions, Alto Huallaga, Apurímac and La Convención-Lares, they were still the largest contributors to the overall increase of 3,200 hectares in absolute terms. Furthermore, several of the smaller cultivation areas grew rapidly and a new cultivation area was discovered in the Brazil-Colombia-Peru border triangle.
Eradication of coca bush, which in Peru is done manually, was slightly higher than in 2005 and reached 12,688 hectares, the second highest eradication figure reported by the Government.

Regional Overview
9
Figure 3: Coca cultivation in Peru (hectares), 1995 to 2006
0
20,000
40,000
60,000
80,000
100,000
120,000
140,000
1995 1996 1997 1998 1999 2000 2001 2002 2003 2004 2005 2006
Hec
tare
s
US Department of State National Monitoring System supported by UNODC
In Bolivia, the area under coca cultivation increased by 8 per cent compared to 2005, and reached 27,500 hectares in 2006. This increase offsets the decrease achieved between 2004 and 2005, when coca cultivation declined by 8 per cent from 27,700 hectares to only 25,400 hectares. The total estimate also included 12,000 hectares of coca bush permitted by Bolivian Law No. 1008 for traditional purposes such as leaf chewing, medicinal preparations and coca tea. Overall, the area cultivated with coca bush in Bolivia remained much lower than in the early and mid-1990s, when coca was grown on over 45,000 hectares.
As in previous years, the Yungas of La Paz constituted the largest coca cultivating region in Bolivia with over two thirds of the area under coca bush, followed by Chapare, with just under one third of the area. Still, most of the total coca area increase of 2,100 hectares took place in Chapare, where the coca cultivation area increased by 19 per cent, or 1,300 hectares, whereas the Yungas of La Paz accounted for only 800 hectares of the total increase.
The Government of Bolivia reported a decrease of the area eradicated by 17 per cent to only 5,070 hectares in 2006. Practically all the eradication took place in the region of Chapare.
Figure 4: Coca cultivation in Bolivia (hectares), 1995 to 2006
0
10,000
20,000
30,000
40,000
50,000
1995 1996 1997 1998 1999 2000 2001 2002 2003 2004 2005 2006
Hec
tare
s
US Department of State National Monitoring System supported by UNODC

Regional Overview
10
2 POTENTIAL COCAINE PRODUCTION
The overall potential production of cocaine reached 984 metric tons in 2006, about the same as a year earlier, with levels amounting to 610 metric tons in Colombia, 280 metric tons in Peru and 94 metric tons in Bolivia. The level of overall potential production is practically unchanged from the levels of a decade ago. Unlike coca cultivation, which saw a strong decrease since the peak in the year 2000, world cocaine production remained at a high level. The introduction of improved coca cultivation techniques in recent years including the use of industrial fertilizers, pesticides, herbicides, and irrigation, as well as the introduction of new varieties and higher plant densities resulted in significantly higher coca leaf yields per hectare. In addition, the conversion process from coca leaf to cocaine HCl is thought to have undergone improvements, and it is suspected that clandestine coca processing laboratories are more efficient now than they were several years ago. However, due to the illicit nature of cocaine production, information on changes in the conversion process is difficult to obtain.
In 2006, the potential production of cocaine HCl in Colombia decreased by 5 per cent or 30 metric tons to 610 metric tons. As a consequence of this decrease and simultaneous production increases in Bolivia and Peru, Colombia's share of the world cocaine production fell from 65 per cent in 2005 to 62 per cent in 2006.
In 2006, Peru accounted for 28 per cent of the global cocaine production. Based on updated information on the amount of coca leaf necessary to produce one kilogram of cocaine HCl, the total potential cocaine production in 2006 amounted to 280 metric tons, which is an increase of 8 per cent compared to 2005. While this is the highest production figure since 1998, it is still only about half the amount registered during the cocaine production peak in Peru in 1992.
Based on new field research on the coca leaf yield in the Yungas of La Paz, the potential production of cocaine HCl in Bolivia in 2006 amounted to 94 metric tons, an increase by 18 per cent compared to the production estimate of 80 metric tons in 2005. The cocaine production estimates for the years 2004 and 2005 were revised using the new yield results. The increase in cocaine production is much more pronounced than the coca cultivation increase due to the fact that most of the area increase took place in Chapare, where coca leaf yields are more than twice the amount recorded in the Yungas of La Paz.
Figure 5: Global potential cocaine production (metric tons), 1995 to 2006
0
100
200
300
400
500
600
700
800
900
1,000
1,100
1995 1996 1997 1998 1999 2000 2001 2002 2003 2004 2005 2006
Met
ric to
ns
Bolivia Colombia Peru

Regional Overview
11
Table 2: Global potential cocaine production (metric tons), 1995 to 2006
1995 1996 1997 1998 1999 2000 2001 2002 2003 2004 2005 2006
% change 2005-2006
Bolivia 240 215 200 150 70 43 60 60 79 98 80 94 18% Colombia 230 300 350 435 680 695 617 580 550 640 640 610 -5% Peru 460 435 325 240 175 141 150 160 230 270 260 280 8% Total 930 950 875 825 925 879 827 800 859 1,008 980 984 0.4%
Source: UNODC World Drug Report 2007. Note: Production estimates for Bolivia in 2004 and 2005 and for Peru from 2003 to 2005 were revised based on updated information available. Colombian cocaine production estimates for 2004 and later are not directly comparable with previous years.
3 COCAINE SEIZURES AND CLANDESTINE LABORATORIES
Global seizures of cocaine (base and HCl) increased by 29% to 749 metric tons in 2005, topping the record amount of 579 metric tons seized in 2004. Seizures increased in all the major regions, most noticeably in South America, where the majority of all seizures continued to take place, and in West and Central Europe.
Figure 6: Global cocaine seizures by region (kg and % of total), 2005
4
12
95
114
224
284
332
343
843
1,325
379,215 (51%)
207,350 (28%)
106,840 (14%)
35,401 (5%)
16,512 (2%)
0 50,000 100,000 150,000 200,000 250,000 300,000 350,000 400,000
South Asia
East Africa
Oceania
East Europe
Near & Middle East /SW Asia
East and SE Asia
Southeast Europe
Southern Africa
North Africa
West & Central Africa
Caribbean
Central America
West & Central Europe
North America
South America
Colombia alone accounted for 29 per cent of global seizures in 2005, which reflects the strong enforcement efforts undertaken by the Colombian authorities. In 2006, cocaine seizures reported by the Government show a decrease in cocaine HCl and cocaine base seizures but an increase in coca leaf and coca paste seizures. However, seizures in Colombia continued to have a large component of cocaine HCl. In 2006, out of a total of 177 metric tons cocaine HCl and base seized, 127 metric tons were cocaine HCl.

Regional Overview
12
In recent years, the Pacific cocaine trafficking route seems to have gained importance over the Atlantic route. In 2006, 81 per cent of all cocaine HCl seized by Colombian authorities at sea or maritime ports was seized in the Pacific corridor.
In 2006, seizures of cocaine base and HCl in Peru decreased by 10 per cent from 22 metric tons in 2002 to only 20 metric tons in 2006. Similar to the composition of seizures in Colombia, a considerably part of the seizures consisted of cocaine HCl (25% in 2006).
In Bolivia, the amount of cocaine HCl and base seized has been increasing since 2001 and amounted to 14 metric tons in 2006, a 27 per cent increase compared to 2005. Typically, in Bolivia, a relatively small portion of the seizures is cocaine HCl, and the vast majority is coca paste and cocaine base.
Ecuador, sandwiched between the two large cocaine producers Colombia and Peru along the Pacific coast, is thought to be an important transit country for cocaine. Seizures of 43 metric tons in 2005 and 38 metric tons in 2006, which in both years surpassed the combined seizures of Bolivia and Peru, confirm this assumption.
In 2005, Governments reported the destruction of 5,737 clandestine coca processing laboratories globally (excluding coca maceration pits), a four-fold increase since 2000, when only 1,314 destroyed laboratories were reported. In addition to clandestine laboratories destroyed, the Governments of Bolivia and Peru reported the destruction of large numbers of coca maceration pits.
Bolivia, Colombia and Peru reported over 99% of all clandestine coca processing laboratories destroyed worldwide in 2005, which reflects that almost the complete cocaine production chain, from coca paste to cocaine base and finally cocaine HCl, takes place close to the cultivation areas in Bolivia, Colombia and Peru. An analysis by type of laboratory reveals that laboratories in Bolivia and Peru, with very few exceptions, produced coca paste and cocaine base, whereas in Colombia a substantial number of clandestine laboratories produced cocaine HCl. Preliminary figures for 2006 show a similar pattern. Out of 2,065 coca processing laboratories destroyed in Colombia in 2006, about 10% (202) were cocaine laboratories, while in Bolivia, only 3 out of a total of 4,070 laboratories were exclusively processing cocaine.
The discovery of clandestine cocaine laboratories outside the coca cultivating countries demonstrates that a small amount of cocaine is produced in other countries as well. However, a large majority of the 210 clandestine cocaine laboratories destroyed in 2005 worldwide were located in Colombia (163), a further 33 in other South American countries, and only 14 in other parts of the world, such as Spain (11), France, South Africa and the United States of America (one each).
4 FARM-GATE PRICES OF COCA PRODUCTS
Overall, prices for coca-related products in Colombia have been remarkably stable over the last five years in the case of coca paste and for an even longer period in the case of cocaine HCl. While wholesale prices for cocaine HCl in Colombian pesos fell for the second consecutive year, it was the first time in three years that it fell in US dollars. It is noteworthy that over the last 16 years, the national average cocaine HCl prices in US dollar terms have remained in a relatively narrow range between US$ 1,350 and US$ 1,860 per kg. As most of the cocaine HCl from Colombia is meant for export, US dollar prices for cocaine HCl may give a good insight into the dynamics of the international illicit drug market, as far as prices are concerned.
In Colombia, the yearly average price for coca paste (US$ 879/kg) and cocaine HCl (US$ 1,762/kg) in 2006 decreased by 2 and 4 per cent respectively, compared to 2005. However, the annual average hides a price increase by 38% from a five-year low of 1,714,000 pesos in January 2006 to 2,360,000 pesos in December 2006, which is the highest monthly average observed since the start of price monitoring in 2000. The monthly fluctuations in the price of coca paste can partly be attributed to the eradication campaigns leading to a temporary breakdown of the local illicit market in the affected regions.
Regional Overview
13
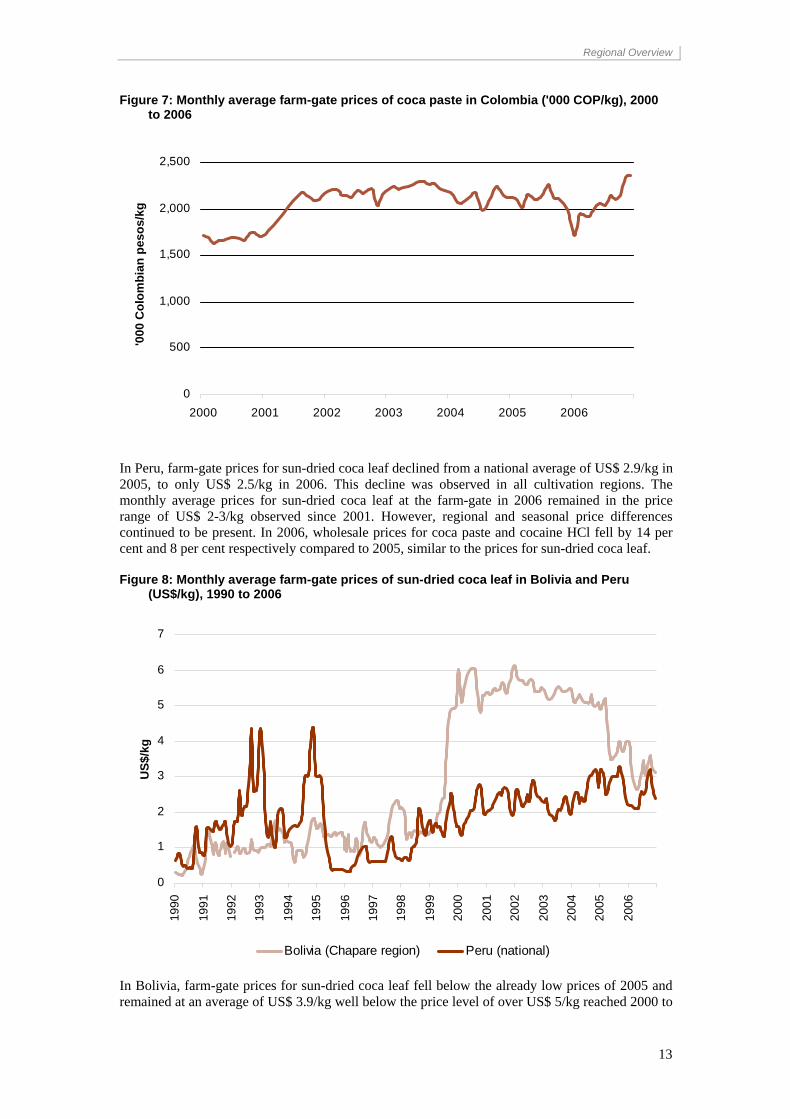
Figure 7: Monthly average farm-gate prices of coca paste in Colombia ('000 COP/kg), 2000 to 2006
0
500
1,000
1,500
2,000
2,500
2000 2001 2002 2003 2004 2005 2006
'000
Col
ombi
an p
esos
/kg
In Peru, farm-gate prices for sun-dried coca leaf declined from a national average of US$ 2.9/kg in 2005, to only US$ 2.5/kg in 2006. This decline was observed in all cultivation regions. The monthly average prices for sun-dried coca leaf at the farm-gate in 2006 remained in the price range of US$ 2-3/kg observed since 2001. However, regional and seasonal price differences continued to be present. In 2006, wholesale prices for coca paste and cocaine HCl fell by 14 per cent and 8 per cent respectively compared to 2005, similar to the prices for sun-dried coca leaf.
Figure 8: Monthly average farm-gate prices of sun-dried coca leaf in Bolivia and Peru (US$/kg), 1990 to 2006
0
1
2
3
4
5
6
7
1990
1991
1992
1993
1994
1995
1996
1997
1998
1999
2000
2001
2002
2003
2004
2005
2006
US$
/kg
Bolivia (Chapare region) Peru (national)
In Bolivia, farm-gate prices for sun-dried coca leaf fell below the already low prices of 2005 and remained at an average of US$ 3.9/kg well below the price level of over US$ 5/kg reached 2000 to

Regional Overview
14
2004. The even sharper decrease in price of 22 per cent in Chapare can be attributed to the greater availability of coca leaf on the illicit market due to higher production, despite government efforts to prevent coca leaf trading outside the market authorized by the government. Prices for coca leaf in Bolivia continued to be considerably higher than in neighbouring Peru. It is interesting to note that coca leaf prices in Bolivia and Peru followed a roughly similar trend during the last two years.
5 FARM-GATE VALUE OF COCA CULTIVATION
Farm-gate values of coca cultivation in Bolivia and Peru are based on potential sun-dried coca leaf production. For Colombia, the farm-gate value is based on the potential production of each product sold by the farmers (fresh coca leaf, coca paste or cocaine base). The farm-gate values constitute a gross value, without taking into account the expenses farmers incur for herbicides, pesticides, fertilizers, wages and other agricultural inputs.
In 2006, the farm-gate value of coca products in Colombia decreased by 18 per cent from US$ 843 million in 2005 to only US$ 694 million in 2006. This was due to an overall lower production of coca leaf as a consequence of the reduced cultivated area in combination with a decrease in farm-gate prices of coca products.
In Peru, the increased coca leaf production could partly compensate the price decrease of sun-dried coca leaf. The farm-gate value of coca leaf still decreased by 7 per cent and reached only US$ 285 million in 2006.
In Bolivia, the farm-gate value of sun-dried coca leaf remained with US$ 180 million at the 2005 level, despite a strong production increase by 12 per cent. The main reason was the sharp decline in farm-gate prices of coca leaf.
By and large, the economic importance of the farm-gate values, expressed as a proportion of the GDP, remained unchanged in Bolivia and Peru. In Colombia, the percentage figure of the farm-gate value as a proportion of the GDP fell from 0.7 per cent in 2005 to only 0.4 per cent in 2006. Both, the growth of the Colombian economy and a declining farm-gate value contributed to this development.
Figure 9: Potential farm-gate value of coca cultivation, 2006
0
100
200
300
400
500
600
700
Mill
ion
US$
0.0
0.5
1.0
1.5
2.0
2.5%
of G
DP
Farm-gate value US$180 million US$694 million US$285 million
As % of GDP 2.0 0.5 0.4
Bolivia (sun-dried coca leaf)
Colombia (coca derivatives)
Peru (sun-dried coca leaf)
Source: GDP of 2006 as reported/estimated by the respective Government.

PART 2. BOLIVIA


Bolivia Coca Survey for 2006
17
FACT SHEET – Bolivia Coca Survey for 2006
2005 Variation on 2005 2006
Coca cultivation 25,400 ha +8% 27,500 ha
Of which in the Yungas of La Paz 18,100 ha +4% 18,900 ha
in Chapare 7,000 ha +19% 8,300 ha
in Apolo 300 ha 0% 300 ha
Of which permitted by Bolivian law 1008 12,000 ha 12,000 ha
non-permitted by Bolivian law 1008 13,400 ha +16% 15,500 ha
Of which in national parks 1,950 ha +18% 2,298 ha
Average annual sun-dried coca leaf yield
in Chapare 2,764 kg/ha 2,764 kg/ha
in the Yungas of La Paz 1,300 kg/ha 1,317 kg/ha
in the Yungas, traditional coca growing areas 1,220 kg/ha 1,220 kg/ha
Production of sun-dried coca leaf 43,000 mt +12% 48,000 mt
Potential production of cocaine 80 mt +18% 94 mt
in % of global cocaine production 8% 10%
National weighted average farm-gate price of coca leaf (outside state-authorized market) US$ 4.3/kg -10% US$ 3.9/kg
Chapare average farm-gate price of coca leaf US$ 4.1/kg -27% US$ 3.2/kg
Total farm-gate value of coca leaf production US$ 180 million 0% US$ 180
million
GDP4 US$ 8.4 billion +3.5% US$ 8.7
billionFarm-gate value of coca leaf production in per cent of GDP 2.10% 2.00%
Value of agricultural sector GDP US$ 1.5 billion US$ 1.37
billionFarm-gate value of coca leaf production in % of value of 2006 agricultural sector 12% 13%
Reported seizure of cocaine paste 10,152 kg +26% 12,779 kg
Reported seizure of cocaine hydrochloride 1,300 kg +1% 1,309 kg
4 GDP of the respective year as reported by the Government.

Bolivia Coca Survey for 2006
18
ABBREVIATIONS
Bs. Bolivianos (Bolivian Currency) CONALTID Bolivian National Council for Fighting against Drugs DIGCOIN Bolivian National Direction of Coca Leaf Control and Industrialization DIGECO Bolivian National Direction of Coca Leaf Commercialization (up to 2005) DIGPROCOCA Bolivian National Direction of Development for Coca Growing Areas DIRECO National Direction of Agricultural Re-conversion (up to 2005) FELCN Special Force against Drug Trafficking GCP Ground Control Point GIS Geographical Information Systems GPS Global Positioning System ICMP UNODC Illicit Crop Monitoring Programme UNODC United Nations Office on Drugs and Crime
ACKNOWLEDGEMENTS
The following organizations and individuals contributed to the implementation of the 2006 coca cultivation survey in Bolivia and to the preparation of the present report:
Government of Bolivia: Vice-Ministry for Coca and Integral Development National Direction of DIRECO (renamed Direction of Development for the Coca Growing Areas
as of 2006)
UNODC: Ivan Alfaro – Coordinator (Project) Robert Szucs - GIS Specialist (Project) Patricia Delgado - GIS Specialist (Project) Gonzalo Aruquipa - Remote Sensing Specialist (Project) Blanca Vega – Remote Sensing Specialist (Project) Enrique Castañón – Junior (Project) Claudia Ortega - Administrative Assistant (Project) Christina Albertin - UNODC Representative (field office) José Rocabado - UNODC National Programme Officer (field office) Coen Bussink, Remote Sensing and GIS expert (UNODC - Research and Analysis Section) Anja Korenblik, Programme Manager (UNODC - Research and Analysis Section) Thibault le Pichon, Chief (UNODC - Research and Analysis Section) Thomas Pietschmann, Research Officer (UNODC - Research and Analysis Section) Martin Raithelhuber, Programme Officer (UNODC - Research and Analysis Section) Javier Teran, Statistician (UNODC - Research and Analysis Section)
The implementation of UNODC's Illicit Crop Monitoring Programme in the Andean region and the Bolivia survey 2006 was made possible thanks to financial contributions from the Governments of Austria, Colombia, France, the Netherlands, Turkey, the United Kingdom, the United States of America, and from the European Commission.
This report and other ICMP survey reports can be downloaded from:
www.unodc.org/unodc/en/crop_monitoring.html
Photo credits: UNODC BOL/F57 project or otherwise indicated.

Bolivia Coca Survey for 2006
19
CONTENTS
1 INTRODUCTION......................................................................................................................20
2 FINDINGS ..................................................................................................................................22
COCA CULTIVATION..................................................................................................................... 23
Regional analysis....................................................................................................................24 Coca cultivation in the Yungas of La Paz...............................................................................26 Coca cultivation in Apolo .......................................................................................................35 Coca cultivation in Chapare...................................................................................................37
COCA YIELD AND PRODUCTION ............................................................................................... 40
New findings on coca yield in the Yungas of La Paz ..............................................................41
COCA PRICES AND TRADING...................................................................................................... 43
COCA CULTIVATION IN NATIONAL PARKS ............................................................................ 51
REPORTED ERADICATION........................................................................................................... 52
REPORTED SEIZURES ................................................................................................................... 53

Bolivia Coca Survey for 2006
20
Map 6: Coca cultivation density in Bolivia, 2006
!
!
^
!
!
!
!
!
!
RioBen
i
Rio Itenez
RioM
amore
Madre de Dios
Madera
Rio Pilcomayo
Beni
Santa Cruz
Potosi
La Paz
Pando
Oruro
Tarija
Chuquisaca
Cochabamba
B R A Z I L
A R G E N T I N A
C H I L EPA R A G U AY
PE
RU
Sucre
Oruro
Tarija
Potosi
La Paz
Cobija
Trinidad
Santa Cruz
Cochabamba
60°W
60°W
65°W
65°W
70°W
70°W
10°S
10°S
15°S
15°S
20°S
20°S
25°S
25°S
y
Chapare
YungasTiticaca lake
Apolo
Source: Government of Bolivia - National monitoring system supported by UNODC.The boundaries and names shown and the designation used on this map do not imply official endorsement or acceptance by the United Nations.
Yun... :
Department boundaries
International boundaries
Coca growing areas
0.1 - 1
1.1 - 4.0
> 4
Cultivation density(ha/km² )
1:8,000,000Geographic coordinates, WGS 1984
0 300150 km
Poopo lake
Bolivia
SOUTH AMERICA

Bolivia Coca Survey for 2006
21
1 INTRODUCTION
The objectives of UNODC’s Illicit Crop Monitoring Programme (ICMP) are to establish methodologies for the collection and analysis of data on illicit crops and to improve Governments’ capacity to monitor these crops in the context of the strategy adopted by Member States at the General Assembly Special Session on Drugs in June 1998. ICMP is currently active in seven countries: Afghanistan, Bolivia, Colombia, Lao PDR, Morocco, Myanmar and Peru.
The Bolivian Government and UNODC launched the project “Land use management and monitoring system in the Yungas of La Paz” in October 2001. Initially, the project focused only on the Yungas of La Paz, but since 2003 it has extended its scope to provide estimates on coca cultivation at the national level. This report presents the project’s findings and methodology for 2006.
During 2006, the project was implemented in cooperation with the National Direction of Development for the Coca Growing Regions (DIGPROCOCA, former DIRECO), Vice-Ministry of Coca and Integral Development. DIGPROCOCA provided logistical support during the implementation of ground activities, including the collection of a large number of ground control points, mainly in the Chapare area. The Bolivian National Government, through the National Council of Fight against Illicit Trafficking of Drugs (CONALTID) uses the information provided by this project for planning and implementing its strategy for the fight against illicit drug trafficking.
Coca cultivation decreased significantly in Bolivia at the end of the 1990s, following a significant reduction in the area under coca cultivation in the Chapare region. Bolivia is now the third largest coca producer worldwide, far behind Colombia and Peru. Coca cultivation is concentrated in the departments of La Paz (in the areas of the Yungas of La Paz and Apolo) and in the Chapare area (department of Cochabamba).
Bolivian Law 1008 (“Law on the Regime Applicable to Coca and Controlled Substances”, 1988) permits up to 12,000 ha of traditional coca cultivation for traditional consumption and other legal uses. Most of this area is located in the Yungas of La Paz. In addition, in October 2004, the Bolivian Government temporarily authorized the cultivation of 3,200 ha of coca in the Chapare region. Law No 1008 does not provide a precise definition of the geographic limits of the traditional coca growing areas, however, the Bolivian Government is preparing a study which is intended to lead to legal delineations of the areas where coca for traditional use will be cultivated.
The National Government is also planning to develop a study to determine the national coca leaf demand for traditional purposes.

Bolivia Coca Survey for 2006
22
Map 7: Coca cultivation change 2005 - 2006, Bolivia
!
!
^
!
!
!
!
!
!
Rio
Beni
Rio Itenez
RioM
amore
Madre de Dios
Madera
Rio Pi lcomayo
Beni
Santa Cruz
Potosi
La Paz
Pando
Oruro
Tarija
Chuquisaca
Cochabamba
Sucre
Oruro
Tarija
Potosi
La Paz
Cobija
Trinidad
Santa Cruz
Cochabamba
B R A Z I L
A R G E N T I N A
C H I L EPA R A G U AY
PE
RU
60°W
60°W
65°W
65°W
70°W
70°W
10°S
10°S
15°S
15°S
20°S
20°S
25°S
25°S
g ,
Chapare
YungasTiticaca lake
Apolo
Source: Government of Bolivia - National monitoring system supported by UNODC.The boundaries and names shown and the designation used on this map do not imply official endorsement or acceptance by the United Nations.
1:8,000,000Geographic coordinates, WGS 1984
0 300150 km
Poopo lake
Cultivation changes2004 - 2005
Department boundaries
International boundaries
Significant decrease
Decrease
Insignificant changes
Increase
Significant increase
Bolivia
SOUTH AMERICA

Bolivia Coca Survey for 2006
23
2 FINDINGS
Coca cultivation
In 2006, the total area under coca cultivation in Bolivia was estimated at 27,500 ha, an increase of 8% over last year’s estimate of 25,400 ha. The increase at the national level was due to the increase in the main cultivation regions, Yungas of La Paz and Chapare. In the Chapare region, the increase occurred mainly in the North-West part, in the surroundings of and inside the Isiboro Secure National Park. The significant increase inside the Park could be attributed to the absence of eradication during 2006 in this isolated area (see map 10). In the Yungas of La Paz, low levels of eradication combined with migration processes from the impoverished areas of Bolivia to the Yungas of La Paz are the reason for a continued increasing trend since 2002.
Figure 10: Coca cultivation in Bolivia, 1996 – 2006 (ha)
0
10,000
20,000
30,000
40,000
50,000
Hec
tare
s
Cultivation 48,600 48,100 45,800 38,000 21,800 14,600 19,900 24,400 23,600 27,700 25,400 27,500
1995 1996 1997 1998 1999 2000 2001 2002 2003 2004 2005 2006
US Department of State National Monitoring System supported by UNODC
At the global level, the increases in Bolivia and Peru were more than offset by an even stronger decrease in Colombia, and coca cultivation in the Andean region declined by 2% to 156,900 ha. Coca cultivation in Bolivia represented 18% of the global coca cultivation in 2006, compared to 16% in 2005. Bolivia remained the third largest coca cultivator, behind Colombia and Peru.

Bolivia Coca Survey for 2006
24
Regional analysis
An increase in coca cultivation at the national level, from 25,400 ha to 27,500 ha or 8% is the result of the combined increase in the Chapare and Yungas areas.
In most of the Chapare region, farmers are cultivating an average of 0.16 ha of coca, locally called “cato”, which is the surface allowed according to an agreement reached between the Government and social organizations of coca farmers in October 2004. Nevertheless, in some isolated regions, bigger fields were found. Unlike what happened in the year 2005, the eradication efforts in Chapare were followed by a replanting, mainly in the Isiboro Secure National Park.
Aerial photographs and geo-videos taken over Chapare during the survey clearly show the trend to cultivate coca on fields with the size of one cato in most parts of this region.
In both the Yungas and Chapare regions, new cultivation occurs mainly in isolated places, where controls and eradication are difficult to implement.
Table 3: Coca cultivation estimates by region, 2002 – 2006 (ha)
Region 2002 2003 2004 2005 2006 % change 2005-2006
% of 2006 total
Yungas of La Paz 13,800 16,200 17,300 18,100 18,900 4% 69% Chapare n.a. 7,300 10,100 7,000 8,300 19% 30% Apolo n.a. 50 300 300 300 0% 1% Country total 23,550 27,700 25,400 27,500 8% 100%
Figure 11: Coca cultivation estimates by region, 2002 – 2006 (ha)
0
2000
4000
6000
8000
10000
12000
14000
16000
18000
20000
Yungas of La Paz Chapare Apolo
hect
are
2002 2003 2004 2005 2006

Bolivia Coca Survey for 2006
25
Map 8: Coca cultivation density in the Yungas of La Paz and Apolo, Bolivia, 2006
^
Apolo
Cohoni
Tirata
Guanay
Cajuata
Lambate
Arapata
Irupana
Coroico
Coripata
Caranavi
La Asunta
Yanacachi Chulumani
Ecia. Pata
Pto. Linares
Palos Blancos
L a P a z
B e n i
La Paz
Apolo
Guanay
San Borja
Inquisivi
Sorata
La Asunta
Caranavi
Reyes
Palos Blancos
Rurrenabaque
Viacha
IrupanaLaja
Quime
Coroico
Pucarani
Palca
Batallas
Cajuata
San Buenaventura
Morochata
Coripata
Tacacoma
Achacachi
Cairoma
Sapahaqui
Ayata
YanacachiEl Alto
MallaCaquiaviri
Mecapaca
Calamarca
Charazani (Gral.Perez)
ComancheIndependencia
Tipuani
Ayo Ayo Luribay
Santa Rosa
Colquencha
Chulumani
Achocalla
RIO
BENI
Río La Paz
Río Coroico
Río Boopi
Río Tuichi
RIO ALTO BENI
RíoCotacajes
Río Z
ongo
Río Kaka
Río Quiquibey
Río Consata
Río Camata
Río Sapaqui
Río Quendeque
Rio Unduavi
Río Maniqui
Tamampaya
Río Y
acum
a
Río Santa Elena
67°0'W
67°0'W
67°30'W
67°30'W
68°0'W
68°0'W
68°30'W
68°30'W
14°3
0'S
14°3
0'S
15°0
'S
15°0
'S
15°3
0'S
15°3
0'S
16°0
'S
16°0
'S
16°3
0'S
16°3
0'S
17°0
'S
17°0
'S
Yungas
Apolo
Source: Government of Bolivia - National monitoring system supported by UNODC.The boundaries and names shown and the designation used on this map do not imply official endorsement or acceptance by the United Nations.
Geographic coordinates, WGS 1984
0 5025 km
1 :1.200.000
PARAGUAY
ARGENTINA
B R A Z I L
PER
U
CHILE
La Paz
Bol iv ia
Cu lt iv at ion de nsi ty(ha/km² )
0.1 - 1.0
1.1 - 2.0
2.1 - 4.0
4.1 - 8.0
> 8.0
RiverMain Road
Department boundaries
Department capital
Municipality boundaries
^
& Village center

Bolivia Coca Survey for 2006
26
Coca cultivation in the Yungas of La Paz
The Yungas of La Paz, situated at about 150 km from the city of La Paz, at the eastern side of the Andes Range, is a region of uneven relief with steep slopes, turbulent rivers and elevations ranging from 300 to 4,000 meters above sea level. Significant climatic variations are observed even over short distances. Coca bush is predominantly cultivated on narrow terraces built on high gradient hills.
Coca cultivation in the municipality of La Asunta
The survey revealed 18,900 ha of coca cultivation in the Yungas of La Paz in 2006, representing an increase of 4% compared with the 18,100 ha found in 2005. Most of the cultivation continued to take place in the provinces of South Yungas and North Yungas, accounting respectively for 52% and 34% of the regional total. The largest annual increase (24%) was observed for third year in a row in Caranavi province, but this province only accounted for 9% of the regional total in 2006. It has been the fifth consecutive annual increase observed by the monitoring project in the Yungas of La Paz. Between 2002 and 2006, coca cultivation increased by 37% in this region.
Table 4: Distribution of coca cultivation in the Yungas of La Paz, 2002 - 2006 (ha)
Province 2002 2003 2004 2005 2006 % change 2005-2006
% of 2006 total
South Yungas 7,182 8,356 8,867 9,395 9,753 4% 52% North Yungas 5,187 5,914 6,166 6,257 6,432 3% 34% Caranavi 491 889 1,248 1,381 1,714 24% 9% Inquisivi 741 801 805 807 809 0% 4% Murillo 151 210 217 223 225 1% 1% Rounded total 13,800 16,200 17,300 18,100 18,900 4% 100%

Bolivia Coca Survey for 2006
27
Figure 12: Distribution of coca cultivation in the Yungas of La Paz, 2006 (ha)
South Yungas52%
North Yungas34%
Murillo1%
Inquisivi4%Caranavi
9%
Bolivian Law 1008 (“Law on the Regime Applicable to Coca and Controlled Substances”, 1988) permits up to 12,000 ha of traditional coca cultivation for traditional consumption and other legal uses. Most of this area is located in the Yungas of La Paz, although the law does not provide for a geographic delimitation of the traditional coca cultivation area. Most of the coca leaf produced in the Yungas of La Paz is traded through the coca market, controlled by DIGCOIN, of Villa Fatima in La Paz-city.
Only a small amount of coca fields were eradicated in Yungas in 2006. In this region, once again, it was observed that there were settlements emerging, mainly populated with people coming from the Altiplano (La Paz, Potosi, Oruro, etc). These new settlements were established in previously uninhabited areas of La Asunta and Caranavi, and their primary agricultural activity was coca cultivation.
A study on coca leaf yield conducted by UNODC and the Government in the Yungas in 2006 confirms that farmers were using more sophisticated agricultural techniques in their coca fields, employing more fertilizers, pesticide and mechanical irrigation to improve the yield of their coca fields. In Caranavi, new coca fields established at the expenses of the primary forest or coffee plantations, benefited from higher yields due to the richer soils.

Bolivia Coca Survey for 2006
28
Figure 13: 3-D view in South Yungas of La Paz, 2006
3-D Visualization of satellite image showing coca cultivation in steep slopes
Photo corresponding to the 3-D visualization

Bolivia Coca Survey for 2006
29
Figure 14: Example of the evolution of the coca cultivation in La Asunta Chica
In 2002
coca fields in 2002
In 2006
coca fields in 2002
new coca fields 2003- 2006

Bolivia Coca Survey for 2006
30
Coca cultivation techniques in the Yungas of La Paz
1. Burning of land and soil preparation: The burning of land often takes place during the dry season (May to August), but it can also happen until the month of December if the weather conditions are suitable.
2. Terraces construction: Most of the coca fields are established on wuachus (terraces) to avoid erosion and soil nutrients loss. This practice prolongs the life of the crop. The width of the terraces varies from forty-five centimeters to one meter, depending on the slope. The lines of furrows for coca cultivation are established transversally to the slope direction. This practice is widely used in traditional areas, while in the rest of the Yungas, terraces are not built.
The width and shape of the wuachus varies according to the slope and structure of the terrain.

Bolivia Coca Survey for 2006
31
3. Seedling and transplant: The coca seeds are obtained from plants of 5 years old or older. The seeds are settled in a seedling nursery of rich soil and abundant irrigation. They are protected from the sun for about 4-6 weeks before their transplantation to the field.
Coca seeds
Young plants are carefully transplanted into the new field
4. Young crop and first harvest: The small plants are carefully planted in the field, at a distance of 20 cm between each other. During the first few days, they are continuously irrigated. A new crop produces its first harvest usually 12 months after the transplantation, but there have been reports of fields harvested as soon as 8 months after transplantation thanks to the use of fertilizer.

Bolivia Coca Survey for 2006
32
In the Yungas of La Paz, harvest of coca fields is mainly done by women and children.
5. Maintenance: In the Yungas of La Paz, a phytosanitary treatment is applied to coca bushes using fertilizers, and pesticides. Irrigation is also widely used. Typically, the pesticides are applied to the bushes right after the harvest, in order to protect the crop from a variety of plagues, including larvae, fungus and ants. At 4-5 years old, the plant is totally pruned, leaving only the base of the trunk. This practice, known as pillu, greatly increases the yield of the crop starting from the next harvest, which is produced after 6-8 months. The life of a coca field is about 30 years.
The intensive use of chemical pesticides, and foliar fertilizers may produce coca leafs which are not suitable for traditional consumption like Akulliku (mastication) and tea preparation.
The bottom photo shows organic fertilizer that was applied to coca plants 3 months after pruning.
*-

Bolivia Coca Survey for 2006
33
Mechanical irrigation is widespread in coca fields.
Example of pillu (pruning) in a more than 20 year old coca field. The large trunks at the base reveal that several pillus have been practiced to this plants

Bolivia Coca Survey for 2006
34
6. Drying and transport of the leaves: Drying is done carefully to protect the leaves and maintain their quality. After the harvest, the fresh coca leaves are stored for at least one night in the dark and after that spread for sun drying. In the traditional area, the leaves are spread over a special floor built of dark stones called cachi. The cachi accelerates considerably the time of drying. In other areas, the leaves are spread over agricultural nets. If the coca leaves are spread right after the harvest, they become damaged and their value reduces drastically. If rain comes over the drying coca leaves, or the farmer picks them up before complete drying, the leaves are also damaged.
Coca leaves sun-drying in a cachi
Dried coca leaves being packed for further transport and sale

Bolivia Coca Survey for 2006
35
Coca cultivation in Apolo
Apolo is located at the northern part of the department of La Paz, on the eastern edge of the Andean mountain range. With relatively dry weather conditions and poor soils, coca fields in Apolo often have a low yield and are cultivated for only for about three to five years.
In 2004, DIRECO conducted a cadastral survey of coca cultivation in the Apolo region, measuring in situ all the coca fields located in the region. The DIRECO survey revealed that coca cultivation reached 289 ha in 2004. The UNODC/Government project monitored Apolo completely for the first time in 2004, finding 273 ha of coca cultivation.
In 2006, no imagery was acquired in the Apolo region. A field verification was undertaken in September. Some increase in coca cultivation was observed, mainly in the southern part of the Province Franz Tamayo, in areas with fragile ecosystems, while in other parts of Apolo, the team found some abandoned coca fields. New coca fields were located in areas where there used to be primary forest, on both sides of the Camata River, along the border of the provinces Franz Tamayo and Bautista Saavedra. These new coca fields do not represent a significant cultivated surface yet; however, due to the risk of a potential expansion, the project will continue monitoring this area in the coming years.
Table 5: Coca cultivation in Apolo region, 2003 and 2006 (ha)
Province Municipality 2003 2004 2005 2006 % change 2005 - 2006
Franz Tamayo Apolo 50 300 300 300 0%
Coca cultivation in Apolo region is traditionally associated with cassava to take advantage of the same furrow for two different crops. The coca fields in central Apolo are scattered and relatively small (about 200 m2) compared to the new coca fields found in the southern part or elsewhere in the country. Terraces are not used. The coca cultivation techniques and coca leaf sun drying are similar to techniques used in the Yungas area of La Paz.
The northern part of Apolo is part of the Madidi National Park, the largest biosphere reserve in Bolivia. Only a few dispersed and small coca fields were found on the western side of the Madidi Park. In Apolo, coca cultivation is considered traditional according to law 1008. No eradication is undertaken in this area.
Expansion of coca cultivation at the southern part of Franz Tamayo Province, along the Camata River

Bolivia Coca Survey for 2006
36
Map 9: Coca cultivation density for Chapare, Bolivia 2006
&
&
&
&
&
&
&
&
&
&
&
&
&
&
&
&
&
B e n i
C o c h a b a m b a
S a n t a C r u z
P o t o s i
Colomi
Isinuta
Chimore
Bulo Bulo
Chipiriri
Eterazama
Shinahota
Entre Ríos
Valle Sacta
Ivirgarzama
Tablas Monte
Villa Tunari
Puerto Patiño
Valle Hermoso
Puerto Grether
Pto. G. Villarroel
Villa 14 de Septiembre
San Ignacio
Villa Tunari
Yapacaní
Loreto
Pojo
Aiquile
Chimore
Tiraque
ComarapaTotora
San Andrés
Mizque
Pasorapa
El Puente
Toro Toro
Puerto Villarroel
Pocona
Mineros
Entre Rios (Bulo Bulo)Sacaba
Poroma
Omereque
San Pedro de Buena Vista
Colomi
Anzaldo
Vila Vila
San Carlos
Trigal
Alalay
Moro Moro
Pampa GrandeSaipinaAcasio
Vallegrande
Vacas
Tarata
Pocoata
Arani
Capinota Mairana
Arampampa
Tiquipaya
Presto
Buena Vista
Arbieto
Ravelo
TolataSan Benito
Río I
chilo
RíoI
sibor
o
Río Mizque
Río Ichoa
Río Secure
Río Chore
Río Yapacani
Río Chapare
Río Ibare
Río A
pere
Río Chimoré
Río Pajta
Río C
hipiri
ri
Río Sajta
Río Caine
Río San Pedro
Río Useuta
Río Mamoré
Río Espuma
Río Cabito
Río Ivirizu
Arr. Uriuta
Río Grande ó Guapay
Río Osos
Río E
terasa
ma
Río Alizar
Río Cienaga
Río Zabala
Río San Mateo
Río Piray
Río I
sinot
aRío M
olle
Río Malpaso
Río San Juán
Río MoileRío A
ltamachi
Río Tembladeras
Arr. MariposasRío Cha
pare
64°30'W
64°30'W
65°0'W
65°0'W
65°30'W
65°30'W
66°0'W
66°0'W15
°30'
S
15°3
0'S
16°0
'S
16°0
'S
16°3
0'S
16°3
0'S
17°0
'S
17°0
'S
17°3
0'S
17°3
0'S
18°0
'S
18°0
'S
18°3
0'S
18°3
0'S
y p
0 5025km
Geographic coordinates, WGS 19841 : 1.400.000
Source: Government of Bolivia - National monitoring system supported by UNODC.The boundaries and names shown and the designation used on this map do not imply official endorsement or acceptance by the United Nations.
PARAGUAY
ARGENTINA
B R A Z I L
PER
U
CHILE
CochabambaBol iv ia
Cul t iv at ion den si ty(ha/km² )
0.1 - 1.0
1.1 - 2.0
2.1 - 4.0
4.1 - 8.0
> 8.0
RiverMain Road
Department boundaries
Municipality boundaries
& Village center

Bolivia Coca Survey for 2006
37
Coca cultivation in Chapare
The Chapare region is situated in Cochabamba department, and the region is also referred to as the Cochabamba tropics, extending over the provinces of Chapare, Carrasco and Tiraque. In contrast to the Yungas of La Paz, Chapare region has moderate slopes and huge rivers. Elevations vary from 300 to 2500 meters, with coca cultivated between 300 and 1000 meters. The highest mountains are located in the south and the country’s large tropical savannas begin in the northern part of Chapare. Temperatures are tropical and the area records the highest precipitation levels in Bolivia.
In the 1990s, the Chapare region held the largest amount of coca cultivation, but following sustained eradication efforts and alternative development programmes, cultivation decreased dramatically.
Table 6: Distribution of coca cultivation by province in Chapare region, 2003-2006 (ha)
Province 2003 2004 2005 2006 % change 2005-2006
% of 2006 total
Chapare 4,250 5,844 4,094 4,857 19% 59% Carrasco 2,864 3,520 2,312 2,791 21% 34% Tiraque 214 723 605 691 14% 8% Rounded Total 7,300 10,100 7,000 8,300 19% 100%
The 2006 survey found 8,300 ha of coca cultivation in Chapare, representing an increase of 19% compared to the 7,000 ha found in 2005. The increase is mainly due to the planting of new coca bushes inside the Isiboro Secure National Park, where no eradication was undertaken during 2006. In Chapare, the average field size is around 0.16 ha. This is in line with an agreement signed between the coca farmers and Government in October 2004, which temporary authorizes 3,200 ha of coca cultivation in Chapare, and the current Government policy of authorizing one cato (0.16 ha) of coca per household. The aerial photographs and field missions revealed that a significant number of coca fields were the size of a cato.
Aerial photo with interpreted coca fields of cato size

Bolivia Coca Survey for 2006
38
Between 2005 and 2006, coca cultivation increased in all three provinces of Chapare. It should be noted that political boundaries are not properly defined between the departments of Cochabamba and Beni. For this reason, although some coca cultivation might actually be located in Beni Department, all the coca fields identified during the survey along the undefined departmental border were counted as part of the municipality of Villa Tunari, in the Department of Cochabamba.
Coca field of cato size
In past years, farmers in Chapare used to intersperse or hide coca bushes in order to avoid detection and eradication. These practices are not very common nowadays because of the “cato” policy, and most coca fields were found were free of association with other crops. It is generally accepted that coca cultivation is done with much more care in Yungas than in Chapare, and the techniques of cultivation differ from the ones used in Yungas. For example, the seedbeds in Chapare are usually not covered.
Encircled in red are seedlings prepared for transplantation in recently cleared field

Bolivia Coca Survey for 2006
39
Since the terrain is flat, there is no need to build terraces. The coca bushes in Chapare are bigger than in Yungas. The practice of pruning coca bushes does not exist. This could be due to the intensive eradication of the past years, resulting in most of the coca fields being younger than four years old.
Harvesting a coca field free of association or coverage
Association with other crops or coca cultivated under canopy was a common practice in past years, but it is now only present in certain areas of Chapare. The association of coca with other crops is sometimes done to take advantage of the same open space, or coca is placed under leguminous trees, which fix nitrogen in the soil, resulting in an improved yield.
In Chapare, the coca leaves are also sun-dried on bare floor before commercialization, but not with the same care as in the Yungas. According to FELCN, part of the production is marketed outside the region and another part is used for local consumption (chewing and medicines).
Coca bushes in Chapare may last on average 30 years if they can develop undisturbed. Isolated, scattered old plants of big dimensions have been observed, still yielding substantial quantity of coca leaves. Fertilizers and pesticides are also widely used in the Chapare.

Bolivia Coca Survey for 2006
40
Coca yield and production
In December 2005, UNODC started a new coca yield study in the Yungas of La Paz. The survey was implemented jointly by the UNODC Illicit Crop Monitoring Programme through its experts in Bolivia and in Vienna. The field work was implemented by researchers from the Unidad Academica Campesina (UAC) of Carmen Pampa, Yungas de La Paz.
During the survey, samples of sun-dried coca leaf were weighted from 98 coca parcels selected randomly across the region. To determine the sun-dried coca yield in the Yungas of La Paz, the Bolivian survey is based on a “Multistage Stratified Area Frame Sample Design”.
Sampling frame
As in any survey, the quality of the data collected from the sample surveys depends to a large extent on the quality of the sampling frame from which the sample is to be selected. The sampling frame was constructed according to the principles of the Area Sampling Frame methodology. The basis for the construction of the frame was the coca fields interpreted during the 2004 Coca Cultivation Survey in the Yungas in Bolivia. Within the limits of coca cultivation interpreted in this survey, the frame was divided in a collection of one km2 grids.
Stratification
Most surveys estimating crop production are based on stratified multistage cluster designs. Stratification divides the units in the population into mutually exclusive and collectively exhaustive subgroups or strata. Separate samples are then independently selected from each stratum. The main purpose of stratification is to improve the precision of the survey estimates. Therefore, the construction of the strata should be such that units in the same stratum are as homogeneous as possible and units in different strata area as heterogeneous as possible with respect to one or more characteristics of interest to the survey.
Based on previous experience acquired on site by the project team and by the researchers of Carmen Pampa University, the variables that have been considered for stratification were slope and altitude. These two variables were combined and used as the basis for the stratification of the sampling frame.
Sample size and sampling allocation
The sample size was decided taking into account the desired precision of the estimates, the constraint of verification of all steps of the survey, the necessity to obtain estimates at the regional level, and the availability of the field researchers to reach the fields. The precision of an estimate is measured by its standard error. The degree of precision required for the coca yield was set at about +/- 10% of the true value with a 95 per cent probability that it contains the true value.
The sample size was defined so that a thorough verification process could be performed at any time and at every step of the implementation. This assured the high quality of the data collected and the confidence of the estimates generated.
The table below summarizes the sample frame along the different strata.

Bolivia Coca Survey for 2006
41
Table 7: Coca yield stratification in the Yungas of La Paz
Stratum Strata definition Grids Coca
hectares (2004)
Number of coca
polygons
No. of samples
Elevation (m) Slope (Degrees)
1 300-1000 0-15 490 1,455 3,890 10
2 300-1000 15-38 11 47 109 10
3 1000-2000 0-15 1,563 10,418 28,124 45
4 1000-2000 15-38 496 3,580 8,246 15
5 > 2000 0-15 170 780 2,368 10
6 > 2000 15-38 163 599 2,080 10
Total 2,893 16,880 44,817 100
Measuring a sample coca field
Weighting a sample of recently harvested fresh leaves
New findings on coca yield in the Yungas of La Paz
The averages presented in this section are derived from the field survey, and correspond to the simple averages found in the survey sample, extrapolated to the full extent of the sampling frame.
From the analysis of the collected data, the annual sun-dried coca leaf yield was estimated at 1,300 kg/ha. The highest annual sun-dried coca leaf yield was found in stratum 1 (elevation between 300 and 1,000 meters, and slope less than 15 degrees), and the lowest annual sun-dried coca leaf yield was found in stratum 5 (elevation greater than 2,000 meters and slope less than 15 degrees). The complete averages are described below.

Bolivia Coca Survey for 2006
42
Table 8: Yield results in the Yungas of La Paz for 2005 and 2006
Strata Coca surface (ha)
%
Increase No. of samples 2005 weighted average yield mt/ha/Year
2006 weighted average yield mt/ha/year
Estimated potential amount of sun-dried coca leaf (mt)
2005 2006 2005 2006
1 1,480 1,900 28% 6 2.17 2.17 3,211 4,123
2 48 50 4% 0 1.29 1.29 62 65
3 10,594 10,700 1% 71 1.25 1.25 13,242 13,375
4 4,102 4,200 2% 12 1.21 1.21 4,963 5,082
5 1,111 1,200 8% 6 0.82 0.82 911 984
6 765 850 11% 3 1.49 1.49 1,140 1,267
18,100 18,900 4% 98 1.300 1.317 23,530 24,895
The analysis of the yield survey data concluded that the estimated production of sun-dried coca leaf in the Yungas is approximately 24,895 metric tons in 2006. This would represent an increase of 6% in comparison to 2005, if 2006’s annual sun-dried coca leaf yields are applied to the coca cultivation areas estimated in 2005 (the estimated production of sun-dried coca leaf would amount to 23,530 metric tons in 2005).
Law 1.008 authorizes 12,000 ha of coca cultivation in the traditional region. This area is dispersed among the strata 3, 4, 5 and 6. Therefore the weighted sun-dried coca leaf yield for this region in 2006 is estimated at 1.22 metric tons/ha/year. The total estimated production of sun-dried coca leaf under this law is estimated at 14,660 metric tons in 2006.
In the absence of a detailed study on coca leaf in Chapare, coca leaf production in that region was estimated from yield estimates previously used by UNODC, i.e. information from the United States Government obtained under the Operation Breakthrough. Thus, sun-dried coca leaf production in Chapare was estimated at 22,941 metric tons.
Using the above findings, the total potential production of cocaine in the country is estimated at about 80 metric tons of cocaine in 2005 and 94 metric tons in 2006, which represents an increase of 17% from 2005 to 2006.
It should be noted that this estimate represents the potential coca leaf and cocaine production. Due to lack of data, it does not take into account the so far unknown amount of coca leaf from Chapare region destined for local consumption (chewing and medicinal preparation).

Bolivia Coca Survey for 2006
43
Figure 15: Potential cocaine production in Bolivia, 1995 – 2006 (metric tons)
0
50
100
150
200
250
300m
etric
tons
Metric tons 240 215 200 150 70 43 60 60 79 98 80 94
1995 1996 1997 1998 1999 2000 2001 2002 2003 2004 2005 2006
Source: UNODC World Drug Report 2007
In 2006, potential cocaine production in Bolivia accounted for 10% of the global potential cocaine production of 984 metric tons. Although there is an increase compared to 2005, the percentage is much lower than in the mid nineties, when Bolivia accounted for about a quarter of the global cocaine production.
Coca prices and trading
In Bolivia, sun-dried coca leaf trade is regulated by the National Directorate of Coca Leaf Commercialization and Industrialization DIGCOIN (former DIGECO) that controls the quantity and prices of coca leaf traded in the two market facilities authorized by the Government: The market of Villa Fatima in La Paz city and the market of Sacaba in Cochabamba department, close to Cochabamba city.
Of the 13,209 metric tons of coca leaves that fell under the control of DIGCOIN in 2006, the largest amount, 12,960 metric tons or 98%, was traded in Villa Fatima, and the remaining 249 metric tons in Sacaba. Prices of coca leaves in Villa Fatima market were higher than in Sacaba market, with respective annual averages of 32 Boliviano/kg (US$ 4.0/kg) and 25 Bs./kg (US$ 3.1/kg). The annual average weighted price for coca leaves on these two markets was 31 Boliviano/kg (US$ 3.9/kg) in 2006.

Bolivia Coca Survey for 2006
44
Table 9: Reported monthly price of coca leaf marketed through DIGCOIN, 2006
Chapare: Sacaba market
La Paz: Villa Fatima market Weighted average
Month Price Bs./kg Price Bs./kg Bs./kg US$/kg
January 27 34 34 4.2 February 26 36 35 4.4 March 24 35 35 4.4 April 23 30 30 3.7 May 19 27 27 3.3 June 28 33 33 4.1 July 28 34 34 4.2 August 22 34 34 4.2 September 28 19 19 2.4 October 28 36 36 4.5 November 22 32 32 4.0 December 22 28 28 3.5 Total 25 32 31 3.9
Source: DIGCOIN
In 2006, DIGCOIN introduced a new way to trade coca leaves by authorizing the direct exchange and sale of coca leaves from coca producers to traditional consumers. According to DIGCOIN, about 196 metric tons of coca leaves have been exchanged under this scheme, out of which 121 metric tons were from Yungas of La Paz, and the remaining 75 metric tons from the Cochabamba Tropics.
Including this new way of trading, a total of 13,081 metric tons were traded from the Yungas, and 324 metric tons from the Chapare, According to the yield study, this is equivalent to an area of 9,931 ha of coca grown in the Yungas of La Paz and 117 ha in the Chapare.
Each trader is authorized by DIGCOIN to trade up to 500 pounds (227 kg) of sun-dried coca leaf per month. DIGCOIN’s authorization specifies where the coca leaves are bought (Villa Fatima or Sacaba) and the point of final destination for its retailing. Coca leaf is retailed in packages of maximum 15 pounds (6.8 kg).
The following map shows the distribution of traded coca leaves throughout the country according to the DIGCOIN registry. As in 2005, in 2006, most of the coca leaves ended up in Santa Cruz department, followed by the departments of Tarija, La Paz and Potosi. In Santa Cruz, coca leaves are supplied mostly for the workers of large scale industrial farms of soy beans and sugar canes who use to chew it. Coca chewing is also widespread among miners of the departments of La Paz, Potosi and Oruro. Although not documented, it is likely that an increasing quantity of coca leaves traded in the southern of the country is smuggled to neighboring Argentina.
The total value of the coca leaves traded through the control of DIGCOIN amounted to 415 millions Boliviano or US$ 51.2 millions in 2006, with no significant variation compared to 2005.
Including the new ways of coca commercialization, between 2005 and 2006, the volume of trade increased by 4% (from12,872 mt to 13,422 mt ), while the average annual prices decreased by 8% (from Bs. 35/kg to Bs. 32/kg). It seems that this market responded to the economic law of supply and demand: when the quantity available for trade increases, prices tend to decrease.

Bolivia Coca Survey for 2006
45
Map 10: Coca leaf trading authorized by DIGCOIN, 2006
Rio
Beni
Rio Itenez
RioM
amore
Madre de Dios
Madera
Rio Pi lcomayo
ORURO
SUCRE
POTOSI
TARIJA
COBIJA
LA PAZ Canandoa
TRINIDAD
SANTA CRUZ
COCHABAMBA
Villa Paraiso
San Juan de Yapacani
Chane
Uyuni
AraniCliza
Quime
Escoma
Tomina
Toledo
Mizque
Totora
Tupiza
Atocha
Camiri
Warnes
Cotoca
SacabaPunata
Viacha
Palcoco
Mendoza
Saipina
Anzaldo
Zudañez
Culpina
Bermejo
Yacuiba
Mairana
Mineros
Montero
HuanuniAiquile
El Alto
Camargo
Padilla
Santa Fe
Sopachuy
Betanzos
Villazon
El TornoComarapa
Charagua
Yapacani
Capinota
Colquiri
Tarabuco
Esmeralda
Sacabamba
El Puente
San PedroSan Ramón
Iscayachi
LLallagua
Riberalta
San Borja
Samaipata
Caracollo
Tiquipaya
Achacachi
Muyupampa
Los Negros
TablachacaEntre Rios
Entre Rios
Monteagudo
Tiahuanacu
Challapata
Lahuachaca
San Javier
Concepción
Patacamaya
Cruce Culta
Desaguadero
Villamontes
Vallegrande
Guayaramerín
Rurrenabaque
Machacamarca
Palacio Tambo
Pte. San Pablo
Redencion Pampa
Brecha Casarabe
Belen de Urmiri
Puesto Fernandes
San Jose de Pocitos
Ascención de Guarayos
San Ignacio de Velasco
B R A Z I L
A R G E N T I N A
C H I L E
PE
RU
B e n i
S a n t a C r u z
P o t o s i
L a P a z
P a n d o
O r u r o
Ta r i j a
C h u q u i s a c a
C o c h a b a m b a
60°W
60°W
65°W
65°W
70°W
70°W10
°S
10°S
15°S
15°S
20°S
20°S
25°S
25°S
g y
Source: Government of Bolivia - DIGECO - National monitoring system supported by UNODC.The boundaries and names shown and the designation used on this map do not imply official endorsement or acceptance by the United Nations.
1:8,000,000Geographic coordinates, WGS 1984
0 300150 km
Poopo lake
Titicaca lake
PA R A G U AY
Water bodies
Main rivers
Department boundaries
International boundaries
Main roads
Coca growing areas(metric tons)
Quantity of coca leaf
No coca trading
1 - 20
21 - 300
301 - 500
> 500
Bolivia
SOUTH AMERICA
Pisiga
Santa Ana de Yacuma
Puerto Rico
Sena
Nueva Esperanza
Puerto Siles
Puerto Heat
Santos Mercado
Versalles
Pto. Villazon
San Matias
Robore
San Vicente
Pto. Busch
Palmar de las Islas
Hito Villazon
Cañada Oruro
Laguna Verde
Zoniquera
Tambo Quemado
Tahua
Ollague
Baures

Bolivia Coca Survey for 2006
46
Farm-gate prices of sun-dried coca leaf have been collected in Chapare on a monthly basis by DIGPROCOCA (former DIRECO) since 1990 and by the UNODC monitoring project in the Yungas of La Paz since 2004. Average annual prices for coca leaf were higher in the Yungas of La Paz with 36 Boliviano/kg (US$ 4.4/kg) than in the Chapare with 26 Boliviano/kg (US$ 3.2/kg).
Table 10: Monthly sun-dried coca leaf price in the Yungas of La Paz, 2006
Month Municipality of Coripata
Municipality of
Chulumani
Municipality of La
Asunta
Municipality of Caranavi Average
Bs./kg Bs./kg Bs./kg Bs./Kg Bs./kg US$/kg Jan 35 34 37 37 36 4.4 Feb 35 33 37 37 36 4.4 Mar 34 33 37 37 36 4.4 Apr 33 34 36 37 35 4.4 May 33 35 36 38 36 4.4 Jun 36 35 38 38 37 4.6 Jul 36 35 38 38 37 4.5 Aug 36 35 38 37 36 4.5 Sep 34 34 37 37 36 4.4 Oct 34 34 37 37 35 4.4 Nov 36 34 37 37 36 4.4 Dec 33 34 37 37 35 4.4 Annual average 35 34 37 37 36 4.4
Source: UNODC monitoring project
Compared to 2005, in 2006, sun-dried coca leaf prices decreased slightly to Bs. 36/kg in the Yungas.
Table 11: Reported monthly sun-dried coca leaf prices in the Chapare, 2006
Month Bs./kg US$/kg January 32.4 4.0 February 26.4 3.3 March 22.9 2.8 April 21.7 2.7 May 2.0 2.7 June 25.4 3.1 July 28.4 3.5 August 24.9 3.1 September 27.7 3.4 October 29.5 3.7 November 26.5 3.3 December 26.5 3.3 Anual average 26.2 3.2
Source: DIGPROCOCA
For second year in a row, coca leaf prices in Chapare region decreased, from Bs. 33/kg in 2005 to Bs. 26.2 in 2006 (-26%). The decrease in prices can be attributed to the increase in the offer, and also to the increased interdiction efforts in the region that disturbed the coca market and made it less attractive for coca leaf buyers.

Bolivia Coca Survey for 2006
47
Figure 16: Monthly sun-dried coca leaf price in the Yungas of La Paz and Chapare, 2006
0.0
0.5
1.0
1.5
2.0
2.5
3.0
3.5
4.0
4.5
5.0
Jan Feb Mar Apr May Jun Jul Aug Sep Oct Nov Dec
$US
/Kg
Yungas Chapare Digeco
Sources: UNODC monitoring project/ /DIGPROCOCA/ DIGCOIN
Weighted by production, the annual average price for coca leaf on the market controlled by DIGCOIN was US$ 4.0/kg. Outside this market, the price was slightly higher, US$ 4.1/kg. However, during the dry season when less coca leaves were available, prices from the markets controlled by DIGCOIN were similar and even larger than prices on other markets.
Prices of coca leaves have not been systematically recorded for Apolo. Anecdotal information reported much lower prices in Apolo than elsewhere in the country, ranging from US$ 2.5 to US$ 2.8/kg in 2005. The reason for lower prices in Apolo could be attributed to the remoteness of the region, far from the main trading centers. The low coca leaf production in Apolo (281 mt) was rather negligible compared to the national total, and therefore was not taken into account in the establishment of the national annual price estimate.
The long term trend of prices can be appreciated with prices of coca leaves from Chapare collected by DIRECO since 1990. Following a strong price rise in 1999 – in line with a strong increase in eradication – sun-dried coca leaf prices reached a peak of US$ 5.7 /kg in 2000. Since then, prices fell to the lowest level since 1998 to $US 3.2/kg in 2006. However, coca leaf prices in Bolivia continued to be substantially higher than in neighboring Peru (US$ 2.5/kg).
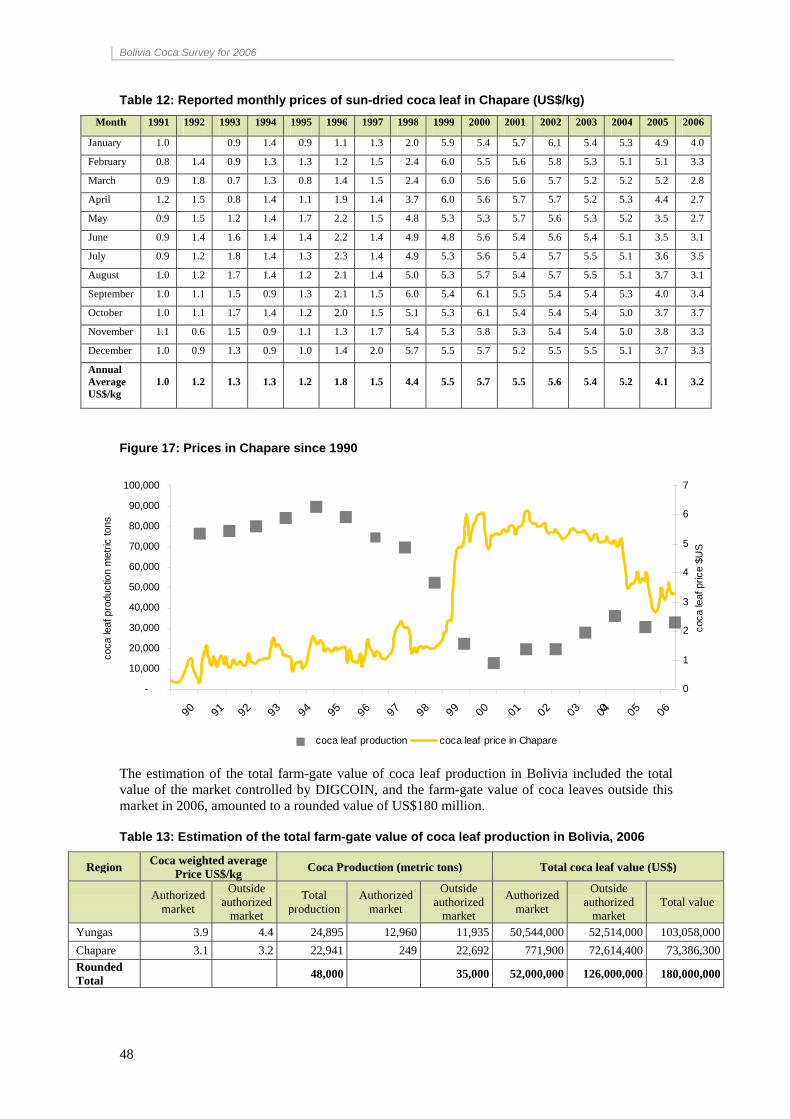
Bolivia Coca Survey for 2006
48
Table 12: Reported monthly prices of sun-dried coca leaf in Chapare (US$/kg) Month 1991 1992 1993 1994 1995 1996 1997 1998 1999 2000 2001 2002 2003 2004 2005 2006
January 1.0 0.9 1.4 0.9 1.1 1.3 2.0 5.9 5.4 5.7 6.1 5.4 5.3 4.9 4.0
February 0.8 1.4 0.9 1.3 1.3 1.2 1.5 2.4 6.0 5.5 5.6 5.8 5.3 5.1 5.1 3.3
March 0.9 1.8 0.7 1.3 0.8 1.4 1.5 2.4 6.0 5.6 5.6 5.7 5.2 5.2 5.2 2.8
April 1.2 1.5 0.8 1.4 1.1 1.9 1.4 3.7 6.0 5.6 5.7 5.7 5.2 5.3 4.4 2.7
May 0.9 1.5 1.2 1.4 1.7 2.2 1.5 4.8 5.3 5.3 5.7 5.6 5.3 5.2 3.5 2.7
June 0.9 1.4 1.6 1.4 1.4 2.2 1.4 4.9 4.8 5.6 5.4 5.6 5.4 5.1 3.5 3.1
July 0.9 1.2 1.8 1.4 1.3 2.3 1.4 4.9 5.3 5.6 5.4 5.7 5.5 5.1 3.6 3.5
August 1.0 1.2 1.7 1.4 1.2 2.1 1.4 5.0 5.3 5.7 5.4 5.7 5.5 5.1 3.7 3.1
September 1.0 1.1 1.5 0.9 1.3 2.1 1.5 6.0 5.4 6.1 5.5 5.4 5.4 5.3 4.0 3.4
October 1.0 1.1 1.7 1.4 1.2 2.0 1.5 5.1 5.3 6.1 5.4 5.4 5.4 5.0 3.7 3.7
November 1.1 0.6 1.5 0.9 1.1 1.3 1.7 5.4 5.3 5.8 5.3 5.4 5.4 5.0 3.8 3.3
December 1.0 0.9 1.3 0.9 1.0 1.4 2.0 5.7 5.5 5.7 5.2 5.5 5.5 5.1 3.7 3.3
Annual Average US$/kg
1.0 1.2 1.3 1.3 1.2 1.8 1.5 4.4 5.5 5.7 5.5 5.6 5.4 5.2 4.1 3.2
Figure 17: Prices in Chapare since 1990
-
10,000
20,000
30,000
40,000
50,000
60,000
70,000
80,000
90,000
100,000
90 91 92 93 94 95 96 97 98 99 00 01 02 03 004 05 06
coca
leaf
pro
duct
ion
met
ric to
ns
0
1
2
3
4
5
6
7
coca
leaf
pric
e $U
S
coca leaf production coca leaf price in Chapare
The estimation of the total farm-gate value of coca leaf production in Bolivia included the total value of the market controlled by DIGCOIN, and the farm-gate value of coca leaves outside this market in 2006, amounted to a rounded value of US$180 million.
Table 13: Estimation of the total farm-gate value of coca leaf production in Bolivia, 2006
Region Coca weighted average Price US$/kg Coca Production (metric tons) Total coca leaf value (US$)
Authorized market
Outside authorized
market
Total production
Authorized market
Outside authorized
market
Authorized market
Outside authorized
market Total value
Yungas 3.9 4.4 24,895 12,960 11,935 50,544,000 52,514,000 103,058,000 Chapare 3.1 3.2 22,941 249 22,692 771,900 72,614,400 73,386,300 Rounded Total 48,000 35,000 52,000,000 126,000,000 180,000,000

Bolivia Coca Survey for 2006
49
The decrease of coca value in 2006, in spite of the increase in the production, is due to the decrease in prices in both, Yungas and Chapare regions.
The total farm-gate value of coca leaf production in 2006 was thus equivalent to 2.0% of the projected Bolivian GDP5 of US$ 8.7 billions for 2006, or 13% compared with the projected value of the licit agricultural sector of US$ 1.1 billions in 2006. These figures suggest that, for the country as a whole, coca production still has and impact on the Bolivian economy, and continues to play an important role within the coca producing regions.
The FELCN also reported street prices of cocaine paste and cocaine of unknown purity from the major cities and coca growing regions in Bolivia.
Table 14: Reported prices of cocaine base and cocaine HCL, Bolivia, 2006 (US$/kg)
City Cocaine base Cocaine HCL
La Paz 950 2,000
Cochabamba 1,550 1,760
Santa Cruz 1,200 1,850
Region
Yungas of La Paz 800 1,100
Chapare 1,000 1,500
Source: FELCN
It is interesting to note that prices for coca leaf and its derivatives were consistently higher in Bolivia than in neighboring Peru.
Table 15: Prices for coca leaf and its derivatives in Peru and Bolivia, 2006 (US$/kg)
Products Peru Bolivia
Coca leaf 2.52 4.1
Cocaine base (in coca producing regions) 550 900
Cocaine HCl 823 1,800
5 Source: INE 2006

Bolivia Coca Survey for 2006
50
Map 11: Coca cultivation and National Parks, Bolivia 2006
!
!
^
!
!
!
!
!
!
Rio Pi lcomayo
Madera
Madre de Dios
RioM
amore
Rio Itenez
Rio
Beni
Beni
Santa Cruz
Potosi
La Paz
Pando
Oruro
Tarija
Chuquisaca
Cochabamba
Sucre
Oruro
Tarija
Potosi
La Paz
Cobija
Trinidad
Santa Cruz
Cochabamba
B R A Z I L
A R G E N T I N A
C H I L EPA R A G U AY
PE
RU
60°W
60°W
65°W
65°W
70°W
70°W
10°S
10°S
15°S
15°S
20°S
20°S
25°S
25°S
Chapare
YungasTiticaca lake
Apolo
Manuripi Heat
Madidi
ApolobambaPilon Lajas
Est. Biológicadel Beni
Isiboro Secure
CarrascoAmboro
Cotapata
Tunari
Sajama
Noel KempffMercado
Toro Toro
El PalmarKaa Iya delGran Chaco
San Matias
Otuquis
EduardoAvaroa
Cordillera deSama
Tariquia
Source: Government of Bolivia - National monitoring system supported by UNODC.The boundaries and names shown and the designation used on this map do not imply official endorsement or acceptance by the United Nations.
Cultivation density(ha/km² )
National parks
National parks affectedby coca cultivation
Yun... :Department boundariesInternational boundaries
Coca growing areas
0.1 - 1
1.1 - 4.0
> 4
1:8,000,000Geographic coordinates, WGS 1984
0 300150 km
Bolivia
SOUTH AMERICA
Poopo lake

Bolivia Coca Survey for 2006
51
Coca cultivation in National Parks
There are 21 protected areas and national parks in Bolivia, totaling an area of 165,000 sq km, representing 15% of the national territory. In 2006, once again coca cultivation was found in three national parks. In the national park of Madidi, Apolo region, only about 10 hectares of coca cultivation were found. A much larger amount of 1,950 ha of coca cultivation was found in the two national parks Isiboro Secure and Carrasco, in Chapare region. Coca cultivation within these two National Parks represented 28% of the coca cultivation of Chapare region.
Between 2004 and 2005, coca cultivation decreased by 52% in the areas of the National Parks. However, between 2005 and 2006, an important increase occurred in the Isiboro Secure National Park. Ecosystems of the National Parks are particularly fragile and the deforestation for the establishment of coca cultivation causes irreversible damage to their environment.
Table 16: Coca cultivation estimates by national parks in Chapare 2003 – 2005 (ha)
Area 2003 2004 2005 2006 % change 2005 - 2006 % of 2006 total
Isiboro Secure Nacional Park 1,605 2,807 1,161 1,451 25% 17% Carrasco National Park 778 1,257 781 837 7% 10% Madidi National Park n.a. 10 10 10 0% 0% Total within National Parks 2,383 4,074 1,952 2,298 18% 28% Outside National Parks 4,917 6,026 5,053 6,002 19% 72% Rounded Total 7,300 10,100 7,005 8,300 18% 100%
Figure 18: Distribution of coca cultivation in Chapare region inside and outside national parks, 2003 – 2006 (ha)
0
1000
2000
3000
4000
5000
6000
7000
Total within National Parks Outside National Parks
hect
are
2003 2004 2005 2006

Bolivia Coca Survey for 2006
52
Reported eradication
In 2006, the Bolivian Government reported the eradication of 5,070 ha of coca fields. Ninety-nine percent of this total has been eradicated in Chapare, and only one percent in Yungas of La Paz. Eradication decreased by 17% compared to the level of eradication in 2005. This is the lowest level of eradication in the past 10 years. In Bolivia, the eradication of coca cultivation is exclusively manual, and no chemical or spraying agents are used.
Figure 19: Reported eradication and coca cultivation in Bolivia, 1995 – 2006 (ha)
0
10,000
20,000
30,000
40,000
50,000
60,000
hect
are
Eradication 5,498 7,512 7,026 11,621 16,999 7,953 9,435 11,853 10,087 8,437 6,073 5,070
Coca cultivation 48,600 48,100 45,800 38,000 21,800 19,600 19,900 24,400 22,800 27,600 25,400 27,500
95 96 97 98 99 00 01 02 03 04 05 06
Sources: For coca cultivation: UNODC; for eradication: DIGPROCOCA
Manual eradication of a coca field in Chapare

Bolivia Coca Survey for 2006
53
Reported seizures
DIGCOIN controls the trade of coca leaves within the country, which also includes control over the transport of coca leaves. Coca leaves are seized if transported without license or outside the authorized route specified in the license. In 2006, DIGCOIN captured 1,343 metric tons of coca leaves, representing a significant increase of 52% compared to the reported seizure of 886 metric tons in 2005. The increase in seizure of coca leaf can be attributed to the strengthening of DIGCOIN’s special force for the control of coca leaves (Grupo Especial de Control de la Hoja de Coca, GECC), which included the control of additional roads, and improvement in equipment and infrastructure.
Table 17: Reported seizure of coca leaves, 2002 – 2006 (kg)
Department 2002 2003 2004 2005 2006 La Paz 31,291 22,375 66,396 172,331 197,854 Cochabamba 214 11,105 37,748 591,803 1,030,834 Santa Cruz 7,343 20,828 30,441 68,508 52,018 Tarija 1,407 4,451 10,183 16,499 19,604 Oruro 1,205 4,682 6,120 24,814 21,913 Potosi 357 1,321 1,942 1,509 4,010 Sucre 0 1,450 1,448 3,229 11,780 Beni 728 600 904 7,525 4,778 Pando 0 0 0 50 271 Total 42,544 66,811 155,182 886,268 1,343,062
Figure 20: Reported seizure of coca leaves, 2003 - 2006 (kg)
0
200,000
400,000
600,000
800,000
1,000,000
1,200,000
La P
az
Coc
haba
mba
Sant
a C
ruz
Tarij
a
Oru
ro
Poto
si
Sucr
e
Beni
kg
2002 2003 2004 2005 2006

Bolivia Coca Survey for 2006
54
The Special Force for the Fight against Drugs (FELCN) reports annually on drugs seizures. Between 2005 and 2006, there was a significant increase of 36% in reported seizure of cocaine base. The peak in seizure of cocaine HCL in 2003 was due to an exceptional operation conducted by FELCN. The graph also shows that seizure of cocaine base increased steadily since 2001. The same trend can be seen in the report of destruction of maceration pit and clandestine coca paste or cocaine laboratories.
Table 18: Reported seizure of drugs in Bolivia, 1997 – 2006 (kg)
Product 1997 1998 1999 2000 2001 2002 2003 2004 2005 2006 Cocaine base 10,848 8,906 6,905 5,044 4,280 4,741 6,934 8,189 10,152 12,779Cocaine HCL 1,477 2,440 802 555 334 362 5,969 531 1,300 1,309Heroin 2.9 0.8 0 0 0 0 0 0 0 0Cannabis 3,617 320 2,160 3,745 7,055 8,754 8,510 28,200 31,390 125,356
Source: FELCN
Figure 21: Reported seizure of cocaine base and cocaine HCL, Bolivia, 1997 – 2006 (kg)
0
2000
4000
6000
8000
10000
12000
14000
1997 1998 1999 2000 2001 2002 2003 2004 2005 2006
kg
Cocaine base Cocaine HCL
Table 19: Reported destruction of clandestine laboratories and macerations pits, 1998 - 2006
Type 1998 1999 2000 2001 2002 2003 2004 2005 2006 Coca paste and/or cocaine labs. 1,245 925 628 1,006 1,420 1,769 2,254 2,619 4,070Precursors laboratories 15 8 3 2 6 0 3 2 2Cocaine laboratories only 4 3 17 3 1 0 4 3 3Maceration pits 1,659 1,179 790 1,292 1,950 2,544 3,293 4,064 6,268

Bolivia Coca Survey for 2006
55
Figure 22: Reported destruction of clandestine laboratories and macerations pits
0
1,000
2,000
3,000
4,000
5,000
6,000
7,000nu
mbe
r of d
estru
ctio
n
Reported destruction of clandestinelaboratories in Bolivia 1997 - 2006
1,066 1,245 925 628 1,006 1,420 1,769 2,254 2,619 4,070
Maceration pit 1,481 1,659 1,179 790 1,292 1,950 2,544 3,293 4,064 6,268
1997 1998 1999 2000 2001 2002 2003 2004 2005 2006

Bolivia Coca Survey for 2006
56

PART 3. COLOMBIA


Colombia Coca Survey for 2006
59
FACT SHEET – Colombia Coca Survey for 2006
2005 Variation 2006
Net coca cultivation (rounded total) 86,000 hectares -9% 78,000 hectares
Of which Meta-Guaviare region 25,970 hectares -21% 20,540 hectares
Pacific region 17,650 hectares +7% 18,810 hectares
Putumayo-Caqueta region 13,950 hectares +23% 17,220 hectares
Central region 15,630 hectares -22% 12,130 hectares
Elsewhere 12,570 hectares -27% 9,170 hectares
Reported cumulative aerial spraying of coca bush 138,775 hectares +24% 172,025 hectares
Reported manual eradication of coca bush 31,285 hectares +33% 41,530 hectares
Average farm-gate price of coca paste US$ 910/kg
COP 2,109,000/kg -3%
US$ 879/kg
COP 2,070,000/kg
Total farm-gate value of the production of coca leaf and its derivatives
US$ 843 million -19% US$ 683 million
in % of GDP6 0.7% 0.5%
in % of GDP of agricultural sector 6% 5%
No. of households involved in coca cultivation
68,600 households -2% 67,000 households
Annual household gross income from the production of coca leaf and its derivatives
US$ 12,300 -17% US$ 10,194
Potential production of cocaine 640 mt -5% 610 mt
in % of world cocaine production 65% 62%
Average wholesale cocaine price US$ 1,860/kg
COP 4,315,000/kg -5%
US$ 1,762/kg
COP 4,155,000/kg Reported opium poppy cultivation 1,950 hectares -48% 1,023 hectares
Potential opium latex production 59 mt -47% 31 mt
Potential heroin production 2.5 mt -48% 1.3 mt
Average farm-gate price of opium latex US$ 230/kg +9% US$ 251/kg
Average heroin price US$ 9,070/kg +10% US$ 9,992/kg
Reported seizures of cocaine 173,265 kg -27% 127,326 kg
Reported seizures of heroin 745 kg -41% 442 kg
Reported destruction of clandestine laboratories7
1,953 +16% 2,270
6 GDP of the respective year as reported by the Government. 7 Includes laboratories processing coca paste/cocaine base, cocaine hydrochloride, heroin, morphine, potassium permanganate, and non-specified.

Colombia Coca Survey for 2006
60
ABBREVIATIONS
COP Colombian Pesos DANE National Department of Statistics DEA US Drugs Enforcement Administration DIRAN Colombian Anti-Narcotics Police DNE National Narcotics Office DNP National Planning Department GME Mobile Eradication Groups ICMP Illicit Crop Monitoring Programme INCB International Narcotics Control Board IDB Inter-American Development Bank NNPS National Natural Parks System OAS Organization of American States PDA Alternative Development Programme PCI Presidential Programme against Illicit Crops RSS Social Solidarity Net SIMCI Integrated Illicit Crops Monitoring System UNODC United Nations Office on Drugs and Crime. USAID United States Agency for International Development US$ United States Dollars mt Metric tons ACKNOWLEDGEMENTS
The following organizations and individuals contributed to the implementation of the 2006 coca cultivation survey in Colombia, and to the preparation of the present report:
Government of Colombia:
Ministry of Interior and Justice National Narcotics Office (DNE) Anti-Narcotics Police (DIRAN) Ministry of Defence Presidential Agency for Social Action and International Cooperation UNODC: Rodolfo Llinas, SIMCI Project Coordinator Orlando González, Digital Processing Expert Sandra Rodríguez, Digital Processing Expert Zully Sossa, Digital Processing Expert Maria Isabel Velandia, Digital Processing Expert Martha Paredes, Research and Analysis Expert Leonardo Correa, Field Engineer Juan Carlos Parra, Editing Engineer Martha Luz Gutierrez, Administrative Assistant Javier Espejo, Assistant Engineer Maria Ximena Gualdron, Assistant Engineer Sandro Calvani, Representative for Colombia Guillermo Garcia, Programme Officer Coen Bussink, Remote Sensing and GIS Expert (UNODC – Research and Analysis Section - ICMP) Anja Korenblik, Programme Manager (UNODC – Research and Analysis Section - ICMP) Thibault le Pichon, Chief (UNODC – Research and Analysis Section) Thomas Pietschmann, Research Officer (UNODC-Research and Analysis Section) Martin Raithelhuber, Programme Officer (UNODC-Research and Analysis Section) Javier Teran, Statistician (UNODC – Research and Analysis Section – ICMP The implementation of UNODC's Illicit Crop Monitoring Programme in the Andean region and the Colombia survey 2006 was made possible thanks to financial contributions from the Governments of Austria, Colombia, France, the Netherlands, Turkey, the United Kingdom, the United States of America, and from the European Commission.

Colombia Coca Survey for 2006
61
CONTENTS
1 INTRODUCTION......................................................................................................................62
2 FINDINGS ..................................................................................................................................64 COCA CULTIVATION..................................................................................................................... 64
National cultivation ................................................................................................................64 Regional Analysis ...................................................................................................................71 Possible areas of new cultivation ...........................................................................................82
COCA LEAF, COCA PASTE AND COCAINE BASE PRODUCTION ......................................... 83
Potential cocaine production..................................................................................................86
COCA PRICES.................................................................................................................................. 87
Coca leaf, cocaine base and cocaine prices ...........................................................................87 Coca leaf prices ......................................................................................................................88 Coca paste prices....................................................................................................................88 Cocaine base prices................................................................................................................89 Cocaine prices ........................................................................................................................90 Income per hectare .................................................................................................................90
SUPPLY REDUCTION..................................................................................................................... 93
Reported forced manual eradication ......................................................................................93 Reported aerial spraying ........................................................................................................96 Reported seizures....................................................................................................................99

Colombia Coca Survey for 2006
62
Map 12: Coca cultivation density in Colombia, 2006
PacificOcean
Caribbean Sea
Rí oM
ag dalena
Rí
o M eta
Río Vichada
RíoC
auc
aRí
o Mag
da
le
na
Río Guaviare
Río P utuma yo
Río Caquetá
R ío Meta
Río
Atrat
o
PANAMA
Rí oAmazonas
Río Inírida
RíoO
rinoco
Vichada
Vaupés
Valle
Tolima
Sucre
Santander
Risaralda
Quindío
Putumayo
Norte deSantander
Nariño
Meta
Magdalena
LaGuajira
HuilaGuaviare
Guainía
Cundinamarca
Córdoba
Chocó
Cesar
Cauca
Casanare
Caquetá
Caldas
Boyacá
Bolívar
Atlántico
AraucaAntioquia
Amazonas
VENEZUELA
PERU
ECUADOR
BRAZIL
Neiva
Tumaco
San JoséPopayán
PuertoAsís
Cucutá
Cartagena
Pasto
Cali
Florencia
Medellín
Barranquilla
Bogotá
Mitú
Leticia
Arauca
PuertoCarreño
75°W
75°W 70°W
70°W
5°S
5°S
0° 0°
5°N
5°N
10°N
10°N
South America
Source: Government of Colombia - National monitoring system supported by UNODCThe boundaries and names shown and the designations used in this map do not imply official endorsement or acceptance by the United Nations
Colombia
Geographic coordinates WGS 84
1500 300km
Cultivation density
International boundariesDepartment boundaries
0.1 - 1.01.1 - 4.0> 4.0
(ha/km²)

Colombia Coca Survey for 2006
63
1 INTRODUCTION
The objectives of UNODC’s Illicit Crop Monitoring Programme (ICMP) are to establish methodologies for data collection and analysis, to increase the governments’ capacity to monitor illicit crops on their territories and to assist the international community in monitoring the extent and evolution of illicit crops in the context of the elimination strategy adopted by the Member States at the U.N. General Assembly Special Session on Drugs in June 1998. ICMP presently covers seven countries: Colombia, Bolivia and Peru for coca; Afghanistan, Lao PDR and Myanmar for opium and Morocco for cannabis.
During the 1980’s and 1990’s, Colombia became the country with the largest illicit coca growing area and cocaine production in the world. Illicit coca cultivation in the country expanded steadily throughout this period, in particular in remote areas of the Amazon basin. Although coca cultivation started to decrease in 2001, Colombia remains the largest coca-growing country in the world.
UNODC has supported the monitoring of illicit crops since 1999, and has produced eight annual surveys through a special satellite based analysis programme called SIMCI (from the Spanish initials). In October 2006, UNODC signed a new agreement with the Colombian government to continue and expand monitoring and analysis work. In this context, the SIMCI II project facilitates the implementation of additional tasks in the framework of an integrated approach to analyse the drug problem in Colombia. The project also supports the monitoring of related problems such as fragile ecosystems, natural parks, indigenous territories, the expansion of the agricultural frontier and deforestation. It provides Geographic Information System support to the government’s alternative development projects and its Forest Warden Families Programme.
The new project foresees the creation of an Inter-Institutional Committee permanently assigned to govern the project in order to ensure the transfer of know-how to the national beneficiary institutions. SIMCI II is a joint project between UNODC and the Colombian government, represented by the Ministry of Interior and Justice and the International Cooperation Agency. The national counterpart is the Ministry of Interior and Justice.
The project is managed by a technical coordinator and composed of engineers and technicians: four digital image processing specialists, one field engineer, a cartographic technician, a research and analysis specialist, two assistant engineers and an administrative assistant. The team cooperates with technicians from the Police Antinarcotics Division (DIRAN) and National Parks Administration. It supports several studies and investigations for government and private institutions, related to land use, environment, licit crops, etc. SIMCI provides to the above-mentioned institutions experts, access to its Spatial Information Data Bank, transfer of technology and guidance to achieve their goals. Organizations that benefited from SIMCI support include the National Directorate for Statistics (DANE), local governments, the National Federation of Coffee Growers, NGOs as well as other UN agencies and projects.
The project has developed technical agreements with several national and foreign Universities, to interchange and share knowledge, for training activities and joint projects. Among them are BOKU University in Austria, Zaragoza University in Spain, Antonio Nariño and other Universities in Colombia.

Colombia Coca Survey for 2006
64
2 FINDINGS
Coca cultivation
National cultivation
In 2006, the total area under coca cultivation in Colombia decreased by 8,000 hectares to 78,000 hectares, a 9% decrease compared to 2005 (86,000 hectares). The area under coca cultivation in 2006 was 52% lower compared to the peak estimate of 163,000 hectares in 2000.
Similarly to the previous four surveys, the 2006 survey represents the situation as of the end of the year, in this case as of December 2006. As was the case last year, the survey covered the whole country and detected coca cultivation in 23 out of 32 departments. In 2006, the area under coca cultivation represents 0.07% of the total national territory.
Figure 23: Coca cultivation in Colombia (hectares), 1996 – 2006
0
20,000
40,000
60,000
80,000
100,000
120,000
140,000
160,000
180,000
1996 1997 1998 1999 2000 2001 2002 2003 2004 2005 2006
Hec
tare
s
US Department of State National Monitoring System supported by UNODC
The decrease in coca cultivation between 2005 and 2006 corresponds with a high level of aerial spraying, which reached 172,025 hectares in 2006. In fact, aerial spraying of coca cultivation has remained above 130,000 hectares since 2002. In 2006, the Colombian Government also reported the additional manual eradication of 41,530 hectares of coca cultivation. This level of manual eradication is 10,245 hectares higher than the previous year's record of 31,285 hectares.
Analysis of coca cultivation changes
Coca cultivation is dynamic in Colombia. A range of variables can be associated with increases and decreases of the cultivation area over time. Factors like favourable prices, pressure exerted by armed groups on farmers, economic crises, and temporary crisis situations can all lead to an increase in the cultivated area. On the other hand, factors such as forced eradication, aerial spraying, plant diseases, improved security conditions, and increased alternative livelihood options can contribute to reducing the cultivated area. The coca cultivation survey does not endeavour to assess how or to what extent these factors bring about change in the area under coca cultivation. Rather, it shows the situation on a given date of the year (31st of December).
The multitemporal analysis of coca cultivation is done on imagery of 2005 and 2006 and therefore, concepts like “abandoned” or “new” fields refer exclusively to this period. At the end of the 2005-2006 period, 24% of the fields were the same as identified at the beginning 2006, and

Colombia Coca Survey for 2006
65
can be considered as “stable”, as well as 16% of the fields that were identified in previous years and abandoned temporarily. 13% of the fields replaced primary forest vegetation and therefore were newly planted during this period. The remaining 48% of the fields replaced other types of vegetation like pastures or bare soil, but could also have been planted and then abandoned in previous years.
Table 20: Stable and new fields of coca bush in 2006
Stable area 2005-2006 New area in 2006
In period 2005-2006
In previous years and 2006
Primary forest 2005
Other vegetation
2005
Total
Area 18,473 12,151 9,998 37,258 77,870
Percentage 24 15 13 48 100
The multitemporal analysis of the last six years showed that 54% of the coca fields identified in 2006 were cultivated with coca in one or more years in this period. The analysis of the data also showed that the average coca field size continued to decrease since 2001 from 2.05 hectares to 1.13 hectares in 2005 and to 0.85 hectares in 2006. A possible explanation could be that farmers reduced the size of their coca fields to avoid detection and aerial spraying.
The ten municipalities listed below had the highest municipalities coca cultivation in Colombia, representing 46% of the national total coca cultivation and 50% of national potential cocaine production. Though the municipality of Tumaco in the Pacific region has the largest coca cultivation area in Colombia (9% of the national total), the municipality of Cumaribo in Orinoco region has the highest potential production of cocaine (11% of the national total) due to the high yield.
Table 21: The ten municipalities with the highest coca cultivation area and cocaine potential production, 2006
Municipality Department Coca cultivated area (hectares)
% of coca cultivation area in
Colombia
Potential cocaine production (mt)
Tumaco Nariño 7,128 9.1% 21Cumaribo Vichada 5,469 7.0% 58 San Jose del Guaviare Guaviare 3,814 4.9% 43 Puerto Rico Meta 3,521 4.5% 40 Mapiripan Meta 3,311 4.3% 37 El Retorno Guaviare 2,827 3.6% 32 Puerto Leguizamo Putumayo 2,551 3.3% 18 Puerto Asis Putumayo 2,512 3.2% 18 Vista Hermosa Meta 2,289 2.9% 26 Puerto Guzman Putumayo 2,083 2.7% 15
Total 35,505 46% 307

Colombia Coca Survey for 2006
66
Map 13: Coca cultivation density change in Colombia, 2005 - 2006
PacificOcean
Caribbean Sea
PANAMA VENEZUELA
PERU
ECUADOR
BRAZIL
Vichada
Vaupés
ValleTolima
Sucre
Santander
Risaralda
Quindío
Putumayo
Norte deSantander
Nariño
Meta
Magdalena
LaGuajira
Huila
Guaviare
Guainía
Cundinamarca
Córdoba
Chocó
Cesar
Cauca
Casanare
Caquetá
Caldas
Boyacá
Bolívar
Atlántico
AraucaAntioquia
Amazonas
Neiva
Tumaco
San JoséPopayán
PuertoAsís
Cucutá
Cartagena
Pasto
Cali
Florencia
Medellín
Barranquilla
Bogotá
Mitú
Leticia
Arauca
PuertoCarreño
75°W
75°W 70°W
70°W
5°S
5°S
0° 0°
5°N
5°N
10°N
10°N
South America
Source: Government of Colombia - National monitoring system supported by UNODCThe boundaries and names shown and the designations used in this map do not imply official endorsement or acceptance by the United Nations
Colombia
Geographic coordinates WGS 84
1500 300kmInternational boundaries
Department boundaries
Strong decreaseDecreaseStableIncreaseStrong increase

Colombia Coca Survey for 2006
67
In absolute numbers, the most important increases of coca crops between 2005 and 2006 were in the departments of Putumayo (+3,300 hectares) in the southern part of the country and Nariño (+1,731 hectares) in the southwest corner of the country. The increase in Putumayo corresponded to 37% of the area under coca cultivation in 2005, from 8,960 hectares to 12,254 hectares. Putumayo used to be the centre of coca cultivation, with 66,000 hectares in 2000. Coca cultivation had strongly declined until 2004 when Putumayo was the sixth largest cultivating area. However, due to increases in 2005 and 2006 this department now has the second largest cultivation level.
The largest reductions of coca crops took place in the department of Meta (-6,200 hectares). The department of Norte de Santander, at the border with Venezuela, had a small coca cultivation area in 2006, with less than 500 hectares. In 2001 Norte de Santander was among the departments with the highest coca cultivation levels with 9,145 hectares.
Compared to 2005, Nariño and Putumayo – with an combined increase of over 5,000 hectares – became the first two top departments in terms of coca cultivation, together accounting for 36% of the total area under coca cultivation in the country. In fact, 50% of the 2006 cultivation took place in just three departments Nariño, Putumayo and Meta, the same three departments that accounted for 46% of 2005 total cultivation.
Table 22: Coca cultivation by department, 2001 – 2006 (hectares)
Department Nov-2001
Dec-2002
Dec- 2003
Dec- 2004
Dec- 2005
Dec- 2006
% Change 2005-2006
% of 2006 total
Nariño 7,494 15,131 17,628 14,154 13,875 15,606 12% 20% Putumayo 47,120 13,725 7,559 4,386 8,963 12,254 37% 16% Meta 11,425 9,222 12,814 18,740 17,305 11,063 -36% 14% Guaviare 25,553 27,381 16,163 9,769 8,658 9,477 9% 12% Antioquia 3,171 3,030 4,273 5,168 6,414 6,157 -4% 8% Vichada 9,166 4,910 3,818 4,692 7,826 5,523 -29% 7% Caquetá 14,516 8,412 7,230 6,500 4,988 4,967 0% 6% Bolívar 4,824 2,735 4,470 3,402 3,670 2,382 -35% 3% Cauca 3,139 2,120 1,443 1,266 2,705 2,104 -22% 3% Arauca 2,749 2,214 539 1,552 1,883 1,306 -31% 2% Córdoba 652 385 838 1,536 3,136 1,216 -61% 2% Santander 415 463 632 1,124 981 866 -12% 1% Chocó 354 453 323 1,025 816 -20% 1% Guainía 1,318 749 726 721 752 753 0% 1% Amazonas 532 784 625 783 897 692 -23% 0.9% N. de Santander 9,145 8,041 4,471 3,055 844 488 -42% 0.6% Caldas 54 358 189 461 144% 0.6% Vaupés 1,918 1,485 1,157 1,084 671 460 -31% 0.6% Boyacá 245 118 594 359 342 441 29% 0.6% Valle del Cauca 184 111 37 45 28 281 904% 0.4% Magdalena 480 644 484 706 213 271 27% 0.3% Guajira 385 354 275 556 329 166 -50% 0.2% Cundinamarca 22 57 57 71 56 120 114% 0.2%
TOTAL 144,807 102,071 86,340 80,350 85,750 77,870 -9.2% Rounded Total 145,000 102,000 86,000 80,000 86,000 78,000 -9% Departments affected 22 21 23 23 23 23 0%

Colombia Coca Survey for 2006
68
Map 14: National Parks and coca cultivation in Colombia, 2006
PacificOcean
Caribbean Sea
R íoM
ag dalena
Rí
o M eta
Río Vichada
Río
Cauc
aRí
o Mag
da
le
na
Río Guaviare
Río P utuma yo
Río Caquetá
R ío Meta
Río
Atrat
o
PANAMA
Rí o Amazonas
RíoInír
ida
RíoO
rinoco
Vichada
Vaupés
ValleTolima
Sucre
Santander
Risaralda
Quindío
Putumayo
Norte deSantander
Nariño
Meta
Magdalena
LaGuajira
Huila
GuaviareGuainía
Cundinamarca
Córdoba
Chocó
Cesar
Cauca
Casanare
Caquetá
Caldas
Boyacá
Bolívar
Atlántico
AraucaAntioquia
Amazonas
VENEZUELA
PERU
ECUADOR
BRAZIL
Neiva
Tumaco
Puerto Asís
Popayán
Cucutá
Cartagena
Pasto
Cali
Florencia
Medellín
Barranquilla
Bogotá
SanJosé
Mitú
Leticia
Arauca
PuertoCarreño
75°W
75°W 70°W
70°W
5°S
5°S
0° 0°
5°N
5°N
10°N
10°N
South America
Sources: for coca cultivation Government of Colombia - National monitoring system supported by UNODC; for national parks UAESPNNThe boundaries and names shown and the designations used in this map do not imply official endorsement or acceptance by the United Nations
Colombia
International boundariesDepartment boundaries
National Parks
Coca cultivation 2006
La Macarena
Sierra Nevadade Santa Marta
Catatumbo
Paramillo
NukakPuinawai
La Paya
PicachosMunchique
Tinigua
Alto Fragua
Nukak National Park affected by cocacultivation in 2006
Geographic coordinates WGS 84
1500 300km
Yariguíes
Chiribiquete
El Tuparro

Colombia Coca Survey for 2006
69
Coca cultivation in national parks
The presence of illicit crops in both Natural Parks and Indigenous Territories has been monitored by SIMCI since the 2001 coca survey, and the data have been delivered to the relevant authorities to enable them to identify actions and projects to be applied for the preservation of its social and environmental characteristics.
The limits of National Parks and Indigenous territories have been provided by the official institutions in charge of their management. In 2005, the limits of National Parks were edited by the monitoring project in cooperation with technicians from the National Parks Administrative Unit. The editing improved the match between SIMCI cartographic material and the official boundaries of the Parks. National Parks boundaries are not always precise and therefore coca cultivation estimated in each of them depends on the accuracy of their delimitation. To enable annual comparison the same boundaries were used for each year.
Coca cultivation in 2006 was found in 14 of the 51 National Parks in Colombia. With 3,556 hectares in 2006, coca cultivation represented 0.02% of the total area covered by National Parks, and coca cultivation in National Parks represented 5% of the total level of coca cultivation in 2006.
Coca cultivation in National Parks showed a reduction of 41% in the period 2005 and 2006. This decrease was mainly due to a decrease in the National Parks of Sierra La Macarena (-1,665 hectares, or -50%), Paramillo (-450 hectares or -66%) and La Paya (-201 hectares or -28%). In most other National Parks, coca cultivation decreased, and it almost completely disappeared from the National Park of Alto Fragua. However, for the first time, the National Parks of Selva de Florencia and El Cocuy were affected by coca cultivation in 2006.
Table 23: Coca cultivation in National Parks, 2003 – 2006
National Parks 2003 2004 2005 2006 % Change 2005-2006
Sierra La Macarena 1,152 2,707 3,354 1,689 -50% Nukak 1,469 1,043 930 779 -16% La Paya 310 230 728 527 -28% Paramillo 110 461 686 236 -66% Tinigua 340 387 155 122 -21% Sierra Nevada 212 241 95 119 +25% Puinawai 33 139 60 41 -32% Catatumbo-Bari 129 107 55 22 -60% Munchique 1 8 13 6 -54% Los Picachos 13 15 7 6 -14% Yariguíes - - 2 4 +100% Selva de Florencia - - - 2 - El Cocuy - - - 2 - Alto Fragua 8 14 25 1 -96% Sanquianga 7 - - - - Farallones 2 - - - - Tayrona 4 1 - - - Total 3,790 5,353 6,110 3,556 Rounded total 3,800 5,400 6,100 3,600 -41%

Colombia Coca Survey for 2006
70
Map 15: Coca cultivation by region in Colombia, 2001-2006
PacificOcean
Caribbean Sea
PANAMA
Central
Meta -Guaviare
Putumayo -Caquetá Amazonia
Orinoco
Pacific
Sierra Nevada
Vichada
Vaupés
Valle
Tolima
Sucre
Santander
RisaraldaQuindío
Putumayo
Norte deSantander
Nariño
Meta
Magdalena
La Guajira
Huila
Guaviare
Guainía
Cundinamarca
Córdoba
Chocó
Cesar
Cauca
Casanare
Caquetá
Caldas
Boyacá
Bolívar
Atlántico
AraucaAntioquia
Amazonas
VENEZUELA
PERU
ECUADOR
BRAZIL
Tumaco
Neiva
PuertoAsís
Popayán
Cucutá
Cartagena
Pasto
Cali
Florencia
Medellín
Barranquilla
Bogotá
Mitú
Leticia
Arauca
PuertoCarreño
75°W
75°W 70°W
70°W
5°S
5°S
0° 0°
5°N
5°N
10°N
10°N
South America
Source: Government of Colombia - National monitoring system supported by UNODCThe boundaries and names shown and the designations used in this map do not imply official endorsement or acceptance by the United Nations
y g ,
Colombia
International boundariesDepartment boundaries
Coca cultivation (ha)
18,8
10
20,5
40
12,1
3017
,220
6,83
0
440
1,90
0
Geographic coordinates WGS 84
1500 300km
2002
2003
2004
2005
2006

Colombia Coca Survey for 2006
71
Regional Analysis
In 2006, 48% of coca cultivation in Colombia took place in the coca-growing regions of Meta-Guaviare and Putumayo-Caquetá. The largest increases took place in Putumayo-Caquetá (+3,270 hectares) in the southern part of the country bordering Ecuador, and in Pacifico (+1,174 hectares), in the corridor between the western range of mountains and the Pacific coastal region. Important decreases took place in: Orinoco (-2,880 hectares, -30%), in the northeastern part of the country bordering Venezuela; Meta-Guaviare (-5,423 hectares, -21%) in the southeastern part of Colombia and in the Central region (-3,501 hectares, -22%).
Table 24: Coca cultivation by region 2001 - 2006 (hectares)
Region 2001 2002 2003 2004 2005 2006 % Change
2005 - 2006
% of 2006 total
Meta-Guaviare 36,978 36,603 28,977 28,507 25,963 20,540 -21% 26%Pacific 11,171 17,362 19,561 15,789 17,633 18,807 +7% 24% Putumayo-Caqu. 61,636 22,137 14,789 10,888 13,951 17,221 +23% 22% Central 18,474 14,829 15,389 15,081 15,632 12,131 -22% 16% Orinoco 11,915 7,124 4,357 6,250 9,709 6,829 -30% 9% Amazonia 3,768 3,018 2,508 2,588 2,320 1,905 -18% 2% Sierra Nevada 865 998 759 1,262 542 437 -19% 1% Rounded Total 145,000 102,000 86,000 80,000 86,000 78,000 -9% 100%
Coca leaves

Colombia Coca Survey for 2006
72
Map 16: Coca cultivation density in the Meta-Guaviare region, Colombia 2006
RíoM
etaRío Vichada
Río Guaviare
Río Putumayo
Río Caquetá
Río Inírida
Río Caguán
Guaviare
Rí o Vau p e s
Vichada
Vaupés
Tolima
Santander
Putumayo
MetaHuila
Guainía
Cundinamarca
Casanare
Caquetá
Caldas
Boyacá
AraucaAntioquia
Amazonas
Miraflores
Calamar
El Retorno
LaMacarena
San Josédel Guaviare
PuertoConcordia
PuertoRico
VistaHermosa
MapiripánPuertoLleras
SanJuande Arama
Mesetas
ElCastillo
LaUribe
San Martín
San CarlosGuaroaSan Luis de
Cubarral
GuamalAcacias Villavicencio
Cumaral
Puerto López
CabuyaroPuertoGaitán
Yopal
Miraflores
Villavicencio
Bogotá
San José
Mitú
74°W
74°W
72°W
72°W
0° 0°
2°N
2°N
4°N
4°N
6°N
6°NCOLOMBIAPANAMA
VENEZUELA
PERU
ECUADORBRAZIL
Source: Goverment of Colombia - National monitoring system supported by UNODCThe boundaries and names shown and the designations used in this map do not imply official endorsement or acceptance by the United Nations
0 200km
100
Geographic coordinates WGS 84PERU
Cultivation density(ha/km²)
Department boundariesInternational boundaries
Meta Guaviare RegionRoadsMunicipality boundaries
Vaupés
> 8
0.1 - 1.01.1 - 2.02.1 - 4.04.1 - 8.0

Colombia Coca Survey for 2006
73
Meta-Guaviare region
Meta-Guaviare is traditionally the largest coca-producing region; however, the gap to the second largest cultivation area, the Pacific region, has closed due to a 21% decrease of coca cultivation in Meta-Guaviare in 2006.
Table 25: Coca cultivation in Meta-Guaviare, 2000 – 2006 (hectares)
Department 2000 2001 2002 2003 2004 2005 2006 % Change
Meta 11,123 11,425 9,222 12,814 18,740 17,305 11,063 -36%Guaviare 17,619 25,553 27,381 16,163 9,769 8,658 9,477 +9% Total 28,742 36,978 36,603 28,977 28,509 25,970 20,540 -21%Annual trend - +29% -1% -21% -2% -9% -21%
In 2004 and 2005, the department of Meta was the department with the highest level of coca cultivation, but it dropped to the third place in 2006, because of a decrease of 36%, from 17,305 hectares in 2005 to 11,036 hectares. The department of Meta included 14% of the national coca cultivation area.
In 2006, a record of 25,900 hectares of coca cultivation was sprayed and 5,176 hectares were eradicated manually in Meta department, which represented 82% of the total eradication and 64% of the total aerial spraying, which this region experienced. However, it has received very little support with alternative development programmes. Among the fourteen national parks surveyed, the National Park of Sierra de la Macarena, located within Meta department, had the largest level of coca cultivation within a protected area in 2006, with 1,689 hectares. This was a reduction of 1,665 hectares (-50%) from 2005 to 2006, mostly due to an intensive campaign of manual eradication (2,893 hectares) and aerial spraying (2,100 hectares) during the first seven months of 2006.
Guaviare was the department where coca cultivation first appeared in Colombia at the end of the seventies. Since then, coca cultivation remained important in the department. Though a significant decrease was noted in the past few years, this trend was reversed in 2006 when 9,477 hectares were detected. Guaviare accounted for 12% of the national total. Between 2005 and 2006, coca cultivation in the department of Guaviare increased from 8,658 hectares to 9,477 hectares (+9%). At the same time, aerial spraying increased from 11,900 hectares in 2005 to 14,700 hectares in 2006 (+24%) and manual eradication amounted 1,103 hectares.
Coca field in Guaviare

Colombia Coca Survey for 2006
74
Map 17: Coca cultivation density in the Pacific region Colombia 2006
PacificOcean
R ío C
auc a
Río M
agda
lena
RíoA
trato
Río Cagu
PANAMA
ECUADOR
Río San Juan
R
ío Patía
Valle
Tolima
Sucre
Putumayo
Nariño
MetaHuila
Cundinamarca
Córdoba
Chocó
Cauca
Caquetá
Caldas
Bolívar
Antioquia
Montería
Neiva
Manizales
Ibagué
Tumaco
Quibdó
Mocoa
Neiva
Popayán
Pasto
Cali
Florencia
Medellín
Bogotá
78°W
78°W
76°W
76°W0° 0°
2°N
2°N
4°N
4°N
6°N
6°N
8°N
8°N
COLOMBIA
PANAMAVENEZUELA
PERU
ECUADOR BRAZIL
Source: Government of Colombia - National monitoring system supported by UNODCThe boundaries and names shown and the designations used in this map do not imply official endorsement or acceptance by the United Nations
0 200km
100
Geographic coordinates WGS 84
Cultivation density(ha/km²)
Department boundaries
International boundaries
Pacific RegionRoads
> 8
0.1 - 1.01.1 - 2.02.1 - 4.04.1 - 8.0

Colombia Coca Survey for 2006
75
Pacific region
Nariño is located in the south-western part of the country, at the border with Ecuador. The geographic features of the region include high altitudes, as well as coastline. This contributed to the spread of cultivation of coca bush and opium poppy, as well as the maritime smuggling of illegal drugs and precursor chemicals through the department.
Table 26: Coca cultivation in the Pacific Region, 2000-2006 (hectares)
Department 2000 2001 2002 2003 2004 2005 2006 Change 2005-2006
Nariño 9,343 7,494 15,131 17,628 14,154 13,875 15,606 +20%Cauca 4,576 3,139 2,120 1,443 1,266 2,705 2,104 -25% Chocó 250 354 453 323 1,025 816 -20% Valle del 76 184 111 37 45 28 281 +904% Total 14,245 11,171 17,362 19,561 15,788 17,633 18,807 +7%Annual trend - -22% +55% +13% -19% +12% +7%
Coca cultivation in Nariño became significant in 2002, when coca cultivation decreased in the neighbouring departments of Putumayo and Caqueta. Between 2001 and 2002, coca cultivation decreased by 40,000 hectares in Caqueta and Putumayo, while increasing by 7,600 hectares in Nariño. Aerial spraying has been intense in Nariño department since 2000, exceeding 30,000 hectares in 2004 and 2005, and reaching a record 59,900 hectares in 2006. In addition, 7005 hectares of manual eradication were reported in 2006. However, in the period 2005-2006, coca cultivation increased 1,731 hectares.
In 2006, coca cultivation was found in 21 municipalities out of 64. With a total of 15,606 hectares of coca cultivation, Nariño was the department with the highest amount of land under illicit cultivation, corresponding to 12% of the total coca cultivation in the country. Nariño accounted for 37% of all the fields of less than ¼ hectare found in the country, indicating the small scale of the coca cultivation.
Even though the department of Nariño shows the largest amount of coca cultivation, the investment in alternative development programmes continues at a low level at national level (3.7% in completed programmes and 7.6% in ongoing programmes). In Cauca department, the investment maintained a level of 3.9% of the national total.
Like neighbouring Nariño department, Cauca has a long coastline, high mountain ranges and a mainly rural economy. Coca cultivation remained relatively low in Cauca department, however, following a period of continuous decreases between 1999 and 2004, coca cultivation increased between 2004 and 2005 by 1,420 hectares (+114%) but decreased again in 2006 (- 600 hectares) when 4,174 hectares of coca were manually eradicated.
Although its capital, Cali, was an important centre for narco-trafficking in the nineties, the department of Valle del Cauca always recorded less than 200 hectares under coca cultivation. In the period 2005-2006, it showed a dramatic increase of 253 hectares (900%), from 28 hectares to 281 hectares, despite the manual eradication of 246 hectares.

Colombia Coca Survey for 2006
76
Map 18: Coca cultivation density in the Putumayo-Caquetá region, Colombia 2006
RíoM
etaRí
o Mag
dalen
a
Río GuaviareRío
Putumayo
Río Caquetá
Río Amazonas
Río Inírida
R ío Caguá
n
Río Va upés
Vaupés
Valle Tolima
Putumayo
Nariño
Meta
Huila
Guaviare
Cundinamarca
Chocó
Cauca
CasanareCaldasBoyacá
Amazonas
Solano
SantiagoCurillo
Colón
Valparaiso Milán
AlbaniaSanFrancisco
Cartagena del Chaira
MocoaMorelia
San José dela Fragua
Florencia
La Montañita
El Paujil
El Doncello
PuertoRico
San Vicentedel Caguán
San Miguel
Valle delGuamuéz
Puerto Asís PuertoLeguizamo
PuertoCaicedoOrito
Solita
PuertoGuzmán
Villa Garzón
Neiva
Manizales
Ibagué
Mocoa
Yopal
Miraflores
Puerto Asís
Popayán
Pasto
Cali
Florencia
Villavicencio
Bogotá
San José
76°W
76°W 74°W
74°W
72°W
72°W
2°S
2°S
0° 0°
2°N
2°N
4°N
4°N
COLOMBIA
PANAMAVENEZUELA
PERU
ECUADORBRAZIL
Source: Government of Colombia - National monitoring system supported by UNODCThe boundaries and names shown and the designations used in this map do not imply official endorsement or acceptance by the United Nations
0 200km
100
PERU
ECUADOR
Geographic coordinates WGS 84
Caquetá
Cultivation density(ha/km²)
Department boundariesInternational boundaries
Putumayo Caquetá RegionRoadsMunicipality boundaries
> 8
0.1 - 1.01.1 - 2.02.1 - 4.04.1 - 8.0

Colombia Coca Survey for 2006
77
Putumayo-Caqueta region
In 2000, coca cultivation peaked in Putumayo department at 66,000 hectares, representing 40% of the national total. Following four years of consecutive decreases, coca cultivation in Putumayo was estimated at only 4,400 hectares or 5% of the national total in 2004. However, this trend was later reversed. Between 2004 and 2006, coca cultivation soared by 105% in 2005 and by 37% in 2006, putting this department on the second place of coca cultivation in the country. At the same time, 5,118 hectares were manually eradicated and aerial spraying increased from 11,800 hectares in 2005 to 26,500 hectares in 2006.
Table 27: Coca cultivation in the Putumayo-Caquetá region, 2000 - 2006 (hectares)
Department 2000 2001 2002 2003 2004 2005 2006 % Change 2005-2006
Putumayo 66,022 47,120 13,725 7,559 4,386 8,963 12,254 +37%Caquetá 26,603 14,516 8,412 7,230 6,500 4,988 4,967 0% Total 92,625 61,636 22,137 14,789 10,886 13,951 17,221 +23%Annual trend - -33% -64% -33% -26% +28% +23%
In 2002, the Government started implementing Plan Colombia in this department, combining actions of interdiction, aerial spraying, manual eradication and important alternative development projects with good results in the period 2002 to 2004. However, in 2006, only 0.4% of the budget of ongoing alternative development projects went to Putumayo, whereas this used to be 35% in the past four years. Most of the new coca fields were established on the foothills close to the border with Nariño department and along the riverside of the Putumayo and Caqueta rivers. Spraying is particularly difficult in these mountainous areas, which could be a reason for the shift of coca cultivation to higher regions.
In a belt of about 10 km width along the Ecuadorian border that covers about 550,000 hectares in the departments of Nariño and Putumayo, 7,000 hectares of coca cultivation were found in 2006. This represented an increase of almost 3,000 hectares (or 72%) compared to 2005.
In Caqueta department, coca cultivation peaked at 26,000 hectares in 2000 or 16% of the country total. Following intense aerial spraying that started in 1996 with 537 hectares and peaked in 2002 at 18,600 hectares, coca cultivation decreased. In 2006, coca cultivation was at its lowest level at 4,967 hectares, or 6% of the country total.
Putumayo

Colombia Coca Survey for 2006
78
Map 19: Coca cultivation density in the Central region, Colombia 2006
Caribbean Sea
Río M
eta
Río C
auca
Río
Atra
to
RíoM
agdalena
San Juan
Catatumbo
RíoC
atat
umbo
Sur de BolívarNorte de Antioquia
Valle
Tolima
Sucre
Santander
Risaralda
Norte de Santander
Meta
La Guajira
Huila
Cundinamarca
Córdoba
Chocó
Cesar
Cauca
Casanare
Bolívar
Atlántico
Arauca
Antioquia
Cartagena
Sincelejo
Bucaramanga
Montería
Manizales
Ibagué
Quibdó
Yopal
Cucutá
Valledupar
Santa Marta
Villavicencio
Medellín
Barranquilla
Bogotá
76°W
76°W 74°W
74°W
72°W4°
N
4°N
6°N
6°N
8°N
8°N
10°N
10°N
COLOMBIA
PANAMAVENEZUELA
PERU
ECUADORBRAZIL
Source: Government of Colombia - National monitoring system supported by UNODCThe boundaries and names shown and the designations used in this map do not imply official endorsement or acceptance by the United Nations
0 200km
100
VENEZUELA
Cultivation density(ha/km²)
Department boundariesInternational boundaries
Central RegionRoads
Geographic coordinates WGS 84
Caldas
Magdalena
Boyacá
> 8
0.1 - 1.01.1 - 2.02.1 - 4.04.1 - 8.0

Colombia Coca Survey for 2006
79
Central region
Since 2002, coca cultivation remained stable at around 15,000 hectares in the Central region of Colombia. Between 2005 and 2006, coca cultivation decreased by 22% to 12,131 hectares.
At the end of the nineties, Norte de Santander department was one of the most important centres of coca cultivation in the country, accounting for 10% of the country total in 1999. Between 1999 and 2006, the Government has been able to drastically reduce coca cultivation in this department. Between 2002 and 2004, aerial spraying averaged 10,000 hectares per year over this area, but in 2005 and 2006 it dropped to less than 2,000 hectares. In 2006, coca cultivation accounted for only 488 hectares, or 3% of the level of coca cultivation in 1999.
Table 28: Coca cultivation in the Central region, 2000 - 2006 (hectares)
Department 2000 2001 2002 2003 2004 2005 2006 % change 2005-2006
Antioquia 2,547 3,171 3,030 4,273 5,168 6,414 6,157 -4%Bolivar 5,960 4,824 2,735 4,470 3,402 3,670 2,382 -35% Cordoba 117 652 385 838 1,536 3,136 1,216 -61% Santander 2,826 415 463 632 1,124 981 866 -12% Norte de Sant. 6,280 9,145 8,041 4,471 3,055 844 488 -42% Boyacá 322 245 118 594 359 342 441 29% Caldas - - - 54 358 189 461 144% Cundinamarca 66 22 57 57 71 56 120 114% Total 18,118 18,474 14,829 15,389 15,073 15,632 12,131 -22%Annual trend +2% -20% +4% -2% +4% -22%
In the department of Bolivar, coca cultivation is concentrated in the South, in an area known as Sur de Bolivar. Coca cultivation in the department remained relatively stable, accounting for 4% to 8% of the country total in the period 1999 - 2005. In 2006 coca cultivation decreased by 35% to the amount of 2,382 hectares, the lowest in the last eight years.
In Antioquia, coca cultivation averaged 3,000 hectares between 1999 and 2002. Coca cultivation has been increasing since 2002, from 3,030 hectares to 6,157 hectares in 2006. This increase over the past four years occurred despite the intensification of aerial spraying, from 3,300 hectares in 2002 to 16,800 hectares in 2005 and 18,000 hectares in 2006, plus the manual eradication of 3,146 hectares.
In the department of Caldas, the most important coffee growing area in Colombia, coca cultivation was detected for the first time in 2003 (54 ha). Coca cultivation reached a peak in 2006 with 461 hectares, despite manual eradication of 552 hectares in 2006.
The department of Cordoba showed a decrease of 1,920 hectares in 2006 (-61%) after an important increase in the period 2004-2005. Manual eradication reported in 2006 amounts to 2,142 hectares and the aerial spraying presented a significant increase from 1,800 hectares in 2005 to 5,600 hectares in 2006.
The departments of Norte de Santander, Antioquia and Santander received the largest support in alternative development in Colombia in 2006 with the 65% of the national total investment, though the coca cultivation amounts only to 9.6% of the national cultivation.

Colombia Coca Survey for 2006
80
Map 20: Coca cultivation density in the Orinoco region, Colombia 2006
RíoM
eta
Río Vichada
Río Guaviare
Río Met a
Río Inírida
Río Tomo
RíoO
r inoc
o
Vichada
Vaupés
Meta
Guaviare
Guainía
Casanare
Arauca
SantaRosalía
Cumaribo
La Primavera
PuertoCarreno
PuertoRondón
Tame
CravoNorte
Fortul Arauquita
Saravena
Arauca
Puerto Inírida
Cucutá
Arauca
Puerto Carreño
72°W
72°W
70°W
70°W
68°W
68°W
2°N
2°N
4°N 4°N
6°N 6°
N
8°N 8°
N
COLOMBIA
PANAMAVENEZUELA
PERU
ECUADORBRAZIL
Source: Government of Colombia - National monitoring system supported by UNODCThe boundaries and names shown and the designations used in this map do not imply official endorsement or acceptance by the United Nations
y g
0 200km
100
VENEZUELA
Geographic coordinates WGS 84
Cultivation density(ha/km²)
Department boundariesInternational boundaries
Orinoco RegionRoadsMunicipality boundaries
BRAZIL
> 8
0.1 - 1.01.1 - 2.02.1 - 4.04.1 - 8.0

Colombia Coca Survey for 2006
81
Orinoco region
In Vichada department, near the Venezuelan border, coca cultivation peaked at 9,200 hectares in 2001. It remained between 4,000 and 5,000 hectares from 2002 to 2004, but increased again by 67% between 2004 and 2005, before decreasing to 5,523 hectares in 2006.
Table 29: Coca cultivation in the Orinoco region, 2006 (hectares)
Department 2000 2001 2002 2003 2004 2005 2006 % Change 2005-2006
Vichada 4,935 9,166 4,910 3,818 4,692 7,826 5,523 -29%Arauca 978 2,749 2,214 539 1,552 1,883 1,306 -31% Total 5,913 11,915 7,124 4,357 6,244 9,709 6,829 -30%Annual trend - +102% -40% -39% +43% +56% -30%
In Vichada, coca cultivation is concentrated along the Uva River. However, in the past three years, coca cultivation expanded to the Eastern part of the department, towards the Venezuelan border. The dispersion of coca cultivation in remote parts of the department increases the flight time and cost of aerial spraying. As a result, aerial spraying has been relatively low in this department in the past (below 3,000 hectares). However, in 2006, 5,500 hectares of aerial spraying were reported. Very little manual eradication took place in this department.
Coca cultivation in Arauca was detected for the first time in 2000 with about 1,000 hectares. It increased to more than 2,000 hectares in 2001 and 2002. In 2003, aerial spraying amounted to 12,000 hectares and coca cultivation dropped to 500 hectares in December of that year. However, it increased in 2004 and 2005, but decreased again in 2006 to 1,306 hectares. In 2006, 362 hectares were manually eradicated and 1,400 hectares sprayed.
Amazonia region
Like the Putumayo-Caqueta region, the departments of Vaupes, Amazonas and Guainia belong to the Amazon basin. Although sharing important similarity with Putumayo and Caqueta, these three departments, refered to as Amazon region, have never been important centres of coca cultivation. This is due to the remoteness of the area, the lack of airports and road infrastructure linking this region to the rest of the country. Consequently, aerial spraying of coca cultivation was almost not existent, except in Vaupes.
Overall, coca cultivation has slowly decreased since it was first observed in 2000.
Table 30: Coca cultivation in the Amazonia Region, 2000 - 2006 (hectares)
Department 2000 2001 2002 2003 2004 2005 2006 % Change 2004-2005
Guainía 853 1,318 749 726 721 752 753 0% Amazonas - 532 784 625 783 897 692 -23% Vaupés 1,493 1,918 1,485 1,157 1,084 671 460 -31% Total 2,346 3,768 3,018 2,508 2,588 2,320 1,905 -18% Annual trend - +61% -20% -17% +3% -10% -18%
Sierra Nevada region
The Sierra Nevada region, with the departments of Magdalena and Guajira, has never been an important centre of coca cultivation in Colombia. Coca cultivation remained between 500 and 1,300 hectares over the last eight years. Between 2004 and 2006, coca cultivation decreased by an impressive 65%, to reach its lowest level with only 437 hectares. Coca cultivation remained located mainly in the fringe of lowlands between the high mountains of the Sierra Nevada and the seashore.

Colombia Coca Survey for 2006
82
Table 31: Coca cultivation in the Sierra Nevada region, 2000 - 2006
Department 2000 2001 2002 2003 2004 2005 2006 % Change
Magdalena 200 480 644 484 706 213 271 27% Guajira 321 385 354 275 556 329 166 -50% Total 521 865 998 759 1,262 542 437 -19%Annual trend - +66% +15% -24% +66% -57% -19%
For a few years already, the Sierra Nevada region benefited from important aid for alternative development, mainly due to the Sierra Nevada National Park. Government’s data indicated an important increase in alternative development budget for 2005. At the same time, manual eradication activities reached 1,166 hectares in 2006.
The region is also an important tourism centre and hosts the Sierra Nevada National Park. The National Park is one of the most important ecological reserves in Latin America, known for its rich bio-diversity and presence of several ancient indigenous cultures. In 2006, coca cultivation amounted to 119 hectares in the Sierra Nevada National Park, an increase of 25% compared to 2005.
Possible areas of new cultivation
The survey covered and interpreted 100% of the national territory, including areas previously not known as being coca-growing regions. In doing so it serves as an early warning system to detect and prevent the spread of coca into new areas.
In 2006, potential small coca fields have been detected in remote areas outside the established agricultural areas of the departments of the Orinoco and Amazon River basins. Field verification has not been carried out in these areas because the verification of small and isolated patches of coca cultivation was considered too time consuming and too costly. Therefore, the estimate for coca cultivation in these areas is presented as indicative and was not included in the final estimate. The 2006 survey analyzed 19 Landsat images for vegetation having characteristics similar to coca fields. A total of 356 hectares were assessed as possible coca cultivation in new areas.
Table 32: Possible coca cultivation in new area, 2006
Department Area (ha)
Amazonas 203Arauca 12Caqueta 6Guainia 35Vaupés 68Vichada 32Total 356

Colombia Coca Survey for 2006
83
Coca leaf, coca paste and cocaine base production
The potential production of fresh coca leaf in Colombia for 2006 was calculated by multiplying the regional average annual yield of fresh coca leaf established by the 2005 yield study by the regional area under coca cultivation8. The lower and upper estimates of the potential production of fresh coca leaf were calculated by using the lowest and highest annual regional yields. The potential production of fresh coca leaf was estimated at 489,200 metric tons, within a range of 438,985 and 542,546 metric tons. Assuming 57% moisture content, this was equivalent to a total production of 278,844, metric tons of sun-dried coca leaf.
Table 33: Regional average coca leaf yield per harvest by region
Avg yield per harvest
Lowest limit of confidence
interval
Highest limit of confidence
interval Region
(kg/hectares) (kg/hectares) (kg/hectares)
Coefficient of variation (CV in %)
Central region 1,960 1,740 2,180 5.7% Sierra Nevada 1,607 1,530 1,690 2.6% Meta-Guaviare 1,489 1,430 1,550 2.1% Putumayo-Caqueta 1,444 1,330 1,550 3.8% Orinoco 1,302 1,230 1,370 2.7% Catatumbo 1,012 910 1,110 5.0% Pacific 964 900 1,020 2.9% All regions 1,360 1,340 1,380 1.4%
Catatumbo and Sur de Bolivar make up Central region
Figure 24: Regional average of coca leaf yield per harvest (kg/hectares)
1,960
1,6071,489
1,012 964
1,3021,444
500
700
900
1,100
1,300
1,500
1,700
1,900
2,100
2,300
Central SierraNevada
Meta-Guaviare
Putumayo-Caquetá
Orinoco Catatumbo Pacífico
kg/h
a
Due to the high annual yield observed in Meta-Guaviare, the region accounted for 42% of the total production, although it represented only 26% of the total coca cultivation.
In Colombia, traditional use of the coca leaf can be considered marginal, and virtually the entire coca leaf production is destined for cocaine production. There are various ways to produce cocaine. The overall process is that leaves are processed into coca paste, then into cocaine base, then into cocaine hydrochloride. The farmers can either sell the coca leaves, or process these leaves into coca paste or base. The last step, the processing of the cocaine base into cocaine hydrochloride is not carried out by farmers but in clandestine laboratories.
8 At the beginning of 2007, a pilot study was conducted in order to update the yield estimates. Preliminary results of this research are within the limits of variation observed during the yield study in 2005. The evaluation of this new study is still ongoing at the time of the printing of this report.

Colombia Coca Survey for 2006
84
Coca paste is the first product obtained in the process of alkaloid extraction from coca leaves using sulfuric acid and combustibles. It is then a cocaine sulfate with a high content of organic remnants, pigments, tannin, and other substances. Cocaine base is obtained by dissolving the cocaine sulphate in an acid and adding an oxidant agent (potassium permanganate being the oxidant most often used), then adding a base. The resulting substance is precipitated and filtered.
The coca leaf yield survey revealed that 34% of the farmers, representing only 25% of the total coca leaf production, sell directly the coca leaves, without processing them. Another 35% of the farmers, who represent 26% of the total coca leaf production, processed them into coca paste, and the remaining 31% of the farmers, who represent 49% of the total coca leaf production, process their leaves into cocaine base.
Table 34: Division of labour among coca producers
Region % of farmers not processing coca
leaves
% of farmers processing coca leaves into coca paste
% of farmers processing coca leaves into cocaine base
Putumayo-Caquetá 32% 65% 3%
Catatumbo 71% 20% 9%
Central 43% 5% 52%
Sierra Nevada 49% 22% 29%
Orinoco 15% 0% 85%
Meta Guaviare 9% 26% 65%
Pacific 68% 31% 1%
All regions 34% 35% 31% Catatumbo and Sur de Bolivar make up Central region
Figure 25: Proportion of farmers processing and not processing coca leaves
0%
10%
20%
30%
40%
50%
60%
70%
80%
90%
Putumayo-Caquetá
Catatumbo Sur de Bolivar Sierra Nevada Orinoco Meta Guaviare Pacif ic
% of farmers not producing paste or base % farmers producing paste % farmers producing base
During the survey, the farmers who processed their coca leaves were asked about the amount of coca leaves and ingredients used, and the amount of final product obtained. The distinction between paste and base is not easy to draw because the terms are often confused by the farmers themselves. In order to distinguish between these two products, it was decided to refer to cocaine base when the farmers reported the use of permanganate potassium or ammonium for processing their leaves, and coca paste when the farmers did not report the use of these products.
Therefore, it was possible to calculate the average conversion rate of one metric ton of coca leaves into coca paste (1.63 kg) and cocaine base (1.52 kg). In other words, coca paste yielded 93% of cocaine base.

Colombia Coca Survey for 2006
85
Table 35: Average kg of coca paste or base obtained from one metric ton of coca leaf
Region Number of PAU’s9 process coca leaf
Avg kg of coca paste per metric tons of
coca leaf
Avg kg of cocaine base per metric tons
of coca leaf Putumayo-Caqueta 152 1.75 1.74
Catatumbo 37 1.39 1.38
Central 107 1.41 1.41
Sierra Nevada 69 1.45 1.45
Orinoco10 118 - 1.73
Meta Guaviare 285 1.53 1.52
Pacific 79 1.55 1.46
All regions 847 1.63 1.52 Catatumbo and Sur de Bolivar make up Central region
About 30% of the coca leaf production was processed into coca paste. Thus, out of the total production of 489,200 mt of coca leaf, about 142,500 mt tons were processed into coca paste. Using the conversion rate of 1.63 kg of coca paste out of every tons of coca leaf, the total coca paste production from farmers was estimated at 234 mt. This was equivalent to 218 mt of cocaine base, based on a coca paste to base ratio of 93%.
Table 36: Calculation of coca paste production
Region Total leaf production
Proportion of farmers producing
coca paste
Leaf production processed into
coca paste
mt % mt Meta-Guaviare 203,300 26% 52,900 Central 76,800 5% 3,800 Putumayo-Caqueta 96,400 65% 62,700 Orinoco 48,500 - - Pacific 48,900 31% 15,200 Amazonian 10,700 65% 7,000 Catatumbo 2,200 20% 400 Sierra Nevada 2,400 22% 500 Country level 489,200 142,500
Catatumbo and Sur de Bolivar make up Central region
The rest of the farmers either processed directly into cocaine base, or sell their production as leaf, corresponding to a total of 346,760 mt. Assuming that the production of coca leaf sold directly by the farmers was processed outside the farm into cocaine base at the same rate as within the farm of 1.52 kg per tons of leaf, the total amount of cocaine base was estimated at 536 mt.
9 Agriculture Production Unit: an economical unit dedicated to the production or others licit crops under a unique management of a person or a family 10 The Orinoco farmers process only cocaine base.

Colombia Coca Survey for 2006
86
Table 37: Calculation of cocaine base production
Region Fresh coca
leaf production
Proportion of farmers
producing cocaine base
Proportion of farmers selling
coca leaf for base processing
Fresh coca leaf production for base processing
mt % % mt Meta-Guaviare 203,300 65% 9% 150,442 Central 76,800 52% 43% 72,960 Putumayo-Caqueta 96,400 3% 32% 33,740 Orinoco 48,500 85% 15% 48,500 Pacific 48,900 1% 68% 33,741 Amazonia 10,700 3% 32% 3,745 Catatumbo 2,200 9% 71% 1,760 Sierra Nevada 2,400 29% 49% 1,872 Country level 489,200 346,760
Catatumbo and Sur de Bolivar make up Central region
Overall, either produced from coca paste or directly from coca leaves, the total production of cocaine base in Colombia in 2006 was estimated at 754 metric tons.
Potential cocaine production
The coca yield survey implemented by UNODC and DNE in 2005 focused on obtaining data on the yield of coca leaf and on the processing by farmers of coca leaf into coca paste or cocaine base. The data on annual coca leaf yield and the conversion rates of coca leaves into coca paste and cocaine base were combined with the 2006 census estimating coca cultivation to estimate the total productions of coca leaf, coca paste and cocaine base.
To estimate cocaine production, UNODC relied on external sources. Indeed, investigating clandestine laboratories was not possible because these laboratories are directly in the hands of narco-traffickers. So far, UNODC did not collect any data to estimate the efficiency of these clandestine laboratories nor on the quantity of cocaine hydrochloride that can be produced from coca paste/base. In addition to the technical difficulties to obtain these data, this kind of survey is also complicated by the existence of several techniques to produce cocaine hydrochloride, and various purity level of the end-product.
The UNODC calculation for cocaine production in 2006 relied on its own estimate of cocaine base and on data obtained by the US Operation Breakthrough regarding the conversion rate from cocaine base to cocaine hydrochloride and the purity level of cocaine hydrochloride for conversion into equivalent of pure cocaine production.
US Operation Breakthrough mentioned a 1:1 conversion rate from cocaine base to cocaine hydrochloride. However, this was obtained from laboratories especially set up for this kind of survey, and thus this conversion rate is likely to correspond to ideal circumstances not always obtained in reality, especially by farmers. The same source also communicated to UNODC that cocaine base contained about 75% of pure cocaine alkaloid and the cocaine hydrochloride contained about 85% of pure cocaine alkaloid. From this data, UNODC derived a 1:0.9 ratio from cocaine base to cocaine hydrochloride. This ratio of 1:0.9 was deemed to apply better to the cocaine base production, which corresponded to cocaine base obtained from farmers not working under ideal conditions. DEA and Operation Breakthrough apply a ratio of 1:1.
Based on this data, the 754 metric tons of cocaine base were equivalent to 678 metric tons of cocaine hydrochloride or 577 metric tons of pure cocaine. This represented an average pure cocaine yield per hectare of 7.4 kg/hectares.
Since 2002, UNODC estimated the cocaine production in Colombia based on the average of the two cultivation figures recorded as of December of the previous year and December of the current year. This average was then multiplied by the estimated yield per hectare. This method enables to

Colombia Coca Survey for 2006
87
take into account that coca fields are harvested more than once in a given year and eradication activities are spread over several months. Therefore, based on an average coca cultivation level of 82,000 hectares, the pure cocaine production in Colombia for 2006 amounted to 610 metric tons.
Figure 26: Potential cocaine production inColombia, 1995 - 2006 (metric tons)
0
100
200
300
400
500
600
700
800
Met
ric to
ns
Production 230 300 350 435 680 695 617 580 550 640 640 610
1995 1996 1997 1998 1999 2000 2001 2002 2003 2004 2005 2006
Note: Cocaine production estimates for 2004 and later are not directly comparable with previous years.
In 2006, at the global level, the potential cocaine production in Colombia represented 62% of the global potential cocaine production of 984 metric tons.
Coca prices
Coca leaf, cocaine base and cocaine prices
Between 2005 and 2006, coca leaf prices decreased by 9% in US$ terms and stayed stable in the local currency, Colombian Pesos (COP). Cocaine base, coca paste and cocaine prices also showed a decrease of 2 to 5%.
Changes in prices and purity of drugs are important indicators for the availability of drugs on the market. In 2005, UNODC-SIMCI started the periodic and systematic collection of price data in the first production stage (coca leaf, coca paste and cocaine base). This information is completed with data from the Presidential Programme against Illicit Crops (PCI). The prices of cocaine, cocaine base, morphine and heroin were provided by DIRAN and were collected by intelligence services in different cities in the country.
More and more, peasants take part in the transformation process and produce cocaine paste and cocaine base. Coca paste is the most traded product by farmers, whereas cocaine base would be produced mainly in clandestine laboratories as an intermediary product to cocaine hydrochloride. A 2005 study on the agricultural characteristics of coca cultivation in Colombia11 showed that 34% of the peasants sell coca leaves without processing. Another 35% sell coca paste and the remaining 31% sell cocaine base.
Most peasants sell coca paste that they themselves produce in small “kitchens” located on the farm. The processing does not require much know-how and technology and therefore, in 85% of the cases the peasant does the processing himself, and only in 15% a “cook” or “chemist” is hired to do the processing. The technical know-how was brought to the farmers during the 90’s by drug-traffickers to facilitate and to increase the commercialization of cocaine.
11 A study performed in 2005 by UNODC/SIMCI and DNE.
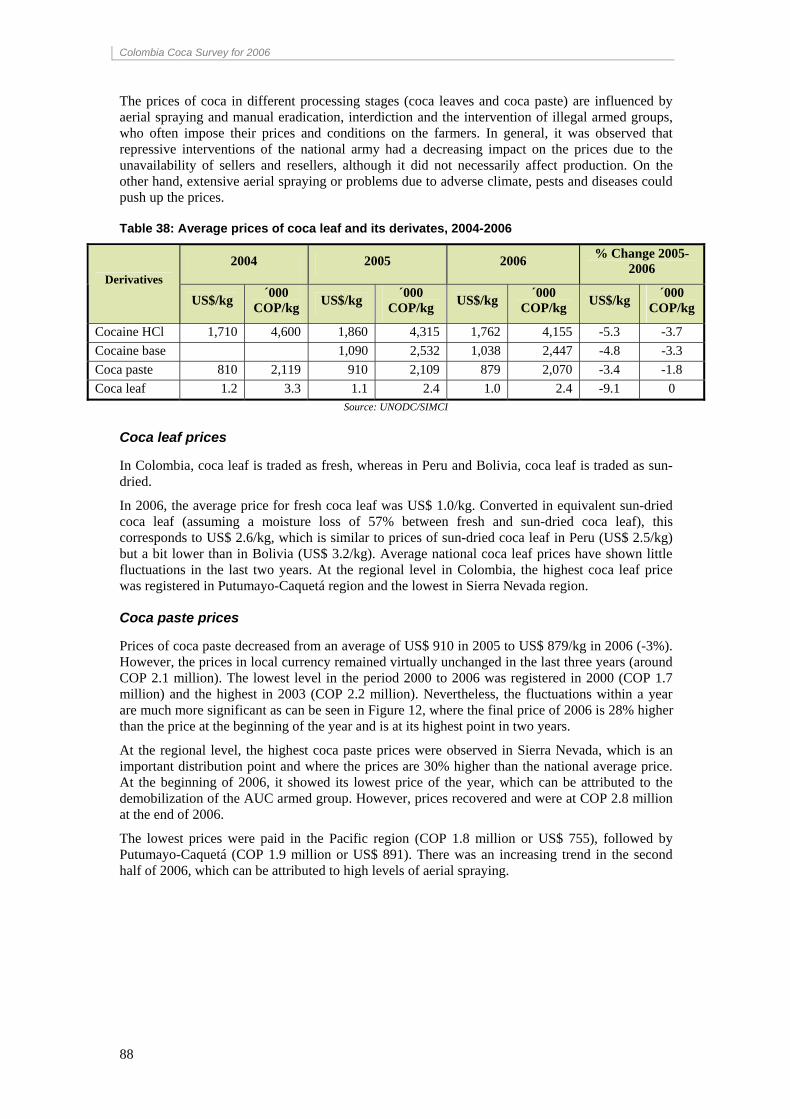
Colombia Coca Survey for 2006
88
The prices of coca in different processing stages (coca leaves and coca paste) are influenced by aerial spraying and manual eradication, interdiction and the intervention of illegal armed groups, who often impose their prices and conditions on the farmers. In general, it was observed that repressive interventions of the national army had a decreasing impact on the prices due to the unavailability of sellers and resellers, although it did not necessarily affect production. On the other hand, extensive aerial spraying or problems due to adverse climate, pests and diseases could push up the prices.
Table 38: Average prices of coca leaf and its derivates, 2004-2006
2004 2005 2006 % Change 2005-2006
Derivatives US$/kg ´000
COP/kg US$/kg ´000 COP/kg US$/kg ´000
COP/kg US$/kg ´000 COP/kg
Cocaine HCl 1,710 4,600 1,860 4,315 1,762 4,155 -5.3 -3.7 Cocaine base 1,090 2,532 1,038 2,447 -4.8 -3.3 Coca paste 810 2,119 910 2,109 879 2,070 -3.4 -1.8 Coca leaf 1.2 3.3 1.1 2.4 1.0 2.4 -9.1 0
Source: UNODC/SIMCI
Coca leaf prices
In Colombia, coca leaf is traded as fresh, whereas in Peru and Bolivia, coca leaf is traded as sun-dried.
In 2006, the average price for fresh coca leaf was US$ 1.0/kg. Converted in equivalent sun-dried coca leaf (assuming a moisture loss of 57% between fresh and sun-dried coca leaf), this corresponds to US$ 2.6/kg, which is similar to prices of sun-dried coca leaf in Peru (US$ 2.5/kg) but a bit lower than in Bolivia (US$ 3.2/kg). Average national coca leaf prices have shown little fluctuations in the last two years. At the regional level in Colombia, the highest coca leaf price was registered in Putumayo-Caquetá region and the lowest in Sierra Nevada region.
Coca paste prices
Prices of coca paste decreased from an average of US$ 910 in 2005 to US$ 879/kg in 2006 (-3%). However, the prices in local currency remained virtually unchanged in the last three years (around COP 2.1 million). The lowest level in the period 2000 to 2006 was registered in 2000 (COP 1.7 million) and the highest in 2003 (COP 2.2 million). Nevertheless, the fluctuations within a year are much more significant as can be seen in Figure 12, where the final price of 2006 is 28% higher than the price at the beginning of the year and is at its highest point in two years.
At the regional level, the highest coca paste prices were observed in Sierra Nevada, which is an important distribution point and where the prices are 30% higher than the national average price. At the beginning of 2006, it showed its lowest price of the year, which can be attributed to the demobilization of the AUC armed group. However, prices recovered and were at COP 2.8 million at the end of 2006.
The lowest prices were paid in the Pacific region (COP 1.8 million or US$ 755), followed by Putumayo-Caquetá (COP 1.9 million or US$ 891). There was an increasing trend in the second half of 2006, which can be attributed to high levels of aerial spraying.

Colombia Coca Survey for 2006
89
Table 39: Monthly coca paste price, 2006 ('000 COP/kg)
Months Weighted national average
Central Pacific Putumayo-Caqueta
Sierra Nevada
Meta-Guaviare
January 1,846 2,037 1,512 1,621 2,600 2,000 February 1,939 2,159 1,729 1,621 2,450 2,000 March 1,932 2,089 1,733 1,621 2,600 2,250 April 1,918 2,087 1,550 1,617 2,800 2,250 May 2,002 2,075 1,900 1,608 2,800 2,350 June 2,061 2,212 1,866 1,658 2,900 2,300 July 2,040 2,062 2,133 1,670 2,800 2,200 August 2,150 1,900 1,967 2,800 2,000 September 2,100 2,000 2,600 2,000 October 2,150 2,083 2,600 2,100 November 2,340 1,700 2,700 2,700 2,100 December 2,360 1,700 2,700 2,800 2,200 Average COP 2,070 2,078 1,779 1,900 2,704 2,146 Average US$ 879 779 755 891 1,147 911
Source: UNODC/SIMCI
Figure 27: Monthly coca paste price in Colombia, 2006 ('000 COP/kg)
1,200,000
1,700,000
2,200,000
2,700,000
3,200,000
J-06 F-06 M-06 A-06 M-06 J-06 J-06 A-06 S-06 O-06 N-06 D-06
CO
P/K
g
Centre Pacific Putumayo - Caqueta Sierra Nevada Meta - Guaviare
*Orinoco does not have information on coca paste because the coca is immediately processed into cocaine base, which can be explained by the region’s easy access to the necessary chemicals.
Cocaine base prices
The collection of price data and their analysis is complicated by the absence of standard in naming coca products, and by the lack of indications on their quality. This is the case for cocaine base and coca paste, which can easily be confused. However, the data on cocaine base, albeit less frequently reported than the data on coca paste, confirmed that cocaine base is a more refined product than coca paste, and that both products can be traded. On average, for 2006, prices of cocaine base were 19% higher than the prices of coca paste and the highest prices for cocaine base were obtained in Orinoco and Meta-Guaviare.

Colombia Coca Survey for 2006
90
Cocaine prices
In 2006, cocaine prices continued to decrease. This decrease started in 2004 after 7 years of increases in cocaine prices. The annual average in 2006 was US$ 1,762/kg, which was a 6% decrease compared to the average of 2005. The highest prices were paid in Meta Guaviare, followed by the Central region and Sierra Nevada; the lowest prices were paid in the Pacific region and Orinoco.
Because of the clandestine nature of the trade, cocaine prices are less easily collected than prices of coca paste or coca leaf. This explains that fewer data are available for cocaine prices compared to other products. In Colombia, prices of cocaine hydrochloride are collected by DIRAN (the Anti-Narcotics Police), and refer to wholesale prices in the main cities. The purity level was not investigated in this study.
The table below presents the annual averages of cocaine prices since 1991. The prices are presented both in Colombian Pesos (COP) and US$ as constant price of 1991 to correct for inflation.
Table 40: Cocaine HCl price in Colombia 1991 - 2006
Year '000 COP/kg US$/kg
1991 950 1,5001992 1,020 1,5001993 1,377 1,7501994 1,488 1,8001995 1,232 1,3501996 1,762 1,7001997 1,769 1,5501998 2,101 1,4721999 2,800 1,5922000 3,100 1,4852001 3,599 1,5712002 4,389 1,5322003 4,500 1,5652004 4,600 1,7132005 4,315 1,8602006 4,155 1,762
Source: DIRAN
When an analysis is made of the trend of annual prices of cocaine in Colombian pesos and the trend of the annual total areas of aerial spraying, a positive correlation is found ( = 0.92 for constant prices between 1994 and 2006). This means that an increase in area sprayed corresponds to an increase in cocaine prices in Colombian Pesos. However, this relationship cannot be so strongly established for prices of cocaine in US$ ( = 0.19 for constant prices between 1994 and 2006).
Income per hectare
The potential income values from the sale of coca leaf, coca paste and cocaine base was calculated from data from the monthly survey on prices of the Andean coca market combined with the data from the coca leaf yield survey. The differences between these incomes give an indication of the value-added if farmers produce coca paste and cocaine base. The table below shows a definite increase in the value added at each step of the processing. The value-added of cocaine base (60%), the final product that can be produced by the farmers, also explained why 49% of the coca leaf production was transformed into cocaine base by the farmers.

Colombia Coca Survey for 2006
91
Table 41: Potential annual gross income per hectare of coca cultivation for different derivatives of coca leaf
Annual yield Average annual price
Annual income in
Value-added from coca leaf Derivatives
kg/ha US$/kg US$/hectare %
Coca leaf 6,300 1.0 6,300 --- Coca paste 10.2 879 8,966 44% Cocaine base 9.5 1,038 9,861 57% Cocaine hydrochloride 7.4 1,762 13,039 107%
Figure 28: Potential annual income per hectare of coca leaf, coca paste, cocaine base and cocaine HCl
6,300
8,9669,861
13,039
0
2,000
4,000
6,000
8,000
10,000
12,000
14,000
Coca leaf Coca paste Cocaine base Cocainehydrochloride
US$
/ha
Based on the total production of each product sold by the farmers and the respective prices in 2006, the total farm-gate income value resulting from coca cultivation was estimated at about US$ 683 million. This value does not take into account the farmers’ production costs, such as costs of herbicides, pesticides, fertilizers and labour wages. Due to the very high annual coca leaf yield (9,900 kg/hectares) and the high proportion of farmers processing cocaine base in Meta-Guaviare, 47% of the total amount of US$ 683 million is made in this region alone.
The total farm-gate value of production of coca leaf and its derivatives corresponded to 0.5% the 2006’s GDP. In 2006, the total farm-gate value of coca cultivation represented 5% of the agricultural GDP.
Table 42: Value of the production of coca leaf and its derivatives at farm-gate level
Product Kg US$/kg US$ value Coca leaf 128,858,000 1.0 128,858,000 Coca paste 234,000 879 205,686,000 Cocaine base 336,000 1,038 348,768,000 Rounded total farm-gate 683,312,000

Colombia Coca Survey for 2006
92
Figure 29: Comparison of the prices of coca paste and cocaine base in 2006 (US$/kg)
2,0781,779 1,900
2,704
2,1462,500
1,925
1,150
2,875 2,8292,742
0
500
1,000
1,500
2,000
2,500
3,000
Centre Pacific Putumayo -Caqueta
Sierra Nevada Orinoco Meta - Guaviare
US
$/K
g
Coca paste Cocaine base
*Orinoco does not have information on coca paste because the coca is immediately processed into cocaine base, which can be explained by the region’s easy access to the necessary chemicals.
Sprayed coca fields

Colombia Coca Survey for 2006
93
Supply reduction
Reported forced manual eradication
For the third consecutive year, forced manual eradication increased in 2006 and amounted to 41,530 hectares. This was an increase of 33% compared to 2005 (31,285 hectares). The eradication activities have been extended to 20 departments (17 in 2005) and 85 municipalities (21 in 2005). About half of the total eradicated area is located in 4 departments: Nariño, Meta, Putumayo and Cauca.
Forced manual eradication is the responsibility of the Presidential Agency for Social Action, and is executed by Mobile Eradication Groups-GME- that consist of farmers and ex- illegal armed group members with the help of the Anti Narcotics Police (DIRAN) and the army. In addition, the national police implemented an institutional plan “Everybody against coca”, by which police departments are instructed to assist in the manual eradication programmes. In 2006, UNODC has monitored and verified the manually eradicated fields on a sample base.
Table 43: Reported forced manual eradication of coca areas by department, 2006 (ha)
Department Manual
eradication by GME (ha)
Manual eradication by the Police (ha)
Total (ha)
Share %
Amazonas 15 15 0.04 Antioquia 2,506 640 3,146 7.6 Arauca 362 362 0.9 Bolivar 1,819 132 1,952 4.7 Boyaca 1,389 508 1,897 4.6 Caldas 521 31 552 1.3 Caqueta 1,028 263 1,291 3.1 Cauca 4,090 85 4,174 10.1 Casanare 3 3 0.01 Cesar 15 15 0.04 Choco 181 422 603 1.5 Cordoba 2,052 90 2,142 5.2 Cundinamarca 668 74 742 1.8 Guainia 193 111 303 0.7 Guajira 671 8 679 1.6 Guaviare 843 260 1,103 2.7 Huila 10 10 0.02 Magdalena 463 10 473 1.1 Meta 5,170 6 5,176 12.5 Nariño 6,132 873 7,005 16.9 Norte de Santander 1,509 139 1,648 4 Putumayo 4,969 149 5,118 12.4 Santander 1,388 1,242 2,630 6.4 Sucre 4 4 0.01 Tolima 16 16 0.04 Valle 364 63 427 0.6 Vichada 44 44 0.1 Total 35,956 5,575 41,530 100
Sources: PCI- Social Action, National Police
Manual eradication has a major impact on coca production since the bushes are completely uprooted. Replanting means significant costs for the farmer since it takes about 8 months between planting and the first harvest, moreover with low productivity in the initial stage. However, in

Colombia Coca Survey for 2006
94
some eradicated areas, replanting and new coca plantations have been observed and UNODC recommends in its eradication report12 to accompany eradication with alternative development projects.
Map 21: Forced manual eradication and coca cultivation in Colombia, 2006
PacificOcean
Caribbean Sea
R íoM
ag dalena
Rí
o M eta
Río Vichada
Río
Cauc
aRí
o Mag
da
le
na
Río Guaviare
Río P utuma yo
Río Caquetá
R ío Meta
Río
Atrat
o
PANAMA
Rí o Amazonas
RíoInír
ida
RíoO
rinoco
Vichada
Vaupés
Valle
Tolima
Sucre
Santander
Risaralda
Quindío
Putumayo
Norte deSantander
Nariño
Meta
Magdalena
LaGuajira
Huila
Guaviare
Guainía
Cundinamarca
Córdoba
Chocó
Cesar
Cauca
Casanare
Caquetá
Caldas
Boyacá
Bolívar
Atlántico
AraucaAntioquia
Amazonas
VENEZUELA
PERU
ECUADOR
BRAZIL
Neiva
Tumaco
Puerto Asís
Popayán
Cucutá
Cartagena
Pasto
Cali
Florencia
Medellín
Barranquilla
Bogotá
San José
Mitú
Leticia
Arauca
PuertoCarreño
75°W
75°W 70°W
70°W
5°S
5°S
0° 0°
5°N
5°N
10°N
10°N
South America
Sources: for coca cultivation Government of Colombia - National monitoring system supported by UNODC; for manual eradication areas PCIThe boundaries and names shown and the designations used in this map do not imply official endorsement or acceptance by the United Nations
Colombia
International boundariesDepartment boundaries
Forced manual eradicationareasCoca cultivation 2006
Geographic coordinates WGS 84
1500 300km
12 Report on monitoring and assessment of the manual eradication conducted in 2006 (GME)

Colombia Coca Survey for 2006
95
Map 22: Aerial spraying and coca cultivation in Colombia, 2006
PacificOcean
Caribbean Sea
R íoM
ag dalena
Rí
o M eta
Río Vichada
Río C
auc
aRí
o Mag
da
le
na
Río Guaviare
Río P utuma yo
Río Caquetá
R ío Meta
Río
Atrat
o
PANAMA
Rí o Amazonas
Río Inírida
RíoO
rinoco
Vichada
Vaupés
ValleTolima
Sucre
Santander
Risaralda
Quindío
Putumayo
Norte deSantander
Nariño
Meta
Magdalena
La Guajira
Huila
Guaviare
Guainía
Cundinamarca
Córdoba
Chocó
Cesar
Cauca
Casanare
Caquetá
CaldasBoyacá
Bolívar
Atlántico
AraucaAntioquia
Amazonas
VENEZUELA
PERU
ECUADOR
BRAZIL
Neiva
Tumaco
Puerto Asís
Popayán
Cucutá
Cartagena
Pasto
Cali
Florencia
Medellín
Barranquilla
Bogotá
San José
Mitú
Leticia
Arauca
PuertoCarreño
75°W
75°W 70°W
70°W
5°S
5°S
0° 0°
5°N
5°N
10°N
10°N
South America
Sources: for coca cultivation Government of Colombia, National monitoring system supported by UNODC; for aerial spraying DIRANThe boundaries and names shown and the designations used in this map do not imply official endorsement or acceptance by the United Nations
Colombia
International boundariesDepartment boundaries
Coca cultivation 2006Geographic coordinates WGS 84
1500 300km
over coca cultivation
Aerial spraying in 2006

Colombia Coca Survey for 2006
96
Reported aerial spraying
The Colombian anti-drugs strategy includes a number of measures ranging from aerial spraying, to forced or voluntary manual eradication, including alternative development and crops substitution programmes. UNODC did not participate in or supervise the spraying activities. All data were received directly from the Antinarcotics Police DIRAN.
The spraying programme carried out by DIRAN is realized through aerial spraying with a mixture of products called Round up – composed of an herbicide called glyphosate - and a surfactant called Cosmoflux and other additives. In late 2002, the National Narcotics Council approved an herbicide concentration of 2.5 litres per hectare for opium poppy and 10.4 litres per hectare for coca, with a view to increase the spraying effectiveness rate, which was reported to be 91% in 2004. The chemical mixture affects the leaves and not the roots or the soil, and therefore the bush can be pruned at about one feet above the ground to obtain a renewal of the bush in about six months. In 2006, the spraying effectiveness rate was estimated by the Government as being 88 %.
The Government of Colombia's Illicit Crop Eradication Programme foresees an Environmental Management Plan and environmental auditing, as well as periodic verifications on the ground of the effectiveness of spraying activities and their environmental impact. The Ministry of Environment certified in July 2004 the “Eradication of Illicit Crops Programme by Aerial Spraying with Glyphosate”, confirming the observance of the environmental obligations required in the Management Plan. In 2006, the government of Colombia authorized the aerial spraying of 2,090 hectares of coca cultivation into the National Natural Park Sierra La Macarena.
Reports from DIRAN showed that, for the sixth consecutive time, spraying activities reached record level in 2006. The DIRAN sprayed a total of 172,025 hectares, representing an increase of 24% compared to last year aerial spraying levels. 50% of spraying activities were implemented in the departments of Putumayo, Meta, Antioquia and Guaviare. In the department of Nariño, which has the lowest potential production of cocaine, 59,865 hectares (or 35%) of coca cultivation were sprayed. In the department of Meta, which has the highest cocaine productivity rates in Colombia, 25,195 hectares (or 15%) of coca cultivation were sprayed. The Government also reported the aerial spraying of 231 hectares and the manual eradication of opium poppy cultivation.
Figure 30: Comparison of net coca cultivation, cumulative spraying and eradicated areas (hectares)
0
30,000
60,000
90,000
120,000
150,000
180,000
1996 1997 1998 1999 2000 2001 2002 2003 2004 2005 2006
Hec
tare
s
Coca cultivation Aerial spraying Manual forced eradication
The cumulative sprayed area is the sum of areas during a given time period (calculated by multiplying the length of flight lines by their width), and it differs from the effective sprayed area,

Colombia Coca Survey for 2006
97
which disregards the overlap between adjacent sprayed bands and areas sprayed several times in the same calendar year.
Table 44: Reported aerial spraying of coca cultivation by department, 1998 - 2006 (ha)
Sources
Environmental Audit of the
National Narcotics Bureau
Antinarcotics Police Department
Department 1998 1999 2000 2001 2002 2003 2004 2005 2006
Guaviare 37,081 17,376 8,241 7,477 7,207 37,493 30,892 11,865 14,714Meta 5,920 2,296 1,345 3,251 1,496 6,973 3,888 14,453 25,915 Caquetá 18,433 15,656 9,172 17,252 18,567 1,059 16,276 5,452 4,575 Putumayo 3,949 4,980 13,508 32,506 71,891 8,342 17,524 11,763 26,491 Vichada 297 91 - 2,820 - - 1,446 - 5,485 Antioquia - - 6,259 - 3,321 9,835 11,048 16,833 18,022 Córdoba - - - - 734 550 - 1,767 5,588 Vaupés 349 - - - - - 756 340 - Cauca - 2,713 2,950 741 - 1,308 1,811 3,292 1,536 Norte de Sant. - - 9,584 10,308 9,186 13,822 5,686 899 1,687 Nariño - - 6,442 8,216 17,962 36,910 31,307 57,630 59,865 Santander - - 470 - - 5 1,855 2,042 2,146 Boyacá - - 102 - - - - 925 831 Bolívar - - - 11,581 - 4,783 6,456 6,409 2,662 Arauca - - - - - 11,734 5,336 2,584 1,400 Magdalena - - - - - - 1,632 383 - Guajira - - - - - - 449 572 - Caldas - - - - - - 190 1,090 1,068 Valle - - - - - - - 5 - Chocó - - - - - - - 425 - Cundinamarca - - - - - - - 43 41
Total 66,029 43,111 58,073 95,898 133,116 136,828 139,141 138,772 172,02Net cultivation 102,00 160,00 163,00 145,00 102,000 86,000 80,000 86,000 78,000
Source: DIRAN
Once coca fields are sprayed, it takes approximately six to eight months to recover productive crops when the bushes are pruned or replanted. However, when heavy rain occurs or bushes are washed by the farmers immediately after the spraying, the loss in coca leaf can be reduced and the crop recovers quickly. The sustainability of the eradication efforts depends to a large extent on the real alternatives open to the farmers and to the displacement of the cultivation into new and more remote areas of the country (balloon effect).
In order to neutralize or reduce the impact of the aerial spraying, several actions are taken by the farmers such as: to plant coca bushes interspersed with other plants, to apply protective substances on leaves, to wash the leaves, to reduce the size of the fields, to rotate coca crops with other licit crops in the same field, etc. The aerial spraying may cause the loss of one or more harvests, the reduction of productivity or the total loss of crops but it has become clear that the impact varies considerably from one region to another and that it is not the only cause for reduction or loss of coca crops.

Colombia Coca Survey for 2006
98
Map 23: Destruction of clandestine laboratories and coca cultivation
PacificOcean
Caribbean Sea
Rí o Ma gdalena
Río M
eta
Río Vichada
Río
Cauc
aRí
o Mag
da
le
na
Río Guaviare
Río P utuma yo
Río Caquetá
R ío Meta
Río
Atra
to
PANAMA
Rí o Amazonas
RíoIní
rida
RíoO
rin
oco
Vichada
Vaupés
Valle Tolima
Sucre
Santander
RisaraldaQuindío
Putumayo
Nariño
Meta
Magdalena
La Guajira
Huila Guaviare
Guainía
Cundinamarca
Córdoba
Chocó
Cesar
Cauca
Casanare
Caquetá
Caldas
Boyacá
Bolívar
Atlántico
Arauca
Antioquia
Amazonas
VENEZUELA
PERU
ECUADOR BRAZIL
Puerto Asís
Tumaco
Popayán
Cucutá
Cartagena
Pasto
Cali
Florencia
Medellín
Barranquilla
Bogotá
SanJosé
Mitú
Leticia
Arauca
PuertoCarreño
75°W
75°W 70°W
70°W
5°S
5°S
0° 0°
5°N
5°N
10°N
10°N
South America
Source: Goverment of Colombia - National monitoring system supported by UNODC, for destruction of illegal laboratories: DNEThe boundaries and names shown and the designations used in this map do not imply official endorsement or acceptance by the United Nations
Colombia
International boundariesDepartment boundaries
Chlorohydrate
Coca base or coca paste
Coca cultivation 2006
477 41
15 1
86 1
346 38
116 2
23 1
208 0
184 7
103 4
101 1
39 7
4 1
0 1
109 14
46 10
13 1
21 1
35 8
2 12
25 11
9 5
13 228 17
24 11
Number and type of illegallaboratories destroyedin 2006 by department
Geographic coordinates WGS 84
1500 300km
Popayán
1 0
3 0
1 0
1 0
10 4

Colombia Coca Survey for 2006
99
Reported seizures
UNODC is not involved in the collection of data on seizures and destruction of laboratories. The data provided by the Colombian government are presented here to show the existence of possible trafficking corridors and allow for a better understanding of the dynamics that surrounds the drug business.
According to DNE, in 2006, a total of 2,270 clandestine laboratories were destroyed. Out of these, 2,045 laboratories processed coca paste or cocaine base, 202 cocaine hydrochloride, 15 potassium permanganate, and 7 heroin and 1 marihuana. Compared to 2005, this represented an increase of 16% in the number of illegal laboratories destroyed, demonstrating the high intensity of the actions taken by the Colombian Government against illicit drug production.
Figure 31: Number of clandestine laboratories destroyed, 1997-2006
0
500
1,000
1,500
2,000
2,500
No.
of l
abs
dest
roye
d
Cland. labs destroyed 392 323 317 647 1,574 1,448 1,489 1,865 1,953 2,270
1997 1998 1999 2000 2001 2002 2003 2004 2005 2006
Most of the laboratories for coca leaf processing (basic paste, cocaine base and cocaine) and also for potassium permanganate were detected and destroyed in the departments of Nariño and Antioquia, where 28% of coca crop cultivation was found. 50% of the laboratories were found in the Central Region13, followed by the Pacific Region14, which is strategically well located.
13 Central Region: Antioquia, Bolívar, Córdoba, Santander, Boyacá, Caldas, Cundinamarca, Tolima. 14 Pacific Region: Nariño, Cauca, Chocó y Valle.

Colombia Coca Survey for 2006
100
Table 45: Clandestine laboratories destroyed by department and by drug type, 2006
Department
Coca paste or cocaine base laboratories destroyed
Cocaine laboratories destroyed
Heroin laboratoriesdestroyed
Marihuana
Potassium permanganate laboratories destroyed
Total
Nariño 477 41 7 - 8 533Antioquia 346 38 - - 4 388Santander 28 17 - - 1 46Cauca 109 14 - - - 123Cesar 2 12 - - - 14Magdalena 25 11 - - - 36Norte de Sant. 24 11 - - - 35Valle 46 10 - - - 56Boyaca 35 8 - - - 43Cundinamarca 39 7 - 1 - 47Meta 184 7 - - 2 193La-guajira 9 5 - - - 14Guainia 10 4 - - - 14Vichada 103 4 - - - 107Arauca 13 2 - - - 15Bogota 1 2 - - - 3Cordoba 116 2 - - - 118Amazonas 15 1 - - - 16Bolivar 23 1 - - - 24Caldas 21 1 - - - 22Choco 13 1 - - - 14Guaviare 101 1 - - - 102Putumayo 86 1 - - - 87Tolima 4 1 - - - 5Caqueta 208 - - - - 208Casanare 3 - - - - 3Huila 1 - - - - 1Risaralda 1 - - - - 1Sucre 1 - - - - 1Vaupes 1 - - - - 1Total 2,045 202 7 1 15 2,270
Source: DNE
Data provided by National Narcotics Bureau –DNE- show a decrease of 27% from 2005 to 2006 in cocaine seizures from 173 mt to 127 mt. However, there were important increases in coca leaf and base or paste seizures (20% and 105%) and decreases in the rest of the drugs.
In the last three years, the departments of Valle del Cauca and Nariño have been the leaders in drug seizures with 51% of total due to their strategic locations for production and easy exportation to international markets. The Pacific Corridor continues to be the most commonly used route for drug transport (81% of seizures take place at sea).

Colombia Coca Survey for 2006
101
Map 24: Drug seizures by department and by drug type, 2006
Source: Government of Colombia - National monitoring system supported by UNODC, for drug seizures: Colombia Drug Observatory DNE.The boundaries and names shown and the designations used in this map do not imply official endorsement or acceptance by the United Nations
PANAMA
PacificOcean
Caribbean Sea
Vichada
Vaupés
Valle Tolima
Sucre
Santander
RisaraldaQuindío
Putumayo
Norte deSantander
Nariño
Meta
Magdalena
La Guajira
Huila
Guaviare
Guainía
Cundinamarca
Córdoba
Chocó
Cesar
Cauca
Casanare
Caquetá
Caldas
Boyacá
Bolívar
Atlántico
Arauca
Antioquia
Amazonas
VENEZUELA
PERU
ECUADOR
BRAZIL
75°W
75°W 70°W
70°W5°S
5°S
0° 0°
5°N
5°N
10°N
10°N
20,000 kg
Reported cannabis seizurein 2004 by department
20,000 kg
20,000 kg
Reported coca leaf seizurein 2006 by department
100,000 kg
PacificOcean
Caribbean Sea
PANAMA
Vichada
Vaupés
ValleTolima
Sucre
Santander
RisaraldaQuindío
Putumayo
Norte deSantander
Nariño
Meta
Magdalena
La Guajira
Huila
Guaviare
Guainía
Cundinamarca
Córdoba
Chocó
Cesar
Cauca
Casanare
Caquetá
CaldasBoyacá
Bolívar
Atlántico
AraucaAntioquia
Amazonas
VENEZUELA
PERU
ECUADOR
BRAZIL
75°W
75°W 70°W
70°W5°S
5°S
0° 0°
5°N
5°N
10°N
10°N
20,000 kg
Reported coca base and cocaineseizures in 2006 by department
Coca cultivation 2006
20,000 kg
Cocaine baseCocaine
Coca cultivation 2006
160.600
79.600208.220
22.830
70.800
74.800
10.7
00
10.1
00
11.7
00
20.6
00
44.8
00
PANAMA
PacificOcean
Caribbean Sea
Vichada
Vaupés
Valle Tolima
Sucre
Santander
Putumayo
Norte deSantander
Nariño
Meta
Magdalena
La Guajira
Huila
Guaviare
Guainía
Cundinamarca
Córdoba
Chocó
Cesar
Cauca
Casanare
Caquetá
Caldas Boyacá
Bolívar
Atlántico
Arauca
Antioquia
Amazonas
VENEZUELA
PERU
ECUADOR
BRAZIL
75°W
75°W 70°W
70°W5°S
5°S
0° 0°
5°N
5°N
10°N
10°N
Reported heroin seizurein 2006 by department
Possible opium poppygrowing area
10 kg
11
35
PANAMA
PacificOcean
Caribbean Sea
Vichada
Vaupés
Valle Tolima
Sucre
Santander
Risaralda
Putumayo
Norte deSantander
Nariño
Meta
Magdalena
LaGuajira
Huila Guaviare
Guainía
Cundinamarca
Córdoba
Chocó
Cesar
Casanare
Caquetá
Caldas Boyacá
Bolívar
Atlántico
AraucaAntioquia
Amazonas
VENEZUELA
PERU
ECUADOR
BRAZIL
75°W
75°W 70°W
70°W
0° 0°
5°N
5°N
10°N
10°N
Reported cannabis seizurein 2006 by department
10,000 kg
9.400
14.580
17.780
21.800
60.000
47.700
8.000
3.570
14
11
5

Colombia Coca Survey for 2006
102
Table 46: Reported seizures of illicit drugs, 2001 - 2006
Drug unit 2001 2002 2003 2004 2005 2006 Coca leaf kg 583,165 638,000 688,691 567,638 682,010 818,544 Coca paste kg 53 974 2,368 1,218 2,651 5,451 Cocaine base kg 16,572 22,615 27,103 37,046 106,491 42,708 Basuco kg 1,225 1,706 2,988 2,321 19,607 1,476 Cocaine hydrochloride kg 57,140 95,278 113,142 149,297 173,265 127,326
Opium latex kg 4 110 27 57 1,632 118 Morphine kg 47 21 78 39 93 27 Heroin kg 788 775 629 763 745 442
Raw cannabis kg 86,610 76,998 108,942 151,163 150,795 93,745 Synthetic drugs unit 22,750 175,382 5,042 19,494 - -
Source: DNE
Table 47: Reported seizures of cocaine on the Pacific and Atlantic routes, 2002 - 2006
2002 2003 2004 2005 2006 % seizures Pacific 43,435 47,137 46,128 61,042 61,758 81%Atlantic 16,065 23,157 30,928 35,856 14,150 19% Total seized by sea 59,500 70,294 77,056 96,898 75,908 100%Total seizures 95,278 113,142 149,297 173,265 127,326 % of seizures 62% 62% 52% 56% 60%
Source: Colombian Navy, Intelligence Division
Out of the total 127 mt of cocaine seized in 2006, 76 mt (or 60%) were seized at sea or in maritime ports, which leads to the conclusion that most of coca shipments are transported over sea.
Figure 32: Reported seizures of cocaine on the Pacific and Atlantic routes, 2002 - 2006
43,4
35
47,1
37
46,1
28 61,0
42
61,7
58
16,0
65
23,1
57
30,9
28
35,8
56
14,1
50
0
10,000
20,000
30,000
40,000
50,000
60,000
70,000
2002 2003 2004 2005 2006
Kg
Pacific Atlantic

PART 4. ECUADOR


Ecuador Coca Survey for 2006
105
CONTENTS
1 INTRODUCTION....................................................................................................................107
3 FINDINGS ................................................................................................................................109 COCA CULTIVATION................................................................................................................... 109
Esmeralda.............................................................................................................................109 Sucumbíos.............................................................................................................................109
ERADICATION .............................................................................................................................. 110
REPORTED SEIZURES ................................................................................................................. 110

Ecuador Coca Survey for 2006
106
ACKNOWLEDGEMENTS
The following organizations and individuals contributed to the implementation of the 2006 coca cultivation survey in Ecuador, and to the preparation of the present report:
Government of Ecuador
Consejo Nacional de Control de Sustancias Estupefacientes y Psicotrópicos del Ecuador (CONSEP) Fuerza Aérea Ecuatoriana (FAE) Dirección Nacional Antinarcóticos (DNA) Grupo Especial Móvil Antinarcóticos (GEMA)
UNODC
Humberto Chirinos, Project Coordinator, Peru
Paloma Lumbre, Digital Classification, Cartography and GIS Specialist, Peru
Aldo Gutarra, Multi-spectral Analysis Specialist, Peru Germán Galvez, Surveying, Cartography and GIS Specialist, Peru
Lorenzo Vallejos, Digital Classification, Cartography and GIS Specialist, Peru
Aldo Lale-Demoz, UNODC Representative for Peru and Ecuador
Coen Bussink, Remote Sensing and GIS Expert (UNODC – Research and Analysis Section)
Anja Korenblik, Programme Manager (UNODC – Research and Analysis Section)
Thibault le Pichon, Chief (UNODC – Research and Analysis Section)
Martin Raithelhuber, Programme Officer (UNODC - Research and Analysis Section)
Javier Teran, Statistician (UNODC – Research and Analysis Section)
The implementation of UNODC’s Illicit Crop Monitoring Programme in the Andean countries and the Ecuador survey in 2006 was made possible thanks to financial contributions from the Governments of Austria, Colombia, France, the Netherlands, Turkey, the United Kingdom, the United States of America, and from the European Commission.

Ecuador Coca Survey for 2006
107
1 INTRODUCTION
UNODC has been supporting national illicit crop monitoring systems in South America since several years, in Bolivia since 2003, in Colombia since 1999 and in Peru since 2000. Information on cocaine seizures, clandestine laboratories but also on eradication of coca bush indicated that Ecuador might not only be affected by cocaine trafficking but also by coca cultivation, with two of the main coca cultivating regions of Colombia, Putumayo-Caquetá and Pacific, located just across its northern border. It was feared that the strong eradication measures taken by the Government of Colombia could lead to a balloon effect, i.e. a spilling over of coca cultivation across the border into Ecuador.
In 2005, the Government of Ecuador and UNODC consequently agreed to start a cooperation aimed at establishing a national illicit crop monitoring system to assess the extent of coca cultivation in the country. Technical support was provided by UNODC's illicit crop monitoring team in Peru, which had already several years of experience with coca bush monitoring.
It was agreed that the methodology used would be similar to the one used in the other countries affected by coca cultivation, which relies mainly on the interpretation of satellite imagery and verification overflights. For the 2006 coca cultivation survey, several SPOT 5 satellite images acquired between December 2005 and September 2006 were used. The methodology will be further developed and adjusted to the situation of coca cultivation in Ecuador, based on the experiences gathered during the 2006 survey. This could include testing of very high resolution satellite imagery or aerial photography.

Ecuador Coca Survey for 2006
108
Map 25: Coca cultivation risk areas in Ecuador, 2006
!A!A!A!A!A
!A
!A!A!A
!A!A
!A
!A
!A
80°W
80°W
75°W
75°W
5°S
5°S
0° 0°
Source: Govermment of Ecuador - National monitoring system supported by UNODCThe boundaries and names shown and designations used on this map do not imply official endorsement or acceptance by the United Nations
COLOMBIA
PacificOcean
^
Guaya
Morona -Santiago
Azuay
El Oro
Chimborazo
Cañar
Cotopaxi
BolivarLos Rios
Manabi
Carchi
Napo
Pichincha
Esmeraldas
Sucumbios
Quito
Pastaza
Golf of Guayaquil
PERU
!Guayaquil
Ibarra
!Nueva Loja
!Cuenca
! Puyo
San Lorenzo!
Northe
rnAn
des
Volcanic Mountain Range
!A
Coca cultivation risk areas
Coca cultivation area inColombia 2006
Loja
Zamora -Chinchipe
International boundaries
Department boundaries
Eradication Points 2005GEMA - DNA
!A
Km
0 150 300
Geographic coordinates WGS84
Esmeraldas
Sucumbíos
South America
Ecuador

Ecuador Coca Survey for 2006
109
2 FINDINGS
Coca cultivation
The total area under coca bush in Ecuador in 2006 was estimated at less than 100 hectares. Coca cultivation is mainly located near the northern border of the country in the provinces of Esmeraldas and Sucumbíos. This confirms earlier indications that the proximity to coca cultivating areas in neighbouring Colombia could stimulate coca cultivation across the border in Ecuador, mainly along the Putumayo river.
Based on interpretation of satellite images, overflights, field visits and the analysis of eradication records provided by the Government, the survey identified coca cultivation risk areas in both Esmeraldas and Sucumbíos, where the majority of coca cultivation took place. The area under coca cultivation could not be quantified with more precision due to the technical limitations of the methodology employed and the small extension of coca cultivation evident in the survey area. The coca fields encountered were frequently smaller than one hectare and often under tree cover or in association with other crops.
Reports of eradication activities indicate the existence of coca fields in other provinces in northern Ecuador as well, such as Carchi, Napo, Orellana, Pastaza, and Pinchincha and even in the central province of Chimborazos. However, only provinces close to the Colombian border were included in the survey. According to the information available, coca cultivation in other provinces was not thought to be oriented towards cocaine production at any significant scale but towards traditional uses of coca leaf.
Coca cultivation in Ecuador
Esmeralda
The coca fields discovered in Esmeralda province were in a flat coastal area close to the sea. The plant density in the coca fields seemed to be rather low, and the plants were not arranged along lines or in furrows, which indicates a low level of cultivation intensity. Coca bush was often cultivated under tree cover, including in orchards, which makes detection difficult.
The province of Esmeralda is neighbouring the department of Nariño, Pacific region, in Colombia, where coca cultivation is widespread. It may well be possible that Ecuadorian migrant workers brought coca seeds back from Colombia.
Sucumbíos
Coca fields observed in the province of Sucumbíos showed similar characteristics to fields found in the other Andean countries. The coca plants are arranged in furrows along lines, with spaces between the lines, which indicates a certain level of know-how about coca cultivation. Sucumbíos neighbours the Colombian department of Putumayo, which lies just across the Putumayo River. Despite the proximity to one of the larger coca cultivation areas on the Colombian side, which, in addition, has experienced a significant extension of the area under coca bush since 2004, coca cultivation on the Ecuadorian side was marginal in 2006.

Ecuador Coca Survey for 2006
110
Eradication
In the past five years, eradication reported by the Government showed generally an increasing trend. Eradication was mainly concentrated in the northern provinces of the country, especially in the Esmeraldas province. However, occasionally, coca fields are eradicated in other provinces as well. In Ecuador, eradication of coca bush is done manually.
Table 48: Reported eradication of coca bush (hectares), 2002 to 2006
Province 2002 2003 2004 2005 2006* Esmeraldas 0.71 6 4 2.8 8 Napo - - 0.02 - n.a. Pastaza - - - 5.5 n.a. Pinchincha - - - 0.06 n.a. Sucumbíos - - - 3.92 n.a. Orellana - - - 5 n.a. Carchi - - - 1 n.a. Total 0.71 6 4.02 18.28 8
Table 49: Reported eradication of coca bush (no. of plants), 2002 to 2006
2002 2003 2004 2005 2006 No. of plants 580 28,500 19,428 68,613 60,500
Source: Anti-narcotics Units Ecuador
* Reported until September 2006.
Eradication of coca bush
Reported seizures
Ecuador, located between the two largest cocaine producers Colombia and Peru along the Pacific coast, is thought to be an important transit country for cocaine. Seizures of 43 metric tons in 2005 and 38 metric tons in 2006, which in both years surpassed the combined seizures of Bolivia and Peru, confirm this assumption.

Ecuador Coca Survey for 2006
111
Figure 33: Reported seizures of cocaine base and HCl in Ecuador (kg), 2000 to 2006
0
5,000
10,000
15,000
20,000
25,000
30,000
35,000
40,000
45,000
50,000
2000 2001 2002 2003 2004 2005 2006
(kg)
Source: ARQ; INCSR 2007


PART 5. PERU


Peru Coca Survey for 2006
115
FACT SHEET – Peru Coca Survey for 2006
2005 Variation on 2005 2006
Coca cultivation 48,200 ha +7% 51,400 ha
Of which in Alto Huallaga 16,000 ha +7% 17,100 ha
Apurímac-Ene 15,500 ha +2% 15,800 ha
La Convención-Lares 12,500 ha +2% 12,700 ha
Elsewhere 4,200 ha +38% 5,800 ha
Weighted average sun-dried coca leaf yield 2,200 kg/ha 2,200 kg/ha
Potential production of sun-dried coca leaf 106,000 mt +8% 114,100 mt
Potential production of cocaine HCl15 260 mt +8% 280 mt
In per cent of global production 27% 28%
Average farm-gate price of sun-dried coca leaf US$ 2.87/kg -12% US$ 2.52/kg
Potential farm-gate value of sun-dried coca leaf US$ 307 million -7% US$ 285 million
Average price of coca paste US$ 638/kg -14% US$ 550/kg
Average price of cocaine HCl US$ 897/kg -8% US$ 823/kg
Reported eradication of coca cultivation 12,237 ha +4% 12,688 ha
Reported seizure of coca paste 4,583 kg +10% 5,044 kg
Reported seizure of cocaine HCl 17,815 kg -17% 14,749 kg
Reported seizure of opium latex 505 kg -78% 109 kg
15 Figure for 2005 was revised based on updated information available on the amount of coca leaf necessary to produce one kilogramme of cocaine HCl.

Peru Coca Survey for 2006
116
Abbreviations
CADA Alternative Development Assistance Body CONTRADROGAS Committee for the Fight Against Drug Consumption CORAH Control and Reduction of Coca Leaf in Alto Huallaga DEVIDA National Commission for Development and Life without Drugs DIRANDRO Anti-Drugs Directorate, Peruvian National Police ENACO National Coca Enterprise GIS Geographical Information Systems GPS Global Positioning System ICMP UNODC Illicit Crop Monitoring Programme NAS Narcotics Affairs Section, United States Embassy OFECOD Drug Control Office, Peruvian Ministry of Interior UNODC United Nations Office on Drugs and Crime
Acknowledgements
The following organizations and individuals contributed to the implementation of the 2006 coca cultivation survey in Peru, and to the preparation of the present report:
Government of Peru:
National Commission for Development and Life without Drugs (DEVIDA)
UNODC: Humberto Chirinos, Project Coordinator, Peru Paloma Lumbre, Digital Classification, Cartography and GIS Specialist, Peru Aldo Gutarra, Multi-spectral Analysis Specialist, Peru Germán Galvez, Surveying, Cartography and GIS Specialist, Peru Lorenzo Vallejos, Digital Classification, Cartography and GIS Specialist, Peru Victor Rojas, Photo-Interpretation and Cartography Specialist, Peru Carlos Coello, Cartographic Technician, Peru Aldo Lale-Demoz, UNODC Representative for Peru and Ecuador Coen Bussink, Remote Sensing and GIS expert (UNODC – Research and Analysis Section) Anja Korenblik, Programme Manager (UNODC – Research and Analysis Section) Thibault le Pichon, Chief (UNODC – Research and Analysis Section) Thomas Pietschmann, Research Officer (UNODC - Research and Analysis Section) Martin Raithelhuber, Programme Officer (UNODC - Research and Analysis Section) Javier Teran, Statistician (UNODC – Research and Analysis Section)
The implementation of UNODC’s Illicit Crop Monitoring Programme in the Andean countries and the Peru survey in 2006 was made possible thanks to financial contributions from the Governments of Austria, Colombia, France, the Netherlands, Turkey, the United Kingdom, the United States of America, and from the European Commission.
This report and other ICMP survey reports can be downloaded from:
www.unodc.org/unodc/en/crop_monitoring.html

Peru Coca Survey for 2006
117
CONTENTS
1 INTRODUCTION....................................................................................................................119
2 FINDINGS ................................................................................................................................121 COCA CULTIVATION................................................................................................................... 121
REGIONAL ANALYSIS................................................................................................................. 121
Alto Huallaga .......................................................................................................................122 Apurímac-Ene.......................................................................................................................124 La Convención-Lares............................................................................................................127 Other cultivation regions......................................................................................................128
PRODUCTION OF COCA LEAF AND DERIVATES .................................................................. 130
PRICES FOR COCA LEAF AND DERIVATES............................................................................ 131
REPORTED ERADICATION......................................................................................................... 134
REPORTED SEIZURES ................................................................................................................. 134

Peru Coca Survey for 2006
118
Map 26: Coca cultivation density in Peru, 2006
Loreto
Ucayali
Puno
Cusco
JuninLima
Arequipa
Ica
Piura
Madre de Dios
Ancash
San Martin
Ayacucho
Huanuco
Pasco
Amazonas
Cajamarca
Tacna
Apurimac
La Libertad
Huancavelica
Moquegua
Lambayeque
Tumbes
80°W
80°W
75°W
75°W
70°W
70°W15
°S
15°S
10°S
10°S
5°S
5°S
0° 0°
Cultivation density(ha/km )2
0.1 - 1.0
1.1 - 4.0> 4.0
International boundaries
Department boundaries
Pacific
Ocean
Marañon
AltoHuallaga
Aguaytia
Palcazu - PichisPachitea
ApurimacEne
La Convencionand Lares
San Gaban
InambariTambopata
BRAZIL
BOLIVIA
ECUADOR Putumayo COLOMBIA
CHILE
Source: National monitoring system supported by UNODC - Government of PeruThe boundaries and names shown and the designations used on this map do not imply official endorsement or acceptance by the United Nations
LakeTiticaca
Geographic coordinates WGS 84
South America
Peru
Putumayo
Huall
aga Am
azon
as
Huallaga
Marañon
Ucayali
Ene Urubamba
Purus
Apurimac
Madre de Dios
Amazonas
^Lima
km
0 150 300

Peru Coca Survey for 2006
119
1 INTRODUCTION
In response to the decisions of the 1998 United Nations General Assembly Special Session on Drugs, UNODC developed and implemented a global Illicit Crop Monitoring Programme (ICMP). Through this programme, UNODC supports Member States in establishing a crop monitoring system to monitor illicit cultivation of coca, opium poppy and cannabis. The Programme is currently operating in Afghanistan, Bolivia, Colombia, Laos, Morocco, Myanmar, and Peru.
In 1998, UNODC started working with DEVIDA to develop a national coca monitoring system in Peru. Using aerial photography, the project produced a detailed mapping (at 1/20,000 scale) of all the coca cultivation areas in 2000. Every year since then, satellite images were used to update the estimates. This report presents the findings of the 2006 Survey.
In Peru, the General Law on Drugs enacted in 1978 prohibits the cultivation of coca and seedlings in new areas within the national territory. This reference to “cultivation” includes the grafting and renovation of existing coca bushes. In 1978, another law established the National Coca Enterprise (ENACO), which has a monopoly on the commercialization and industrialization of the coca leaves. Therefore, the selling of coca leaves to any party other than ENACO is considered illicit by national law.
The Government also established in 1996 a Committee for the Fight Against Drug Consumption (CONTRADROGAS), renamed National Commission for Development and Life without Drugs (DEVIDA) in 2002. DEVIDA’s objectives are to design, coordinate and implement policies and activities aimed at national drug control.
Until the mid-1990’s, Peru was the world’s main coca cultivating country. Today, it is the second major producer of coca behind Colombia.
The reduction in coca cultivation in Peru in the mid-1990’s was linked to the sharp decline in both the coca leaf prices and the demand for Peruvian coca leaf. In 1995, trade in coca leaf on the local market ceased and, from 1996 to 1998, the prices of coca leaf remained lower than its production costs. Farmers abandoned their coca fields and coca cultivation dropped from 115,300 ha to 38,700 ha, or 66%, between 1995 and 1999.
After 1999, coca prices increased slowly while the prices of licit crops (coffee and cacao) decreased. Farmers started to re-activate their abandoned coca fields and coca cultivation rose again in Peru. To some extent, the increase has been contained by the presence of alternative development projects, as well as the introduction of eradication measures, which include both forced eradication conducted by CORAH (Ministry of Interior) and voluntary eradication schemes conducted by DEVIDA.

Peru Coca Survey for 2006
120
Map 27: Coca cultivation in Peru by region, 2002 to 2006
Loreto
Ucayali
Puno
Cusco
JuninLima
Arequipa
Ica
Piura
Madre de Dios
Ancash
San Martin
Ayacucho
Huanuco
Pasco
Amazonas
Cajamarca
Tacna
Apurimac
La Libertad
Moquegua
Lambayeque
Tumbes
Huancavelica
80°W
80°W
75°W
75°W
70°W
70°W15
°S
15°S
10°S
10°S
5°S
5°S
0° 0°
Coca cultivation (ha)200220032004
International boundariesDepartment boundaries
OceanPacific
Marañon
AltoHuallaga
Aguaytia
Palcazu - PichisPachitea
ApurimacEne
La Convencionand Lares
San Gaban
InambariTambopata
BRAZIL
BOLIVIA
ECUADOR
Putumayo
COLOMBIA
CHILE
Source: National of monitoring system supported by UNODC - Government of PeruThe boundaries and names shown and the designations used on this map do not imply official endorsement or acceptance by the United Nations
LakeTiticaca
Geographic coordinates WGS 84
South America
Peru
Putumayo
Huall
aga Am
azon
as
Huallaga
Marañon
Ucayali
Ene
Urubamba
Purus
Apurimac
Madre de Dios
Amazonas
^Lima
km
0 150 30020052006
Coca growing areas 2006
2,36
6
446
12,7
47
15,8
13
17,1
65
426
1,57
0
443
375
150

Peru Coca Survey for 2006
121
2 FINDINGS
Coca cultivation
In 2006, coca cultivation in Peru amounted to 51,400 hectares, a 7 per cent increase compared to 2005. Peru remains the second largest coca cultivating country behind Colombia, with a share of 33 per cent of global coca cultivation. Since its low of 38,700 hectares in 1999, the area under coca bush in Peru has increased by one third but remains well below the record level of over 120,000 hectares reached in the early 1990s. This year, an increase in the area under coca bush could be observed in almost all the cultivation regions.
Figure 34: Coca cultivation in Peru (hectares), 1990 to 2006
0
20,000
40,000
60,000
80,000
100,000
120,000
140,000
1990 1991 1992 1993 1994 1995 1996 1997 1998 1999 2000 2001 2002 2003 2004 2005 2006
Hec
tare
s
US State Department National Monitoring System supported by UNODC
Regional analysis
The three large coca cultivation regions of Alto Huallaga, Apurímac-Ene and La Convención-Lares together account for 89 per cent of the total coca cultivation in Peru in 2006. The remaining 11 per cent are distributed among five much smaller cultivation regions. A newly identified coca area in the Colombia-Brazil-Peruvian border triangle in the Amazonian basin was included into the Marañon-Putumayo region as Amazonas (Caballococha). Twelve out of the 24 departments in Peru were affected by coca cultivation in 2006.

Peru Coca Survey for 2006
122
Figure 35: Coca cultivation by cultivation region, 2006
Other4%
Palcazu - Pichis - Pachitea
1%
San Gaban1%
Marañon, Putumayo, Amazonas
2%
La Convención - Lares25%
Aguaytía3%
Inambari - Tambopata
5%
Alto Huallaga32%
Apurimac - Ene31%
Table 50: Coca cultivation by cultivation region (hectares), 2001 to 2006
Region 2001 2002 2003 2004 2005 2006 Variation
2005 - 2006
Alto Huallaga 14,481 15,286 13,646 16,900 16,039 17,080 1,126Apurímac-Ene 12,600 14,170 14,300 14,700 15,530 15,813 283La Convención-Lares 13,980 12,170 12,340 12,700 12,503 12,747 244Inambari-Tambopata 2,520 2,430 2,260 2,000 2,250 2,366 116Aguaytía 1,051 1,070 510 500 917 1,570 653Marañon, Putumayo, Amazonas 1,250 1,250 450 500 500 968 468San Gabán n.a. n.a. 470 2,700 292 446 154Palcazú-Pichis-Pachitea 350 350 250 300 211 426 215Rounded Total 46,200 46,700 44,200 50,300 48,200 51,400 3,200
Alto Huallaga
The Alto Huallaga region is located on the eastern side of the Andes mountain range, in the high tropical or subtropical forests of the departments of San Martin and Huamuco. In this region, coca bush is cultivated between 400 and 1,400 meters above sea level.
For the third year in a row, Alto or Upper Huallaga was the largest coca cultivation region in Peru and accounted alone for one third of the total area under cultivation. The coca bush area in the Alto Huallaga region grew by 7 per cent in 2006. However, diverging sub-regional trends characterized the situation.

Peru Coca Survey for 2006
123
Map 28: Coca cultivation density in Alto Huallaga, 2006
Alto Biavo
Cholon
Polvora
Monzon
Shunte Tocache
Jose Crespo y Castillo
Uchiza
Marias
Cochabamba
Nuevo Progreso
Jircan
Huavaybamba
Rupa-Rupa
Mariano Damaso Beraun
Singa Tantamayo
Puños
Arancay
Luyando
Miraflores
Hermilio Valdizan
Punchao
76°30'W
76°30'W
76°0'W
76°0'W9°
30'S
9°30
'S
9°0'
S
9°0'
S
8°30
'S
8°30
'S
8°0'
S
8°0'
S
Source: National monitoring system supported by UNODC - Govemment of PeruThe boundaries and names shown and the designations used on this map do not imply official endorsement or acceptance by the United Nations
Cultivation density(ha/km )2
1.1 - 2.02.1 - 4.0
> 8.0Department boundariesDistrict boundaries
SAN MARTIN
LORETO
UCAYALI
HUANUCO
ANCASH
PuertoPizana
Monzon
Tulumayo
Pendencia - Aucayacu
Aspuzana
Santa Martha
Camote - Frijol
Tocache - Chontayacu
Tingo Maria
Mishollo
CachicotoMonzon M
onzon
Cuchara
Pend
encia
Tulumayo
Pendencia
Aucayacu
Aucayacu
Sta. Martha
Magd
alena
Aspu
zana
Aspuzana
Yanaja
nca
Santa Lucia
Chontay
acu
Uchiza
Camo
te
Frijo
l
Uchiza
Cuchara
Magdalena
Tocache
Tocac
he
Pto. Pizana
Mishollo
0.1 - 1.0
4.1 - 8.0
Major roadRiverVillage center
Tazo
Monzon
ALTOHU
ALLAGA
ALTOH
UALLAGA
Geographic coordinates WGS 84
Pucayacu
Bambamarca
Yanajanca
Huamuco
km0 20 40
Peru
AltoHuallaga

Peru Coca Survey for 2006
124
The north of Alto Huallaga was targeted by eradication campaigns, which resulted in a decrease in coca cultivation area. The decrease was, however, more than compensated by cultivation increase in a number of areas in the southern part of the region, which led to an overall increase of 7 per cent. On the other hand, coca cultivation seems to have reached a certain saturation in the Monzon area, also located in the southern part of Alto Huallaga. During verification flights, it was observed that almost all the land suitable for coca cultivation, including very steep slopes, was already covered by coca bush.
In Alto Huallaga, coca cultivation goes back at least 30 years. Since several years, coca fields have plant densities of about 20,000 to 30,000 coca plants per hectare. Recently, older fields have been rejuvenated by replacing old bushes with young coca seedlings. Higher coca plants densities up to 60,000 plants per hectares have also been reported. Both measures could potentially increase coca leaf yield in an area that is know for its relatively low yields but high quality of coca leaf, i.e. smaller coca leaf amount is needed to produce the same amount of coca paste compared to other areas.
Valley in Alto Huallaga
Apurímac-Ene
The Apurímac-Ene cultivation region is situated in the central part of the country extending over 12,000 sq km in the valleys of the rivers Apurímac and Ene, among the departments of Ayacucho, Cusco and Junin. The relief is uneven, and coca cultivation takes place at altitudes ranging between 550 and 2,000 meters above sea level.
Apurímac-Ene is the second largest coca cultivating region in Peru, with over 15,800 hectares in 2006, and accounted for just under one third of the total area under coca bush cultivation in the country. Over the last five years, the coca cultivation areas have grown slowly but steadily. The increase by 283 hectares compared to 2005 did not happen in specific parts of the region but was more or less evenly distributed. In 2006, Apurímac-Ene was not targeted by eradication of coca bush. However, maceration pits and cocaine HCl laboratories were destroyed by the authorities.

Peru Coca Survey for 2006
125
Map 29: Coca cultivation density in Apurímac-Ene, 2006
Pien
e
Sivia
Anco
Quimbiri
Pichari
San Miguel
Ayna
Santillana
Huanta
Tambo
Santa Rosa
Chil
Quinua
uain
Acos Vinchosacucho
Huamanguilla
Pacaycasa
74°0'W
74°0'W
73°30'W
73°30'W13
°0'S
13°0
'S
12°3
0'S
12°3
0'S
12°0
'S
12°0
'S
Coca cultivation density in Apurimac - Ene, 2006
Source: National monitoring system supported by UNODC - Government of Peru
Cultivation density(ha/km )2
0.1 - 1.0
2.1 - 4.0
Department boundariesDistrict boundaries
Geographic coordinates WGS84
1.1 - 2.0
Yaviro
Mantaro
San Antonio
Monterrico
Sta. Rosa
Palmapampa
PichariSivia
Llochegua
Canayre
VillaVirgen
> 8.04.1 - 8.0
Major roadRiverVillage center
Villa Virgen
Chunch
ubamba
Sta.
Rosa
Picha
ri
Acon
Chuimacota
ENE
ValleEsmeralda
Quem
piri
Anapati
Quempiri
San Francisco Quimbiri
Quimbiri
APURIMAC
APURIMAC
Echarate
Rio Tambo
Masamari
Pangoa
Vilcabamba
JUNIN
CUSCO
AYACUCHO
Apurimac
Ene
km0 15 30
Peru
ApurimacEne
The boundaries and names shown and the designations used on this map do not imply official endorsement or aceptance by the United Nations

Peru Coca Survey for 2006
126
Coca seedbeds in Apurímac
In Apurímac-Ene, much higher coca plant densities were observed than in Alto Huallaga. Fields with only 40 centimetres distance between coca plant rows and 20 centimetres between plants were observed, which translates into plant densities of up to 120,000 plants per hectares. It is not unusual to find coca plantations with two or more coca plants per hoyo (planting hole). This results in (initial) plant densities of over 300,000 plants per hectare. However, it can be assumed that not all of the initially planted seedlings survive, and that plant densities of mature plantations are still lower.
Despite a worsening conditions due to the tensions between coca farmers and government forces, UNODC continues to implement Alternative Development projects in the region. The projects are active in the fields of reforestation of former coca plantations and improvement of alternative crops such as coffee, cacao and palm heart.
Coca field preparation in Apurímac

Peru Coca Survey for 2006
127
La Convención-Lares
The cultivation region of La Convención-Lares is situated in the department of Cusco. Coca is mostly cultivated between 800 and 2,000 meters above sea level on the steep mountain slopes of this region. In 2006, over 12,700 hectares of coca bush were identified in La Convención-Lares, which represents a slight increase by 2 per cent compared to 2005. Since 2001, the area under coca bush has been relatively stable with an average of 12,700 hectares. The variations are thought to be due the practice of pruning the coca bushes periodically after about three to four years rather than to increases or decreases of the actual area under coca cultivation. Freshly pruned coca fields are not captured with the current survey methodology, since these fields cannot be identified as coca on the satellite images used.
Map 30: Coca cultivation density in La Convención-Lares, 2006
Yanatile
Quellouno
SANTA TERESA
Ocobamba
Huayopata
Santa Ana
Ollantaytambo
Machupicchu
Maras
Maranura
Urubamba
Y
72°30'W
72°30'W
13°0
'S
13°0
'S
12°3
0'S
12°3
0'S
Cultivation density(ha/km )2
0.1 - 1.0
4.1 - 8.0> 8.0
Geographic coordinates WGS 84
Quillabamba
Maranura
Echarate
QuebradaHonda
Kquellccaybamba
QuellounoPalma Real
Huayopata
Coca cultivation density in La Convencion - Lares, 2006
Peru
La Convencionand Lares
1.1 - 2.02.1 - 4.0
District boundariesMajor roadRiverVillage Center
VilcanotaYanatile
Yanatile
Vilca
nota
Urubamba
Versa
lles
Ocob
amba
Yavero
Yavero
Vilcanota
LucumaVilcabamba
La Convencion
Lares
Source: National monitoring system supported by UNODC - Govemment of PeruThe boundaries and names shown and the designations used on this map do not imply official endorsement or acceptance by the United Nations
km0 15 30
CUSCO

Peru Coca Survey for 2006
128
Historically, the region has been considered as the coca cultivation centre for the traditional use of coca leaves. In 1978, the state company ENACO registered 12,685 coca farmers for the cultivation of 10,670 hectares of coca bush. At that time, it was estimated that coca leaf production amounted to 7,400 metric tons per year, of which 3,764 metric tons (or 51%) were destined for ENACO, the rest being smuggled outside the control of ENACO. Since then, the diversion of coca leaf intensified due to better prices offered for coca leaf outside ENACO’s market. In particular in the past few years, it was noted that farmers improved their coca leaf yields by increasing the coca plant density and the (increased) use of fertilizers and pesticide. Traditionally, a distance of one meter was kept between rows and 40 cm between plants, corresponding to 25,000 to 30,000 plants per hectare.
However, it is assumed that coca leaf production from the region is mainly oriented towards traditional uses like chewing, and not towards narco-trafficking. There were no reports of eradication nor destruction of maceration pits or clandestine laboratories.
In 2005, a regional decree authorized coca cultivation, thereby recognizing the region as a traditional center of coca cultivation. The decree granted the coca plant the status of Regional Natural, Biological and Cultural Heritage of Cusco, and recognized it as botanical resource integrated within the culture and cosmovision of the Andean world and its medicinal customs and traditions. It recognized the region as traditional coca leaf producing area and legalized coca cultivation in the valleys of La Convención, i.e. the valleys of Yanatile in the province of Calca and Qosñipata de Iño in the province of Paucartambo, all in the department of Cusco. However, the decree was subsequently invalidated by the Constitutional Court.
Coca field in forest clearing in Pichis
Other cultivation regions
Coca cultivation in the smaller cultivation regions together accounted for only about 5,800 hectares, representing 11% on the total coca cultivation area in the country. Although representing only a small portion of the total area under coca bush, the highest rates of increase were observed in the smaller regions, particularly in Palcazú-Pichis-Pachitea (+102%), Marañón-Putumayo-Amazonas (+94%), Aguaytía (+71%) and San Gabán (+53%).

Peru Coca Survey for 2006
129
The cultivation region of Marañón-Putumayo was extended to include the newly identified coca cultivation area of Amazonas along the Amazonas river in the locality of Caballococha-Santa Rosa. This low lying area near the Brazilian border is characterized by plains and undulating hills. As reported in earlier reports, eradication activities in Lower and Central Huallaga have reduced coca cultivation in these area significantly.
Coca fields in Quillabamba

Peru Coca Survey for 2006
130
Production of coca leaf and derivatives
UNODC continuously tries to refine its estimation of coca leaf yields and cocaine production. Based on results of a UNODC coca leaf yield survey initiated in 2004, regional yield estimates for the main coca cultivation regions Apurímac-Ene, Alto Huallaga and La Convención-Lares were established. For the other regions, information obtained previously by UNODC in the years 2000 and 2001 was used.
Table 51: Annual sun-dried coca leaf yields by region (kg/ha/year)
Region Annual sun-dried
coca leaf yield (kg/ha)
Apurímac-Ene* 3,627Alto Huallaga* 2,988Alto Huallaga (Monzon) 1,197La Convención-Lares* 1,457San Gabán 1,290Inambari - Tambopata 1,290Aguaytía 1,376Marañon, Putumayo 860Palcazú-Pichis-Pachitea 1,433
* UNODC coca leaf yield survey 2004.
The total production of sun-dried coca leaf in Peru was estimated at 114,100 metric tons in 2006. This corresponds to a national weighted average of about 2,200 kg/ha sun-dried coca leaf. The coca leaf production in 2006 was 8 per cent higher than in 2005 (106,000 metric tons).
Sun-drying of harvested coca leaves

Peru Coca Survey for 2006
131
According to a study of the National Institute of Statistics and Computer Science (INEI), 9,000 metric tons of sun-dried coca leaf are used for traditional, commercial and industrial purposes in Peru annually.16 For the calculation of the amount of coca leaf available for cocaine production, this amount was deducted from the total of 114,100 metric tons in 2006.
Based on updated information available on conversion rates established by the "Operation Breakthrough", conducted by the United States in 2003 and 2004, 375 kg of sun-dried coca leaf are necessary to produce one kilogramme of cocaine HCl of 100% purity. Applying this rate to the remaining 105,100 metric tons of sun-dried coca leaf available for cocaine production, 280 metric tons of cocaine HCl can be produced. Therefore, the total potential production of cocaine HCl was estimated at 280 metric tons in 2006. The potential cocaine production figures for the years 2003 to 2005 were revised accordingly.
Figure 36: Potential cocaine production (metric tons), 1995 to 2006
0
50
100
150
200
250
300
350
400
450
500
Met
ric to
ns
Production 460 435 325 240 175 141 150 160 230 270 260 280
1995 1996 1997 1998 1999 2000 2001 2002 2003 2004 2005 2006
Figures from 2003 to 2005 w ere revised based on updated information on the amount of coca leaf necessary to produce one kilogramme of cocaine HCl.
In 2006, the potential cocaine production increased by 8 per cent compared to 2005. While this is the highest production figure since 1998, it is still only about half the amount registered during the cocaine production peak in Peru in 1992. Peru accounted for 28 per cent of the global cocaine production in 2006.
Prices for coca leaf and derivatives
In the course of the year 2006, farm-gate prices for sun-dried coca leaf on the illicit market fell in all the cultivation regions in Peru. The national average price for coca leaf in 2006 was only US$ 2.52 per kg compared to US$ 2.87 per kg in 2005, a reduction by 12 per cent. Despite this decrease, price on the illicit coca leaf market remained significantly higher than prices paid by ENACO on the government controlled market, with an average price of US$ 1.54/kg.
16 "Encuesta nacional sobre consumo tradicional de hoja de coca en los hogares", INEI-DEVIDA, November 2004.

Peru Coca Survey for 2006
132
Figure 37: National average farm gate price of sun-dried coca leaf (US$/kg), 1990 to 2006
0.0
0.5
1.0
1.5
2.0
2.5
3.0
3.5
1990 1991 1992 1993 1994 1995 1996 1997 1998 1999 2000 2001 2002 2003 2004 2005 2006
US$
/kg
The southern parts of Alto Huallaga (Monzón and Tingo Maria) and Apurímac, located in the two largest cultivation regions, experienced the largest price decreases, probably due to an increase in the amount of coca leaf available on the illicit market caused by the increase of the area under coca bush and improved cultivation techniques.
Table 52: Yearly average price of sun-dried coca leaf by region (US$/kg), 2005 to 2006
Region 2005 2006 % variation 2005 - 2006
Alto Huallaga: Monzón 3.70 3.00 -19% Alto Huallaga: Sur 3.20 2.60 -19% Alto Huallaga: Norte 2.60 2.40 -8% Apurímac 2.20 1.80 -18% Inambari 2.90 2.80 -3% Aguaytía 2.60 2.50 -4% National average 2.87 2.52 -12%
Coca leaf prices differ considerably between regions. This is not surprising considering the fact that transport of the bulky coca leaf between regions is costly and risky due to law enforcement activities.
The monthly fluctuations in coca leaf prices are thought to be the result of seasonal variations in the supply of coca leaf, as well as market disruptions due to law enforcement activities, which cause traffickers to leave some regions temporarily.

Peru Coca Survey for 2006
133
Figure 38: Monthly average farm-gate prices of sun-dried coca leaf in Alto Huallaga (US$/kg), 1999 to 2006
0.0
1.0
2.0
3.0
4.0
1999 2000 2001 2002 2003 2004 2005 2006
US$
/kg
Alto Huallaga

Peru Coca Survey for 2006
134
Reported eradication
In Peru, eradication of coca bush is exclusively manual. In 2006, the Government of Peru reported the eradication of 12,688 hectares of coca bush, most of which (10,137 hectares) were eradicated through CORAH's forced eradication programme, and the remainder through voluntary eradication programmes executed by DEVIDA and CADA. The total area eradicated in 2006 was 4 per cent larger than in 2005. In 2006, CORAH's eradication activities were concentrated in the northern area of the Alto Huallaga region. About two thirds of the area eradicated by CORAH were young coca fields, i.e. with plants younger than one year.
Figure 39: Cultivation and reported eradication of coca bush (hectares), 1995 to 2006
0
20,000
40,000
60,000
80,000
100,000
120,000
140,000
Hec
tare
s
Cultivation 115,30 94,400 68,800 51,000 38,700 43,400 46,200 46,700 44,200 50,300 48,200 51,500
Eradication - 1,259 3,462 7,834 14,733 6,206 6,436 7,134 11,312 10,339 12,237 12,688
1995 1996 1997 1998 1999 2000 2001 2002 2003 2004 2005 2006
Reported seizures
In 2006, the Government of Peru (DIRANDRO) reported a strong increase in the amount of coca paste and cocaine HCl seized by the authorities. Cocaine HCl seizures were almost three times the amount of coca paste seizures.
Table 53: Reported seizures (kg), 2003 to 2006
2003 2004 2005 2006 Coca leaf 1,328,347 916,024 1,525,739 1,078,514 Coca paste 4,366 6,330 3,199 5,044 Cocaine HCl 3,574 7,303 2,119 14,749
The seizure and destruction of eleven clandestine cocaine HCl laboratories, in addition to 707 laboratories processing coca paste and cocaine base, confirms that the capacity to produce cocaine HCl exists in Peru.


Vienna International Centre, P.O. Box 500, A-1400 Vienna, Austria Tel: (+43 1) 26060-0, Fax: (+43 1) 26060-5866, www.unodc.org
Printed in Slovakia