cocaine hydrochloride structure in solution revealed …hanicka.uochb.cas.cz/~bour/pdf/185.pdf ·...
TRANSCRIPT

Cocaine Hydrochloride Structure in Solution Revealed byThree Chiroptical MethodsPatrik Fagan,[b] Lucie Kocourkov#,[b] Michal Tatarkovic,[b] Frantisek Kr#l&k,[b] Martin Kuchar,[b]
Vladim&r Setnicka,[b] and Petr Bour*[a, b]
1. Introduction
Cocaine is a tropane alkaloid found in the leaves of Erythroxy-
lum coca, and is one of the most widely abused drugs. The co-caine molecular skeleton possesses four chiral centers; its four
diastereoisomers are known as cocaine, pseudococaine, alloco-caine and allopseudococaine. Although all of them can be
used as local anesthetics, allococaine and allopseudococaine
are much less efficient than pseudococaine or the “natural” co-caine,[1] the conformations of which are investigated in the
present study.The cocaine tropane ring supports four different conforma-
tions: the heterocyclic six-membered ring forms chair or boatconformers, with axial or equatorial position of the N-methylgroup.[2] Such flexibility naturally attracted attention and was
examined in a number of studies.[1–3] X-ray powder diffractionwas used to identify cocaine free base[4] and its salt.[5] Thesecrystallographic works also indicated that the chair conforma-tion with N-methyl group in the equatorial position is pre-
ferred.
Cocaine conformation in solution was studied by nuclear
magnetic resonance spectroscopy, which confirmed the domi-nance of the chair form.[3, 6] Stereochemistry of the N-methyl
group, however, depends on the solvent. The equatorialisomer was observed for cocaine hydrochloride dissolved in
D2O, whereas the axial isomer was additionally present in deu-
terated dichloromethane.[7] This work focuses on H2O/D2O solu-tions, in which the hydrochloride is completely dissociated.
In forensic practice, Raman and infrared (IR) absorption spec-troscopies are frequently used to identify cocaine based on its
characteristic vibrational bands.[8] For example, cocaine hydro-chloride has strong Raman signals at ca. 1713 (C=O stretching)and 1203 cm@1 (C@O@C bending).[9] Similarly, in the infrared
spectra, 1728 and 1712 cm@1 bands (C=O stretching of the twocarbonyl groups), 1265, 1230 and 1105 cm@1 (acetate C@Ostretching) and those originating from the aromatic ring C@Hstretching vibrations were assigned to cocaine.[9] An interesting
assignment was reported for a cocaine hydrochloride band en-countered at ca. 2540 cm@1 and attributed to N@H stretching,
which normally occurs at much higher wavenumbers.[8c]
The traditional spectroscopic techniques are versatile andeasy to use, but their sensitivity to molecular structure is limit-
ed. Chiroptical techniques are much more responsive. In partic-ular, vibrational optical activity (VOA) methods comprising vi-
brational circular dichroism (VCD, difference in absorption ofthe left- and right-circularly polarized light) and Raman optical
activity (ROA, difference in scattering of the right- and left-cir-
cularly polarized light)[10] are in general considered to be morereliable for determination of the absolute configuration than
the electronic methods.[11] The electronic circular dichroism(ECD) provides useful information about the prevalent cocaine
conformation as well.
Structure and flexibility of natural compounds determine theirbiological activity. In the present study, electronic circular di-
chroism (ECD), vibrational circular dichroism (VCD), and Ramanoptical activity (ROA) spectra of cocaine hydrochloride in aque-ous solutions were measured and related to the structure withthe aid of density functional theory (DFT) computations. Addi-tional measurements in deuterated environment made assign-ment of vibrational bands easier. The results suggest that the
prevalent cocaine conformation in solution differs from that
adopted in hydrochloride crystal. The spectroscopic results and
computational analysis are consistent with X-ray structures of
known cocaine-receptor complexes, in which the compoundadopts a variety of conformations. All three kinds of chiropticalspectra exhibited significantly greater conformational sensitivi-ty than unpolarized absorption or Raman scattering. The ROAtechnique provided the largest number of well-resolved bands,bearing rich structural information.
[a] Prof. P. BourInstitute of Organic Chemistry and BiochemistryAcademy of Sciences, Flemingovo n#mest& 216610 Prague (Czech Republic)E-mail : [email protected]
[b] P. Fagan, L. Kocourkov#, M. Tatarkovic, F. Kr#l&k, Dr. M. Kuchar,Prof. V. Setnicka, Prof. P. BourDepartments of Analytical Chemistry andChemistry of Natural Compoundsand Forensic Laboratory of Biologically Active SubstancesUniversity of Chemistry and TechnologyTechnick# 5, 16628 Prague (Czech Republic)
Supporting Information and the ORCID identification number(s) for theauthor(s) of this article can be found under https://doi.org/10.1002/cphc.201700452.
ChemPhysChem 2017, 18, 2258 – 2265 T 2017 Wiley-VCH Verlag GmbH & Co. KGaA, Weinheim2258
ArticlesDOI: 10.1002/cphc.201700452

For cocaine, only the ECD spectroscopy has been used todate, without any backing by quantum-chemical modeling of
the spectra.[12] Yet today, interpretations of chiroptical spectraare unthinkable without a profound computational analysis
and ab initio simulations relating spectral features to the struc-ture.[13] In general, quantum-chemical simulations of electronic
spectra, such as ECD, are more demanding than of vibrationalspectra, which are dependent on the electronic ground-stateonly. The main goal of the present study is therefore to com-
pare the performance of all three main chiroptical techniques,relate the spectra to the conformation of the cocaine ion, and
to provide a solid theoretical basis for the interpretation.
2. Results and Discussion
2.1. Geometry
Firstly, we inspect the axial and equatorial forms (A and E,
Figure 1). Calculated energies and torsion angles of the lowest
energy conformations are listed in Table 1. The lowest energyconformers with respect to other molecular motions are com-
pared. The equatorial methyl position in E is clearly more con-venient than the axial one, by about 10 kcal mol@1 for the
three computational methods. This is considerably more than2 kcal mol@1 obtained earlier with a less advanced AM1
method[1] and is consistent with available X-ray experiments
either with or without receptors, for which the equatorial formwas found exclusively, albeit with various conformations of
other molecular parts.[4–5, 14] The equatorial conformation is sta-bilized by a hydrogen bond between the NH and carboxyl
groups. This is different in the neutral cocaine form (not inves-tigated in the present study) with a more planar arrangement
of the nitrogen bonds.[4] Thus, both the computational results
and experimental data suggest that E is practically the onlyform present in a significant amount in solution.
Next, we investigate all conformers of the equatorial form.The orientations of the methyl ester and benzoyloxy groups
described by the torsion angles ai, i = 1, 2, 4, 5, 6 vary signifi-cantly according to the cocaine environment. Examples of five
experimental geometries determined by previous studies are
summarized in Table 2. Apparently, the a1 and a5 angles tend
to adopt ca. 1808, a6 is close to 08, and a2 and a4 are ratherflexible. This is consistent with the relatively small energy dif-
ferences among the four lowest energy conformers summar-ized in Table 3. The calculated values of torsion angles a2 and
a4 (a1 and a5 were always close to 180 8) for conformers I andII are consistent with the experimental data (Table 2); conform-
ers III and IV do not occur in the experiment and their relative
conformer energies are rather high.
2.2. ECD of Individual Conformers
Calculated absorption and ECD spectra are compared to theexperimental data in Figure 2. The computed (B3PW91/6-311 +
Figure 1. Cocaine hydrochloride, axial (A) and equatorial (E) forms of cocainecation, and definition of the torsion angles (a1 =] CMe-O’-C’O-C2R, a2 =]O’-C’O-C2R-C3S, a4 =]C2R-C3S-O-CO, a5 = ] C3S-O-CO-PPhe, a6 =]O-CO-PPhe-Csp2).
Table 1. Relative energies [kcal mol@1] and torsional angles (for DFT, indegrees) of the lowest energy axial and equatorial cocaine conformers.
E A
EHF 0 10.3EHF-D 0 10.5EDFT 0 9.1a1 @178 179a2 98 157a4 @83 @149a5 @179 179a6 0 2
Table 2. Experimentally observed torsion angles in cocaine.
Hydrochloride[5] Free-base[4] 1Q72[a][15] 2AJV[a][14 a] 2PQZ[a,b][14 b]
a1 @178 173 @144 169 167a2 140 179 108 102 117a4 77 @139 @77 @89 @138a5 179 178 @177 @164 @173a6 3 7 14 13 27
[a] Protein database identifier, http://www.rcsb.org. [b] sp2 (planar) nitro-gen hybridization.
ChemPhysChem 2017, 18, 2258 – 2265 www.chemphyschem.org T 2017 Wiley-VCH Verlag GmbH & Co. KGaA, Weinheim2259
Articles

+ G**/CPCM) absorption profile reproduces the main experi-mental features, with a strong band at 236 nm (experimentallyat 231 nm), and a smaller band at 256 nm (exp. 275 nm). Corre-
spondence of the ECD bands is not so clear; at the longestwavelengths, unrealistically low intensity is calculated, whereasa broad positive signal was measured around 279 nm. Within230–350 nm, Boltzmann-averaged computation gives a coupletand only the overall ECD sign is slightly negative, as in experi-
ment, mostly due to the contribution of the second conformer.Other functionals tried (B3LYP, B86, CAM-B3LYP, and
wB97XD, Figure S1 in the Supporting Information) did not leadto a convincing improvement in accuracy. Nevertheless, wemay consider the level of agreement of simulated spectra and
experiment reasonably good given the TDDFT approximationsand the overall accuracy limits.[16] Experimental spectra may
also be affected by vibrational splitting of the electronic
bands[17] and by interaction with the solvent[18] not explicitly in-cluded in the present model.
Analysis of the main orbital contributions (Figure 3) indicatesthat both the 236 nm and 256 nm bands are dominated by
transitions located on the aromatic electronic p-system, witha participation of the ester group. Band positions and UV ab-
sorption of individual conformers are almost identical. On the
other hand, ECD spectra (Figure 2) differ profoundly, and only
conformers I and II provide patterns that are somewhat similarto the experimental data (a negative signal at 244 nm and
a positive one at 279 nm). The dissymmetry factor (g, ratio ofECD/absorption) of conformer II is too high (jg j&6 V 10@4
around 240 nm) compared with experiment (jg j&1 V 10@4),which is indicative of a conformer mixture that is roughly con-sistent with the relative conformer energies (Table 3).
2.3. Infrared Absorption and VCD
The computed and experimental IR and VCD spectra are com-pared in Figure 4. Assignment of the most intense IR andRaman bands is presented in Table 4. Most of the frequenciesobtained at the B3PW91 level are closer to experiment than
those obtained at the mPW2PLYP level, in spite of the lattermethod being more sophisticated[19] and computationally
more expensive. Typically, the B3PW91 computation took lessthan 3 days of CPU time, and the mPW2PLYP required 30–
145 days, according to computational options (numerical vs.analytical frequency calculation). However, the calculated fre-
quencies do not differ much, except for the ND stretching
mode. Furthermore, the differences between computed andexperimental frequencies are rather minor (typically within 0–
20 cm@1) and can be explained by intrinsic error of the compu-tational methods, both treating the correlation energy rather
incompletely, and by anharmonic interactions[20] not includedin the modeling.
Table 3. Calculated relative electronic (DE) and Gibbs (DG) energies [kcalmol@1] , and a2 and a4 DFT torsion angles for four conformers of the co-caine equatorial form.
DEDFT DEmPW2PLYP DGDFT a2 a4
I 0.0 0.0 0.0 102 @84II 0.6 0.7 0.9 107 @141III 2.5 2.2 4.5 @70 @87IV 2.6 2.5 2.4 @66 @147
Figure 2. The four major cocaine conformers (form E), with the intramolecu-lar hydrogen bond plotted by a dashed line, and comparison of the calculat-ed and experimental (in D2O) UV/Vis absorption and ECD spectra. Boltz-mann-average for ECD is based on the DFT electronic energies.
Figure 3. Dominant orbital contributions to the longest wavelength absorp-tion bands (B3PW91/6311 + + G**/CPCM calculation for conformer I).
ChemPhysChem 2017, 18, 2258 – 2265 www.chemphyschem.org T 2017 Wiley-VCH Verlag GmbH & Co. KGaA, Weinheim2260
Articles

Unlike for UV/Vis absorption, conformers III and IV provide
quite distinct IR absorption within the C=O stretching region(Figure 4, 1753 and 1795 cm@1, experimentally at 1714 cm@1).
This is due to the internal hydrogen bond (Figure 2); in con-
formers I and II, the amine hydrogen is bound to the carboxyloxygen (=O), whereas in conformers III and IV, the ester
oxygen (-O-) is involved. Minor differences are also apparentwithin 1330–1470 cm@1, confirming the low conformer ratios
for species III and IV. Overall, however, the simulation reprodu-ces the experimental absorption features quite well ; frequency
differences between the calculation and experiment can be ex-
plained by inaccuracy of the functional, continuum solventmodel, and by the anharmonic effects.[21]
Similar to the absorption, only conformer I and partially alsoII give reasonable VCD spectra compared with the experiment.
In particular, the strong negative carbonyl band (in experimentat 1712 cm@1) is not predicted for conformers III and IV. Simu-
lated spectra of conformers I and II do reproduce this andother observed VCD features, such as the positive experimen-
tal signals at 1394 and 1457 cm@1, and to some extent also the1321 and 1359 cm@1 bands. The magnitude of the experimen-tal dissymmetry factor (g) for the carbonyl band (1712 cm@1),
for example, is about 5 V 10@5, which is a value typical for or-ganic compounds. The theory predicts only a slightly smaller g&2 V 10@5, mostly due to the overestimated splitting of the C=
O stretching bands.
2.4. Raman Scattering and Raman Optical Activity
Calculated and experimental (D2O solution) Raman and ROAspectra are plotted in Figure 5. Conformers I–IV provide very
similar Raman spectra. The computation reproduces very wellthe experimental Raman intensities within 200–1830 cm@1. The
N@D stretching band (at ca. 2378 cm@1 experimentally, notshown) is difficult to separate from the solvent signal. Unlike
for IR absorption in which two bands corresponding to the C=
O stretching modes are visible (Figure 4), only one band is ap-parent in the Raman spectrum, experimentally/calculated at1716/1753 cm@1. The strong Raman scattering calculated at1649 cm@1 is due to aromatic ring vibration stretching
(Table 5). Within ca. 1100–1390 cm@1 the computed spectrummimics the experimental shape well, although a band-to-band
comparison is problematic because of the high density of vi-
brational states. The band assignment is easier below
Figure 4. Calculated IR and VCD spectra of the four lowest energy cocaineconformers (left), and the experiment (right).
Table 4. Calculated and experimental frequencies of cocaine hydrochloride and transition assignments.[a]
Calcd. Exp. (D2O) Calcd. Exp. (D2O)
B3PW91 mPW2PLYP Ram IR B3PW91 mPW2PLYP Ram2372 2489 2383 n(ND) 940 948 920 aliph. def.1753 1782 – n (CO), Phe 901 906 887 deloc.1733 1746 1716 1714 n (CO), Me 855 860 847 aliph. def.1649 1654 1604 n (C=C), Phe 795 795 812 aliph. def.1644 1636 1601 n (C=C), Phe 781 779 782 aliph. def.1521 1541 1493 n (C=C), d(CH) Phe 762 763 753 aliph. def.1514 1535 1485 d(CH),scissor 751 749 736 aliph. def.1489 1527 1493 d(CH),scissor 722 721 713 aliph. def.1484 1517 1451 d(CH),scissor 689 695 682 Phe def.1479 1509 1456 d(CH),scissor 626 632 619 Phe def.1471 1489 1443 d(CH),scissor 555 572 557 aliph. def.1407 1418 1390 1386 d(CH), n (C@C) 520 516 520 deloc.1386 1407 1366 d(CH), n (C@C) 484 486 487 deloc.1309 1323 1321 d(CH), n (C@C) 447 443 446 Phe oop def.1280 1293 1281 1277 n (C=C) Phe 418 427 421 deloc.1220 1236 1229 Me wagging, aliph. 394 403 397 deloc.1187 1203 1181 d(CH) 363 371 369 deloc.1148 1156 1122 aliph. def. 320 322 323 deloc.1081 1093 1066 aliph. def. 305 309 307 deloc.1049 1055 1028 Phe def. 244 246 244 Me wag1015 1018 1004 Phe def. 196 211 193 deloc.994 999 971 aliph. def.
[a] For conformer I, n—stretching, d—bending, oop—out of plane, in D2O.
ChemPhysChem 2017, 18, 2258 – 2265 www.chemphyschem.org T 2017 Wiley-VCH Verlag GmbH & Co. KGaA, Weinheim2261
Articles
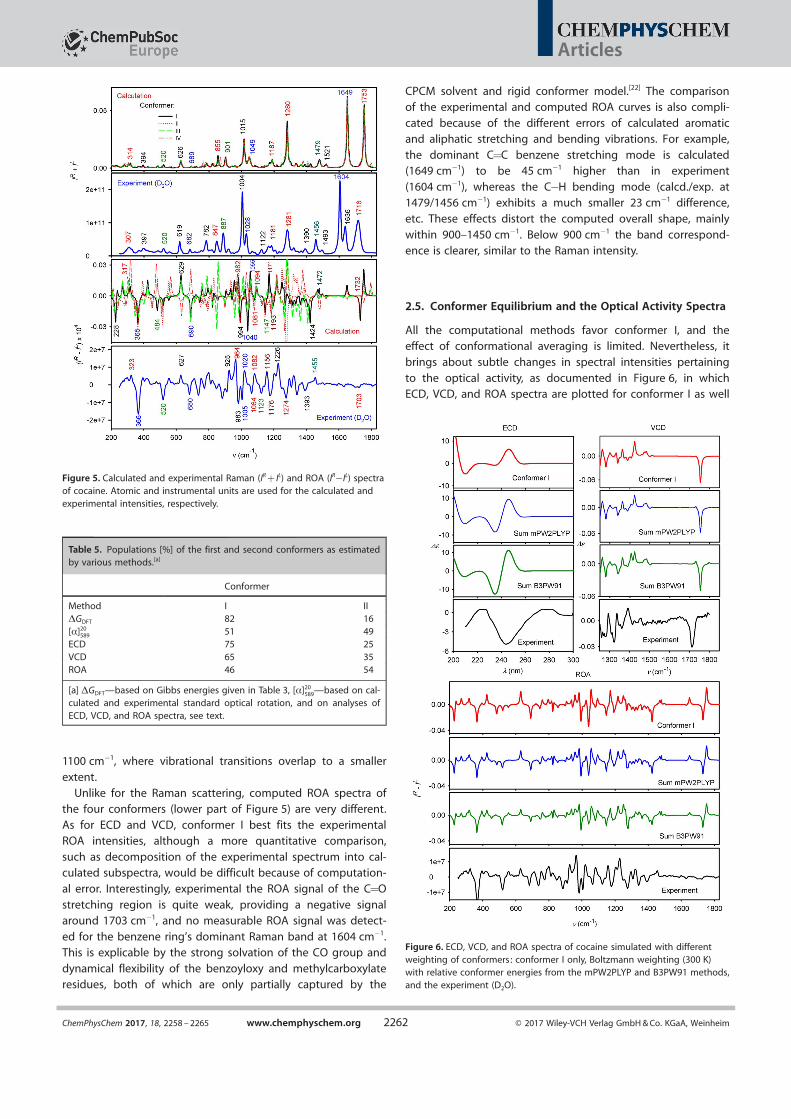
1100 cm@1, where vibrational transitions overlap to a smaller
extent.Unlike for the Raman scattering, computed ROA spectra of
the four conformers (lower part of Figure 5) are very different.
As for ECD and VCD, conformer I best fits the experimentalROA intensities, although a more quantitative comparison,
such as decomposition of the experimental spectrum into cal-culated subspectra, would be difficult because of computation-
al error. Interestingly, experimental the ROA signal of the C=O
stretching region is quite weak, providing a negative signalaround 1703 cm@1, and no measurable ROA signal was detect-
ed for the benzene ring’s dominant Raman band at 1604 [email protected] is explicable by the strong solvation of the CO group and
dynamical flexibility of the benzoyloxy and methylcarboxylateresidues, both of which are only partially captured by the
CPCM solvent and rigid conformer model.[22] The comparisonof the experimental and computed ROA curves is also compli-
cated because of the different errors of calculated aromaticand aliphatic stretching and bending vibrations. For example,
the dominant C=C benzene stretching mode is calculated(1649 cm@1) to be 45 cm@1 higher than in experiment
(1604 cm@1), whereas the C@H bending mode (calcd./exp. at1479/1456 cm@1) exhibits a much smaller 23 cm@1 difference,etc. These effects distort the computed overall shape, mainly
within 900–1450 cm@1. Below 900 cm@1 the band correspond-ence is clearer, similar to the Raman intensity.
2.5. Conformer Equilibrium and the Optical Activity Spectra
All the computational methods favor conformer I, and theeffect of conformational averaging is limited. Nevertheless, it
brings about subtle changes in spectral intensities pertaining
to the optical activity, as documented in Figure 6, in whichECD, VCD, and ROA spectra are plotted for conformer I as well
Figure 5. Calculated and experimental Raman (IR + IL) and ROA (IR@IL) spectraof cocaine. Atomic and instrumental units are used for the calculated andexperimental intensities, respectively.
Table 5. Populations [%] of the first and second conformers as estimatedby various methods.[a]
Conformer
Method I IIDGDFT 82 16[a]20
589 51 49ECD 75 25VCD 65 35ROA 46 54
[a] DGDFT—based on Gibbs energies given in Table 3, [a]20589—based on cal-
culated and experimental standard optical rotation, and on analyses ofECD, VCD, and ROA spectra, see text.
Figure 6. ECD, VCD, and ROA spectra of cocaine simulated with differentweighting of conformers: conformer I only, Boltzmann weighting (300 K)with relative conformer energies from the mPW2PLYP and B3PW91 methods,and the experiment (D2O).
ChemPhysChem 2017, 18, 2258 – 2265 www.chemphyschem.org T 2017 Wiley-VCH Verlag GmbH & Co. KGaA, Weinheim2262
Articles

as a Boltzmann average with the B3PW91m and PW2PLYP en-ergies. Perhaps surprisingly, the strongest effect of averaging is
encountered in the ECD spectrum in which the presence ofthe strong negative experimental signal at 244 nm is explicable
only by a conformer mixture. A much smaller effect of theaveraging takes place for VCD. ROA spectra are affected more
than VCD and less than ECD; for example, the averaging im-proves the intensity ratio of bands observed at 983 and
1005 cm@1. The two methods (mPW2PLYP and B3PW91) pro-
vide rather similar results.Populations of the first and second conformers as obtained
by various analyses are summarized in Table 5. Other conform-ers are not included because the data do not indicate theirpresence. The estimation from ECD spectra was based ona visual comparison; VCD and ROA spectra were decomposed
into conformer subspectra by the method of Lagrange multi-
pliers.[23] Prior to the decomposition, the frequency scale-factorwas determined as 0.98 by maximizing the similarity[24] be-
tween the calculated and theoretical curves (Figure S5).On one hand, one can read Table 5 as a manifestation of the
“unreliability” of different spectroscopic methods, becauseactual conformer ratios significantly vary. On the other hand,
they provide a solid and consistent basis for determination of
the most probable cocaine structure in solution. One has alsoto realize that the ECD and optical rotation[11] computations
are much less reliable than for the vibrational spectra. Givenalso the complexity of the ROA signal, we can conclude that
most probably the population of the first conformer prevailsslightly over the second.
2.6. The Effect of Deuteration
In Figure 7, experimental and computed Raman and ROA spec-
tra of cocaine in H2O and D2O solutions are compared. Appa-
rently, replacing just one cocaine hydrogen atom by deuteriumhas almost no effect on the Raman spectrum. Much more ex-
tensive changes appear in ROA. Most interestingly, a strong“++/@” couplet at 982/994 cm@1 is formed in D2O compared
with the natural isotopic case. The vibrational normal modedisplacements (Figure 7) reveal that these bands are caused by
ND/CH vibrations localized at the bicyclic part of the molecule.The NH!ND substitution changes the coupling strength be-
tween the N@H(D) and CH bending modes, and stronger cou-pling in the deuterated species translates to a stronger ROA
signal. It is generally accepted that ROA spectroscopy is more
sensitive to molecular structure than unpolarized Raman spec-troscopy; nevertheless, this is a rather rare example of an iso-
topic effect so much amplified by a vibrational resonance (cou-pling of vibrational modes) in the ROA spectrum.
3. Conclusions
We studied geometry of cocaine hydrochloride using ECD,VCD, and ROA spectroscopies, complementing the more usual
nonpolarized IR absorption, Raman, and UV/Vis absorptionmethods. The results unambiguously showed that the solution
structure was different from the crystal geometry. This conclu-sion could be made because of a systematic conformer search,
ab initio estimation of relative conformer energies, and thecomparison of experimental and calculated spectra. All spec-
troscopic methods indicate a relative rigidity of the cocaine
cation in solution, which is mostly present in two conformersdiffering in rotation of the benzyl residue. The predicted con-
formational behavior is consistent with previous cocaine com-plexation studies, in which geometries of the benzyl and
methyl residues adapt to the ligand. The chiroptical methodsproved to be excellent tools for monitoring the conformation,
particularly when coupled with the quantum-chemical spectral
simulations. The ROA spectrum provided a larger number ofconformer-dependent features compared with ECD and VCD.
The TDDFT and DFT simulations agreed reasonably well withexperiment, although further improvement of computational
accuracy is desirable in the future. This will be especially im-portant for a more detailed tracking of cocaine and other bio-
logically active substances, for example during binding to the
receptor.
Experimental Section
Spectroscopy
Cocaine hydrochloride (+99.5 %, pharmaceutical grade) was pur-chased from Dr. Kulich Pharma (Czech Republic) ; the purity wasverified by LC-MS and NMR spectra obtained and analyzed in theForensic Laboratory of Biologically Active Substances, University ofChemistry and Technology, Prague. Specific optical rotation inmethanol was measured as [a]20
589 [email protected]. For spectra acquisitionthe compound was dissolved in double-distilled water or deuteri-um oxide (D2O, 99.9 % D from ISOSAR GmbH, Germany) to concen-trations of 100 g L@1 (VCD, ROA, IR and Raman) and 0.11 g L@1
(ECD).
VCD and IR absorption spectra in the 1800–1250 cm@1 region weremeasured with a Fourier transform IR (FTIR) IFS 66/S spectrometerequipped with a PMA 37 VCD/IRRAS module (both from Bruker,
Figure 7. Effect of the isotopic substitution: simulated (B3PW91/6-311 + + G**/CPCM) and experimental Raman and ROA spectra of cocaine inH2O and D2O, and two examples of modes in D2O, sensitive to the isotopicsubstitution.
ChemPhysChem 2017, 18, 2258 – 2265 www.chemphyschem.org T 2017 Wiley-VCH Verlag GmbH & Co. KGaA, Weinheim2263
Articles

Germany).[13e] The sample was placed in an A145 demountable cell(Bruker, Germany) composed of CaF2 windows separated bya 23 mm Teflon spacer. The spectra were recorded at 4 cm@1 resolu-tion and obtained as average of 7–9 blocks of 2260 scans, eachblock taking 20 minutes to accumulate. A baseline of pure solventmeasured under the same experimental conditions was subtracted.
ECD and UV absorption were measured in a Suprasil quartz cuvette(10 mm optical path length, Hellma, Germany) with a J-815 spectro-polarimeter (Jasco, Japan), within 195–300 nm, at 100 nm min@1
scanning speed, 1 s response time, 0.1 nm resolution, and 1 nmbandwidth. Eight accumulations were averaged, and solvent base-line was subtracted. VCD and ECD spectra are plotted as molar cir-cular dichroism, De IR and UV absorption is given as molar absorp-tion coefficient, e, all in L mol@1 cm@1.
Prior to the measurement of ROA and Raman scattering, fluores-cence from residual impurities was suppressed by photobleachingin the laser beam for 4 hours. The spectra were acquired simulta-neously with a ChiralRaman-2X spectrometer (BioTools, Inc. , USA)using a 532 nm laser (Opus 2W/MPC6000, Laser Quantum, UK),7 cm@1 resolution, fused-silica sample cell (BioTools Inc. , USA), and1.2 s illumination period. A homemade Peltier cell holder set to15 8C, laser power at the sample was 350 mW, and the accumula-tion time was about 24 hours. A baseline correction was doneusing a procedure described elsewhere.[25] For presentation of thespectra instrumental intensity units are used.
Calculations
The axial and equatorial conformations of the N-methyl group(models A and E in Figure 1) were used to investigate the proton-ated cocaine (methyl (1R,2R,3S,5S)-3-(benzoyloxy)-8-methyl-8-azabi-cyclo[3.2.1]octane-2-carboxylate) ion. The boat conformation of thesix-membered ring was not considered because its energy isbigger by more than 6 kcal mol@1 than for the chair.[1] In addition,the a1, a2, a4, and a5 torsion angles (cf. Figure 1) were systematical-ly varied to generate 36 initial geometry estimates for each model.
The conformer search was conducted by using the Gaussian[26] pro-gram at the HF/6-31G** approximation level including conductor-like continuum solvent model[27] (further referred to as CPCM)[28]
with default parameters for water. Selected lowest energy con-formers (<4 kcal mol@1) were reoptimized by using the B3PW91[29]/6-311 + + G**/CPCM method. Previously, the B3PW91 functionalprovided excellent results for ROA simulations.[30] For control com-putation, the empirical dispersion correction of Grimme[31] wasused (labeled by the “-D” suffix, for example, HF-D). Vibrational fre-quencies of the lowest energy conformer were also computed atthe mPW2PLYP[19]/6-311 + + G**/CPCM level.
For optimized geometries, energy second derivatives and VCD andROA polarizability tensors[10, 32] were calculated by the Gaussian.Back-scattered circularly polarized (SCP) Raman and ROA spectrawere obtained as[33]
I wð Þ ¼Pi Ai wi 1@ exp @wi= kTð Þð Þ½ A 4 w@ wið Þ2=D2 þ 1½ Af g@1, whereAi are calculated intensities for each mode i, wi is vibrational fre-quency, k is the Boltzmann constant, and T = 15 8C is temperature.The full width at half maximum was set to D= 10 cm@1. IR absorp-tion and VCD spectra are presented using the same Lorentzianbands (D= 10 cm@1).
Using time-dependent density functional theory (TDDFT),[34] elec-tronic absorption and circular dichroism intensities were calculatedfor 50 excited electronic states at the same level as for the vibra-
tions, and the spectra were generated by using Gaussian profiles10 nm wide (FWHM).
Acknowledgements
This work was supported by a grant from the Ministry of the Inte-rior (VI20172020056), Operational Program Prague—Competitive-
ness (CZ2.16/3.1.00/24503 and/21537), National Program of Sus-tainability I (NPU MSMT: LO1601-43760/2015), Czech GrantAgency (16–05935S) and Ministry of Education (20-SVV/2016, A1_
FCHI_2017_003, A2_FCHI 2017_026 and LTC17012).
Conflict of interest
The authors declare no conflict of interest.
Keywords: analytical methods · circular dichroism · densityfunctional calculations · Raman spectroscopy · structure
elucidation
[1] H. O. Villar, G. H. Loew, J. Comput. Chem. 1990, 11, 1111 – 1118.[2] E. Hardegger, H. Ott, Helv. Chim. Acta 1955, 38, 312 – 320.[3] I. F. Carroll, L. C. Coleman, A. H. Lewin, J. Org. Chem. 1982, 47, 13 – 19.[4] R. J. Hrynchuk, R. J. Barton, B. E. Robertson, Can. J. Chem. 1983, 61,
481 – 487.[5] E. J. Gabe, W. H. Barnes, Acta Crystallogr. 1963, 16, 796 – 801.[6] G. Valensin, E. Gaggelli, N. Marchettini, B. I. Comparini, Biophys. Chem.
1985, 22, 77 – 81.[7] R. Glaser, G. Peng, J. Qin, A. S. Perlin, J. Org. Chem. 1988, 53, 2172 –
2180.[8] a) E. M. A. Ali, H. G. M. Edwards, J. Raman Spectrosc. 2014, 45, 253 – 258;
b) A. D. Burnett, H. G. Edwards, M. D. Hargreaves, T. Munshi, K. Page,Drug Testing Anal. 2011, 3, 539 – 543; c) N. V. S. Rodrigues, E. M. Cardoso,M. V. O. Andrade, C. L. Donnici, M. M. Sena, J. Braz. Chem. Soc. 2013, 24,507 – 517.
[9] A. P. Gamot, G. Vergoten, G. Fleury, Talanta 1985, 32, 363 – 372.[10] L. Nafie, Vibrational optical activity: Principles and applications, Wiley,
Chichester, 2011.[11] D. M. McCann, P. J. Stephens, J. Org. Chem. 2006, 71, 6074 – 6098.[12] J. M. Bowen, N. Purdie, Anal. Chem. 1981, 53, 2237 – 2239.[13] a) N. Berova, P. L. Polavarapu, K. Nakanishi, R. W. Woody, Applications in
Stereochemical Analysis of Synthetic Compounds, Natural Products, andBiomolecules, Vol. 2, Wiley, Hoboken, 2012 ; b) V. Kr#l, S. Pataridis, V. Set-nicka, K. Z#ruba, M. Urbanov#, K. Volka, Tetrahedron 2005, 61, 5499 –5506; c) V. Setnicka, J. Hlav#cek, M. Urbanov#, J. Pept. Sci. 2009, 15,533 – 539; d) V. Setnicka, M. Urbanov#, K. Volka, S. Nampally, J. M. Lehn,Chemistry 2006, 12, 8735 – 8743; e) M. Urbanov#, V. Setnicka, K. Volka,Chirality 2000, 12, 199 – 203; f) M. Tatarkovic, Z. Fisar, J. Raboch, R. Jir#k,V. Setnicka, Chirality 2012, 24, 951 – 955.
[14] a) X. Zhu, T. J. Dickerson, C. J. Rogers, G. F. Kaufmann, J. M. Mee, K. M.McKenzie, K. D. Janda, I. A. Wilson, Structure 2006, 14, 205 – 216; b) S. B.Hansen, P. Taylor, J. Mol. Biol. 2007, 369, 895 – 901.
[15] E. Pozharski, A. Moulin, A. Hewagama, A. B. Shanafeli, G. A. Petsko, D.Ringe, J. Mol. Biol. 2005, 349, 570 – 582.
[16] A. D. Laurent, D. Jacquemin, Int. J. Quantum Chem. 2013, 113, 2019 –2039.
[17] F. Santoro, R. Improta, A. Lami, J. Bloino, V. Barone, J. Chem. Phys. 2007,126, 084509.
[18] J. Sebek, Z. Kej&k, P. Bour, J. Phys. Chem. A 2006, 110, 4702 – 4711.[19] T. Schwabe, S. Grimme, Phys. Chem. Chem. Phys. 2006, 8, 4398 – 4401.[20] J. Hudecov#, V. Profant, P. Novotn#, V. Baumruk, M. Urbanov#, P. Bour, J.
Chem. Theory Comput. 2013, 9, 3096 – 3108.[21] a) G. Rauhut, P. Pulay, J. Phys. Chem. 1995, 99, 3093 – 3100; b) P. Bour, D.
Michal&k, J. Kapit#n, J. Chem. Phys. 2005, 122, 144501; c) J. Kubelka, R.
ChemPhysChem 2017, 18, 2258 – 2265 www.chemphyschem.org T 2017 Wiley-VCH Verlag GmbH & Co. KGaA, Weinheim2264
Articles

Huang, T. A. Keiderling, J. Phys. Chem. B 2005, 109, 8231 – 8243; d) P. Da-necek, J. Kapit#n, V. Baumruk, L. Bedn#rov#, V. Kopecky, Jr. , P. Bour, J.Chem. Phys. 2007, 126, 224513.
[22] a) J. Kapit#n, V. Baumruk, V. Kopecky, Jr. , R. Pohl, P. Bour, J. Am. Chem.Soc. 2006, 128, 13451 – 13462; b) J. Kapit#n, V. Baumruk, V. Kopecky, Jr. ,P. Bour, J. Phys. Chem. A 2006, 110, 4689 – 4696.
[23] J. Sugar, P. Bour, J. Raman Spectrosc. 2016, 47, 1298 – 1303.[24] C. L. Covington, P. L. Polavarapu, J. Phys. Chem. A 2013, 117, 3377 –
3386.[25] a) M. Tatarkovic, A. Synytsya, L. Stov&ckov#, B. Bunganic, M. Miskovicov#,
L. Petruzelka, V. Setnicka, Anal. Bioanal. Chem. 2014, 407, 1335 – 1342;b) M. Clupek, P. Matejka, K. Volka, J. Raman Spectrosc. 2007, 38, 1174 –1179.
[26] Gaussian 09, Revision D01, M. J. Frisch, G. W. Trucks, H. B. Schlegel, G. E.Scuseria, M. A. Robb, J. R. Cheeseman, G. Scalmani, V. Barone, B. Men-nucci, G. A. Petersson, H. Nakatsuji, M. Caricato, X. Li, H. P. Hratchian,A. F. Izmaylov, J. Bloino, G. Zheng, J. L. Sonnenberg, M. Hada, M. Ehara,K. Toyota, R. Fukuda, J. Hasegawa, M. Ishida, T. Nakajima, Y. Honda, O.Kitao, H. Nakai, T. Vreven, J. A. Montgomery, J. E. Peralta, F. Ogliaro, M.Bearpark, J. J. Heyd, E. Brothers, K. N. Kudin, V. N. Staroverov, R. Kobaya-shi, J. Normand, K. Raghavachari, A. Rendell, J. C. Burant, S. S. Iyengar, J.Tomasi, M. Cossi, N. Rega, J. M. Millam, M. Klene, J. E. Knox, J. B. Cross, V.Bakken, C. Adamo, J. Jaramillo, R. Gomperts, R. E. Stratmann, O. Yazyev,
A. J. Austin, R. Cammi, C. Pomelli, J. W. Ochterski, R. L. Martin, K. Moro-kuma, V. G. Zakrzewski, G. A. Voth, P. Salvador, J. J. Dannenberg, S. Dap-prich, A. D. Daniels, O. Farkas, J. B. Foresman, J. V. Ortiz, J. Cioslowski,D. J. Fox, Gaussian, Inc. , Wallingford CT, USA, 2009.
[27] A. Klamt, in The Encyclopedia of Computational Chemistry, Vol. 1 (Eds. :P. R. Schleyer, N. L. Allinger, T. Clark, J. Gasteiger, P. A. Kollman, H. F.Schaefer III, P. R. Schreiner), Wiley, Chichester, 1998, pp. 604 – 615.
[28] M. Cossi, V. Barone, J. Chem. Phys. 1998, 109, 6246 – 6254.[29] J. P. Perdew, K. Burke, Y. Wang, Phys. Rev. B 1996, 54, 16533 – 16539.[30] S. Yamamoto, H. Watarai, P. Bour, ChemPhysChem 2011, 12, 1509 – 1518.[31] S. Grimme, J. Comput. Chem. 2006, 27, 1787 – 1799.[32] L. D. Barron, Molecular Light Scattering and Optical Activity, Cambridge
University Press, Cambridge, 2004.[33] K. H. Illinger, D. E. Freeman, J. Mol. Spectrosc. 1962, 9, 191 – 203.[34] F. Furche, R. Ahlrichs, C. Wachsmann, E. Weber, A. Sobanski, F. Vçgtle, S.
Grimme, J. Am. Chem. Soc. 2000, 122, 1717 – 1724.
Manuscript received: April 28, 2017
Revised manuscript received: May 31, 2017Accepted manuscript online: June 8, 2017Version of record online: July 7, 2017
ChemPhysChem 2017, 18, 2258 – 2265 www.chemphyschem.org T 2017 Wiley-VCH Verlag GmbH & Co. KGaA, Weinheim2265
Articles