coccidioidomycosis in workers at an archeologic site ... · coccidioidomycosis in workers at an...
TRANSCRIPT

November 16, 2001 / Vol. 50 / No. 45
U.S. DEPARTMENT OF HEALTH & HUMAN SERVICES
Coccidioidomycosis in Workers at an Archeologic Site —Dinosaur National Monument, Utah, June–July 2001
Coccidioidomycosis is a fungal infection caused by inhalation of airborne Coccidio-ides immitis spores that are present in the arid soil of the southwestern United States,California, and parts of Central and South America. Infection with C. immitis previouslyhas not been diagnosed in patients outside these areas, except in travelers returningfrom areas where the disease is endemic (1 ). This report describes an outbreak ofcoccidioidomycosis in workers at an archeologic site in northeastern Utah during June–July, 2001, and represents the first identification of coccidioidomycosis in northern Utah.Health-care providers should consider coccidioidomycosis in the differential diagnosisfor patients with compatible illness who reside in or recently have traveled to this area.Interventions to minimize soil disturbance and dust inhalation can reduce the risk forcoccidioidomycosis.
Dinosaur National Monument (DNM) encompasses 320 square miles in northeasternUtah and northwestern Colorado; 397,800 persons visited DNM in 2000 (Figure 1). OnJune 18, 2001, under the direction of National Park Service (NPS) archeologists, sixstudent volunteers and two leaders began work at an archeologic site in DNM. Workincluded laying stone steps, building a retaining wall, and sifting dirt for artifacts. Peakdust exposure occurred on June 19, the day most sifting occurred. Workers did not wearprotective facemasks. During June 29–July 3, all eight team members and two NPSarcheologists who had worked at the site sought medical care at a local hospital emer-gency department for respiratory and systemic symptoms. All 10 persons had diffusepulmonary infiltrates on chest radiographs; eight were hospitalized with pneumonia ofunknown etiology. Pending investigation, NPS closed the work site to all visitors and staff,and the TriCounty Health Department alerted the public. On July 2, the TriCounty HealthDepartment, the Utah Department of Health, and CDC initiated an investigation to iden-tify the risk factors, cause, and extent of the outbreak.
During July 2–4, a total of 18 persons (the eight team members and 10 archeologists)with potential exposure to dust at the work site in June were interviewed using a stan-dardized questionnaire to determine symptoms and previous activities. Hospital recordswere reviewed to ascertain clinical information. A case was defined as an illness withonset of at least two selected symptoms (i.e., self-reported fever, difficulty breathing, andcough) after June 18 in a person working at DNM.
Illness in 10 persons, including all eight team members and two NPS archeologists,met the case definition. Median age was 17 years (range: 16–29 years). Illness onsetoccurred during June 28–July 1. The most common symptoms included difficulty
1005 Coccidioidomycosis in Workers at anArcheologic Site
1008 Update: Investigation of Bioterrorism-RelatedAnthrax
1011 n-Hexane–Related Peripheral NeuropathyAmong Automotive Technicians
1013 Weekly Update: West Nile Virus1014 Update: Interim Recommendations for
Antimicrobial Prophylaxis for Children andBreastfeeding Mothers and Treatment ofChildren with Anthrax
1016 Notices to Readers

1006 MMWR November 16, 2001
Coccidioidomycosis — Continued
breathing (10), fever (10), cough (nine), fatigue (eight), shortness of breath (seven),myalgia (six), and generalized skin rash (six). All 10 persons present at the work site onJune 19 had illness that met the case definition, compared with none of the eight who didnot work that day (Fisher exact p-value=0.00002). One ill person had visited the work siteonly on June 19 and had illness onset on June 29.
Results of blood cultures from the hospitalized persons were negative for bacterialpathogens. Initial serologic tests were negative for antibodies to Francisella tularensis,Yersinia pestis, Mycoplasma species, Histoplasma capsulatum, and C. immitis. On fur-ther analysis, using serum specimens concentrated 3–5 fold in an assay that detects IgMantibodies (immunodiffusion tube precipitin), nine of the 10 acute serum specimens frompatients contained IgM antibodies to C. immitis, confirming the diagnosis of acute coccid-ioidomycosis (2 ). All hospitalized patients were treated with fluconazole. The averagelength of hospital stay was 1.5 days.
Because approximately 60% of infections with C. immitis are asymptomatic, aserosurvey of park employees was conducted during August 15–17 to identify otherinfected persons and to guide prevention and control measures (1,3 ). Of the 40 parkemployees participating in the serosurvey, three (7.5%) reported “flu-like illness” sinceJune. None of the 40 had detectable IgM or IgG antibodies to C. immitis. These resultssuggest that infection with C. immitis during the preceding 12 weeks was unlikely (2,4 ).
Investigation of the work site on July 3 revealed a desert environment with the groundcovered with bedonite, a fine, alkaline soil that can provide a conducive environment forC. immitis spores. NPS is working with the U.S. Geological Survey to conduct mycologicstudies of the soil (M. Bultman, personal communication, October 2001).
FIGURE 1. Geographic distribution of Coccidioides immitis and location of coccidioidomy-cosis outbreak — Utah, 2001
Source: U.S. Geological Survey.
Areas Where Disease isKnown to be Endemic
2001 Outbreak
X

Vol. 50 / No. 45 MMWR 1007
Coccidioidomycosis — Continued
On August 24, the state and local health departments jointly recommended that em-ployees minimize soil disturbance and dust inhalation (e.g., watering down the soil andwearing National Institute for Occupational Safety and Health [NIOSH]-approved N95respirators) at the work site to reduce their risk for C. immitis infection. During Septem-ber 24–27, four NPS employees completed work on the retaining wall and steps. Subse-quently, one developed respiratory illness consistent with coccidioidomycosis and labo-ratory evidence of acute infection (IgM and rising titer of IgG to C. immitis).
The site reopened on September 28. NPS guidelines advise DNM visitors to stay onmaintained trails to avoid raising dust or stepping on native soil. Visitors’ risk for infectionwith C. immitis should be minimal because their exposure to inhaled dust is substantiallylower than that experienced by the persons in this outbreak. However, additional mea-sures are being considered to minimize risk for visitors, including warnings to avoid thesite when wind conditions are conducive to dust exposure. Surveillance is ongoing atarea hospitals.Reported by: D Mardo, RA Christensen, N Nielson, MD, S Hutt, MHSA, Ashley Valley MedicalCenter; R Hyun, MD; J Shaffer, MA, TriCounty Health Dept, Vernal; AV Gundlapalli, MD, Univ ofUtah School of Medicine, Salt Lake City; C Barton, G Dowdle, MSPH, S Mottice, PhD, C Brokopp,DrPh, R Rolfs, MD, State Epidemiologist, Utah Dept of Health. D Panebaker, National Park Svc,US Dept of the Interior. Div of Vector-borne Infectious Diseases; Mycotic Diseases Br, Div ofBacterial and Mycotic Diseases, National Center for Infectious Diseases; Epidemiology Pro-gram Office; and EIS officers, CDC.
Editorial Note: DNM is located approximately 200 miles north of the area of Utah whereC. immitis is endemic. Soil disturbances can aerosolize C. immitis spores (arthroconidia)and result in coccidioidomycosis outbreaks (5 ). Other ground-disturbing activities, suchas construction or archeology digs, may increase the risk for infection (3,6 ). A similarpoint-source outbreak of coccidioidomycosis occurred in 1970 among archeologystudents in an area of northern California where C. immitis was not known to be endemic.In both of these outbreaks, a high attack rate of symptomatic infection was reported (7 ).
Symptoms of acute coccidioidomycosis include fever, headache, rash, muscle aches,dry cough, weight loss, and malaise. Most infections are asymptomatic or self-limitedand resolve without antimicrobial treatment in patients with healthy immune systems. Inrare instances, severe lung disease or disseminated infection can develop in patients;susceptibility is higher in immunocompromised persons, pregnant women, and personsof African or Asian descent (8 ).
Because infection with C. immitis results in long-term immunity, the coccidioidin orspherulin skin test, which detects T-cell mediated delayed-type hypersensitivity toC. immitis, is the best method to screen for past infection (3 ). However, the coccidioidinskin test is not available in the United States. Therefore, a serosurvey was used to assessfor subclinical cases of infection in this outbreak. In previous studies of asymptomaticpersons who had positive skin tests, 7% had positive serologies; the time of exposure inthose persons was unknown (4 ). The sensitivity of the serologic test is low for remotepast infection and unknown for recent asymptomatic infection (4 ). Therefore, this inves-tigation was unable to establish the prevalence of previous infection among tested NPSemployees.
In settings where coccidioidomycosis outbreaks have occurred, measures to mini-mize soil disturbance and dust inhalation reduce the risk for inhalation of C. immitisspores (3,6 ). The most recent case indicates an ongoing risk for infection at the siteassociated with this outbreak and the importance of adherence to recommendations for
1008 MMWR November 16, 2001
Coccidioidomycosis — Continued
respiratory protection (e.g., NIOSH-approved N95 respirators that are properly fittedand consistently worn) when dust exposure is unavoidable.
The outbreak in this location indicates that areas where C. immitis is endemic mayextend farther north than previously documented. Surveillance should be continued inthese areas. In addition, health-care providers should be alert for coccidioidomycosiscases in persons who reside in or have traveled to these areas and who may have beenexposed to dust from disturbed soil.References1. CDC. Coccidioidomycosis in travelers returning from Mexico—Pennsylvania, 2000. MMWR
2000;49:1004–6.2. Kaufman L, Kovacs JA, Reiss E. Clinical immunomycology. In: Rose NR, Folds JD, DeMacario
EC, et al, eds. Manual of clinical laboratory immunology. Washington, DC: American Soci-ety for Microbiology, 1997:585–604.
3. Galgiani J. Coccidioides immitis. In: Mandell GL, Bennett JE, Dolin R, eds. Principles andpractice of infectious diseases. Vol 2. Philadelphia, Pennsylvania: Churchill Livingstone,2000:2746–57.
4. Pappagianis D, Zimmer B. Serology of coccidioidomycosis. Clin Microbiol Rev 1990;3:247–68.5. CDC. Coccidioidomycosis following the Northridge earthquake—California, 1994. MMWR
1994;43:194–5.6. Fisher FS, Bultman MW, Pappagianis D. Operational guidelines for geological fieldwork in
areas endemic for coccidioidomycosis (Valley fever) [open-file report 00-348]. Reston,Virginia: US Geological Survey, 2000. Available at <http://geopubs.wr.usgs.gov/open-file/of00-348/of00-348.pdf>. Accessed October 2001.
7. Werner SB, Pappagianis D, Heindl I, Mickel A. An epidemic of coccidioidomycosis amongarchaeology students in northern California. N Engl J Med 1972;286:507–12.
8. Rosenstein NE, Emery KW, Werner SB, et al. Risk factors for severe pulmonary and dissemi-nated coccidioidomycosis: Kern County, California, 1995–1996. Clin Infect Dis 2001;32:708–15.
Update: Investigation of Bioterrorism-Related Anthrax, 2001
This report updates the investigation of bioterrorism-related anthrax and the provi-sion of antimicrobial prophylaxis to exposed persons and highlights CDC assistance toother countries investigating cases of bioterrorism-related anthrax. Since November 7,2001, CDC and state and local public health agencies have identified no new cases ofbioterrorism-related anthrax. As of November 14, a total of 22 cases of anthrax has metthe CDC case definition (1 ); 10 were confirmed inhalational anthrax, and 12 (sevenconfirmed and five suspected) were cutaneous anthrax. Investigation of a case of inhala-tional anthrax in a hospital stock room worker aged 61 years in New York City (NYC)found no evidence of anthrax contamination at the work site or home; the source ofexposure is unknown. Environmental clean-up of contaminated facilities continues, andsurveillance for new cases of bioterrorism-related anthrax is ongoing in Delaware (DE),District of Columbia (DC), Florida (FL), Maryland (MD), New Jersey (NJ), NYC, Pennsyl-vania (PA), Virginia (VA), and other states.
Use of Antimicrobial Prophylaxis
A 60-day course of antibiotics to prevent inhalational anthrax has been recommendedfor persons potentially exposed to Bacillus anthracis aerosols in FL, NJ, NYC, VA,and DC. These recommendations are for persons at risk for inhalational anthrax by1) the presence of an inhalational case at a facility (e.g., media company in FL),

Vol. 50 / No. 45 MMWR 1009
Update: Investigation of Bioterrorism-Related Anthrax — Continued
2) environmental specimens positive for B. anthracis in facilities along the path of acontaminated letter in which aerosolization might have occurred (e.g., postal facilities inNYC), and 3) exposure to an air space known to be contaminated with aerosolizedB. anthracis from an opened letter (e.g., Senate office building in DC). These personsshould receive a full 60-day course of antimicrobial prophylaxis. Specific recommenda-tions by site include:
• Boca Raton, FL—prophylaxis is recommended for employees and visitors whospent >1 hour during August 1–October 6 in the American Media, Inc., building.
• New York City, NY—prophylaxis is recommended for all employees who workedduring October 9–26 on the second and third floors of the south section of theMorgan Central Postal Facility in Manhattan.
• Hamilton Township, NJ—prophylaxis is recommended for all employees andbusiness visitors (i.e., temporary postal workers, vendors, contractors, and any-one in nonpublic work sites) who were in the U.S. Postal Service Route 130Processing and Distribution Center during September 18–October 18.
• Washington, DC (Capitol Hill)—prophylaxis is recommended for persons whowere on the fifth and sixth floors of the southeast wing of the Senate Hart Buildingon October 15, from 9 a.m. to 7 p.m.
• Washington, DC—prophylaxis is recommended for all employees and businessvisitors to the nonpublic mail room of the U.S. Postal Service Processing andDistribution Center at 900 Brentwood Road during October 12–21.
• Sterling, VA—prophylaxis is recommended for all mail room employees andbusiness visitors who were at the Department of State Annex 32 mail roomfacility during October 12–22.
In addition, a 60-day course of antimicrobial prophylaxis is recommended for otherworkers with specified risks for inhalational anthrax. In some areas, local health authori-ties facilitated access to a 60-day course of antimicrobial prophylaxis for persons whohandled mail in facilities from which B. anthracis was isolated but did not have expo-sures for which antimicrobial prophylaxis is recommended (2 ). These persons maychoose or may be directed by local health authorities to discontinue antimicrobial pro-phylaxis before completing a 60-day course.
CDC Assistance to Other Countries
CDC has assisted authorities in other countries investigating cases ofbioterrorism-related anthrax. During October 12–November 13, CDC received 111 re-quests from 66 countries. Of these, 47 (42%) requests were laboratory related; 43 (39%)were general requests for bioterrorism information; 13 (12%) were for environmental oroccupational health guidelines; and eight (7%) were about developing bioterrorism pre-paredness plans. The largest proportion of requests were from Central and South America(26%). Of the 66 countries, 15 (23%) received laboratory assistance, including testing orarrangements for testing of suspected isolates at a CDC-supported laboratory or a refer-ence laboratory in another country. Forty-two (64%) countries received telephone ore-mail consultation regarding specific tests for suspected B. anthracis isolates. CDC hasconfirmed two isolates from outside the United States as B. anthracis. These isolateswere recovered from the outer surface of letters or packages sent in State Departmentpouches to the U.S. Embassy in Peru. These items were processed at the U.S. StateDepartment mail sorting facility where a case of inhalational anthrax had occurred (1 ).No cases of bioterrorism-related anthrax have been confirmed in U.S. Embassy

1010 MMWR November 16, 2001
employees or in persons from other countries. Requests for information regardingbioterrorism-related issues outside the United States should be directed to the Interna-tional Team of CDC’s Emergency Operations Center (telephone, [770] 488-7100, e-mail,[email protected]).Reported by: J Malecki, MD, Palm Beach County Health Dept, West Palm Beach; S Wiersma,MD, State Epidemiologist, Florida Dept of Health. New York City Dept of Health. E Bresnitz, MD,State Epidemiologist, G DiFerdinando, MD, New Jersey Dept of Health and Senior Svcs.P Lurie, MD, K Nalluswami, MD, Pennsylvania Dept of Health. L Hathcock, PhD, State Epidemi-ologist, Delaware Div of Public Health. L Siegel, MD, S Adams, I Walks, MD, J Davies-Coles,PhD, M Richardson, MD, District of Columbia Dept of Health. R Brechner, MD, State Epidemi-ologist, Maryland Dept of Health and Hygiene. R Stroube, MD, State Epidemiologist, VirginiaDept of Health. J Burans, US Naval Research Center Detachment, Lima, Peru. US Dept ofDefense. EIS officers, CDC.
Editorial Note: Since the previous report, all patients with bioterrorism-related anthraxwho were hospitalized have been discharged and continue to recover; no new caseshave been reported. The source of these bioterrorist attacks has not been identified, andadditional cases might occur. Public health authorities, health-care providers, andlaboratorians should remain vigilant for cases of anthrax.
Antimicrobial prophylaxis is indicated to prevent inhalational anthrax after a con-firmed or suspected aerosol exposure. Persons recommended to receive prophylaxisshould complete the 60-day regimen. Public health programs should work with health-care providers and patients to promote completion of antimicrobial prophylaxis and tomonitor the occurrence of adverse events (1 ).
CDC continues to respond to inquiries about anthrax and bioterrorism. The CDC Pub-lic Response Hotline was established to provide the public with information aboutanthrax and other biologic and chemical agents. During November 1–12, CDC receivedapproximately 4,400 calls through the hotline and to the Emergency Operations Center.The hotline is available in English (888-246-2675) and Spanish (888-246-2857). CDC alsoreceives requests for information by e-mail through the Health Alert Network(<[email protected]>), MMWR (<http://www.cdc/gov/mmwr/contact.html>), and otherpublic health communications systems.
Additional information about anthrax is available at <http://www.bt.cdc.gov>. A com-pendium of MMWR reports and recommendations related to anthrax and bioterrorismis available at <http://www.cdc.gov/mmwr>.References1. CDC. Update: Investigation of anthrax associated with intentional exposure and interim
public health guidelines, October 2001. MMWR 2001;50:889–93.2. CDC. Update: Investigation of bioterrorism-related anthrax and adverse events from anti-
microbial prophylaxis. MMWR 2001;50:973–6.
Update: Investigation of Bioterrorism-Related Anthrax — Continued

Vol. 50 / No. 45 MMWR 1011
n-Hexane–Related Peripheral Neuropathy Among Automotive Technicians —California, 1999–2000
Solvents, glues, spray paints, coatings, silicones, and other products contain normal(n-) hexane, a petroleum distillate and simple aliphatic hydrocarbon. n-Hexane is anisomer of hexane and was identified as a peripheral neurotoxin in 1964 (1 ). Since then,many cases of n-hexane–related neurotoxicity have occurred in printing plants, sandalshops, and furniture factories in Asia, Europe, and the United States (2 ). This reportdescribes an investigation of n-hexane–associated peripheral neuropathy in an automo-tive technician, an occupation in which this condition has not been reported, and summa-rizes the results of two other case investigations in the automotive repair industry. Thefindings suggest that solvent manufacturers should avoid using hexane when producingautomotive degreasing products, and automotive technicians should avoid regular con-tact with hexane-based cleaning solvents.
In December 1998, the California Department of Health Services (CDHS) received areport from an occupational-medicine physician of a patient with peripheral neuropathyassociated with occupational exposure to n-hexane at an automotive repair facility. Theindex patient was a 24-year-old male automotive technician who had worked in theindustry during June 1995–April 1997. In January 1997, numbness and tingling devel-oped in his hands and feet then spread proximally to his forearms and waist. In March, aneurologic evaluation revealed bilaterally diminished reflexes of the biceps, patellar, andAchilles’ deep tendon. Vibration and pinprick sensations were reduced from the lowerthird of the forearms and downward from the waist; the result of his Romberg test waspositive. Tests evaluating his metabolic and thyroid function; urinary cadmium, arsenic,lead, and mercury levels; and central nervous system imaging were normal; however,nerve conduction velocity studies revealed a subacute progressive mixed motor-sensory neuropathy with distal nerve involvement. He had reported using from one tonine 15-oz. aerosol cans of brake cleaner per day during the 22 months of his employ-ment. This brake cleaner contained 50%–60% hexane (composed of 20%–80%n-hexane), 20%–30% toluene, and 1%–10% each of methyl ethyl ketone (MEK), acetone,isopropanol, methanol, and mixed xylenes. The technician sprayed the product on brakes,tools, small spills, and engine surfaces. He occasionally used a rag. He reported wearinglatex gloves daily and drinking alcohol occasionally. His condition improved with cessa-tion of n-hexane exposure; however, he continues to have paresthesias in the hands and feet.
To assess the possible occurrence of n-hexane–related peripheral neuropathy atother automotive repair facilities, during 1999, CDHS screened for n-hexane–relatedperipheral neuropathy at a local automotive dealership that used an aerosol productcontaining 1%–5% n-hexane and 2% MEK. This facility was chosen for convenience andthe employees’ willingness to participate. A case of n-hexane–related peripheral neur-opathy was defined as symptoms and results of nerve conduction velocity tests consis-tent with peripheral neuropathy in an automotive technician who had chronic occupa-tional exposure to hexane-containing solvents and no other explanation for peripheralneuropathy. Screening included a medical history, an exposure questionnaire, physicaland neurologic examinations, nerve conduction velocity studies, and neurophysiologictesting for cognitive and motor function, reaction time, and color vision. At CDC’sNational Institute for Occupational Safety and Health (NIOSH), recent exposure ton-hexane was estimated by measuring 2,5-hexanedione (2,5-HD), a urinary metabolite,in acid-hydrolyzed urine samples. Air samples were not tested because managementhad removed the hexane-containing solvent from the facility at the onset of the investigation.

1012 MMWR November 16, 2001
n-Hexane-Related Peripheral Neuropathy — Continued
Six (40%) of 15 technicians from this facility participated in the screening. All partici-pants had worked >20 years as technicians; one met the case definition for n-hexane–related peripheral neuropathy. Three of the six had detectable 2,5-HD levels, which were7.0%, 26.0%, and 6.4% of the biologic exposure index (BEI) of 5 mg 2,5-HD/g creatinine.The BEI is a biomarker that correlates to the American Conference of GovernmentalIndustrial Hygienists’ 8-hour threshold limit value (ACGIH TLV) of 50 ppm (3 ). The expo-sure values identified are considered acceptable by this standard.
During August 2000, CDHS surveyed California neurologists* to identify additionalcases of n-hexane–related peripheral neuropathy and to determine whether exposurehad occurred among persons while working in automotive repair facilities. A total of58 (20%) of 291 neurologists responded to the survey. One automotive technician wasidentified with n-hexane–related peripheral neuropathy. CDHS reviewed the medicalrecords and verified that the technician met the case definition for n-hexane–relatedperipheral neuropathy.
In July 2000, CDHS guidelines were published outlining the diagnosis and manage-ment of n-hexane–related peripheral neuropathy (4 ). The guidelines and notification ofthe identified cases were distributed to the Association of California Neurologists and tomembers of the Association of Occupational and Environmental Clinics. The northernCalifornia district of the International Association of Machinists and the California MotorCar Dealer Association also were notified.Reported by: R Harrison, MD, L Israel, DO, P Larabee, MD, Dept of Medicine, Univ of California,San Francisco; J Cone, MD, C Baker, MPH, M Brewer, R Das, MD, S Brumis, MPH, OccupationalHealth Br, California Dept of Health Svcs; R Bowler, PhD, San Francisco State Univ; MP Wilson,MPH, SK Hammond, PhD, School of Public Health, Univ of California, Berkeley. Div of AppliedResearch and Technology, National Institute for Occupational Safety and Health; and an EISOfficer, CDC.
Editorial Note: The three cases of peripheral neuropathy described in this report arerelated to occupational exposure to n-hexane among automotive technicians. Hexane-containing degreasing products are used in automotive repair facilities and usually aredispensed in an aerosol spray. Inhalation is the primary exposure route. Dermal exposurealso may occur, and latex gloves provide ineffective protection from organic solvents.The neurotoxic effects of n-hexane may be intensified when used with other chemicalsfound in automotive degreasers (e.g., acetone, MEK, and isopropanol) (5 ). Acid-hydrolyzed urinary levels of 2,5-HD, sampled at the end of a shift, correlate with workplaceconcentrations of n-hexane. Because 2,5-HD has a half-life of 13–14 hours, accumulationmay occur during the workweek (6 ).
Chronic n-hexane exposure produces a gradual sensorimotor neuropathy withdemyelinating features. The most common initial complaint is numbness and tingling ofthe toes and fingers; a progressive loss of motor function may develop. Chronic poly-neuropathy with demyelinating features also is associated with other underlying condi-tions. Other causes of peripheral neuropathy should be considered when evaluatingpersons with possible n-hexane–related peripheral neuropathy. Removal from n-hexaneexposure is the only known treatment for n-hexane–related neurotoxicity.
The prognosis for n-hexane neuropathy generally is favorable, but recovery maytake months to years, depending on disease severity. The current Occupational Safetyand Health Administration permissible exposure limit (PEL) for n-hexane, adopted in
*List generated by Dun and Bradstreet directory (June–August 2000). Standard IndustryCode 8011-6107.

Vol. 50 / No. 45 MMWR 1013
n-Hexane–Related Peripheral Neuropathy — Continued
1971, is 500 ppm in air. NIOSH established a recommended PEL of 50 ppm in 1989; thePEL for ACGIH TLV and California are 50 ppm (7 ).
Other cases of n-hexane–related peripheral neuropathy may be occurring in thisindustry, but the nature of these exposures and the extent of illness are unknown. Themethods used to identify the cases in this report were not intended to represent allautomotive repair facilities. An exposure assessment and additional case ascertainmentare in progress. Cases of n-hexane–related neuropathy in the automotive repair industrycould be prevented through reformulation of hexane-containing products and greateruse of aqueous cleaning systems.References1. Yamada S. An occurrence of polyneuritis by n-hexane in the polyethylene laminating plants.
Jpn J Ind Health 1964;6:192.2. Arlien-Soborg P. Solvent neurotoxicology. Boca Raton, Florida: CRC Press, 1992:155–83.3. American Conference of Governmental Industrial Hygienists. 2000 TLVs® and BEIs®: thresh-
old limit values for chemical substances and physical agents and biological exposureindices. Cincinnati, Ohio: American Conference of Governmental Industrial Hygienists, 2000.
4. Hazard Evaluation System and Information Service. Medical guidelines: n-hexane, July2000. Available at <http://www.dhs.ca.gov/ohb/HESIS/nhexane.htm>. Accessed November 2001.
5. Ralston W, Hilderbrand R, Uddin D, Andersen M, Gardier R. Potentiation of 2,5-hexanedioneneurotoxicity by methyl ethyl ketone. Toxicol Appl Pharmacol 1985;81:319–27.
6. Perbellini L, Mozzo P, Brugnone F, Zedde A. Physiologico-mathematical model for studyinghuman exposure to organic solvents: kinetics of blood/tissue n-hexane concentrationsand of 2,5-hexanedione in urine. Br J Ind Med 1986;43:760–8.
7. Lanska DJ. Limitations of occupational air contaminant standards, as exemplified by theneurotoxin n-hexane. J Pub Health Policy 1999;20:441–58.
Weekly Update: West Nile Virus Activity —United States, November 7–13, 2001
The following report summarizes West Nile virus (WNV) surveillance data reported toCDC through ArboNET and verified by states and other jurisdictions as of November 13, 2001.
During the week of November 7–13, three human cases of WNV encephalitis ormeningitis were reported from New York (two) and Louisiana (one). During the sameperiod, WNV infections were reported in 266 crows, 15 other birds, and six horses. A totalof 17 WNV-positive mosquito pools were reported from two jurisdictions (Pennsylvaniaand District of Columbia).
During 2001, a total of 45 human cases of WNV encephalitis or meningitis has beenreported from New York (12), Florida (10), Connecticut (six), Maryland (six), New Jersey(six), Pennsylvania (three), Georgia (one), and Louisiana (one). Among these 45 cases,24 (53%) were in men; the median age was 70 years (range: 36–90 years); dates ofillness onset ranged from July 13 to October 7; three persons died. A total of 4,517 crowsand 1,474 other birds with WNV infection was reported from 26 states and the District ofColumbia (Figure 1); 176 WNV infections in other animals (all horses) were reported from14 states (Alabama, Connecticut, Florida, Georgia, Indiana, Kentucky,Louisiana, Massachusetts, Mississippi, New York, North Carolina, Pennsylvania, Tennes-see, and Virginia). During 2001, 753 WNV-positive mosquito pools were reported from15 states (Connecticut, Florida, Georgia, Illinois, Kentucky, Maryland, Massachusetts,Michigan, New Hampshire, New Jersey, New York, Ohio, Pennsylvania, Rhode Island,and Virginia) and the District of Columbia.

1014 MMWR November 16, 2001
Weekly Update: West Nile Virus Activity — Continued
Additional information about WNV activity is available at <http://www.cdc.gov/ncidod/dvbid/westnile/index.htm> and <http://cindi.usgs.gov/hazard/event/west_nile/west_nile.html>.
Notice to Readers
Update: Interim Recommendations for Antimicrobial Prophylaxisfor Children and Breastfeeding Mothersand Treatment of Children with Anthrax
Ciprofloxacin or doxycycline is recommended for antimicrobial prophylaxis and treat-ment of adults and children with Bacillus anthracis infection associated with the recentbioterrorist attacks in the United States. Amoxicillin is an option for antimicrobial prophy-laxis for children and pregnant women and to complete treatment of cutaneous diseasewhen B. anthracis is susceptible to penicillin, as is the case in the recent attacks (1–3 ).Use of ciprofloxacin or doxycycline might be associated with adverse effects in children(4,5 ), and liquid formulations of these drugs are not widely available. This notice pro-vides further information about prophylaxis and treatment of children and breastfeedingmothers, including the use of amoxicillin.
Ciprofloxacin, doxycycline, and penicillin G procaine have been effective as antimi-crobial prophylaxis for inhalational B. anthracis infection in nonhuman primates and areapproved for this use in humans by the Food and Drug Administration (FDA) (5,6 ).Amoxicillin has not been studied in animal models and is not approved by FDA for the
FIGURE 1. Areas reporting West Nile virus (WNV) activity — United States, 2001*
* As of November 13, 2001.† Mississippi reported WNV infection only in a horse.
Human WNV Encephalitis or Meningitis and Animal WNV Activity
Animal WNV Activity Only
District of Columbia
†

Vol. 50 / No. 45 MMWR 1015
prophylaxis or treatment of anthrax. Other data indicate that B. anthracis strains pro-duce a cephalosporinase and suggest that the strains contain an inducible beta-lactamasethat might decrease the effectiveness of penicillins, especially when a large number oforganisms is present (2 ). In addition, penicillin achieves low intracellular concentrationsthat might be detrimental to its ability to kill germinating spores in macrophages.
Because of these concerns, penicillins (including amoxicillin) are not recommendedfor initial treatment of anthrax, but are likely to be effective for antimicrobial prophylaxisfollowing exposure to B. anthracis, a setting where relatively few organisms areexpected to be present. Therefore, amoxicillin* may be used for the 60-day antimicrobialprophylaxis in infants and children when the isolate involved in the exposure is deter-mined to be susceptible to penicillin. Isolates of B. anthracis implicated in the recentbioterrorist attacks are susceptible to ciprofloxacin, doxycycline, and penicillin (2 ).
Initial treatment of infants and children with inhalational or systemic (including gas-trointestinal or oropharyngeal) anthrax should consist of intravenous ciprofloxacin† ordoxycyline§, plus one or two additional antimicrobial¶ agents. If meningitis is suspected,ciprofloxacin might be more effective than doxycycline because of better central ner-vous system penetration (2 ). Experience with fluoroquinolones other than ciprofloxacinin children is limited.
Ciprofloxacin or doxycycline should be the initial treatment of localized cutaneousanthrax in infants and children. Intravenous therapy with multiple antimicrobial agents isrecommended for cutaneous anthrax with systemic involvement, extensive edema, orlesions on the head or neck (2 ). Whether infants and young children are at increased riskfor systemic dissemination of cutaneous infection is not known; a 7-month-old patientinfected during the recent bioterrorism attacks developed systemic illnessafter onset of cutaneous anthrax (7 ). For young children (e.g. aged <2 years), initialtherapy of cutaneous anthrax should be intravenous, and combination therapy withadditional antimicrobials should be considered.
After clinical improvement following intravenous treatment for inhalational or cuta-neous anthrax, oral therapy with one or two antimicrobial agents (including either cipro-floxacin or doxycycline) may be used to complete the first 14–21 days of treatment forinhalational anthrax or the first 7–10 days for uncomplicated cutaneous anthrax. Theoptimal oral treatment regimen is unknown; some adults with inhalationalanthrax as a result of the recent bioterrorist attacks are receiving ciprofloxacin andrifampin. For both inhalational and cutaneous anthrax in the setting of this bioterroristattack, antimicrobial therapy should be continued for 60 days because of the likelihood ofexposure to aerosolized B. anthracis and the need to protect against persistent sporesthat might germinate in the respiratory tract. Because of potential adverse effects ofprolonged use of ciprofloxacin or doxycycline in children, amoxicillin is an option forcompletion of the remaining 60 days of therapy for persons infected in these bioterroristattacks.
Notices to Readers — Continued
*The recommended dose of amoxicillin is 80 mg/kg/day orally divided every 8 hours (maximum500 mg/dose).
† The recommended dose of ciprofloxacin is 10 mg/kg/dose every 12 hours intravenously(maximum 400 mg/dose) or 15 mg/kg/dose every 12 hours orally (maximum 500 mg/dose).
§ The recommended dose of doxycycline is 2.2 mg/kg/dose every 12 hours intravenously ororally (maximum 100 mg/dose).
¶ Options for additional drugs, based on in vitro sensitivity testing of isolates in the recentattacks, include rifampin, vancomycin, penicillin, ampicillin, chloramphenicol, imipenem,clindamycin, and clarithromycin (2 ).

1016 MMWR November 16, 2001
Because of its known safety for infants, amoxicillin is an option for antimicrobialprophylaxis in breastfeeding mothers when B. anthracis is known to be penicillin-susceptible and no contraindication to maternal amoxicillin use is indicated. The Ameri-can Academy of Pediatrics also considers ciprofloxacin and tetracyclines (which includedoxycycline) to be usually compatible with breastfeeding because the amount of eitherdrug absorbed by infants is small, but little is known about the safety of long-term use (8 ).Mothers concerned about the use of ciprofloxacin or doxycycline for antimicrobial pro-phylaxis should consider expressing and then discarding breast milk so that breastfeedingcan be resumed when antimicrobial prophylaxis is completed. Decisions about antimi-crobial choice and continuation of breastfeeding should be made by the mother and herand the infant’s health-care providers. Consideration should be given to antimicrobialefficacy, safety for the infant, and the benefits of breastfeeding.
Health-care providers prescribing antimicrobial drugs for the prophylaxis or treat-ment of anthrax should be aware of their adverse effects and consult with an infectiousdisease specialist as needed. Additional information about recognition, prophylaxis, andtreatment of anthrax infection is available at <http://www.bt.cdc.gov>.References1. CDC. Update: investigation of anthrax associated with intentional exposure and interim
public health guidelines, October 2001. MMWR 2001;50:889–93.2. CDC. Update: investigation of bioterrorism-related anthrax and interim guidelines for
exposure management and antimicrobial therapy, October 2001. MMWR 2001;50:909–19.3. CDC. Updated recommendations for antimicrobial prophylaxis among asymptomatic preg-
nant women after exposure to Bacillus anthracis. MMWR 2001;50:960.4. Bayer Corporation. Ciprofloxacin®. In: Physicians desk reference. Montvale, New Jersey:
Medical Economics Company, 2000:678–83.5. Food and Drug Administration. Prescription drug products; Doxycycline and Penicillin G
Procaine administration for inhalational anthrax (post-exposure). Federal Register 2001;66:55679.6. Friedlander AM, Welkos SL, Pitt MLM, et al. Postexposure prophylaxis against experimental
inhalation anthrax. J Infect Dis 1993;167:1239–43.7. Roche KJ, Chang MW, Lazarus H. Cutaneous anthrax infection: images in clinical medicine.
N Engl J Med 2001. Available at <http://www.nejm.org>. Accessed November 6, 2001.8. American Academy of Pediatrics Committee on Drugs. The transfer of drugs and other
chemicals into human milk. Pediatrics. 2001;108:776–89.
Notice to Readers
Reducing the Risk for Injury While Traveling for Thanksgiving Holidays
Each year in the United States, motor-vehicle crashes result in approximately 40,000deaths (1 ) and 3.2 million nonfatal injuries (2 ). In 2000 during the Thanksgiving holiday,motor-vehicle crashes killed approximately 500 persons (US Department of Transporta-tion, National Highway Traffic Safety Administration, unpublished data, 2000), and re-sulted in >43,000 hospital emergency department visits (2 ). Following are steps thatmight prevent many of these deaths and injuries:
• Wear safety belts at all times. Safety-belt use is the single most effective meansof reducing fatal and nonfatal injuries in motor-vehicle crashes. Although safetybelts reduce the risk for death by approximately 45%–60%, three out of 10 U.S.adults do not routinely use them. Effective interventions to increase safety-belt
Notices to Readers — Continued

Vol. 50 / No. 45 MMWR 1017
use include safety-belt laws, primary enforcement laws, and enhanced enforcementprograms (3 ).
• Place children in age appropriate restraints. Infants should be placed in rear-facing child safety seats (CSSs) until they are at least age 1 year and 20–22 lbs.Older children, up to 40 lbs., are safest in forward facing convertible CSSs. School-aged children who have outgrown convertible CSSs should be placed in a boosterseat until they fit in a car safety belt alone. Effective interventions to increase CSSuse include child safety seat use laws, communitywide information plusenhanced enforcement campaigns, CSS distribution plus education programs,and incentive plus education programs that reward parents or children forcorrectly using CSSs (4 ).
• Place all children aged <12 years in the back seat. This eliminates the injury riskfor deployed passenger-side airbags and places the child in the safest part of thevehicle in a crash. It is particularly important not to place infants in the front of anairbag. Riding in the back seat is associated with at least a 30% reduction in therisk for fatal injury (5 ).
• Never drink and drive. More than 16,000 (73%) traffic deaths each year areassociated with alcohol use (6 ). Effective interventions to reduce alcohol-impaired driving include 0.08% blood alcohol concentration (BAC) laws, lowerBAC laws for young or inexperienced drivers, minimum legal drinking age laws,sobriety checkpoints, and server intervention programs that involve face-to-faceinstruction and management support (7 ).
Additional information is available at <http://www.cdc.gov/ncipc>.References1. CDC. National Center for Health Statistics. Annual mortality tapes. Hyattsville, Maryland:
US Department of Health and Human Services, 1999.2. CDC. Data from the National Electronic Injury Surveillance System-All Injury Program oper-
ated by the US Consumer Product Safety Commission. Atlanta, Georgia: US Department ofHealth and Human Services, CDC, National Center for Injury Prevention and Control, 2001.
3. Dinh-Zarr TB, Sleet DA, Shults RA, et al. Reviews of evidence regarding interventions toincrease the use of safety belts. Am J Prev Med 2001;21:48–65.
4. Zaza S, Sleet DA, Thompson RS, et al. Reviews of evidence regarding interventions toincrease use of child safety seats. Am J Prev Med 2001;21:31–47.
5. Braver ER, Whitfield R, Ferguson SA. Seating position and children’s risk of dying in motorvehicle crashes. Injury Prev 1998;4:181–7.
6. National Highway Traffic Safety Administration. Traffic safety facts 1999: alcohol. Wash-ington, DC: US Department of Transportation, National Highway Traffic Safety Administra-tion, 2000; publication no. DOT HS 809 086.
7. Shults RA, Elder RW, Sleet DA, et al. Reviews of evidence regarding intervention to reducealcohol-impaired driving. Am J Prev Med 2001;21:66–88.
Notices to Readers — Continued

1018 MMWR November 16, 2001
Notice to Readers
Epidemiology in Action: Intermediate Methods
CDC and Emory University’s Rollins School of Public Health will co-sponsor a course,“Epidemiology in Action: Intermediate Methods” during February 25–March 1, 2002, atEmory University. The course is designed for practicing public health professionals whohave had training and experience in basic applied epidemiology and would like training inadditional quantitative skills related to analysis and interpretation of epidemiologic data.
The course will review the fundamentals of descriptive epidemiology and biostatis-tics, measures of association, normal and binomial distributions, confounding, statisticaltests, stratification, logistic regression, models, and computers as used in epidemiology.Prerequisite is an introductory course in epidemiology, such as Epidemiology in Action,International Course in Applied Epidemiology or any other introductory class. There is atuition charge.
Deadline for applications is January 15. Additional information and applications areavailable from Emory University, International Health Dept.(Pia), 1518 Clifton Road, N.E.,Room 746, Atlanta, GA 30322; telephone (404) 727-3485; fax (404) 727-4590; or [email protected].

Vol. 50 / No. 45 MMWR 1019
FIGURE I. Selected notifiable disease reports, United States, comparison ofprovisional 4-week totals ending November 10, 2001, with historical data
* No rubella cases were reported for the current 4-week period yielding a ratio for week 45 ofzero (0).
† Ratio of current 4-week total to mean of 15 4-week totals (from previous, comparable, andsubsequent 4-week periods for the past 5 years). The point where the hatched area beginsis based on the mean and two standard deviations of these 4-week totals.
TABLE I. Summary of provisional cases of selected notifiable diseases,United States, cumulative, week ending November 10, 2001 (45th Week)*
Cum. 2001 Cum. 2001
Anthrax 15 Poliomyelitis, paralytic -Brucellosis† 75 Psittacosis† 19Cholera 3 Q fever† 18Cyclosporiasis† 136 Rabies, human 1Diphtheria 2 Rocky Mountain spotted fever (RMSF) 525Ehrlichiosis: human granulocytic (HGE)† 176 Rubella, congenital syndrome -
human monocytic (HME)† 76 Streptococcal disease, invasive, group A 3,208Encephalitis: California serogroup viral† 93 Streptococcal toxic-shock syndrome† 42
eastern equine† 8 Syphilis, congenital¶ 190St. Louis† 1 Tetanus 22western equine† - Toxic-shock syndrome 101
Hansen disease (leprosy)† 73 Trichinosis 21Hantavirus pulmonary syndrome† 7 Tularemia† 92Hemolytic uremic syndrome, postdiarrheal† 131 Typhoid fever 239HIV infection, pediatric†§ 181 Yellow fever -Plague 2
-:No reported cases. *Incidence data for reporting year 2001 are provisional and cumulative (year-to-date). † Not notifiable in all states. § Updated monthly from reports to the Division of HIV/AIDS Prevention — Surveillance and Epidemiology, National Center for HIV,
STD, and TB Prevention (NCHSTP). Last updated October 30, 2001. ¶ Updated from reports to the Division of STD Prevention, NCHSTP.
DISEASE DECREASE INCREASECASES CURRENT
4 WEEKS
Ratio (Log Scale)†
Beyond Historical Limits
4210.50.250.125
394
338
51
84
1
63
14
249
0
Hepatitis A
Hepatitis B
Hepatitis C; Non-A, Non-B
Legionellosis
Measles, Total
Mumps
Pertussis
Rubella
Meningococcal Infections
*
0.06250.03125

1020 MMWR November 16, 2001
TABLE II. Provisional cases of selected notifiable diseases, United States,weeks ending November 10, 2001, and November 11, 2000 (45th Week)*
Cum. Cum. Cum. Cum. Cum. Cum. Cum. Cum. Cum. Cum.2001¶ 2000 2001 2000 2001 2000 2001 2000 2001 2000
AIDS Chlamydia§ Cryptosporidiosis NETSS PHLIS
Reporting Area
Escherichia coli O157:H7†
UNITED STATES 33,013 32,692 609,880 599,713 2,971 2,716 2,675 4,065 2,053 3,351
NEW ENGLAND 1,276 1,673 20,251 20,315 113 127 211 352 211 361Maine 40 28 1,172 1,273 18 20 25 29 26 28N.H. 31 28 1,166 959 15 21 33 34 27 38Vt. 13 29 525 455 31 26 13 33 8 33Mass. 661 1,049 8,562 8,781 45 33 112 156 107 162R.I. 85 81 2,555 2,314 4 3 14 19 11 18Conn. 446 458 6,271 6,533 - 24 14 81 32 82
MID. ATLANTIC 7,683 7,090 65,855 56,071 235 342 191 404 180 321Upstate N.Y. 823 665 12,341 2,233 94 112 148 269 136 65N.Y. City 3,788 3,755 25,456 22,732 79 154 12 22 10 17N.J. 1,537 1,423 9,798 9,051 10 16 31 113 34 113Pa. 1,535 1,247 18,260 22,055 52 60 N N - 126
E.N. CENTRAL 2,513 3,164 100,896 103,302 1,344 899 704 1,002 473 702Ohio 482 475 21,230 26,771 149 249 186 244 146 210Ind. 306 320 12,924 11,547 73 57 78 115 39 83Ill. 1,115 1,596 29,115 28,831 390 113 152 186 128 150Mich. 459 601 25,873 21,951 165 87 84 134 73 104Wis. 151 172 11,754 14,202 567 393 204 323 87 155
W.N. CENTRAL 719 762 30,862 34,075 400 343 494 584 410 558Minn. 121 153 6,361 7,072 168 123 236 155 186 178Iowa 78 73 3,944 4,592 78 73 78 171 60 143Mo. 347 349 11,089 11,595 37 29 51 104 81 96N. Dak. 2 2 767 757 13 15 18 15 31 21S. Dak. 23 7 1,571 1,586 6 15 41 53 41 57Nebr. 63 64 2,175 3,182 96 79 52 60 - 46Kans. 85 114 4,955 5,291 2 9 18 26 11 17
S. ATLANTIC 10,366 9,072 115,050 113,571 301 420 203 333 129 269Del. 218 182 2,309 2,457 6 6 4 3 7 1Md. 1,529 1,127 9,551 12,344 36 9 23 32 1 2D.C. 738 694 2,605 2,779 10 13 - 1 U UVa. 803 580 15,401 13,674 24 17 48 64 39 61W. Va. 73 54 2,046 1,856 2 3 10 14 8 12N.C. 807 585 17,228 19,231 27 23 46 82 33 66S.C. 623 682 9,638 8,367 - - 10 21 11 16Ga. 1,239 1,049 25,834 24,086 127 156 30 37 15 37Fla. 4,336 4,119 30,438 28,777 69 193 32 79 15 74
E.S. CENTRAL 1,554 1,618 41,956 44,056 41 45 117 131 99 103Ky. 299 168 7,615 6,928 4 5 57 39 47 31Tenn. 507 684 12,322 12,845 12 11 36 52 39 48Ala. 378 418 11,939 13,442 13 15 16 8 6 9Miss. 370 348 10,080 10,841 12 14 8 32 7 15
W.S. CENTRAL 3,488 3,366 90,327 90,911 33 154 86 219 91 270Ark. 178 158 6,043 5,773 6 14 13 55 - 38La. 711 587 14,824 15,861 7 12 4 15 26 46Okla. 203 294 8,850 8,128 13 17 27 19 28 17Tex. 2,396 2,327 60,610 61,149 7 111 42 130 37 169
MOUNTAIN 1,172 1,211 34,299 33,125 214 164 260 394 128 291Mont. 15 12 1,542 1,192 33 10 19 30 - -Idaho 19 19 1,672 1,582 21 23 64 65 - 39Wyo. 3 9 713 688 7 5 6 18 1 10Colo. 248 294 7,022 8,910 35 67 85 151 52 108N. Mex. 129 126 5,202 4,442 27 19 13 22 10 18Ariz. 459 386 12,489 10,948 7 10 28 46 22 37Utah 101 113 1,512 1,951 79 26 30 49 42 69Nev. 198 252 4,147 3,412 5 4 15 13 1 10
PACIFIC 4,242 4,736 110,384 104,287 290 222 409 646 332 476Wash. 435 428 11,740 11,245 54 U 116 209 62 198Oreg. 177 145 6,418 5,862 46 17 61 129 58 111Calif. 3,552 4,042 86,648 81,922 186 205 211 265 203 151Alaska 18 22 2,236 2,154 1 - 4 29 1 5Hawaii 60 99 3,342 3,104 3 - 17 14 8 11
Guam 12 13 - 438 - - N N U UP.R. 1,021 1,133 2,193 U - - 1 6 U UV.I. 2 31 53 - - - - - U UAmer. Samoa 1 - U U U U U U U UC.N.M.I. - - 111 U - U - U U U
N: Not notifiable. U: Unavailable. -: No reported cases. C.N.M.I.: Commonwealth of Northern Mariana Islands.* Incidence data for reporting year 2001 are provisional and cumulative (year-to-date). Incidence data for reporting year 2000 are finalized and
cumulative (year-to-date).† Individual cases can be reported through both the National Electronic Telecommunications System for Surveillance (NETSS) and the Public
Health Laboratory Information System (PHLIS).§ Chlamydia refers to genital infections caused by C. trachomatis.¶ Updated monthly from reports to the Division of HIV/AIDS Prevention — Surveillance and Epidemiology, National Center for HIV, STD, and
TB Prevention. Last updated October 30, 2001.
Vol. 50 / No. 45 MMWR 1021
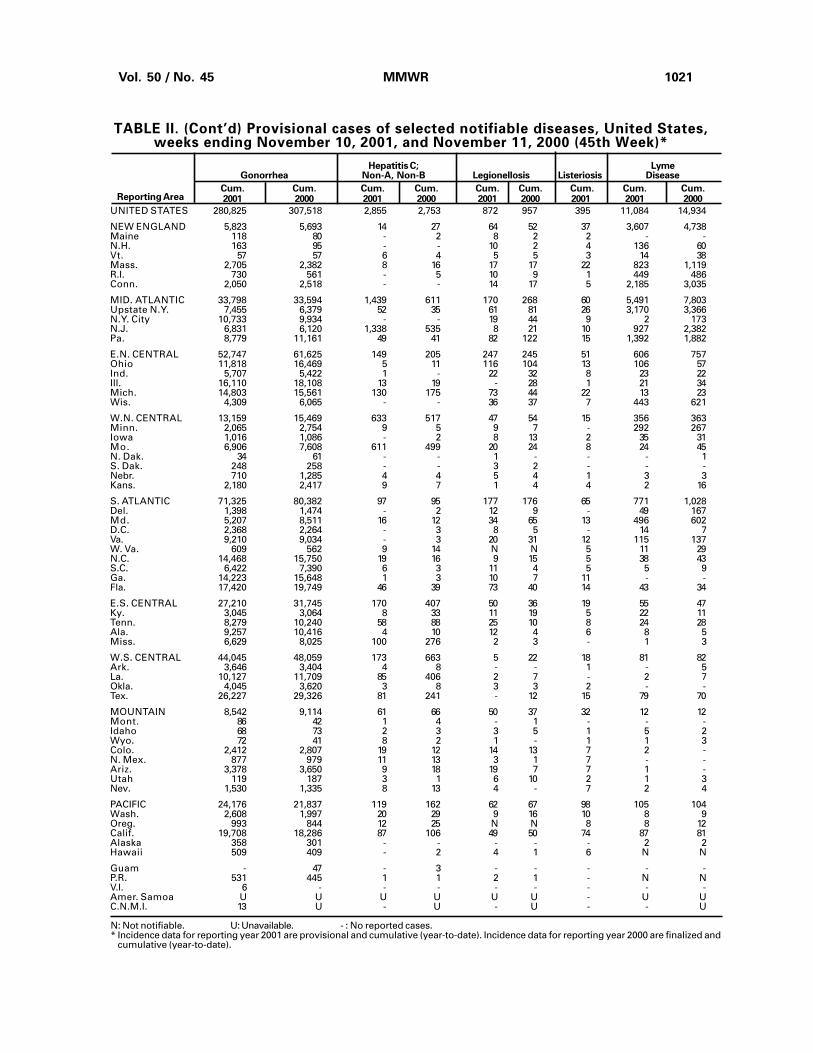
TABLE II. (Cont’d) Provisional cases of selected notifiable diseases, United States,weeks ending November 10, 2001, and November 11, 2000 (45th Week)*
Reporting Area
N: Not notifiable. U: Unavailable. - : No reported cases.* Incidence data for reporting year 2001 are provisional and cumulative (year-to-date). Incidence data for reporting year 2000 are finalized and
cumulative (year-to-date).
Cum. Cum. Cum. Cum. Cum. Cum. Cum. Cum. Cum.2001 2000 2001 2000 2001 2000 2001 2001 2000
Hepatitis C; LymeGonorrhea Non-A, Non-B Legionellosis Listeriosis Disease
UNITED STATES 280,825 307,518 2,855 2,753 872 957 395 11,084 14,934
NEW ENGLAND 5,823 5,693 14 27 64 52 37 3,607 4,738Maine 118 80 - 2 8 2 2 - -N.H. 163 95 - - 10 2 4 136 60Vt. 57 57 6 4 5 5 3 14 38Mass. 2,705 2,382 8 16 17 17 22 823 1,119R.I. 730 561 - 5 10 9 1 449 486Conn. 2,050 2,518 - - 14 17 5 2,185 3,035
MID. ATLANTIC 33,798 33,594 1,439 611 170 268 60 5,491 7,803Upstate N.Y. 7,455 6,379 52 35 61 81 26 3,170 3,366N.Y. City 10,733 9,934 - - 19 44 9 2 173N.J. 6,831 6,120 1,338 535 8 21 10 927 2,382Pa. 8,779 11,161 49 41 82 122 15 1,392 1,882
E.N. CENTRAL 52,747 61,625 149 205 247 245 51 606 757Ohio 11,818 16,469 5 11 116 104 13 106 57Ind. 5,707 5,422 1 - 22 32 8 23 22Ill. 16,110 18,108 13 19 - 28 1 21 34Mich. 14,803 15,561 130 175 73 44 22 13 23Wis. 4,309 6,065 - - 36 37 7 443 621
W.N. CENTRAL 13,159 15,469 633 517 47 54 15 356 363Minn. 2,065 2,754 9 5 9 7 - 292 267Iowa 1,016 1,086 - 2 8 13 2 35 31Mo. 6,906 7,608 611 499 20 24 8 24 45N. Dak. 34 61 - - 1 - - - 1S. Dak. 248 258 - - 3 2 - - -Nebr. 710 1,285 4 4 5 4 1 3 3Kans. 2,180 2,417 9 7 1 4 4 2 16
S. ATLANTIC 71,325 80,382 97 95 177 176 65 771 1,028Del. 1,398 1,474 - 2 12 9 - 49 167Md. 5,207 8,511 16 12 34 65 13 496 602D.C. 2,368 2,264 - 3 8 5 - 14 7Va. 9,210 9,034 - 3 20 31 12 115 137W. Va. 609 562 9 14 N N 5 11 29N.C. 14,468 15,750 19 16 9 15 5 38 43S.C. 6,422 7,390 6 3 11 4 5 5 9Ga. 14,223 15,648 1 3 10 7 11 - -Fla. 17,420 19,749 46 39 73 40 14 43 34
E.S. CENTRAL 27,210 31,745 170 407 50 36 19 55 47Ky. 3,045 3,064 8 33 11 19 5 22 11Tenn. 8,279 10,240 58 88 25 10 8 24 28Ala. 9,257 10,416 4 10 12 4 6 8 5Miss. 6,629 8,025 100 276 2 3 - 1 3
W.S. CENTRAL 44,045 48,059 173 663 5 22 18 81 82Ark. 3,646 3,404 4 8 - - 1 - 5La. 10,127 11,709 85 406 2 7 - 2 7Okla. 4,045 3,620 3 8 3 3 2 - -Tex. 26,227 29,326 81 241 - 12 15 79 70
MOUNTAIN 8,542 9,114 61 66 50 37 32 12 12Mont. 86 42 1 4 - 1 - - -Idaho 68 73 2 3 3 5 1 5 2Wyo. 72 41 8 2 1 - 1 1 3Colo. 2,412 2,807 19 12 14 13 7 2 -N. Mex. 877 979 11 13 3 1 7 - -Ariz. 3,378 3,650 9 18 19 7 7 1 -Utah 119 187 3 1 6 10 2 1 3Nev. 1,530 1,335 8 13 4 - 7 2 4
PACIFIC 24,176 21,837 119 162 62 67 98 105 104Wash. 2,608 1,997 20 29 9 16 10 8 9Oreg. 993 844 12 25 N N 8 8 12Calif. 19,708 18,286 87 106 49 50 74 87 81Alaska 358 301 - - - - - 2 2Hawaii 509 409 - 2 4 1 6 N N
Guam - 47 - 3 - - - - -P.R. 531 445 1 1 2 1 - N NV.I. 6 - - - - - - - -Amer. Samoa U U U U U U - U UC.N.M.I. 13 U - U - U - - U
1022 MMWR November 16, 2001
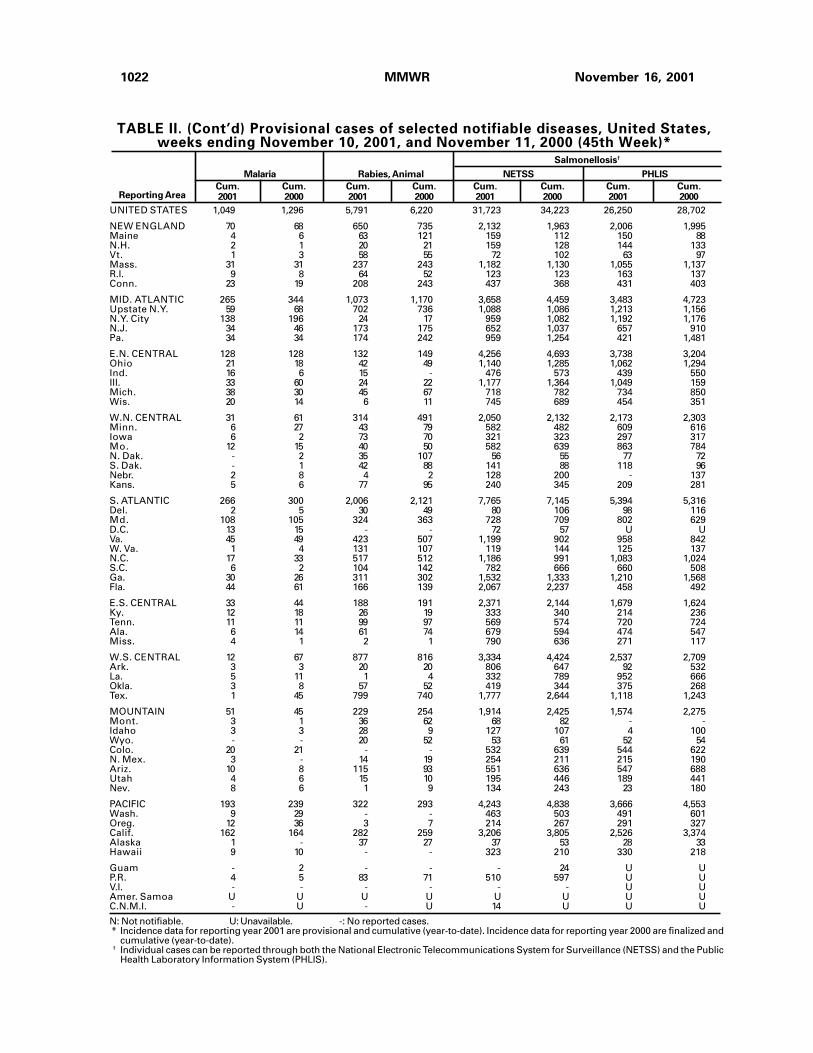
Malaria Rabies, Animal NETSS PHLIS
Cum. Cum. Cum. Cum. Cum. Cum. Cum. Cum.2001 2000 2001 2000 2001 2000 2001 2000Reporting Area
Salmonellosis†
UNITED STATES 1,049 1,296 5,791 6,220 31,723 34,223 26,250 28,702
NEW ENGLAND 70 68 650 735 2,132 1,963 2,006 1,995Maine 4 6 63 121 159 112 150 88N.H. 2 1 20 21 159 128 144 133Vt. 1 3 58 55 72 102 63 97Mass. 31 31 237 243 1,182 1,130 1,055 1,137R.I. 9 8 64 52 123 123 163 137Conn. 23 19 208 243 437 368 431 403
MID. ATLANTIC 265 344 1,073 1,170 3,658 4,459 3,483 4,723Upstate N.Y. 59 68 702 736 1,088 1,086 1,213 1,156N.Y. City 138 196 24 17 959 1,082 1,192 1,176N.J. 34 46 173 175 652 1,037 657 910Pa. 34 34 174 242 959 1,254 421 1,481
E.N. CENTRAL 128 128 132 149 4,256 4,693 3,738 3,204Ohio 21 18 42 49 1,140 1,285 1,062 1,294Ind. 16 6 15 - 476 573 439 550Ill. 33 60 24 22 1,177 1,364 1,049 159Mich. 38 30 45 67 718 782 734 850Wis. 20 14 6 11 745 689 454 351
W.N. CENTRAL 31 61 314 491 2,050 2,132 2,173 2,303Minn. 6 27 43 79 582 482 609 616Iowa 6 2 73 70 321 323 297 317Mo. 12 15 40 50 582 639 863 784N. Dak. - 2 35 107 56 55 77 72S. Dak. - 1 42 88 141 88 118 96Nebr. 2 8 4 2 128 200 - 137Kans. 5 6 77 95 240 345 209 281
S. ATLANTIC 266 300 2,006 2,121 7,765 7,145 5,394 5,316Del. 2 5 30 49 80 106 98 116Md. 108 105 324 363 728 709 802 629D.C. 13 15 - - 72 57 U UVa. 45 49 423 507 1,199 902 958 842W. Va. 1 4 131 107 119 144 125 137N.C. 17 33 517 512 1,186 991 1,083 1,024S.C. 6 2 104 142 782 666 660 508Ga. 30 26 311 302 1,532 1,333 1,210 1,568Fla. 44 61 166 139 2,067 2,237 458 492
E.S. CENTRAL 33 44 188 191 2,371 2,144 1,679 1,624Ky. 12 18 26 19 333 340 214 236Tenn. 11 11 99 97 569 574 720 724Ala. 6 14 61 74 679 594 474 547Miss. 4 1 2 1 790 636 271 117
W.S. CENTRAL 12 67 877 816 3,334 4,424 2,537 2,709Ark. 3 3 20 20 806 647 92 532La. 5 11 1 4 332 789 952 666Okla. 3 8 57 52 419 344 375 268Tex. 1 45 799 740 1,777 2,644 1,118 1,243
MOUNTAIN 51 45 229 254 1,914 2,425 1,574 2,275Mont. 3 1 36 62 68 82 - -Idaho 3 3 28 9 127 107 4 100Wyo. - - 20 52 53 61 52 54Colo. 20 21 - - 532 639 544 622N. Mex. 3 - 14 19 254 211 215 190Ariz. 10 8 115 93 551 636 547 688Utah 4 6 15 10 195 446 189 441Nev. 8 6 1 9 134 243 23 180
PACIFIC 193 239 322 293 4,243 4,838 3,666 4,553Wash. 9 29 - - 463 503 491 601Oreg. 12 36 3 7 214 267 291 327Calif. 162 164 282 259 3,206 3,805 2,526 3,374Alaska 1 - 37 27 37 53 28 33Hawaii 9 10 - - 323 210 330 218
Guam - 2 - - - 24 U UP.R. 4 5 83 71 510 597 U UV.I. - - - - - - U UAmer. Samoa U U U U U U U UC.N.M.I. - U - U 14 U U U
N: Not notifiable. U: Unavailable. -: No reported cases.* Incidence data for reporting year 2001 are provisional and cumulative (year-to-date). Incidence data for reporting year 2000 are finalized and
cumulative (year-to-date).† Individual cases can be reported through both the National Electronic Telecommunications System for Surveillance (NETSS) and the Public
Health Laboratory Information System (PHLIS).
TABLE II. (Cont’d) Provisional cases of selected notifiable diseases, United States,weeks ending November 10, 2001, and November 11, 2000 (45th Week)*

Vol. 50 / No. 45 MMWR 1023
TABLE II. (Cont’d) Provisional cases of selected notifiable diseases, United States,weeks ending November 10, 2001, and November 11, 2000 (45th Week)*
SyphilisNETSS PHLIS (Primary & Secondary) Tuberculosis
Cum. Cum. Cum. Cum. Cum. Cum. Cum. Cum.2001 2000 2001 2000 2001 2000 2001 2000Reporting Area
Shigellosis†
UNITED STATES 15,488 19,606 7,128 11,236 5,012 5,299 10,539 12,186
NEW ENGLAND 232 370 255 347 53 75 355 363Maine 6 10 2 11 1 1 8 16N.H. 6 6 3 8 1 2 16 18Vt. 7 4 5 - 2 - 4 4Mass. 181 256 176 233 30 53 203 208R.I. 17 30 24 30 9 4 32 27Conn. 15 64 45 65 10 15 92 90
MID. ATLANTIC 1,130 2,321 693 1,520 438 244 2,001 1,945Upstate N.Y. 441 683 113 209 22 9 310 264N.Y. City 321 883 331 599 237 102 1,010 1,045N.J. 185 479 184 412 119 62 433 470Pa. 183 276 65 300 60 71 248 166
E.N. CENTRAL 3,786 3,767 1,643 1,127 886 1,078 1,142 1,229Ohio 2,589 346 1,086 283 71 64 230 243Ind. 198 1,431 40 146 145 314 88 122Ill. 457 1,081 288 93 299 363 527 590Mich. 277 609 202 552 348 294 228 200Wis. 265 300 27 53 23 43 69 74
W.N. CENTRAL 1,726 2,212 1,175 1,842 80 60 393 439Minn. 388 714 384 806 27 15 199 134Iowa 344 486 286 322 4 11 34 33Mo. 292 609 196 431 21 26 113 161N. Dak. 21 42 28 49 - - 3 2S. Dak. 543 7 246 4 - - 12 16Nebr. 72 132 - 110 5 2 32 22Kans. 66 222 35 120 23 6 - 71
S. ATLANTIC 2,199 2,650 720 1,047 1,709 1,768 2,180 2,449Del. 14 22 11 21 9 8 15 14Md. 138 182 87 102 205 266 182 214D.C. 51 67 U U 32 35 51 27Va. 338 414 175 328 92 119 215 232W. Va. 8 4 8 3 4 3 26 27N.C. 312 345 156 244 398 435 291 302S.C. 235 123 119 84 204 203 153 238Ga. 366 237 130 168 325 342 409 532Fla. 737 1,256 34 97 440 357 838 863
E.S. CENTRAL 1,421 1,028 540 525 565 775 701 798Ky. 651 433 285 104 43 74 103 106Tenn. 90 328 96 354 278 464 253 302Ala. 189 77 130 61 118 109 235 259Miss. 491 190 29 6 126 128 110 131
W.S. CENTRAL 2,009 3,089 1,146 1,006 626 725 763 1,768Ark. 506 184 155 55 31 94 129 162La. 128 258 166 166 141 192 - 146Okla. 71 107 36 41 59 108 122 130Tex. 1,304 2,540 789 744 395 331 512 1,330
MOUNTAIN 865 1,081 627 785 211 209 422 441Mont. 8 7 - - - - 6 14Idaho 39 44 - 25 1 1 8 8Wyo. 3 5 5 3 1 1 3 3Colo. 215 236 243 195 36 8 102 72N. Mex. 113 151 75 105 17 16 24 38Ariz. 368 448 248 312 140 177 194 181Utah 53 74 48 79 8 1 33 41Nev. 66 116 8 66 8 5 52 84
PACIFIC 2,120 3,088 329 3,037 444 365 2,582 2,754Wash. 186 412 167 380 42 60 207 217Oreg. 77 154 100 103 13 11 91 86Calif. 1,793 2,482 - 2,522 379 293 2,113 2,242Alaska 6 7 6 3 - - 43 92Hawaii 58 33 56 29 10 1 128 117
Guam - 36 U U - 3 - 47P.R. 8 33 U U 240 141 76 135V.I. - - U U - - - -Amer. Samoa U U U U U U U UC.N.M.I. 7 U U U 10 U 31 UN: Not notifiable. U: Unavailable. -: No reported cases.* Incidence data for reporting year 2001 are provisional and cumulative (year-to-date). Incidence data for reporting year 2000 are finalized and
cumulative (year-to-date).† Individual cases can be reported through both the National Electronic Telecommunications System for Surveillance (NETSS) and the Public
Health Laboratory Information System (PHLIS).

1024 MMWR November 16, 2001
N: Not notifiable. U: Unavailable. - : No reported cases.* Incidence data for reporting year 2001 are provisional and cumulative (year-to-date). Incidence data for reporting year 2000 are finalized and
cumulative (year-to-date).† For imported measles, cases include only those resulting from importation from other countries.§ Of 240 cases among children aged <5 years, serotype was reported for 117, and of those, 20 were type b.
TABLE III. Provisional cases of selected notifiable diseases preventableby vaccination, United States, weeks ending November 10, 2001,
and November 11, 2000 (45th Week)*
A B Indigenous Imported† Total
Cum. Cum. Cum. Cum. Cum. Cum. Cum. Cum. Cum. Cum.2001§ 2000 2001 2000 2001 2000 2001 2001 2001 2001 2001 2000Reporting Area
Hepatitis (Viral), By TypeH. influenzae,Invasive
UNITED STATES 1,102 1,118 8,780 11,460 5,677 6,110 - 49 - 44 93 73
NEW ENGLAND 81 94 559 346 88 96 - 4 - 1 5 6Maine 2 1 10 19 5 5 - - - - - -N.H. 4 12 16 18 14 15 - - - - - 3Vt. 3 7 14 10 4 6 - 1 - - 1 3Mass. 37 37 247 124 9 13 - 2 - 1 3 -R.I. 5 4 59 22 25 19 - - - - - -Conn. 30 33 213 153 31 38 - 1 - - 1 -
MID. ATLANTIC 167 201 834 1,349 885 1,034 - 5 - 11 16 21Upstate N.Y. 66 86 229 222 113 119 - 1 - 4 5 10N.Y. City 41 54 262 463 379 502 - 3 - 1 4 10N.J. 40 36 159 255 169 160 - - - 1 1 -Pa. 20 25 184 409 224 253 - 1 - 5 6 1
E.N. CENTRAL 139 161 1,008 1,483 787 640 - - - 10 10 7Ohio 52 49 186 234 84 93 - - - 3 3 2Ind. 43 27 92 105 45 42 - - - 4 4 -Ill. 10 56 381 635 134 108 - - - 3 3 3Mich. 12 9 291 434 524 359 - - - - - 2Wis. 22 20 58 75 - 38 - - - - - -
W.N. CENTRAL 58 65 374 606 187 255 - 4 - 1 5 2Minn. 36 35 39 167 21 34 - 2 - 1 3 1Iowa - - 34 62 24 31 - - - - - -Mo. 13 20 102 244 101 125 - 2 - - 2 -N. Dak. 7 2 3 3 1 2 U - U - - -S. Dak. - 1 3 2 1 1 - - - - - -Nebr. 1 3 30 30 22 38 - - - - - -Kans. 1 4 163 98 17 24 - - - - - 1
S. ATLANTIC 328 246 2,104 1,287 1,320 1,109 - 4 - 1 5 4Del. - - - 15 - 14 - - - - - -Md. 76 74 248 182 129 112 - 2 - 1 3 -D.C. - - 47 24 11 29 - - - - - -Va. 27 36 115 142 157 145 - 1 - - 1 2W. Va. 14 8 18 53 20 14 - - - - - -N.C. 44 23 202 127 173 213 - - - - - -S.C. 6 7 66 72 28 21 - - - - - -Ga. 88 61 856 269 442 204 - 1 - - 1 -Fla. 73 37 552 403 360 357 - - - - - 2
E.S. CENTRAL 67 42 351 363 371 405 - 2 - - 2 -Ky. 2 12 118 47 40 67 - 2 - - 2 -Tenn. 37 18 141 128 202 189 - - - - - -Ala. 26 10 68 47 75 51 - - - - - -Miss. 2 2 24 141 54 98 - - - - - -
W.S. CENTRAL 44 61 1,159 2,138 605 985 - - - 1 1 -Ark. 1 2 62 125 85 88 U - U - - -La. 6 16 56 82 41 138 - - - - - -Okla. 36 41 107 227 70 140 - - - - - -Tex. 1 2 934 1,704 409 619 - - - 1 1 -
MOUNTAIN 124 111 656 809 436 457 - 1 - 1 2 12Mont. - 1 11 7 3 6 U - U - - -Idaho 2 4 54 29 11 6 - - - 1 1 -Wyo. - 1 7 4 2 3 - - - - - -Colo. 32 27 80 183 96 88 - - - - - 2N. Mex. 20 22 36 67 126 121 - - - - - -Ariz. 54 41 352 395 130 170 - 1 - - 1 -Utah 6 11 64 52 26 20 - - - - - 3Nev. 10 4 52 72 42 43 - - - - - 7
PACIFIC 94 137 1,735 3,079 998 1,129 - 29 - 18 47 21Wash. 5 6 134 256 127 96 - 13 - 2 15 3Oreg. 18 31 68 156 95 103 - 4 - - 4 -Calif. 43 34 1,516 2,641 751 909 - 10 - 11 21 14Alaska 6 43 14 13 9 10 U - U - - 1Hawaii 22 23 3 13 16 11 - 2 - 5 7 3
Guam - 1 - 1 - 10 U - U - - -P.R. 1 4 119 228 173 255 - - - - - 2V.I. - - - - - - U - U - - -Amer. Samoa U U U U U U U U U U U UC.N.M.I. - U - U 32 U U - U - - U
Measles (Rubeola)

Vol. 50 / No. 45 MMWR 1025
MeningococcalDisease Mumps Pertussis Rubella
Cum. Cum. Cum. Cum. Cum. Cum. Cum. Cum.2001 2000 2001 2001 2000 2001 2001 2000 2001 2001 2000Reporting Area
TABLE III. (Cont’d) Provisional cases of selected notifiable diseases preventableby vaccination, United States, weeks ending November 10, 2001,
and November 11, 2000 (45th Week)*
UNITED STATES 1,871 1,909 1 191 284 30 4,035 6,068 - 21 165
NEW ENGLAND 98 116 - - 4 - 366 1,584 - - 12Maine 4 8 - - - - 21 41 - - -N.H. 13 12 - - - - 28 117 - - 2Vt. 5 3 - - - - 28 216 - - -Mass. 50 66 - - 1 - 267 1,150 - - 8R.I. 4 9 - - 1 - 5 18 - - 1Conn. 22 18 - - 2 - 17 42 - - 1
MID. ATLANTIC 186 223 - 20 25 3 259 619 - 5 9Upstate N.Y. 55 64 - 3 10 3 127 302 - 1 1N.Y. City 34 39 - 10 6 - 44 78 - 3 8N.J. 43 46 - 3 3 - 18 30 - 1 -Pa. 54 74 - 4 6 - 70 209 - - -
E.N. CENTRAL 223 342 - 18 22 1 556 711 - 3 1Ohio 67 80 - 1 7 - 219 309 - - -Ind. 35 38 - 3 1 - 78 93 - 1 -Ill. 22 77 - 11 6 1 67 103 - 2 1Mich. 57 105 - 3 6 - 125 91 - - -Wis. 42 42 - - 2 - 67 115 - - -
W.N. CENTRAL 134 136 - 7 17 3 297 514 - 3 2Minn. 20 20 - 3 - - 146 314 - - 1Iowa 28 32 - - 7 - 26 48 - 1 -Mo. 47 61 - - 4 2 92 74 - 1 -N. Dak. 6 2 U - 1 U 4 6 U - -S. Dak. 5 5 - - - - 4 7 - - -Nebr. 14 7 - 1 2 - 4 26 - - 1Kans. 14 9 - 3 3 1 21 39 - 1 -
S. ATLANTIC 338 260 - 36 41 6 230 443 - 7 112Del. 4 1 - - - - - 8 - 1 1Md. 38 26 - 6 9 1 33 111 - - -D.C. - - - - - - 1 3 - - -Va. 37 38 - 8 9 - 41 98 - - -W. Va. 12 13 - - - - 3 1 - - -N.C. 61 36 - 5 7 5 68 98 - - 82S.C. 33 21 - 5 10 - 31 28 - 2 27Ga. 46 43 - 7 2 - 27 38 - 1 -Fla. 107 82 - 5 4 - 26 58 - 3 2
E.S. CENTRAL 121 125 - 9 5 - 129 105 - - 6Ky. 20 26 - 3 1 - 35 52 - - 1Tenn. 56 53 - 1 2 - 55 32 - - 1Ala. 30 33 - - 2 - 35 18 - - 4Miss. 15 13 - 5 - - 4 3 - - -
W.S. CENTRAL 282 203 1 12 29 1 422 343 - 1 8Ark. 18 12 U 1 1 U 43 34 U - 1La. 61 43 - 2 5 - 2 19 - - 1Okla. 27 26 - - - - 18 47 - - -Tex. 176 122 1 9 23 1 359 243 - 1 6
MOUNTAIN 82 82 - 11 19 7 1,173 697 - 1 2Mont. 4 4 U 1 1 U 35 35 U - -Idaho 7 7 - 1 - 1 170 57 - - -Wyo. 5 - - 1 1 - 1 4 - - -Colo. 30 30 - 1 - 4 242 410 - 1 1N. Mex. 10 9 - 2 1 2 135 85 - - -Ariz. 13 22 - 1 4 - 498 70 - - 1Utah 7 7 - 1 6 - 74 24 - - -Nev. 6 3 - 3 6 - 18 12 - - -
PACIFIC 407 422 - 78 122 9 603 1,052 - 1 13Wash. 60 51 - 2 9 6 142 359 - - 7Oreg. 40 62 N N N 3 48 106 - - -Calif. 292 293 - 39 85 - 374 528 - - 6Alaska 2 8 U 1 8 U 8 21 U - -Hawaii 13 8 - 36 20 - 31 38 - 1 -
Guam - - U - 14 U - 4 U - 1P.R. 4 9 - - - - 2 9 - - -V.I. - - U - - U - - U - -Amer. Samoa U U U U U U U U U U UC.N.M.I. - U U - U U - U U - U
N: Not notifiable. U: Unavailable. - : No reported cases.* Incidence data for reporting year 2001 are provisional and cumulative (year-to-date). Incidence data for reporting year 2000 are finalized and
cumulative (year-to-date).

1026 MMWR November 16, 2001
TABLE IV. Deaths in 122 U.S. cities,* week endingNovember 10, 2001 (45th Week)
�65 45-64 25-44 1-24 <1Reporting Area
All Causes, By Age (Years)
AllAges
P&I†
Total������65 45-64 25-44 1-24 <1
Reporting Area
All Causes, By Age (Years)
AllAges
P&I†
Total
NEW ENGLAND 532 382 97 38 8 7 43Boston, Mass. 136 77 38 15 3 3 11Bridgeport, Conn. 51 41 6 4 - - 5Cambridge, Mass. 17 15 1 1 - - 2Fall River, Mass. U U U U U U UHartford, Conn. 46 28 10 6 - 2 2Lowell, Mass. 19 15 4 - - - 2Lynn, Mass. 10 8 - 1 1 - 2New Bedford, Mass. 29 25 2 2 - - 2New Haven, Conn. 35 29 4 1 - 1 5Providence, R.I. 53 37 13 1 2 - -Somerville, Mass. 8 6 - 1 1 - -Springfield, Mass. 33 26 5 1 - 1 3Waterbury, Conn. 39 33 5 1 - - 6Worcester, Mass. 56 42 9 4 1 - 3
MID. ATLANTIC 2,292 1,483 454 279 49 24 136Albany, N.Y. 52 32 14 4 - 2 3Allentown, Pa. 17 14 2 1 - - 2Buffalo, N.Y. 69 54 7 4 2 2 4Camden, N.J. 17 11 5 1 - - 1Elizabeth, N.J. 17 12 2 3 - - -Erie, Pa.§ 46 37 6 2 1 - 7Jersey City, N.J. 53 34 11 5 2 1 -New York City, N.Y. 1,388 825 302 217 32 9 62Newark, N.J. U U U U U U UPaterson, N.J. 17 9 5 - - 3 1Philadelphia, Pa. 233 165 43 15 6 4 20Pittsburgh, Pa.§ 38 28 7 3 - - 4Reading, Pa. 24 19 2 3 - - 1Rochester, N.Y. 120 85 23 9 2 1 8Schenectady, N.Y. 25 17 5 2 1 - 4Scranton, Pa.§ 25 23 2 - - - 2Syracuse, N.Y. 97 77 9 6 3 2 12Trenton, N.J. 30 22 5 3 - - 2Utica, N.Y. 24 19 4 1 - - 3Yonkers, N.Y. U U U U U U U
E.N. CENTRAL 1,514 1,045 305 84 43 37 103Akron, Ohio 52 36 6 4 4 2 5Canton, Ohio 41 31 5 1 4 - 9Chicago, Ill. U U U U U U UCincinnati, Ohio 99 66 19 1 3 10 11Cleveland, Ohio 130 89 27 10 2 2 6Columbus, Ohio U U U U U U UDayton, Ohio 131 94 27 4 3 3 8Detroit, Mich. 202 123 50 18 6 5 9Evansville, Ind. 52 37 11 2 1 1 1Fort Wayne, Ind. 51 38 10 2 1 - 3Gary, Ind. 20 12 4 3 1 - 2Grand Rapids, Mich. 42 22 10 2 2 6 2Indianapolis, Ind. 226 152 50 15 6 3 12Lansing, Mich. 40 35 3 1 1 - 2Milwaukee, Wis. 105 76 23 5 1 - 6Peoria, Ill. 51 35 13 2 1 - 2Rockford, Ill. 55 43 7 4 - 1 8South Bend, Ind. 59 46 9 2 1 1 6Toledo, Ohio 106 71 23 5 4 3 8Youngstown, Ohio 52 39 8 3 2 - 3
W.N. CENTRAL 644 445 126 45 21 7 49Des Moines, Iowa U U U U U U UDuluth, Minn. U U U U U U UKansas City, Kans. 38 25 7 5 1 - 1Kansas City, Mo. 94 63 17 8 3 3 17Lincoln, Nebr. 44 30 9 4 1 - 4Minneapolis, Minn. 170 126 30 7 6 1 17Omaha, Nebr. 99 72 16 5 4 2 4St. Louis, Mo. 93 54 23 11 4 1 1St. Paul, Minn. U U U U U U UWichita, Kans. 106 75 24 5 2 - 5
U: Unavailable. -:No reported cases.* Mortality data in this table are reported voluntarily from 122 cities in the United States, most of which have populations of >100,000. A death
is reported by the place of its occurrence and by the week that the death certificate was filed. Fetal deaths are not included.† Pneumonia and influenza.§ Because of changes in reporting methods in this Pennsylvania city, these numbers are partial counts for the current week. Complete
counts will be available in 4 to 6 weeks.¶ Total includes unknown ages.
S. ATLANTIC 1,100 666 271 102 36 23 72Atlanta, Ga. 149 84 42 15 3 5 3Baltimore, Md. 212 122 52 26 8 3 26Charlotte, N.C. 117 76 20 8 5 8 15Jacksonville, Fla. 120 77 29 10 3 1 9Miami, Fla. U U U U U U UNorfolk, Va. 53 29 15 6 3 - 2Richmond, Va. 58 33 11 7 2 5 -Savannah, Ga. 36 26 7 3 - - 3St. Petersburg, Fla. 45 28 11 3 3 - 2Tampa, Fla. 200 130 53 14 2 - 11Washington, D.C. 100 59 23 10 7 1 1Wilmington, Del. 10 2 8 - - - -
E.S. CENTRAL 863 573 178 72 24 13 55Birmingham, Ala. 168 104 41 11 7 2 12Chattanooga, Tenn. 67 46 13 5 3 - 5Knoxville, Tenn. 99 77 15 6 - 1 2Lexington, Ky. 81 54 18 6 2 1 9Memphis, Tenn. 173 105 38 23 3 4 11Mobile, Ala. 98 68 17 6 5 2 2Montgomery, Ala. 35 24 8 3 - - 3Nashville, Tenn. 142 95 28 12 4 3 11
W.S. CENTRAL 1,419 956 275 109 39 38 80Austin, Tex. 89 51 26 7 3 2 4Baton Rouge, La. 43 38 2 2 - 1 2Corpus Christi, Tex. 51 37 6 2 1 5 6Dallas, Tex. 206 133 40 19 10 4 13El Paso, Tex. 65 51 10 1 2 1 1Ft. Worth, Tex. 126 93 22 6 2 3 7Houston, Tex. 406 246 96 43 10 11 18Little Rock, Ark. 71 46 15 6 1 2 3New Orleans, La. U U U U U U USan Antonio, Tex. 189 138 30 11 3 6 12Shreveport, La. 57 35 11 5 3 3 6Tulsa, Okla. 116 88 17 7 4 - 8
MOUNTAIN 875 600 163 71 19 22 64Albuquerque, N.M. 122 84 22 12 3 1 8Boise, Idaho 48 39 5 4 - - 3Colo. Springs, Colo. 42 22 11 8 1 - -Denver, Colo. 117 80 19 9 4 5 11Las Vegas, Nev. 211 140 44 16 3 8 16Ogden, Utah 30 19 6 2 1 2 -Phoenix, Ariz. U U U U U U UPueblo, Colo. 28 19 6 3 - - 2Salt Lake City, Utah 141 94 29 10 4 4 15Tucson, Ariz. 136 103 21 7 3 2 9
PACIFIC 1,543 1,115 279 99 24 25 120Berkeley, Calif. 20 11 5 4 - - 1Fresno, Calif. 137 97 24 11 3 2 12Glendale, Calif. 27 22 4 1 - - 1Honolulu, Hawaii 50 41 7 2 - - 1Long Beach, Calif. 80 56 17 2 2 3 9Los Angeles, Calif. 420 294 85 27 6 8 19Pasadena, Calif. 31 24 6 1 - - 7Portland, Oreg. 151 113 28 7 2 1 11Sacramento, Calif. 175 115 36 15 7 2 18San Diego, Calif. 152 115 24 8 2 2 20San Francisco, Calif. U U U U U U USan Jose, Calif. U U U U U U USanta Cruz, Calif. 21 19 1 1 - - 2Seattle, Wash. 116 86 16 10 2 2 9Spokane, Wash. 66 48 14 2 - 2 5Tacoma, Wash. 97 74 12 8 - 3 5
TOTAL 10,782¶ 7,265 2,148 899 263 196 722

Vol. 50 / No. 45 MMWR 1027
Contributors to the Production of the MMWR (Weekly)
Weekly Notifiable Disease Morbidity Data and 122 Cities Mortality Data
Samuel L. Groseclose, D.V.M., M.P.H.Wayne S. Brathwaite
State Support Team CDC Operations TeamRobert Fagan Carol M. KnowlesJose Aponte Deborah A. AdamsGerald Jones Willie J. AndersonDavid Nitschke Lateka M. DammondScott Noldy Patsy A. HallJim Vaughan Mechele A. HesterCarol A. Worsham Felicia J. Connor
Pearl Sharp
Informatics
T. Demetri Vacalis, Ph.D.
Michele D. Renshaw Erica R. Shaver
All MMWR references are available on the Internet at <http://www.cdc.gov/mmwr/>. Use the search functionto find specific articles.
Use of trade names and commercial sources is for identification only and does not imply endorsement by theU.S. Department of Health and Human Services.
References to non-CDC sites on the Internet are provided as a service to MMWR readers and do not constituteor imply endorsement of these organizations or their programs by CDC or the U.S. Department of Health andHuman Services. CDC is not responsible for the content of pages found at these sites.

The Morbidity and Mortality Weekly Report (MMWR) Series is prepared by the Centers for Disease Control andPrevention (CDC) and is available free of charge in electronic format and on a paid subscription basis for papercopy. To receive an electronic copy on Friday of each week, send an e-mail message to [email protected] body content should read SUBscribe mmwr-toc. Electronic copy also is available from CDC’s World-Wide Webserver at http://www.cdc.gov/mmwr or from CDC’s file transfer protocol server at ftp://ftp.cdc.gov/pub/Publi-cations/mmwr. To subscribe for paper copy, contact Superintendent of Documents, U.S. Government PrintingOffice, Washington, DC 20402; telephone (202) 512-1800.
Data in the weekly MMWR are provisional, based on weekly reports to CDC by state health departments. Thereporting week concludes at close of business on Friday; compiled data on a national basis are officially releasedto the public on the following Friday. Address inquiries about the MMWR Series, including material to beconsidered for publication, to: Editor, MMWR Series, Mailstop C-08, CDC, 1600 Clifton Rd., N.E., Atlanta, GA30333; telephone (888) 232-3228.
All material in the MMWR Series is in the public domain and may be used and reprinted without permission;citation as to source, however, is appreciated.
IU.S. Government Printing Office: 2002-733-100/49025 Region IV
Director, Centers for DiseaseControl and Prevention
Jeffrey P. Koplan, M.D., M.P.H.
Deputy Director for Science andPublic Health, Centers for DiseaseControl and Prevention
David W. Fleming, M.D.
Director,Epidemiology Program Office
Stephen B. Thacker, M.D., M.Sc.
Editor, MMWR SeriesJohn W. Ward, M.D.
Acting Managing Editor, MMWR(Weekly)
Teresa F. Rutledge
Writers-Editors, MMWR (Weekly)Jill CraneDavid C. Johnson
Desktop PublishingLynda G. CupellMorie M. Higgins
1028 MMWR November 16, 2001