cocos (1996), 11,53 - 68 printed in sri lanka coconut palms used for this trial were around 40 years...
TRANSCRIPT

COCOS (1996), 11,53 - 68 Printed in Sri Lanka
R E D U C T I O N O F E X P E R I M E N T A L E R R O R I N C O C O N U T W I T H A D J U S T M E N T B Y A N I N T E G R A T E D I N D E X D E V E L O P E D
T H R O U G H P R I N C I P A L C O M P O N E N T A N A L Y S I S U S I N G V E G E T A T I V E A N D R E P R O D U C T I V E C H A R A C T E R S
D T Matties, H A j Gunathilaka and D N S Fernando
Coconut Research Institute, Lunuwila, Sri Lanka
ABSTRACT
Precision in estimation and accuracy of the results from experiments is dependent on the nature of experimental variation. Controlling variation through calibration,. other than through local control, is a well defined concept since 1953.
It is important that the choice of a calibrating variate or variates to be, cost effective, less time consumsing in recording, and efficient in reducing the experimental error. For experiments in coconut, one and two years pre-experimental yield is used as calibrating variates. Collecting yield data over a period of one or two
' years to use as a calibrating variate is a long wait before commencement of an experiment: Financially too it is high.
* This paper explores the merits of using, an 'Integrated Index' .(incorporating the vegetative and reproductive characters) as a calibrating variate evaluated through the technique of 'Principal Component Analysis'. The characters were, .'Trunk Girth (X , ) ' , 'Number of Inflorescences (Xj) ' , and Number of nuts per bunch ( X 3 ) ' , and 'Number of green fronds QQ\ The Integrated Index - I ' developed through principal component analysis reflects the 'Vigour of the P a l m \
The eigen vectors of the four characters and the eigen values of the four vectors were evaluated through Principal Component Analysis. The standardized, vector scores for each palm was taken as the Integrated Index for each palm. The average of these values for a given experimental plot was taken as the Index for each.plot and was used as the calibrating variate.
The results suggest that, the overall range in the values for the 'coefficient of variation' when adjusted for T was 7.05 to 10.78% as compared to the range, 8.35 to 21.02% observed without adjustment.
The recording of variables X , to X* was completed within 3 to 4 days before the
53
commencement of the trial. Thus recording of the characters was less time consuming and cost effective.
INTRODUCTION
Success of field experiments on perennial crops is greatly dependent on the kind of experimental variation (or the "Noise" of the experiment). Lower the variation, higher the precision in estimation and the comparison of the treatment differences. However existence of high variation in perennial crop experimentation is well known. In controlling this variation great effort is made towards selecting the material and land. High genetic variability in coconut, however reduces the effectiveness of such measures of controlling variation. Conscious of this situation and working towards controlling such variation,the concept of "Calibration" took its pride (Pearce 1953). Pearce defined calibration as, the use of some prior information pertaining to a given experimental material to control (by statistical means) its variability during the experimental phase.
As demonstrated later by Pearce & Brown(1960), Vernon & Morris (1964), Moore & Pearce(1976) this technique could contribute in a very large measure towards the success of field experiments on perennial crops through the proper choice of a calibrating variate or variates. One of the most important criterion in'the choice of a calibrating variate.is that, it should be free of the treatment effects.
Field experiments in coconut, in general occupies a large extent of land and is conducted over a period of time. An experiment with 6 treatments and four replicates needs a land space of 2 hectares with guard rows. The yield recording being done at two monthly intervals. Thus it is very important that the choice of a calibrating variate or variates of the day to be, cost effective, less time consuming in recording and finally efficient in reducing the experimental variation. Peiris and Salgado (1937), tried to improve on the experimental error in coconut through the choice of large plot size (18 palms), which is more than twice the present plot size (8 palms). Abeywardena (1970) and Abeysinghe (1986), used one and two years pre-experimental yield data as calibrating variates with reduced plot size (6 to 8 palms). They were able to achieve coefficients of variation in the range 6 to 14% after adjustment.
Collecting yield data over a .period of one or two years to use as a calibrating variate is a long wait before the commencement of an experiment. It could even frustrate the Scientist. Financially too it is high. Nonetheless it was the choice of the day. Other than using the yield as a calibrating variate/s there are other variates; 'vegetative' and 'reproductive' in character that could be measured or counted at the commencement or after imposing the treatments. These variates are described elsewhere.
54

This paper explores the relative merits of using these vegetative and reproductive characters individually. It is also described here the use of an 'Integrated Index' (incorporating the vegetative and reproductive characters ) , as a calibrating variate evaluated through the technique of 'Principal Component Analysis'.
MATERIALS AND METHODS
The data for this study were obtained from two field experiments (Exp-1, Exp-2) carried on adult coconut palms conducted by the Coconut Research Institute, of Sri. Lanka in the Intermediate Zone and at the same locality.
Exp-1 (Rehabilitation trial)
The coconut palms used for this trial were around 40 years old and were about 10 meters in height. The experiment consisted of ten (10) different rehabilitation treatments and a control. A randomized block design with three replicates were used. A plot consisted of 8 effective palms With a guard row. The planting was square with 8 meters between the palms. Total of six harvests during an year was taken as the total yield for a given experimental year. For the purpose of this study total yields for the experimental years were used. The experimental years are defined as E,Y, to E,YS.
Exp-2 (Ploughing trial)
• The status of the coconut palms used was as similar to that of the Exp-1. The planting density and the plot size too were similar. The experiment consisted of six different ploughing methods and a control. Here too a randomized block design with three replicates were used. The experiment commenced in simultaneously with the Exp-1. For the purpose of this study total yields for the experimental years were used. The experimental years are defined as EjY, to EjYs.
Additional Measurements
At the time of commencement of these two trials, the following vegetative and reproductive characters were measured or counted by sending a climber up in the tree: X | - Trunk girth just below the crown ( mean of two measurements taken one
foot apart. X ] = Number of open infloresences x 3 = Number of nuts per bunch (averaged over all opened infloresences and
mature bunches). x« - Number of green fronds present.
The capacity for the trees to produce different yields is dependent upon these
55

characters. I f we consider die concept of "Plant Vigour" it would be reasonable to expect that more often man not a more vigorous palm will have a large trunk girth (x ( ) , more bunches ( x j , more nuts per bunch (x 3) , and more fronds ( x j .
In order to represent the plant vigour an 'Integrated Index-(T)' was developed through the use of Principal Component Analysis of the correlation matrix derived from the four variables x, to x« and select the Eigen Vector wherein the vector elements, corresponding to the four variables, all show positive signs and are nearly of equal dimensions. In this case the vector elements should approximate to 0.5, 0.5, 0.5, 0.5 if plant vigour is to reflect in equal measure by all four characters. The integrated index for each plant was used as a calibrating variate and compared -with the use of variables x, to x, in reducing the experimental error in field experiments on coconut.
Integrated Index (I)
The Eigen vectors of the four characters and Eigen values of the four vectors were evaluated through Principal Component Analysis. The standardized vector scores for each palm in respect of the vector would indicate how 'Vigorous' a given palm is. This standardized vector score is taken as the Integrated Index (I) for each palm. The average of these values for a given experimental plot (8 palms) is taken as the Integrated Index for each plot and was used as the calibrating variate. The value Ii for each palm is given by;
where, Zy = (x 8 - X j J / s , and £ a, = 1
Gain in Precision due to Reduction in Error
The precision of an experiment is given by the coefficient of variation (CV). Reduction in the coefficient of variation measures the gain in precision. As stated by Cochran (1957) the gain in precision through the use of, covariance analysis depends on the absolute size of the "Within group correlation coefficient". Measure of this correlation coefficient (r) could be considered as "Relative Calibrating Efficiency" (RCE).
RESULTS
Principal Component Analysis
The principal component analysis of the correlation matrix of the four vegetative and reproductive characters (x, to x j gave rise to the Eigen vectors and Eigen roots of the two experiments (Tables 1 and 2).
56

Table 1. Eigen Vectors and Eigen Values of the Vectors (Exp-1)
Vector Vector Elements (aj) Proportion of variance
Trunk No. of No. of No. of Eigen accounted girth bunches nuts per bunch fronds value by the vector
«i a*
v , 0.3032 0.5067 0.5734 . 0.5680 2.1961 54.9 % v 2 0.8736 -0.4524 -0.1536 0.0923 0.9598 24.0 % v s 0.3770 0.6794 -0.2128 -0.5925 0.4544 11.4 % v 4 -0.0523 0.2776 -0.7761 0.5638 0.3897 9.7 %
57

Table 2. Eigen Vectors and Eigen Values of the Vectors (Exp-2)
Vector Elements ty) Proportion of
Trunk No. of No.of nuts No. of fronds variance Vector girth bunches per bunch Eigen accounted
value by the a i * 2 * 3 *4 vector
V , 0.4123 0.4810 0.5624 0.5313 1.9859 49.6 %
V 2 0.7347 -0.5638 -0.2873 0.2445 0:8856 22.1 %
V , 0.5266 0.5052 -0.2009 -0.6535 0.6421 16.1 %
V 4 -0.1135 0.4421 -0.7488 0.4805 0.4864 12.2 %
58

Exp-i
Table 3. Within group Correlation Coefficients between yield vs x1 to x4 and I.
Experimental Girth No. of No. of nuts No. of Integrated Index Year bunches per bunch . fronds
x 2 . 1
E,Y, -0.0565 0.2184 0.1649 0.1501 0.1990
E,Y 2 0.2406 0.1873 0 .7049** * 0.5593*+ 0 . 8 6 6 1 * * *
E,Y, 0.2439 0.0465 0.4099* 0.2799 0.5679**
E,Y 4 0.2718 0.3135 0.4823* 0.4773* 0 .5520**
E,Y S 0.3065 0.0447 0.4533* 0.2963 0.6362**
*p = 0.05 * * p - 0.01 * * * p = 0.001
59

Exp-2
Table 4. Within group Correlation Coefficients between yield vs x, to x4 and I.
Experimental Girth No. of No. of nuts No. of fronds Integrated Index Year bunches per bunch
I
EzY, 0.0409 -0.0979 -0.3188 -0.0094 -0.1222
E,Y 2 0.5617** 0.2739 0 .7755*** 0 .6458** 0 .8745***
EjYj 0.5929** 0.4456 0 . 8 2 9 1 * * * 0 .7939* * * 0 .8677** *
E:Y 4 0 .6321* * 0.3077 0.6469** 0.5052* 0 .5761* *
E,Y 5 0.2156 -0.1206 -0.0800 0.1641 0.0722
*p=0 .05 * * p = 0 . 0 1 * * * p = 0 . 0 0 1
60
Exp-1
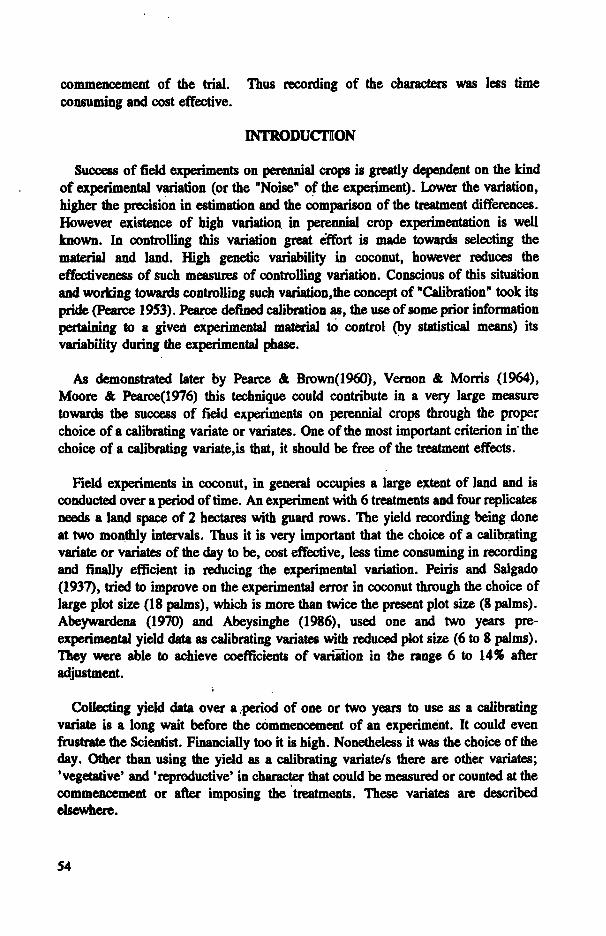
Table 5. Coefficient of variation (%) for the yield without and with adjustment by the Covariates x, to x4 and I
Exp. Without Adjustment with Year adjustment Covariates
X| x 2 x 3 X4 . I
E,Y, 8.96 9.18 8.97 9.07 9.09 9.01
E,Y 2 21.02 20.93 21.18 15.30 17.88 10.78
E,Y, 17.06 16.97 17.48 15.96 16.80 10.40
E,Y 4 12.34 12.18 12.02 11.09 11.12 9.56
E,Y 3 9.96 9.73 10.21 9.11 9.76 7.89
61
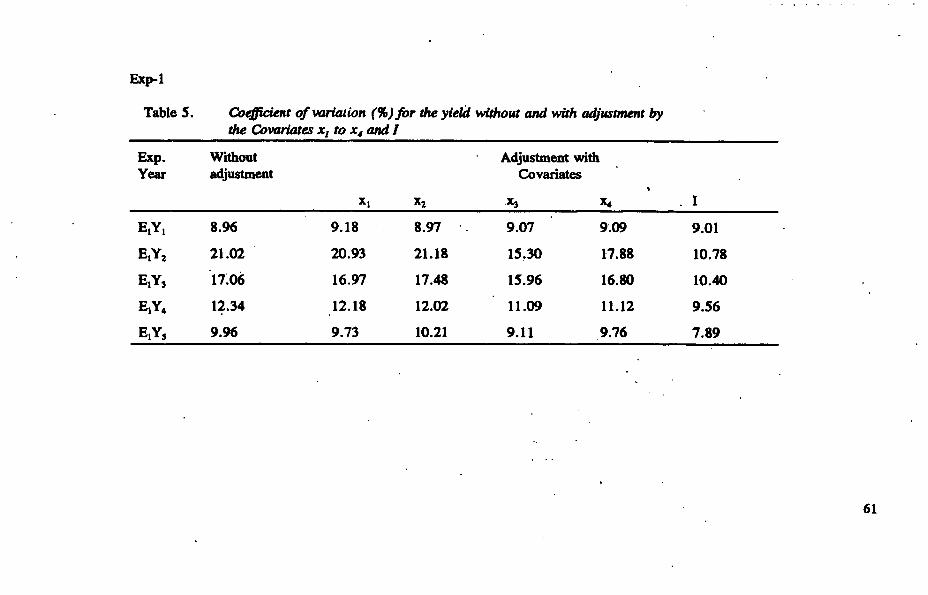
Table 6. Coefficient of Variation (%) for the yield without and with after adjustment by die variates xt to x4 and I
Exp. year
Without adjustment
Adjustment with Covariates .
X3 » 4 I
8.35 8.58 8.55 8.14 8.59 8.02
14.28 12.16 14.13 9.28 11.21 7.13
15.50 12.85 14.28 8.92 9.71 7.93
E,Y 4 8.99 7.17 8.80 7.56 7.98 7.05
EjY. 9.33 9.37 9.53 9.57 9.47 9.07
62

Table 7. Average yields for the Control Treatment and adjusted & unadjusted CV values over the trial period
Exp. Exp. Year
No. of Nuts/palm (control) Unadj.
C V values (%)
Adj.(x 3) Adj.( I )
E,Y, 59.7 8.96 9.17 9.01
E,Y 2 44.3 21.02 15.30 10.78
E,Y, 32.3 17.06 15.96 10.40 Exp-1
E,Y, Exp-1
, E,Y 4 72.3 12.34 11.09 9.56
E,Y S 63.4 9.96 9.11 7.89
E.Y, 53.4 8.35 8.14 8.02
E2Y2 36.3 14.28 9.28 7.13
E ^ , 29.8 15.50 8.92 7.93
Exp-2 E2Y4 71.6 8.99 7.56 7.05
EzY s 68.6 9.33 9.57 9.07

For the two experiments the first vector (V,) has the Vector Elements all positive and each approximating to 0.5. This vector also explains 54.9 % and 49.6 % of total variation for the two experiments. Thus for all intents and purposes this vector reasonably fulfills the requirement of an integrated expression of the correspondence between these four characters and may be construed as an index of "Plant Vigour".
The integrated index for the ith palm is;
Exp.l Ij = (0.3032)(x., - \i)/st + (0.5067)(Xn - x j / s , + ... Exp.2 L. - (0.4123)(Xi, - x,)/s, + (0.4810)(xQ - x^/s, + ...
The average of \ over- 8 experimental palms for each plot was taken as a calibrating variate.
Relative Calibrating Efficiency (RCE).
The within group correlation coefficients between characters, x, to x 4 ,the Integrated Index ( I ) , with the experimental yields are shown in tables 3 and 4, for die two experiments.
for the year E,Y, neither of the calibrating variates showed any significant within group correlation with the yield. The variates x, and x 2 showed no relation with the yield for all the experimental years. The variate x* showed a relationship only for the experimental years E,Y 2 and E,Y 4 . However the two calibrating variates x 3 and the Integrated Index showed significant correlations from E,Y 2 onwards. The Index T showed superiority over x 3 in respect of the relative calibrating efficiency. None of the calibrating variates showed any significant relation between the yield for the experimental years EjY, and E 2 Y S . The variable x 2 showed no relation for all the years. The variates x, ,x 3 ,x 0 and T showed significant relationships for the experimental years EjY 2 , EJYJ and EjY,. The Integrated Index T showed superiority over all the variates in respect of relative calibrating efficiency.
Absolute Efficiency
The coefficients of variation for the yield without adjustment and with adjustment using all the calibrating variates are shown in Tables 5 and 6.
The yield without adjustment showed a very low Coefficient of Variation (8.96%) for the experimental year E,Y, and with hardly any difference shown for the calibrating variates x, to ^ and T . The range being 8.97 to 9.07%. The yield showed nigh variabilities of 21.02 and 17.02% for the experimental years E,Y 2 and E,Yj respectively. Considerable reduction in variation was observed for using x 3 and ' I ' as calibrating variates. The index T showed the lowest variabilities of 10.78 and 10.40%. The experimental year E,Y 4 showed a CV of 12.34% for the yield without
64

adjustment and a reduced CV of 9 . 56% was indicated when adjusted with the index T . Very low CV values were observed for the year E,Y 3 for the yield without adjustment and for the calibrating variates; the lowest being for T . The range of values was 7 . 8 9 to 10 .21%.
Exp-2
Very low coefficients of variation was shown for the experimental years EjY,, E2Y2 and E J Y J for the yield without adjustment and also when adjusted with the calibrating variates. The range being 7 . 05 to 9 . 57%. The values for the integrated index T showed the lowest values.
Experimental years EJYJ and Etf, showed high CV values (14 .28 & 15 .50%) for the yield without adjustment. However with adjustment with the integrated index T , the result showed values of CV being reduced to as low as 7 . 1 3 and 7 . 9 3 % respectively.
DISCUSSION
Conducting of an experiment is not without complications. The problems are more when it is a field experiment on a perennial crop where the material used has a large genetic variation. In this respect field experiments on coconut palm is no exception. Various efforts are made by the Experimenter and the Biometrician in controlling variation and evaluating results so as to achieve the objectives of the experiments in it's best form.
The reduction of the experimental error can be ensured very simply by experimenting with uniform experimental material and.under uniform conditions. Well, these are billiard table experiments. In field experiments on biological material, this approach to reducing experimental error is wellnigh impossible. Therefore, for the experiment to be of any practical value, it is necessary to experiment within the natural framework subject to what ever variation there is. The philosophy should be "how can an experimenter do better when faced with fearful odds".
The pioneering attempt in controlling experimental error was through local control with adequate replication. This was achieved through intra-block homogeneity and inter block heterogeneity. However with time it was realized that controlling experimental error in this manner in perennial crops, more often than not was so efficient. It was at this time that the concept of "Calibration" came into being.fPearce 1953).
In case of coconut experiments the reduction of experimental error was achieved through local control assisted by the use of pre-experimental yield data as a
65

calibrating variate. A certain degree of efficiency was achieved through this methodology. However the collection of yield has to be done over two years or at least one year before the commencement of the experiment. This caused concern over many aspects; cost, time etc. It is also a well gathered information that there is a high degree of natural variation due to changes in the weather pattern. Better the rainfall distribution in a given year high is the crop in the subsequent year and vice versa. This is uncontrollable. The fig (1), which is self explanatory will indicate the kind of the yield variation that is generally observed.
The field experiments on coconut are carried out under such conditions of variation. Further it is also o b s e r v e d d i f f e r e n t experimental errors in d i f f e r e n t y e a r s . A b e y s i n g h e ( 1 9 8 6 ) reported that high variability is associated with high yielding years. However the results of the experiments reported inhere suggest a different status (Table 7). The table, shows the average yields for the control treatment and the adjusted & unadjusted CV values for the two experiments over the trial period. For all intents and purposes this average yield indicates the status quo of the weather pattern of the previous year. For the two experiments the years 1987 and 1988 are two poor crop years. It is evident that high variation (CV) is observed when the yields of the crop year are poor.
These results, indicate that no general claim can be made as to the nature of the variation one would observe at the end of the year, when the results are analysed. It is apparent that every experiment is unique and has to be treated in it's own right. What is more important and the prime objective, is to reduce the error through the choice of a calibrating yariate(s) when high variability is observed. Thus priori arming with suitable calibrating variate(s) will be to the best advantage of the Experiment.
In view of these expressed and silent constrains and for other good reasons some vegetative and reproductive characters were measured and counted and used as calibrating variates independently and in association through the use of Principal Component Analysis. The characters were, trunk girth(x,), number of open infloresences(x2), number of nuts per bunch(x3), and number of green fronds(x4). The
l l t t l H l B 101 (
I t
4»
!• ' : 1
I I I 7 • I t I I t l 17 U t l
V t t l l
f i t 1. <• n f y l . t «l » i f l « l l i « I i f l i l l
66

'Integrated Index-I' developed through the. use of Principal Component Analysis using the characters x, to X 4 , reflects the "Vigour of the Palm".
Amongst the characters the number of bunchesfxj) was a poor calibrating variate to consider as an independent variable. However it was a credible variate to be considered in association with the other variables. This was shown by "Vector Elements" in Principal Component Analysis. The two variables x, and x 4 taken independently were marginal in reducing experimental error. Among the four variables, x 3 (no. of nuts per bunch) showed superiority in reducing the experimental error taken independently.
In the Integrated Index developed through the use of Principal Component Analysis, the four variables have shown similar strength in equal measure. This fact is well proved in reducing experimental error when T was used as a calibrating variate. Taking the results of the two experiments together, the overall range in the CV values when adjusted for T was 7,05 to 10.78% as compared to the range 7.56 to 15.96% when adjusted with x 3 as a calibrating variate. The range observed without adjustment was 8.35 to 21.02%.
The results (Tables 5 & 6) indicated that out of 10 experimental situations of analyses in the two experiments, 5 situations showed high variability.' When the variation was low without adjustment, the error reduction through the use of ' I ' was very low or marginal. It may be due to that, there is a limit below which experimental error cannot be reduced. To maintain a variation (CV) of the range 8 to 10% in field experiments for'coconut can be considered as excellent.
In situations when high variations were observed, under unadjusted conditions, the error reduction brought about through the use of T was very commendable. Thus the end result of this study was that the 'Integrated Index-I' developed through the use of Principal Component Analysis could be effectively and efficiently used in reducing experimental error in field experiments in coconut. With little effort the 'Integrated Index-I' could be evaluated with the kind of computers around. The recording of the variables x, to x< could be done within 3 to 4 days before or on commencement of the trial. Thus recording and the use of T is further cost effective and less time consuming.
REFERENCES
Abeysinghe, Tilak. (1986). Calibration of experiments, on perennial crops using covariance analysis: The case of coconut. Expl.Agric. 22: 353-361.
Abeywardana, V. (1970). The efficiency of pre-experimental yield in the calibration of coconut experiments. Ceylon Coconut Quarterly. 21 : 85-91.
67

Cochran, W . G. (1957). Analysis of covariance: its nature and uses. Biometrics. 13 : 261-81.
Moore, C. S. and Pearce, S. C. (1976). Methods of reducing crop variation in apple trials. J. Hon. Sci. 51 : 533-544.
Pearce, S. C. (1953)T«fc. Commun.Commonw. Bur. Hon. Plant. N. Crops No. 23.
Pearce, S. C. and Brown, A. H, F. (1960). Improving fruit tree experiments by a preliminary study of the tree. / . Hort. Sci. 35: 56-65.
Pieris, W . V . D. and Salgado M . L. M . (1937). Experimental error in field experiments with coconut. Tropical Agriculture, Trinidad 89: 75-85.
Vernon, A. J. and Morris M . G. (1964) .Variability in West African peasant cocoa farms; Time studies on agodi cocoa yields. / . Hort. Sci. 39: 241-253.
68