cod (gadus morhua) in subdivisions 22 –24, western baltic ...ices.dk/sites/pub/publication...
TRANSCRIPT
ICES Advice on fishing opportunities, catch, and effort Baltic Sea Ecoregion Published 31 May 2018 cod.27.22-24 Version 2: 8 June 2018 https://doi.org/10.17895/ices.pub.4377
ICES Advice 2018 1
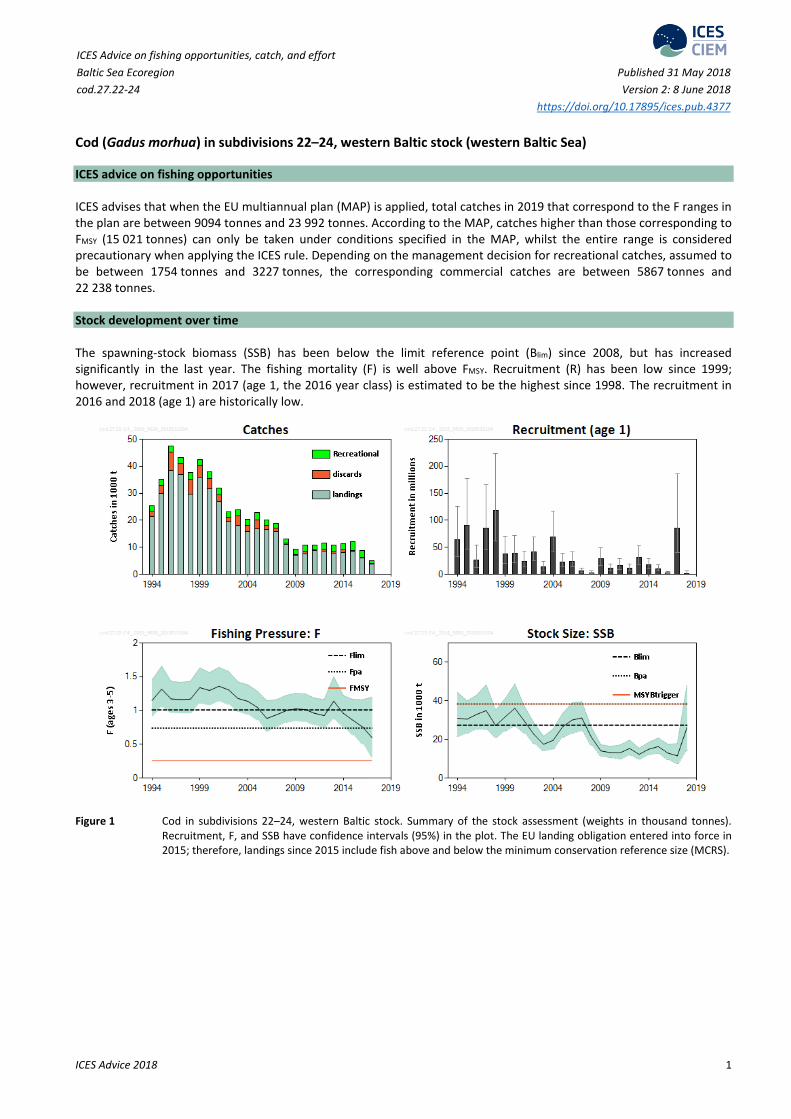
Cod (Gadus morhua) in subdivisions 22–24, western Baltic stock (western Baltic Sea) ICES advice on fishing opportunities ICES advises that when the EU multiannual plan (MAP) is applied, total catches in 2019 that correspond to the F ranges in the plan are between 9094 tonnes and 23 992 tonnes. According to the MAP, catches higher than those corresponding to FMSY (15 021 tonnes) can only be taken under conditions specified in the MAP, whilst the entire range is considered precautionary when applying the ICES rule. Depending on the management decision for recreational catches, assumed to be between 1754 tonnes and 3227 tonnes, the corresponding commercial catches are between 5867 tonnes and 22 238 tonnes. Stock development over time The spawning-stock biomass (SSB) has been below the limit reference point (Blim) since 2008, but has increased significantly in the last year. The fishing mortality (F) is well above FMSY. Recruitment (R) has been low since 1999; however, recruitment in 2017 (age 1, the 2016 year class) is estimated to be the highest since 1998. The recruitment in 2016 and 2018 (age 1) are historically low.
Figure 1 Cod in subdivisions 22–24, western Baltic stock. Summary of the stock assessment (weights in thousand tonnes).
Recruitment, F, and SSB have confidence intervals (95%) in the plot. The EU landing obligation entered into force in 2015; therefore, landings since 2015 include fish above and below the minimum conservation reference size (MCRS).
ICES Advice on fishing opportunities, catch, and effort Published 31 May 2018 cod.27.22-24
ICES Advice 2018 2
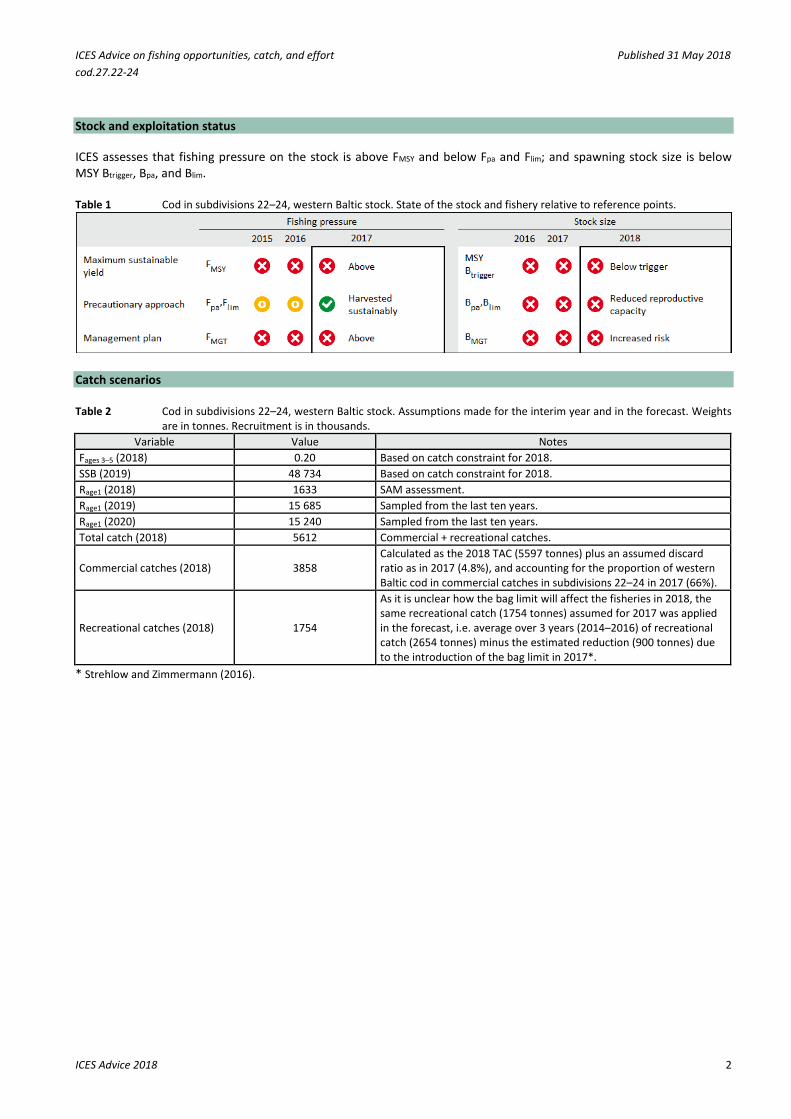
Stock and exploitation status ICES assesses that fishing pressure on the stock is above FMSY and below Fpa and Flim; and spawning stock size is below MSY Btrigger, Bpa, and Blim. Table 1 Cod in subdivisions 22–24, western Baltic stock. State of the stock and fishery relative to reference points.
Catch scenarios Table 2 Cod in subdivisions 22–24, western Baltic stock. Assumptions made for the interim year and in the forecast. Weights
are in tonnes. Recruitment is in thousands. Variable Value Notes
Fages 3–5 (2018) 0.20 Based on catch constraint for 2018. SSB (2019) 48 734 Based on catch constraint for 2018. Rage1 (2018) 1633 SAM assessment. Rage1 (2019) 15 685 Sampled from the last ten years. Rage1 (2020) 15 240 Sampled from the last ten years. Total catch (2018) 5612 Commercial + recreational catches.
Commercial catches (2018) 3858 Calculated as the 2018 TAC (5597 tonnes) plus an assumed discard ratio as in 2017 (4.8%), and accounting for the proportion of western Baltic cod in commercial catches in subdivisions 22–24 in 2017 (66%).
Recreational catches (2018) 1754
As it is unclear how the bag limit will affect the fisheries in 2018, the same recreational catch (1754 tonnes) assumed for 2017 was applied in the forecast, i.e. average over 3 years (2014–2016) of recreational catch (2654 tonnes) minus the estimated reduction (900 tonnes) due to the introduction of the bag limit in 2017*.
* Strehlow and Zimmermann (2016).

ICES Advice on fishing opportunities, catch, and effort Published 31 May 2018 cod.27.22-24
ICES Advice 2018 3
Table 3 Cod in subdivisions 22–24, western Baltic stock. Annual catch scenarios. All weights are in tonnes.
Basis Total
catch * (2019)
Recreational catch
Commercial catch Ftotal (2019) Fcommercial
(2019) SSB (2020) % SSB change ***
% Advice change ^
ICES advice basis EU MAP**: FMSY 15021 1754 13267 0.26 0.23 75334 55 184 F = MAP FMSY lower 9094 1754 7340 0.15 0.12 82691 70 191^^ F = MAP FMSY upper 23992 1754 22238 0.45 0.42 63804 31 NA ^^^ EU MAP**: FMSY 15021 3227‡ 11794 0.26 0.20 75334 55 184 F = MAP FMSY lower 9094 3227‡ 5867 0.15 0.10 82691 70 191^^ Other scenarios FMSY 15021 1754 13267 0.26 0.23 75334 55 184 Zero commercial catch 1754 1754 0 0.03 0.00 91905 89 −67
F = Fpa 35123 1754 33369 0.74 0.70 49290 1 563 F = Flim 43288 1754 41534 1.01 0.97 39365 −19 718 SSB (2020) = Blim 53332 1754 51578 1.46 1.41 27400 −44 907 SSB (2020) = Bpa 44086 1754 42332 1.04 1.00 38401 −21 733 SSB (2020) = MSY Btrigger
44086 1754 42332 1.04 1.00 38401 −21 733
F = F2018 12067 1754 10313 0.2 0.17 78916 62 128 * Includes commercial and recreational catch. ** EU Multi-Annual Plan for the Baltic Sea (EU, 2016a). *** SSB 2020 relative to SSB 2019. ^ Total catch in 2019 relative to total catch corresponding to the advice for 2018 (5295 t, MAP FMSY), including commercial and recreational catch. ^^ Total catch in 2019 relative to total catch corresponding to the advice for 2018 for FMSY lower (3130 t, MAP FMSY lower), including commercial and recreational catch. ^^^ For 2018, no advice was given for FMSY upper and therefore no comparison is made. ‡ Recreational catch scaled proportionally to advised increase in total catch. The high recruitment in 2017 (age 1), together with the assumed large decrease in fishing pressure in 2018 is expected to increase the stock substantially in 2019. This leads to a large increase in the advice for 2019. Basis of the advice Table 4 Cod in subdivisions 22–24, western Baltic stock. The basis of the advice.
Advice basis EU Baltic multiannual plan.
Management plan The EU multiannual plan (MAP) in place for stocks in the Baltic Sea includes cod (EU, 2016a). The advice, based on the FMSY ranges used in the management plan, is considered precautionary.
Quality of the assessment Mixing of the eastern and western Baltic cod stocks is substantial in Subdivision 24. The stock mixing within Subdivision 24 is variable spatially and possibly between seasons and age groups. This introduces uncertainty in the allocation of catches to stock. Catch separation has been applied since 1994 and data for stock separation is available for 12 of the 24 years in the present time-series. The allocation of catches to stock for the remaining years was performed by extrapolation. The longest gap in the data is from 2001 to 2007. A stock-splitting key is available for every year since 2013. The survey data from the main part of Subdivision 24 are not included in the assessment, because it is currently not possible to split the survey data into the stocks. A large part of the commercial fishing is conducted in this area and, therefore, the lack of survey coverage in Subdivision 24 could result in a bias in the assessment. In 2017 the recreational catches (for one nation only) included in the stock assessment constituted 18% of the total catches. The uncertainty around recreational catches is considered higher than in commercial catches.
ICES Advice on fishing opportunities, catch, and effort Published 31 May 2018 cod.27.22-24
ICES Advice 2018 4
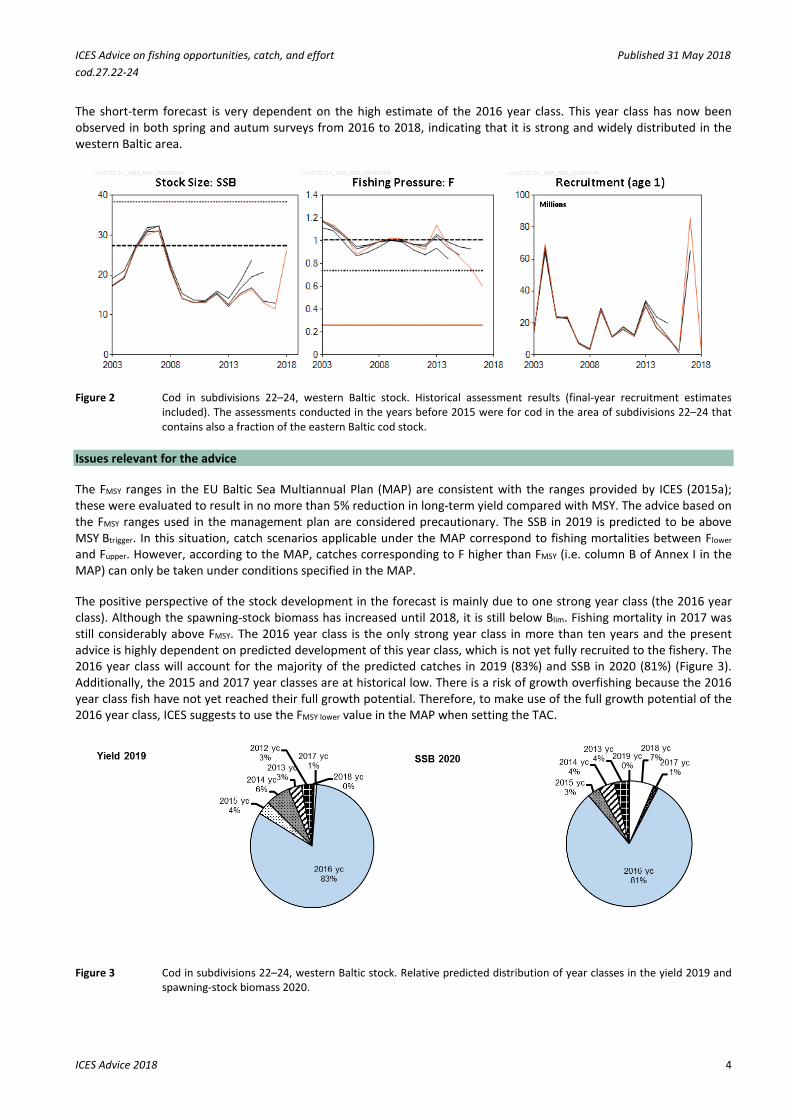
The short-term forecast is very dependent on the high estimate of the 2016 year class. This year class has now been observed in both spring and autum surveys from 2016 to 2018, indicating that it is strong and widely distributed in the western Baltic area.
Figure 2 Cod in subdivisions 22–24, western Baltic stock. Historical assessment results (final-year recruitment estimates
included). The assessments conducted in the years before 2015 were for cod in the area of subdivisions 22–24 that contains also a fraction of the eastern Baltic cod stock.
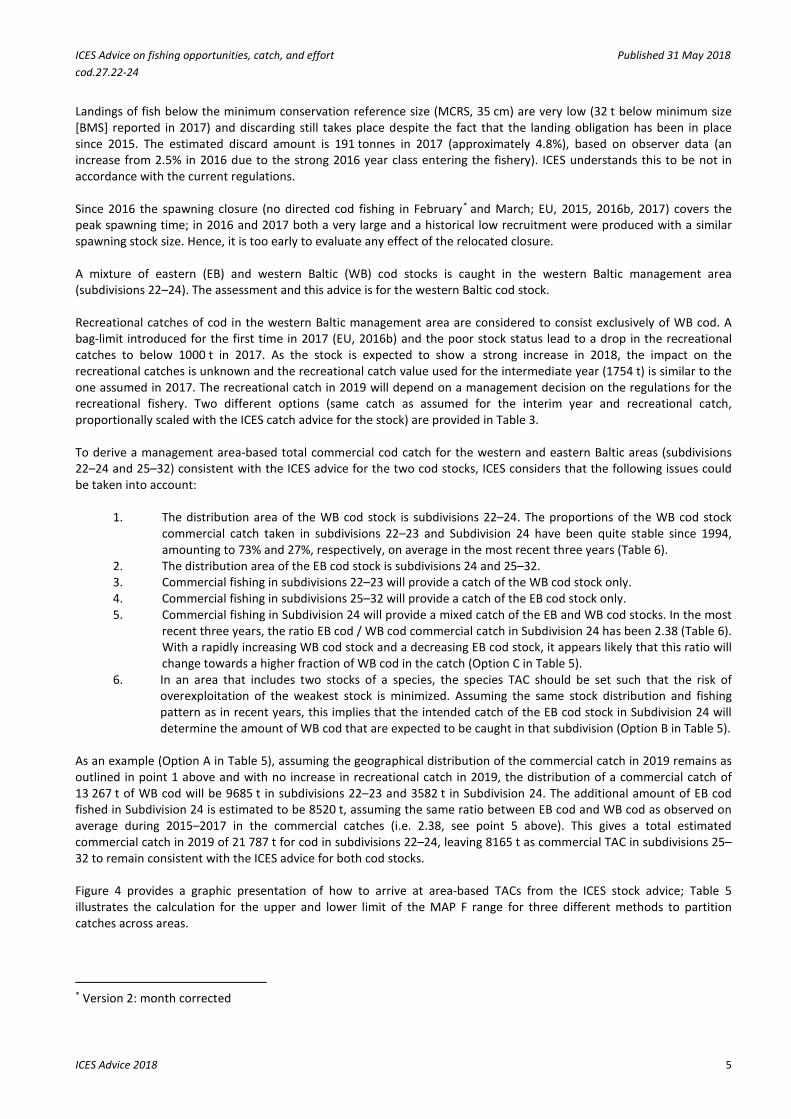
Issues relevant for the advice The FMSY ranges in the EU Baltic Sea Multiannual Plan (MAP) are consistent with the ranges provided by ICES (2015a); these were evaluated to result in no more than 5% reduction in long-term yield compared with MSY. The advice based on the FMSY ranges used in the management plan are considered precautionary. The SSB in 2019 is predicted to be above MSY Btrigger. In this situation, catch scenarios applicable under the MAP correspond to fishing mortalities between Flower and Fupper. However, according to the MAP, catches corresponding to F higher than FMSY (i.e. column B of Annex I in the MAP) can only be taken under conditions specified in the MAP. The positive perspective of the stock development in the forecast is mainly due to one strong year class (the 2016 year class). Although the spawning-stock biomass has increased until 2018, it is still below Blim. Fishing mortality in 2017 was still considerably above FMSY. The 2016 year class is the only strong year class in more than ten years and the present advice is highly dependent on predicted development of this year class, which is not yet fully recruited to the fishery. The 2016 year class will account for the majority of the predicted catches in 2019 (83%) and SSB in 2020 (81%) (Figure 3). Additionally, the 2015 and 2017 year classes are at historical low. There is a risk of growth overfishing because the 2016 year class fish have not yet reached their full growth potential. Therefore, to make use of the full growth potential of the 2016 year class, ICES suggests to use the FMSY lower value in the MAP when setting the TAC.
Figure 3 Cod in subdivisions 22–24, western Baltic stock. Relative predicted distribution of year classes in the yield 2019 and
spawning-stock biomass 2020.
ICES Advice on fishing opportunities, catch, and effort Published 31 May 2018 cod.27.22-24
ICES Advice 2018 5
Landings of fish below the minimum conservation reference size (MCRS, 35 cm) are very low (32 t below minimum size [BMS] reported in 2017) and discarding still takes place despite the fact that the landing obligation has been in place since 2015. The estimated discard amount is 191 tonnes in 2017 (approximately 4.8%), based on observer data (an increase from 2.5% in 2016 due to the strong 2016 year class entering the fishery). ICES understands this to be not in accordance with the current regulations. Since 2016 the spawning closure (no directed cod fishing in February* and March; EU, 2015, 2016b, 2017) covers the peak spawning time; in 2016 and 2017 both a very large and a historical low recruitment were produced with a similar spawning stock size. Hence, it is too early to evaluate any effect of the relocated closure. A mixture of eastern (EB) and western Baltic (WB) cod stocks is caught in the western Baltic management area (subdivisions 22–24). The assessment and this advice is for the western Baltic cod stock. Recreational catches of cod in the western Baltic management area are considered to consist exclusively of WB cod. A bag-limit introduced for the first time in 2017 (EU, 2016b) and the poor stock status lead to a drop in the recreational catches to below 1000 t in 2017. As the stock is expected to show a strong increase in 2018, the impact on the recreational catches is unknown and the recreational catch value used for the intermediate year (1754 t) is similar to the one assumed in 2017. The recreational catch in 2019 will depend on a management decision on the regulations for the recreational fishery. Two different options (same catch as assumed for the interim year and recreational catch, proportionally scaled with the ICES catch advice for the stock) are provided in Table 3. To derive a management area-based total commercial cod catch for the western and eastern Baltic areas (subdivisions 22–24 and 25–32) consistent with the ICES advice for the two cod stocks, ICES considers that the following issues could be taken into account:
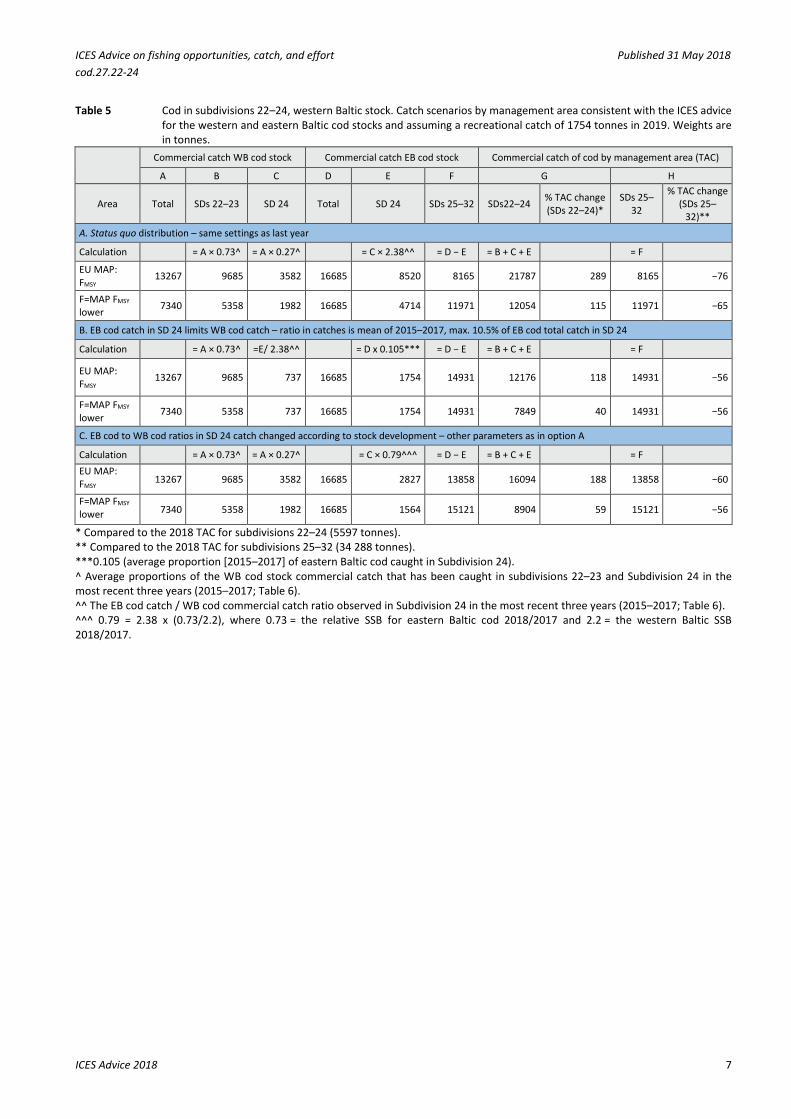
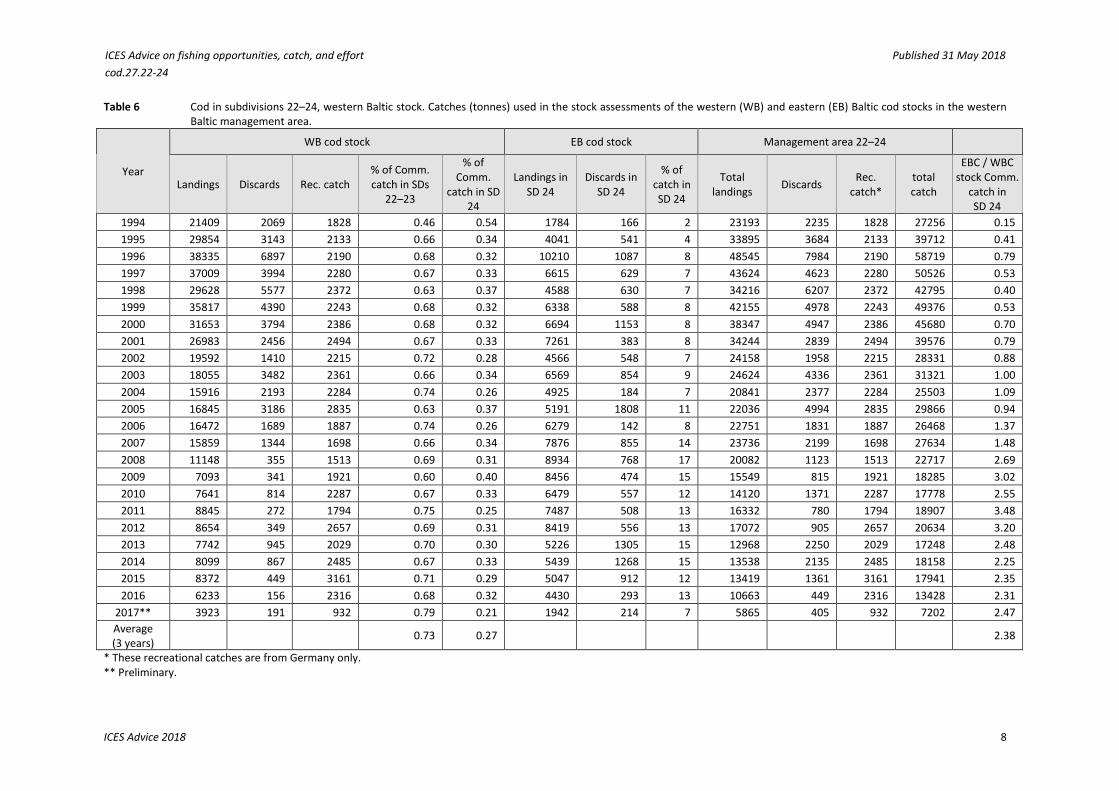
1. The distribution area of the WB cod stock is subdivisions 22–24. The proportions of the WB cod stock commercial catch taken in subdivisions 22–23 and Subdivision 24 have been quite stable since 1994, amounting to 73% and 27%, respectively, on average in the most recent three years (Table 6).
2. The distribution area of the EB cod stock is subdivisions 24 and 25–32. 3. Commercial fishing in subdivisions 22–23 will provide a catch of the WB cod stock only. 4. Commercial fishing in subdivisions 25–32 will provide a catch of the EB cod stock only. 5. Commercial fishing in Subdivision 24 will provide a mixed catch of the EB and WB cod stocks. In the most
recent three years, the ratio EB cod / WB cod commercial catch in Subdivision 24 has been 2.38 (Table 6). With a rapidly increasing WB cod stock and a decreasing EB cod stock, it appears likely that this ratio will change towards a higher fraction of WB cod in the catch (Option C in Table 5).
6. In an area that includes two stocks of a species, the species TAC should be set such that the risk of overexploitation of the weakest stock is minimized. Assuming the same stock distribution and fishing pattern as in recent years, this implies that the intended catch of the EB cod stock in Subdivision 24 will determine the amount of WB cod that are expected to be caught in that subdivision (Option B in Table 5).
As an example (Option A in Table 5), assuming the geographical distribution of the commercial catch in 2019 remains as outlined in point 1 above and with no increase in recreational catch in 2019, the distribution of a commercial catch of 13 267 t of WB cod will be 9685 t in subdivisions 22–23 and 3582 t in Subdivision 24. The additional amount of EB cod fished in Subdivision 24 is estimated to be 8520 t, assuming the same ratio between EB cod and WB cod as observed on average during 2015–2017 in the commercial catches (i.e. 2.38, see point 5 above). This gives a total estimated commercial catch in 2019 of 21 787 t for cod in subdivisions 22–24, leaving 8165 t as commercial TAC in subdivisions 25–32 to remain consistent with the ICES advice for both cod stocks. Figure 4 provides a graphic presentation of how to arrive at area-based TACs from the ICES stock advice; Table 5 illustrates the calculation for the upper and lower limit of the MAP F range for three different methods to partition catches across areas.
* Version 2: month corrected
ICES Advice on fishing opportunities, catch, and effort Published 31 May 2018 cod.27.22-24
ICES Advice 2018 6
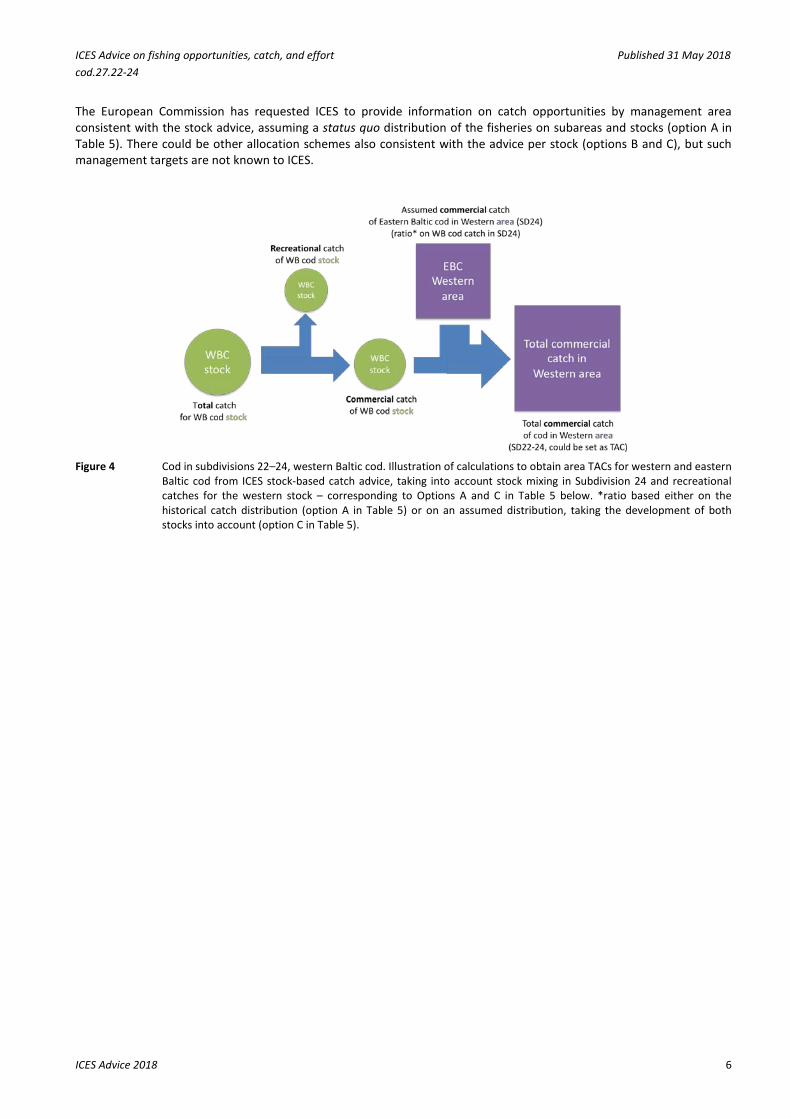
The European Commission has requested ICES to provide information on catch opportunities by management area consistent with the stock advice, assuming a status quo distribution of the fisheries on subareas and stocks (option A in Table 5). There could be other allocation schemes also consistent with the advice per stock (options B and C), but such management targets are not known to ICES.
Figure 4 Cod in subdivisions 22–24, western Baltic cod. Illustration of calculations to obtain area TACs for western and eastern
Baltic cod from ICES stock-based catch advice, taking into account stock mixing in Subdivision 24 and recreational catches for the western stock – corresponding to Options A and C in Table 5 below. *ratio based either on the historical catch distribution (option A in Table 5) or on an assumed distribution, taking the development of both stocks into account (option C in Table 5).
ICES Advice on fishing opportunities, catch, and effort Published 31 May 2018 cod.27.22-24
ICES Advice 2018 7
Table 5 Cod in subdivisions 22–24, western Baltic stock. Catch scenarios by management area consistent with the ICES advice for the western and eastern Baltic cod stocks and assuming a recreational catch of 1754 tonnes in 2019. Weights are in tonnes.
Commercial catch WB cod stock Commercial catch EB cod stock Commercial catch of cod by management area (TAC)
A B C D E F G H
Area Total SDs 22–23 SD 24 Total SD 24 SDs 25–32 SDs22–24 % TAC change (SDs 22–24)*
SDs 25–32
% TAC change (SDs 25–
32)** A. Status quo distribution – same settings as last year
Calculation = A × 0.73^ = A × 0.27^ = C × 2.38^^ = D − E = B + C + E = F EU MAP: FMSY
13267 9685 3582 16685 8520 8165 21787 289 8165 −76
F=MAP FMSY lower 7340 5358 1982 16685 4714 11971 12054 115 11971 −65
B. EB cod catch in SD 24 limits WB cod catch – ratio in catches is mean of 2015–2017, max. 10.5% of EB cod total catch in SD 24
Calculation = A × 0.73^ =E/ 2.38^^ = D x 0.105*** = D − E = B + C + E = F EU MAP: FMSY
13267 9685 737 16685 1754 14931 12176 118 14931 −56
F=MAP FMSY lower 7340 5358 737 16685 1754 14931 7849 40 14931 −56
C. EB cod to WB cod ratios in SD 24 catch changed according to stock development – other parameters as in option A
Calculation = A × 0.73^ = A × 0.27^ = C × 0.79^^^ = D − E = B + C + E = F EU MAP: FMSY 13267 9685 3582 16685 2827 13858 16094 188 13858 −60
F=MAP FMSY lower 7340 5358 1982 16685 1564 15121 8904 59 15121 −56
* Compared to the 2018 TAC for subdivisions 22–24 (5597 tonnes). ** Compared to the 2018 TAC for subdivisions 25–32 (34 288 tonnes). ***0.105 (average proportion [2015–2017] of eastern Baltic cod caught in Subdivision 24). ^ Average proportions of the WB cod stock commercial catch that has been caught in subdivisions 22–23 and Subdivision 24 in the most recent three years (2015–2017; Table 6). ^^ The EB cod catch / WB cod commercial catch ratio observed in Subdivision 24 in the most recent three years (2015–2017; Table 6). ^^^ 0.79 = 2.38 x (0.73/2.2), where 0.73 = the relative SSB for eastern Baltic cod 2018/2017 and 2.2 = the western Baltic SSB 2018/2017.
ICES Advice on fishing opportunities, catch, and effort Published 31 May 2018 cod.27.22-24
ICES Advice 2018 8
Table 6 Cod in subdivisions 22–24, western Baltic stock. Catches (tonnes) used in the stock assessments of the western (WB) and eastern (EB) Baltic cod stocks in the western Baltic management area.
Year
WB cod stock EB cod stock Management area 22–24
Landings Discards Rec. catch % of Comm. catch in SDs
22–23
% of Comm.
catch in SD 24
Landings in SD 24
Discards in SD 24
% of catch in SD 24
Total landings Discards Rec.
catch* total catch
EBC / WBC stock Comm.
catch in SD 24
1994 21409 2069 1828 0.46 0.54 1784 166 2 23193 2235 1828 27256 0.15 1995 29854 3143 2133 0.66 0.34 4041 541 4 33895 3684 2133 39712 0.41 1996 38335 6897 2190 0.68 0.32 10210 1087 8 48545 7984 2190 58719 0.79 1997 37009 3994 2280 0.67 0.33 6615 629 7 43624 4623 2280 50526 0.53 1998 29628 5577 2372 0.63 0.37 4588 630 7 34216 6207 2372 42795 0.40 1999 35817 4390 2243 0.68 0.32 6338 588 8 42155 4978 2243 49376 0.53 2000 31653 3794 2386 0.68 0.32 6694 1153 8 38347 4947 2386 45680 0.70 2001 26983 2456 2494 0.67 0.33 7261 383 8 34244 2839 2494 39576 0.79 2002 19592 1410 2215 0.72 0.28 4566 548 7 24158 1958 2215 28331 0.88 2003 18055 3482 2361 0.66 0.34 6569 854 9 24624 4336 2361 31321 1.00 2004 15916 2193 2284 0.74 0.26 4925 184 7 20841 2377 2284 25503 1.09 2005 16845 3186 2835 0.63 0.37 5191 1808 11 22036 4994 2835 29866 0.94 2006 16472 1689 1887 0.74 0.26 6279 142 8 22751 1831 1887 26468 1.37 2007 15859 1344 1698 0.66 0.34 7876 855 14 23736 2199 1698 27634 1.48 2008 11148 355 1513 0.69 0.31 8934 768 17 20082 1123 1513 22717 2.69 2009 7093 341 1921 0.60 0.40 8456 474 15 15549 815 1921 18285 3.02 2010 7641 814 2287 0.67 0.33 6479 557 12 14120 1371 2287 17778 2.55 2011 8845 272 1794 0.75 0.25 7487 508 13 16332 780 1794 18907 3.48 2012 8654 349 2657 0.69 0.31 8419 556 13 17072 905 2657 20634 3.20 2013 7742 945 2029 0.70 0.30 5226 1305 15 12968 2250 2029 17248 2.48 2014 8099 867 2485 0.67 0.33 5439 1268 15 13538 2135 2485 18158 2.25 2015 8372 449 3161 0.71 0.29 5047 912 12 13419 1361 3161 17941 2.35 2016 6233 156 2316 0.68 0.32 4430 293 13 10663 449 2316 13428 2.31
2017** 3923 191 932 0.79 0.21 1942 214 7 5865 405 932 7202 2.47 Average (3 years)
0.73 0.27 2.38
* These recreational catches are from Germany only. ** Preliminary.
ICES Advice on fishing opportunities, catch, and effort Published 31 May 2018 cod.27.22-24
ICES Advice 2018 9
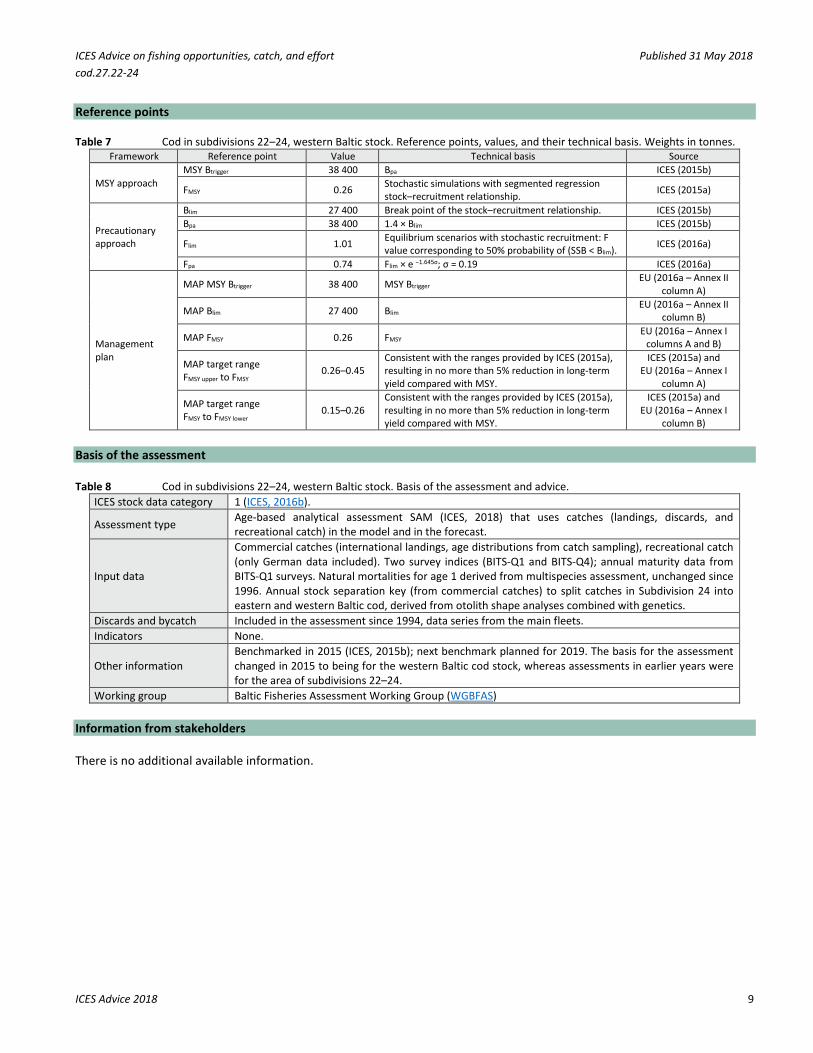
Reference points Table 7 Cod in subdivisions 22–24, western Baltic stock. Reference points, values, and their technical basis. Weights in tonnes.
Framework Reference point Value Technical basis Source
MSY approach MSY Btrigger 38 400 Bpa ICES (2015b)
FMSY 0.26 Stochastic simulations with segmented regression stock–recruitment relationship. ICES (2015a)
Precautionary approach
Blim 27 400 Break point of the stock–recruitment relationship. ICES (2015b) Bpa 38 400 1.4 × Blim ICES (2015b)
Flim 1.01 Equilibrium scenarios with stochastic recruitment: F value corresponding to 50% probability of (SSB < Blim). ICES (2016a)
Fpa 0.74 Flim × e −1.645σ; σ = 0.19 ICES (2016a)
Management plan
MAP MSY Btrigger 38 400 MSY Btrigger EU (2016a – Annex II
column A)
MAP Blim 27 400 Blim EU (2016a – Annex II column B)
MAP FMSY 0.26 FMSY EU (2016a – Annex I
columns A and B)
MAP target range FMSY upper to FMSY
0.26–0.45 Consistent with the ranges provided by ICES (2015a), resulting in no more than 5% reduction in long-term yield compared with MSY.
ICES (2015a) and EU (2016a – Annex I
column A)
MAP target range FMSY to FMSY lower
0.15–0.26 Consistent with the ranges provided by ICES (2015a), resulting in no more than 5% reduction in long-term yield compared with MSY.
ICES (2015a) and EU (2016a – Annex I
column B) Basis of the assessment Table 8 Cod in subdivisions 22–24, western Baltic stock. Basis of the assessment and advice.
ICES stock data category 1 (ICES, 2016b).
Assessment type Age-based analytical assessment SAM (ICES, 2018) that uses catches (landings, discards, and recreational catch) in the model and in the forecast.
Input data
Commercial catches (international landings, age distributions from catch sampling), recreational catch (only German data included). Two survey indices (BITS-Q1 and BITS-Q4); annual maturity data from BITS-Q1 surveys. Natural mortalities for age 1 derived from multispecies assessment, unchanged since 1996. Annual stock separation key (from commercial catches) to split catches in Subdivision 24 into eastern and western Baltic cod, derived from otolith shape analyses combined with genetics.
Discards and bycatch Included in the assessment since 1994, data series from the main fleets. Indicators None.
Other information Benchmarked in 2015 (ICES, 2015b); next benchmark planned for 2019. The basis for the assessment changed in 2015 to being for the western Baltic cod stock, whereas assessments in earlier years were for the area of subdivisions 22–24.
Working group Baltic Fisheries Assessment Working Group (WGBFAS) Information from stakeholders There is no additional available information.
ICES Advice on fishing opportunities, catch, and effort Published 31 May 2018 cod.27.22-24
ICES Advice 2018 10
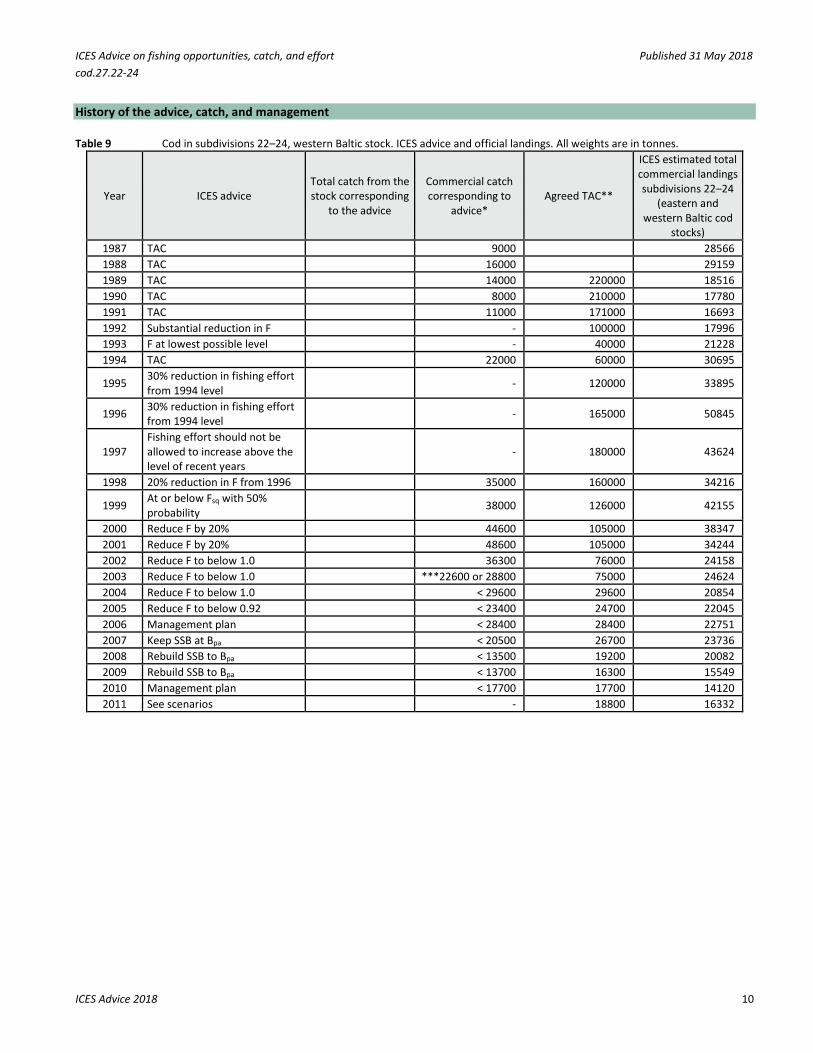
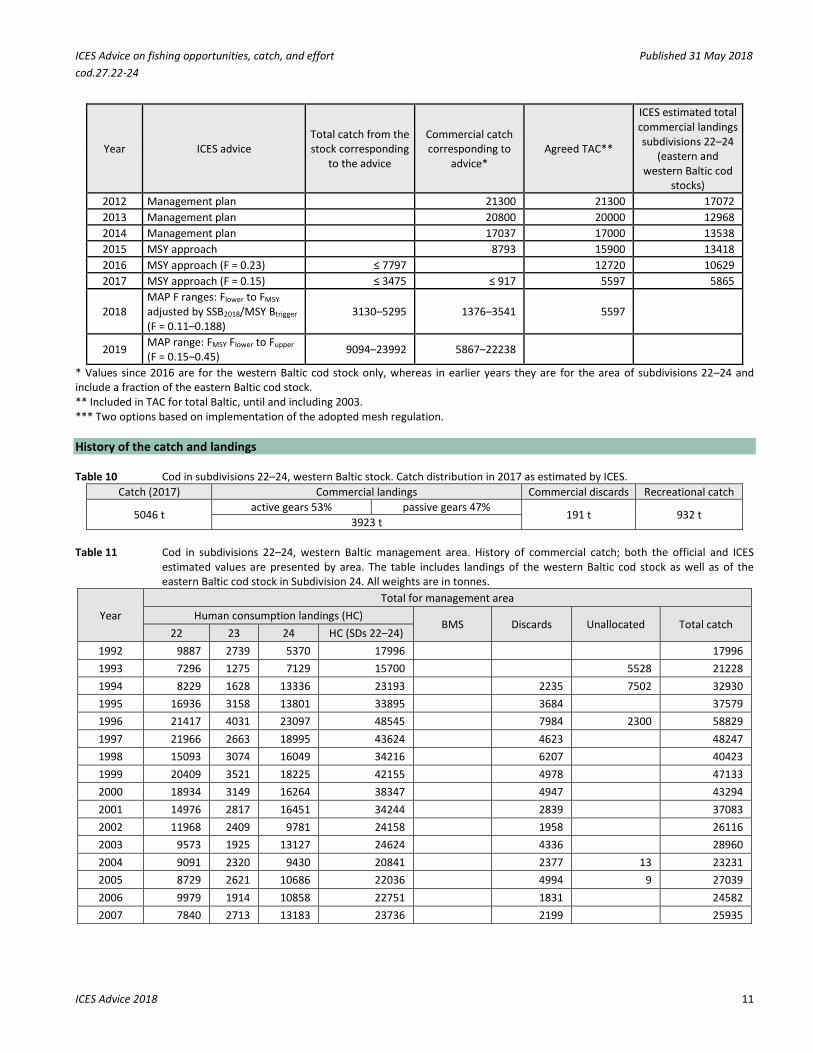
History of the advice, catch, and management Table 9 Cod in subdivisions 22–24, western Baltic stock. ICES advice and official landings. All weights are in tonnes.
Year ICES advice Total catch from the stock corresponding
to the advice
Commercial catch corresponding to
advice* Agreed TAC**
ICES estimated total commercial landings subdivisions 22–24
(eastern and western Baltic cod
stocks) 1987 TAC 9000 28566 1988 TAC 16000 29159 1989 TAC 14000 220000 18516 1990 TAC 8000 210000 17780 1991 TAC 11000 171000 16693 1992 Substantial reduction in F - 100000 17996 1993 F at lowest possible level - 40000 21228 1994 TAC 22000 60000 30695
1995 30% reduction in fishing effort from 1994 level - 120000 33895
1996 30% reduction in fishing effort from 1994 level - 165000 50845
1997 Fishing effort should not be allowed to increase above the level of recent years
- 180000 43624
1998 20% reduction in F from 1996 35000 160000 34216
1999 At or below Fsq with 50% probability 38000 126000 42155
2000 Reduce F by 20% 44600 105000 38347 2001 Reduce F by 20% 48600 105000 34244 2002 Reduce F to below 1.0 36300 76000 24158 2003 Reduce F to below 1.0 ***22600 or 28800 75000 24624 2004 Reduce F to below 1.0 < 29600 29600 20854 2005 Reduce F to below 0.92 < 23400 24700 22045 2006 Management plan < 28400 28400 22751 2007 Keep SSB at Bpa < 20500 26700 23736 2008 Rebuild SSB to Bpa < 13500 19200 20082 2009 Rebuild SSB to Bpa < 13700 16300 15549 2010 Management plan < 17700 17700 14120 2011 See scenarios - 18800 16332
ICES Advice on fishing opportunities, catch, and effort Published 31 May 2018 cod.27.22-24
ICES Advice 2018 11
Year ICES advice Total catch from the stock corresponding
to the advice
Commercial catch corresponding to
advice* Agreed TAC**
ICES estimated total commercial landings subdivisions 22–24
(eastern and western Baltic cod
stocks) 2012 Management plan 21300 21300 17072 2013 Management plan 20800 20000 12968 2014 Management plan 17037 17000 13538 2015 MSY approach 8793 15900 13418 2016 MSY approach (F = 0.23) ≤ 7797 12720 10629 2017 MSY approach (F = 0.15) ≤ 3475 ≤ 917 5597 5865
2018 MAP F ranges: Flower to FMSY adjusted by SSB2018/MSY Btrigger (F = 0.11–0.188)
3130–5295 1376–3541 5597
2019 MAP range: FMSY Flower to Fupper (F = 0.15–0.45) 9094–23992 5867–22238
* Values since 2016 are for the western Baltic cod stock only, whereas in earlier years they are for the area of subdivisions 22–24 and include a fraction of the eastern Baltic cod stock. ** Included in TAC for total Baltic, until and including 2003. *** Two options based on implementation of the adopted mesh regulation. History of the catch and landings Table 10 Cod in subdivisions 22–24, western Baltic stock. Catch distribution in 2017 as estimated by ICES.
Catch (2017) Commercial landings Commercial discards Recreational catch
5046 t active gears 53% passive gears 47%
191 t 932 t 3923 t
Table 11 Cod in subdivisions 22–24, western Baltic management area. History of commercial catch; both the official and ICES
estimated values are presented by area. The table includes landings of the western Baltic cod stock as well as of the eastern Baltic cod stock in Subdivision 24. All weights are in tonnes.
Year Total for management area
Human consumption landings (HC) BMS Discards Unallocated Total catch
22 23 24 HC (SDs 22–24) 1992 9887 2739 5370 17996 17996 1993 7296 1275 7129 15700 5528 21228 1994 8229 1628 13336 23193 2235 7502 32930 1995 16936 3158 13801 33895 3684 37579 1996 21417 4031 23097 48545 7984 2300 58829 1997 21966 2663 18995 43624 4623 48247 1998 15093 3074 16049 34216 6207 40423 1999 20409 3521 18225 42155 4978 47133 2000 18934 3149 16264 38347 4947 43294 2001 14976 2817 16451 34244 2839 37083 2002 11968 2409 9781 24158 1958 26116 2003 9573 1925 13127 24624 4336 28960 2004 9091 2320 9430 20841 2377 13 23231 2005 8729 2621 10686 22036 4994 9 27039 2006 9979 1914 10858 22751 1831 24582 2007 7840 2713 13183 23736 2199 25935
ICES Advice on fishing opportunities, catch, and effort Published 31 May 2018 cod.27.22-24
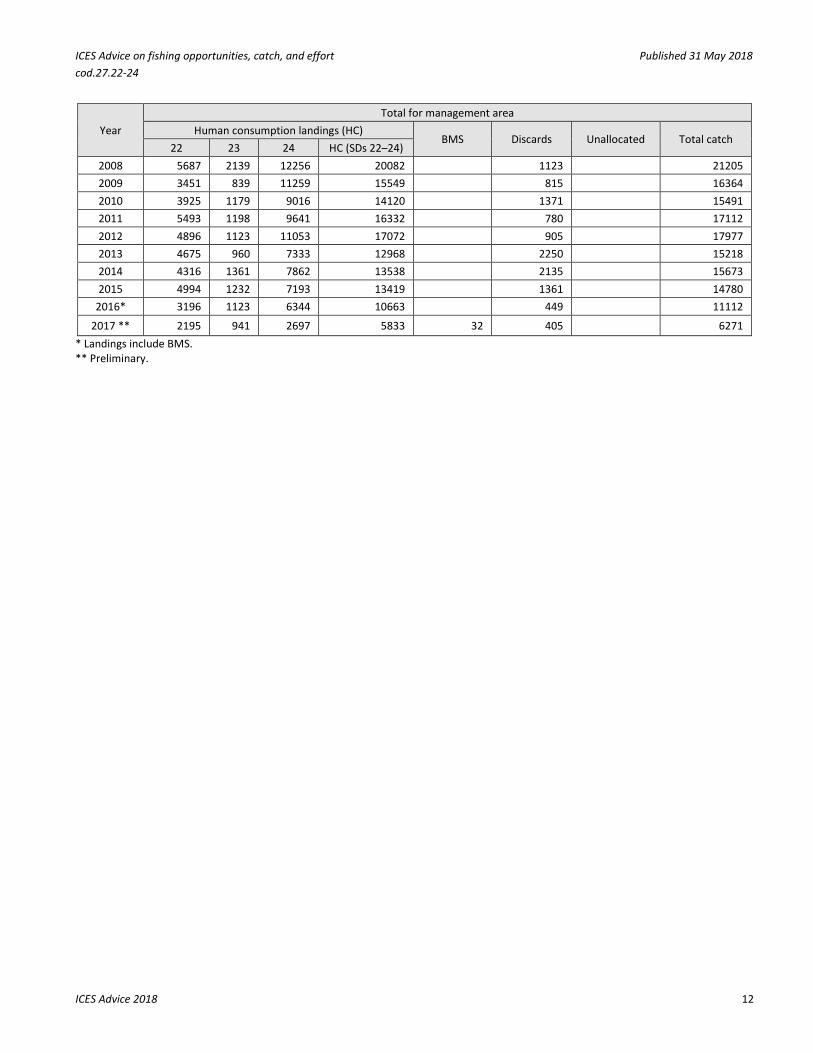
ICES Advice 2018 12
Year Total for management area
Human consumption landings (HC) BMS Discards Unallocated Total catch
22 23 24 HC (SDs 22–24) 2008 5687 2139 12256 20082 1123 21205 2009 3451 839 11259 15549 815 16364 2010 3925 1179 9016 14120 1371 15491 2011 5493 1198 9641 16332 780 17112 2012 4896 1123 11053 17072 905 17977 2013 4675 960 7333 12968 2250 15218 2014 4316 1361 7862 13538 2135 15673 2015 4994 1232 7193 13419 1361 14780
2016* 3196 1123 6344 10663 449 11112
2017 ** 2195 941 2697 5833 32 405 6271 * Landings include BMS. ** Preliminary.
ICES Advice on fishing opportunities, catch, and effort Published 31 May 2018 cod.27.22-24
ICES Advice 2018 13
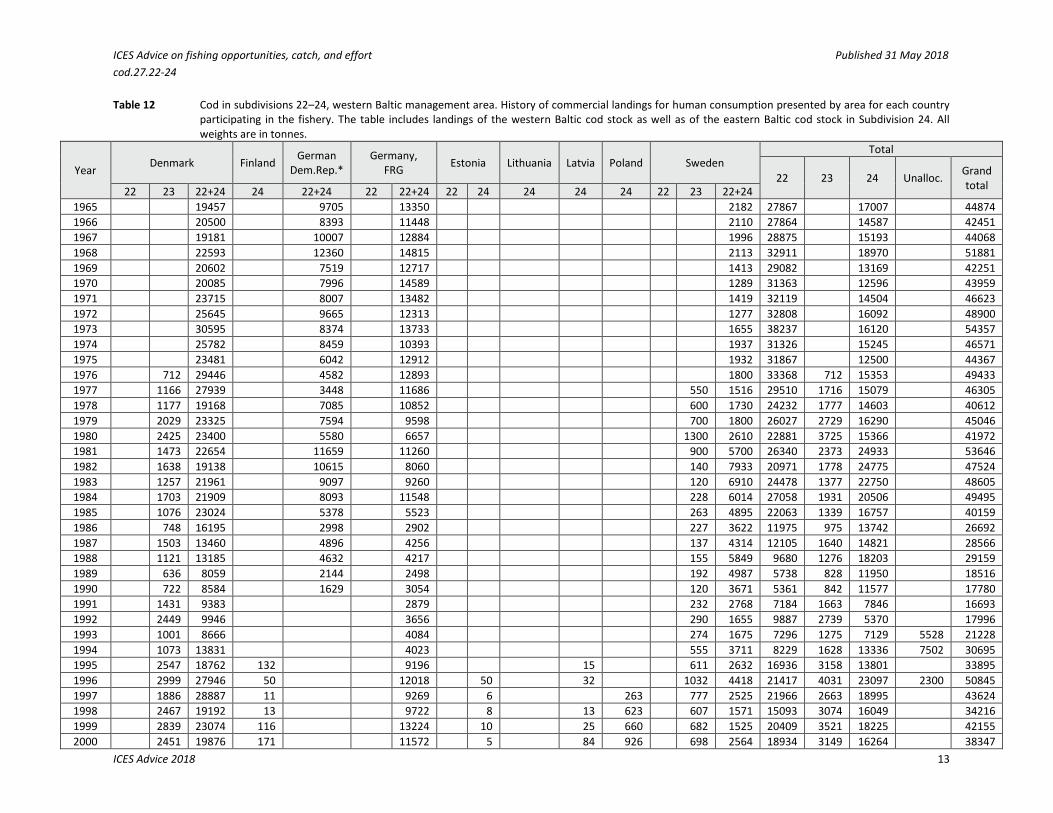
Table 12 Cod in subdivisions 22–24, western Baltic management area. History of commercial landings for human consumption presented by area for each country participating in the fishery. The table includes landings of the western Baltic cod stock as well as of the eastern Baltic cod stock in Subdivision 24. All weights are in tonnes.
Year Denmark Finland German Dem.Rep.*
Germany, FRG Estonia Lithuania Latvia Poland Sweden
Total
22 23 24 Unalloc. Grand total 22 23 22+24 24 22+24 22 22+24 22 24 24 24 24 22 23 22+24
1965 19457 9705 13350 2182 27867 17007 44874 1966 20500 8393 11448 2110 27864 14587 42451 1967 19181 10007 12884 1996 28875 15193 44068 1968 22593 12360 14815 2113 32911 18970 51881 1969 20602 7519 12717 1413 29082 13169 42251 1970 20085 7996 14589 1289 31363 12596 43959 1971 23715 8007 13482 1419 32119 14504 46623 1972 25645 9665 12313 1277 32808 16092 48900 1973 30595 8374 13733 1655 38237 16120 54357 1974 25782 8459 10393 1937 31326 15245 46571 1975 23481 6042 12912 1932 31867 12500 44367 1976 712 29446 4582 12893 1800 33368 712 15353 49433 1977 1166 27939 3448 11686 550 1516 29510 1716 15079 46305 1978 1177 19168 7085 10852 600 1730 24232 1777 14603 40612 1979 2029 23325 7594 9598 700 1800 26027 2729 16290 45046 1980 2425 23400 5580 6657 1300 2610 22881 3725 15366 41972 1981 1473 22654 11659 11260 900 5700 26340 2373 24933 53646 1982 1638 19138 10615 8060 140 7933 20971 1778 24775 47524 1983 1257 21961 9097 9260 120 6910 24478 1377 22750 48605 1984 1703 21909 8093 11548 228 6014 27058 1931 20506 49495 1985 1076 23024 5378 5523 263 4895 22063 1339 16757 40159 1986 748 16195 2998 2902 227 3622 11975 975 13742 26692 1987 1503 13460 4896 4256 137 4314 12105 1640 14821 28566 1988 1121 13185 4632 4217 155 5849 9680 1276 18203 29159 1989 636 8059 2144 2498 192 4987 5738 828 11950 18516 1990 722 8584 1629 3054 120 3671 5361 842 11577 17780 1991 1431 9383 2879 232 2768 7184 1663 7846 16693 1992 2449 9946 3656 290 1655 9887 2739 5370 17996 1993 1001 8666 4084 274 1675 7296 1275 7129 5528 21228 1994 1073 13831 4023 555 3711 8229 1628 13336 7502 30695 1995 2547 18762 132 9196 15 611 2632 16936 3158 13801 33895 1996 2999 27946 50 12018 50 32 1032 4418 21417 4031 23097 2300 50845 1997 1886 28887 11 9269 6 263 777 2525 21966 2663 18995 43624 1998 2467 19192 13 9722 8 13 623 607 1571 15093 3074 16049 34216 1999 2839 23074 116 13224 10 25 660 682 1525 20409 3521 18225 42155 2000 2451 19876 171 11572 5 84 926 698 2564 18934 3149 16264 38347
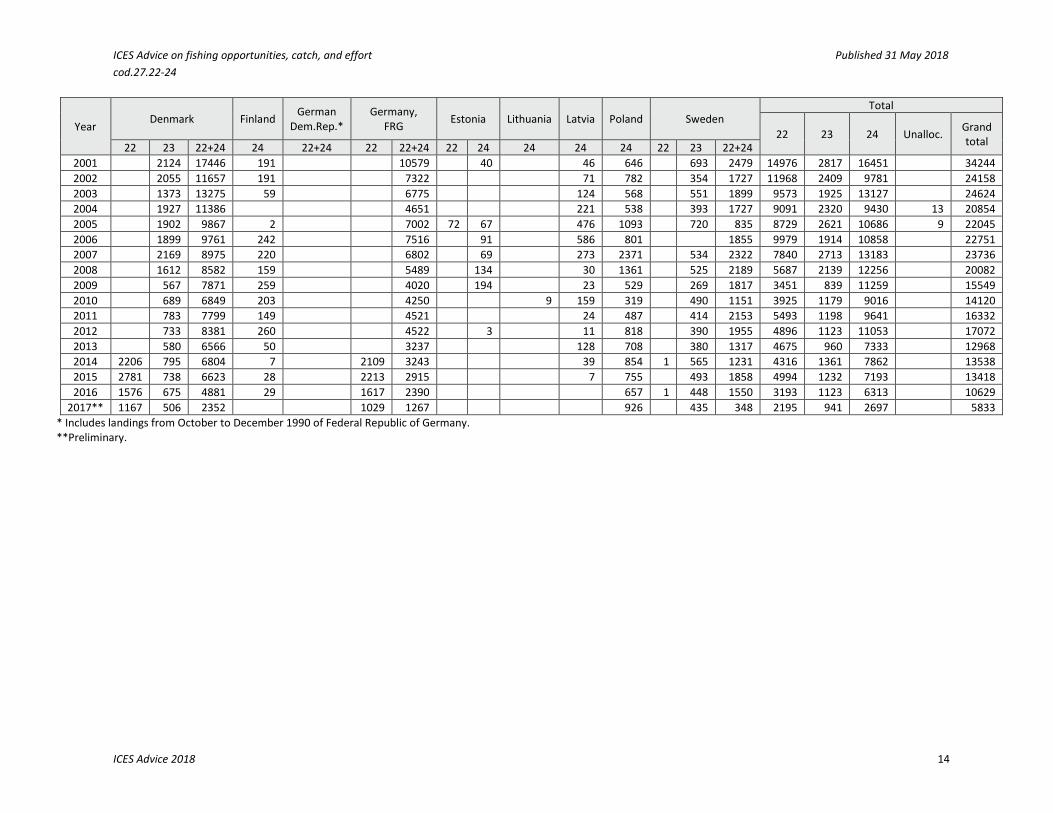
ICES Advice on fishing opportunities, catch, and effort Published 31 May 2018 cod.27.22-24
ICES Advice 2018 14
Year Denmark Finland German
Dem.Rep.* Germany,
FRG Estonia Lithuania Latvia Poland Sweden Total
22 23 24 Unalloc. Grand total 22 23 22+24 24 22+24 22 22+24 22 24 24 24 24 22 23 22+24
2001 2124 17446 191 10579 40 46 646 693 2479 14976 2817 16451 34244 2002 2055 11657 191 7322 71 782 354 1727 11968 2409 9781 24158 2003 1373 13275 59 6775 124 568 551 1899 9573 1925 13127 24624 2004 1927 11386 4651 221 538 393 1727 9091 2320 9430 13 20854 2005 1902 9867 2 7002 72 67 476 1093 720 835 8729 2621 10686 9 22045 2006 1899 9761 242 7516 91 586 801 1855 9979 1914 10858 22751 2007 2169 8975 220 6802 69 273 2371 534 2322 7840 2713 13183 23736 2008 1612 8582 159 5489 134 30 1361 525 2189 5687 2139 12256 20082 2009 567 7871 259 4020 194 23 529 269 1817 3451 839 11259 15549 2010 689 6849 203 4250 9 159 319 490 1151 3925 1179 9016 14120 2011 783 7799 149 4521 24 487 414 2153 5493 1198 9641 16332 2012 733 8381 260 4522 3 11 818 390 1955 4896 1123 11053 17072 2013 580 6566 50 3237 128 708 380 1317 4675 960 7333 12968 2014 2206 795 6804 7 2109 3243 39 854 1 565 1231 4316 1361 7862 13538 2015 2781 738 6623 28 2213 2915 7 755 493 1858 4994 1232 7193 13418 2016 1576 675 4881 29 1617 2390 657 1 448 1550 3193 1123 6313 10629
2017** 1167 506 2352 1029 1267 926 435 348 2195 941 2697 5833 * Includes landings from October to December 1990 of Federal Republic of Germany. **Preliminary.
ICES Advice on fishing opportunities, catch, and effort Published 31 May 2018 cod.27.22-24
ICES Advice 2018 15
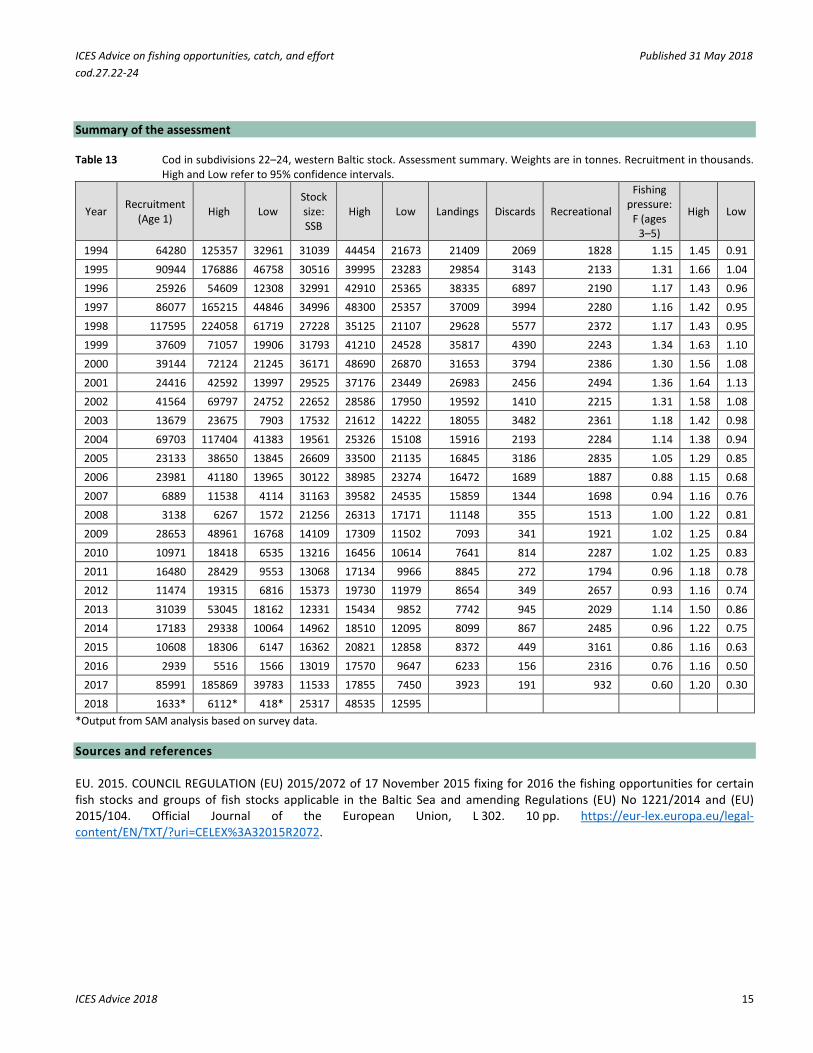
Summary of the assessment Table 13 Cod in subdivisions 22–24, western Baltic stock. Assessment summary. Weights are in tonnes. Recruitment in thousands.
High and Low refer to 95% confidence intervals.
Year Recruitment (Age 1) High Low
Stock size: SSB
High Low Landings Discards Recreational
Fishing pressure:
F (ages 3–5)
High Low
1994 64280 125357 32961 31039 44454 21673 21409 2069 1828 1.15 1.45 0.91
1995 90944 176886 46758 30516 39995 23283 29854 3143 2133 1.31 1.66 1.04 1996 25926 54609 12308 32991 42910 25365 38335 6897 2190 1.17 1.43 0.96 1997 86077 165215 44846 34996 48300 25357 37009 3994 2280 1.16 1.42 0.95
1998 117595 224058 61719 27228 35125 21107 29628 5577 2372 1.17 1.43 0.95 1999 37609 71057 19906 31793 41210 24528 35817 4390 2243 1.34 1.63 1.10 2000 39144 72124 21245 36171 48690 26870 31653 3794 2386 1.30 1.56 1.08
2001 24416 42592 13997 29525 37176 23449 26983 2456 2494 1.36 1.64 1.13 2002 41564 69797 24752 22652 28586 17950 19592 1410 2215 1.31 1.58 1.08 2003 13679 23675 7903 17532 21612 14222 18055 3482 2361 1.18 1.42 0.98
2004 69703 117404 41383 19561 25326 15108 15916 2193 2284 1.14 1.38 0.94 2005 23133 38650 13845 26609 33500 21135 16845 3186 2835 1.05 1.29 0.85 2006 23981 41180 13965 30122 38985 23274 16472 1689 1887 0.88 1.15 0.68
2007 6889 11538 4114 31163 39582 24535 15859 1344 1698 0.94 1.16 0.76 2008 3138 6267 1572 21256 26313 17171 11148 355 1513 1.00 1.22 0.81 2009 28653 48961 16768 14109 17309 11502 7093 341 1921 1.02 1.25 0.84
2010 10971 18418 6535 13216 16456 10614 7641 814 2287 1.02 1.25 0.83 2011 16480 28429 9553 13068 17134 9966 8845 272 1794 0.96 1.18 0.78 2012 11474 19315 6816 15373 19730 11979 8654 349 2657 0.93 1.16 0.74
2013 31039 53045 18162 12331 15434 9852 7742 945 2029 1.14 1.50 0.86 2014 17183 29338 10064 14962 18510 12095 8099 867 2485 0.96 1.22 0.75 2015 10608 18306 6147 16362 20821 12858 8372 449 3161 0.86 1.16 0.63
2016 2939 5516 1566 13019 17570 9647 6233 156 2316 0.76 1.16 0.50 2017 85991 185869 39783 11533 17855 7450 3923 191 932 0.60 1.20 0.30 2018 1633* 6112* 418* 25317 48535 12595
*Output from SAM analysis based on survey data. Sources and references EU. 2015. COUNCIL REGULATION (EU) 2015/2072 of 17 November 2015 fixing for 2016 the fishing opportunities for certain fish stocks and groups of fish stocks applicable in the Baltic Sea and amending Regulations (EU) No 1221/2014 and (EU) 2015/104. Official Journal of the European Union, L 302. 10 pp. https://eur-lex.europa.eu/legal-content/EN/TXT/?uri=CELEX%3A32015R2072.
ICES Advice on fishing opportunities, catch, and effort Published 31 May 2018 cod.27.22-24
ICES Advice 2018 16
EU. 2016a. Regulation (EU) 2016/1139 of the European Parliament and of the Council of 6 July 2016 establishing a multiannual plan for the stocks of cod, herring and sprat in the Baltic Sea and the fisheries exploiting those stocks, amending Council Regulation (EC) No 2187/2005 and repealing Council Regulation (EC) No 1098/2007. Official Journal of the European Union, L 191. 15 pp. https://eur-lex.europa.eu/legal-content/EN/TXT/?uri=CELEX%3A32016R1139.
EU. 2016b. COUNCIL REGULATION (EU) 2016/1903 of 28 October 2016 fixing for 2017 the fishing opportunities for certain fish stocks and groups of fish stocks applicable in the Baltic Sea and amending Regulation (EU) 2016/72. Official Journal of the European Union, L 295. 10 pp. https://eur-lex.europa.eu/legal-content/EN/TXT/?uri=CELEX%3A32016R1903.
EU. 2017. COUNCIL REGULATION (EU) 2017/1970 of 27 October 2017 fixing for 2018 the fishing opportunities for certain fish stocks and groups of fish stocks applicable in the Baltic Sea and amending Regulation (EU) 2017/127. Official Journal of the European Union, L 281. 10 pp. https://eur-lex.europa.eu/legal-content/DA/TXT/?uri=CELEX%3A32017R1970.
ICES. 2015a. EU request to ICES to provide FMSY ranges for selected North Sea and Baltic Sea stocks. In Report of the ICES Advisory Committee, 2015. ICES Advice 2015, Book 6, Section 6.2.3.1. 11 pp. http://www.ices.dk/sites/pub/Publication%20Reports/Advice/2015/Special_Requests/EU_FMSY_ranges_for_selected_NS_and_BS_stocks.pdf.
ICES. 2015b. Report of the Benchmark Workshop on Baltic Cod Stocks (WKBALTCOD), 2–6 March 2015, Rostock, Germany. ICES CM 2015/ACOM:35. 172 pp.
ICES. 2016a. Report of the Baltic Fisheries Assessment Working Group (WGBFAS), 12–19 April 2016, ICES Headquarters, Copenhagen, Denmark. ICES CM 2016/ACOM:11. 594 pp.
ICES. 2016b. Advice basis. In Report of the ICES Advisory Committee, 2016. ICES Advice 2016, Book 1, Section 1.2.
ICES. 2018. Report of the Baltic Fisheries Assessment Working Group (WGBFAS), 6–13 April 2018, ICES Headquarters, Copenhagen, Denmark. ICES CM 2018/ACOM:11.
Strehlow, H., and Zimmermann, C. 2016. Evaluation of effects of management options for the recreational cod fishery in the western Baltic Sea. Thünen Institute of Baltic Sea Fisheries, Rostock: Internal report to the EU October Council, Sept 9th, 2016. 8 pp.