code for sustainable homes cost review · 2012-10-31 · e-mail: [email protected] this...
TRANSCRIPT
Code for Sustainable Homes: A Cost Review
www.communities.gov.uk community, opportunity, prosperity

Copyright in the contents, the cover, the design and the typographical arrangement rests with the Crown. This document/publication is value added. If you wish to re-use this material, please apply for a Click-Use Licence for value added material at www.opsi.gov.uk/click-use/system/online/pLogin.asp. Alternatively applications can be sent to: Office of Public Sector Information Information Policy Team Kew Richmond upon Thames Surrey TW9 4DU E-mail: [email protected] This publication has been approved by Ministers and has official status. The contents of this publication may be reproduced free of charge in any format or medium for the purposes of private research and study or for internal circulation within an organisation. This is subject to the contents being reproduced accurately and not in a way that implies official status. Any publisher wishing to reproduce the content of this publication must not use or replicate the logo or replicate the official version’s style and appearance, including the design, and must not present their publication as being an official publication as this may confuse the public. The reproduced material must be acknowledged as Crown Copyright and the title of the publication specified. Any other use of the contents of this publication would require a copyright licence. Further information can obtained from www.opsi.gov.uk Communities and Local Government Eland House Bressenden Place London SW1E 5DU Telephone: 020 7944 4400 Website: www.communities.gov.uk © Queen’s Printer and Controller of Her Majesty’s Stationery office, 2008. If you require this publication in an alternative format please email [email protected] Communities and Local Government Publications PO Box 236 Wetherby West Yorkshire LS23 7NB Tel: 0300 123 1124 Fax: 0300 123 1125 Email: [email protected] Online via the Communities and Local Government website: www.communities.gov.uk
March 2010 ISBN: 978-1-4098-2236-3

Code for Sustainable Homes 2 Cost review
The findings and recommendations in this report are those of the authors and do not necessarily represent the view of the Department for Communities and Local Government.

Code for Sustainable Homes 3 Cost review
Table of Contents
Table of Contents ........................................................................................................................................3 Table of Tables ............................................................................................................................................5 Table of Figures ..........................................................................................................................................7 Glossary .......................................................................................................................................................8 Acknowledgements ....................................................................................................................................9 1 Executive Summary .............................................................................................................................10 Background and Motivation.........................................................................................................................10 Methodology................................................................................................................................................10 Key Results .................................................................................................................................................10 2 Introduction ..........................................................................................................................................13
2.1 Overview .....................................................................................................................................13 2.2 Objectives....................................................................................................................................13
3 Background..........................................................................................................................................14 3.1 Categories and Issues ................................................................................................................14 3.2 Mandatory Issues........................................................................................................................15 3.3 Credits and Scoring.....................................................................................................................16 3.4 Changes to the Code ..................................................................................................................18
4 Research Methodology........................................................................................................................19 4.1 Industry Consultation ..................................................................................................................19 4.2 Cost Data Validation ...................................................................................................................19 4.3 Modelling Methodology ...............................................................................................................19
5 Baseline Assumptions..........................................................................................................................22 5.1 Basic Dwelling Types ..................................................................................................................22
5.1.1 Specifications of the Basic Dwelling Types.............................................................................22 5.1.2 Energy Performance of Baseline Dwellings............................................................................23 5.1.3 Baseline Build Costs ...............................................................................................................24
5.2 Development Scenarios ..............................................................................................................24 5.3 Key Assumptions ........................................................................................................................26
5.3.1 Changes to Building Regulations over Time...........................................................................26 5.3.2 Low and Zero Carbon Technologies.......................................................................................26
6 Meeting Code Standards .....................................................................................................................27 6.1 Energy .........................................................................................................................................27
6.1.1 Mandatory Requirement: Ene 1 – Dwelling Emission Rate ....................................................27 6.1.2 Other Issues in the Energy Category......................................................................................32
6.2 Water...........................................................................................................................................34 6.3 Materials......................................................................................................................................36

Code for Sustainable Homes 4 Cost review
6.4 Surface Water Run-off ................................................................................................................36 6.5 Waste ..........................................................................................................................................37 6.6 Pollution.......................................................................................................................................39 6.7 Health & Well-Being ....................................................................................................................40 6.8 Management ...............................................................................................................................42 6.9 Ecology........................................................................................................................................43
7 Assessment of the cost of building to the code ...................................................................................45 7.1 Introduction..................................................................................................................................45 7.2 Energy Strategies options ...........................................................................................................46
7.2.1 Energy strategy summary .......................................................................................................55 7.3 Total Code costs .........................................................................................................................57
7.3.1 Composition of non-energy Code costs..................................................................................60 7.3.2 Non-standard energy solutions ...............................................................................................63 7.3.3 Ground Source Heat Pump.....................................................................................................63 7.3.4 Wind ........................................................................................................................................65
7.4 Code cost variation with time ......................................................................................................67 7.5 Lifecycle and management cost..................................................................................................70
8 Summary of key issues........................................................................................................................72 8.1 Energy .........................................................................................................................................72 8.2 Water...........................................................................................................................................73 8.3 Other Code categories ................................................................................................................74
9 Appendix 1: Fabric Improvement Packages........................................................................................75 10 Appendix 2: LZC Technology Costs and Sizing..............................................................................77
10.1 Technology cost projections........................................................................................................77 10.1.1 Photovoltaics .......................................................................................................................77 10.1.2 Solar Hot Water...................................................................................................................78 10.1.3 Air Source Heat Pumps.......................................................................................................79 10.1.4 Biomass Heating .................................................................................................................80 10.1.5 Gas-fired Combined Heat and Power .................................................................................81 10.1.6 Biomass Combined Heat and Power ..................................................................................82 10.1.7 Heat Distribution..................................................................................................................82
10.2 Technology sizing .......................................................................................................................83 10.2.1 Photovoltaics .......................................................................................................................83 10.2.2 Solar Hot Water...................................................................................................................83 10.2.3 Air Source Heat Pumps.......................................................................................................83 10.2.4 Biomass Heating .................................................................................................................84 10.2.5 Gas-fired Combined Heat and Power .................................................................................85 10.2.6 Biomass Combined Heat and Power ..................................................................................86
10.3 Cost of Ene 1 Options .................................................................................................................87 11 Appendix 3: Fuel and Electricity Prices...........................................................................................89 12 Appendix 4: Cost data tables ..........................................................................................................90

Code for Sustainable Homes 5 Cost review
Table of Tables
Table 1: Mandatory issues..........................................................................................................................15 Table 2: Summary of Code categories, issues, and available credits .......................................................16 Table 3: Minimum Total Percentage Points Score requirement by Code level .........................................17 Table 4: Dwelling types..............................................................................................................................22 Table 5: Specifications of baseline dwellings.............................................................................................23 Table 6: Target emission rate and DER of reference dwellings ................................................................24 Table 7: Baseline build costs .....................................................................................................................24 Table 8: Development scenarios ...............................................................................................................25 Table 9: U-values for the fabric improvement packages ...........................................................................27 Table 10: Total fabric package costs (including costs of improving U-values, reducing air permeability
and thermal bridging, and MVHR systems where necessary) ............................................................27 Table 11: Ene1 options for meeting required improvements in DER ........................................................29 Table 12: Energy issues.............................................................................................................................32 Table 13: Cost of credits in the Energy category.......................................................................................33 Table 14: Packages of measures to achieve Wat 1 credits – detached house .........................................34 Table 15: Packages of measures to achieve Wat 1 credits – flat, terraced, semi-detached.....................35 Table 16: Cost of meeting internal water consumption targets..................................................................35 Table 17: Cost of credits in the Materials category....................................................................................36 Table 18: Surface water run-off issues ......................................................................................................37 Table 19: Cost of credits in the surface water run-off category .................................................................37 Table 20: Waste issues..............................................................................................................................38 Table 21: Cost of credits in the Waste category ........................................................................................38 Table 22: Pollution issues ..........................................................................................................................39 Table 23: Cost of credits in the Pollution category ....................................................................................39 Table 24: Health & Well-Being issues........................................................................................................40 Table 25: Cost of credits in the Health & Well-Being category..................................................................41 Table 26: Cost breakdown for Lifetime Homes..........................................................................................41 Table 27: Management issues...................................................................................................................42 Table 28: Cost of credits in the Management category .............................................................................43 Table 29: Ecology issues ...........................................................................................................................43 Table 30: Cost of credits in the Ecology category .....................................................................................44 Table 31: Summary of credited mandatory requirements by Code level...................................................45 Table 32: Upper and lower bound on overall Code extra-over cost (assuming the energy strategy that
gives the lowest overall compliance cost is selected in each development scenario) ........................57 Table 33: Co-efficient of Performance (COP) assumptions for ground and air source heat pumps .........63 Table 34: Ground source heat pump based energy strategies – extra-over costs and percentage DER
improvement delivered ........................................................................................................................64 Table 35: Comparison of total Code extra-over costs between a development with a large wind based
energy strategy to a similar development with a biomass CHP / district heating strategy..................66 Table 36: Impact of Building Regulation changes on minimum DER/TER reductions required at each
Code Level...........................................................................................................................................67 Table 37: Fuel costs for Part L 2006 compliant dwellings and net savings for each Ene 1 option for a
large edge of town development..........................................................................................................71 Table 38: Typical net savings as a percentage of Part L dwelling’s fuel bill for a large edge of town
development ........................................................................................................................................71 Table 39: Baseline U-values and costs......................................................................................................75

Code for Sustainable Homes 6 Cost review
Table 40: ‘Reference’ U-values..................................................................................................................75 Table 41: Improved fabric U-values and costs...........................................................................................75 Table 42: Air tightness and thermal bridging values and costs .................................................................76 Table 43: Extra over cost of improved fabric package...............................................................................76 Table 44: Cost of mechanical ventilation with heat recovery systems ......................................................76 Table 45: Photovoltaic system costs..........................................................................................................77 Table 46: Solar hot water system costs .....................................................................................................78 Table 47: Air source heat pump system costs ...........................................................................................79 Table 48: Biomass heating costs ...............................................................................................................80 Table 49: Gas combined heat and power costs ........................................................................................81 Table 50: Biomass combined heat and power costs .................................................................................82 Table 51:District heating costs....................................................................................................................82 Table 52: Maximum PV capacity by dwelling type.....................................................................................83 Table 53: Biomass CHP technologies .......................................................................................................86 Table 54: Technology sizes and costs (2009) for a medium urban development .....................................87 Table 55: Technology sizes and costs (2009) for a medium edge of town development..........................88 Table 56: Gas and electricity prices...........................................................................................................89 Table 57: E/O costs and credits by issue: Small Brownfield development................................................90 Table 58: E/O costs and credits by issue: Strategic development ..........................................................108 Table 59: E/O cost (in 2009) as £/m2 of floor area and as a percentage of baseline build costs (cost of
building dwelling to Part L 2006): Small Brownfield...........................................................................126 Table 60: E/O cost (in 2009) as £/m2 of floor area and as a percentage of baseline build costs (cost of
building dwelling to Part L 2006): City Infill ........................................................................................127 Table 61: E/O cost (in 2009) as £/m2 of floor area and as a percentage of baseline build costs (cost of
building dwelling to Part L 2006): Medium Urban (mixed).................................................................128 Table 62: E/O cost (in 2009) as £/m2 of floor area and as a percentage of baseline build costs (cost of
building dwelling to Part L 2006): Medium Urban (flats)....................................................................129 Table 63: E/O cost (in 2009) as £/m2 of floor area and as a percentage of baseline build costs (cost of
building dwelling to Part L 2006): Large Urban (mixed) ....................................................................130 Table 64: E/O cost (in 2009) as £/m2 of floor area and as a percentage of baseline build costs (cost of
building dwelling to Part L 2006): Large Urban (flats) .......................................................................131 Table 65: E/O cost (in 2009) as £/m2 of floor area and as a percentage of baseline build costs (cost of
building dwelling to Part L 2006): Small Infill .....................................................................................132 Table 66: E/O cost (in 2009) as £/m2 of floor area and as a percentage of baseline build costs (cost of
building dwelling to Part L 2006): Small Greenfield...........................................................................133 Table 67: E/O cost (in 2009) as £/m2 of floor area and as a percentage of baseline build costs (cost of
building dwelling to Part L 2006): Small Edge of Town .....................................................................134 Table 68: E/O cost (in 2009) as £/m2 of floor area and as a percentage of baseline build costs (cost of
building dwelling to Part L 2006): Medium Edge of Town .................................................................135 Table 69: E/O cost (in 2009) as £/m2 of floor area and as a percentage of baseline build costs (cost of
building dwelling to Part L 2006): Large Edge of Town.....................................................................136 Table 70: E/O cost (in 2009) as £/m2 of floor area and as a percentage of baseline build costs (cost of
building dwelling to Part L 2006): Strategic .......................................................................................137

Code for Sustainable Homes 7 Cost review
Table of Figures Figure 1: Overview of modelling methodology...........................................................................................20 Figure 2: Variation in extra-over cost of energy strategy for each house type in a Large Urban
development scenario..........................................................................................................................31 Figure 3: Plots of energy strategy E/O cost against reduction of DER/TER for a selection of dwelling
types and development scenarios .......................................................................................................48 Figure 4: Summary of lowest cost energy strategy at each Code level for each development scenario ...51 Figure 5: Variation of lowest cost energy strategy at each Code level with development scenario for each
dwelling type ........................................................................................................................................54 Figure 6: Variation in total Code cost at each Code level with development scenario for each dwelling
type ......................................................................................................................................................59 Figure 7: Build up of non-energy extra-over costs at each Code level and variation with development
scenario ...............................................................................................................................................61 Figure 8: Examples of lowest cost approaches to meeting each Code level, in terms of credits gained by
category and associated costs, for Flat and Semi-detached dwelling types and in a selection of development scenarios........................................................................................................................62
Figure 9: Extra over cost of achieving Code level 4 with a GSHP in a small greenfield development......64 Figure 10: Extra-over cost of energy strategies involving medium to large-scale wind turbines, sized to
meet Code levels 4 to 6 .......................................................................................................................65 Figure 11: Total extra-over costs of achieving Code levels 4 to 6 based on an energy strategy involving
medium to large scale wind .................................................................................................................66 Figure 12: Changing additional cost of building a Code Level 3 and 4 compliant dwelling (3-bd semi) over
time as Building Regulations change, measured from a baseline of building a 2006 Building Regulation compliant dwelling.. ...........................................................................................................68
Figure 13: Changing additional cost of building a Code Level 5 and 6 compliant dwelling (3-bd semi) over time as Building Regulations change, measured from a baseline of building a 2006 Building Regulation compliant dwelling.. ...........................................................................................................69
Figure 14: CHP sizing methodology ..........................................................................................................85

Code for Sustainable Homes 8 Cost review
Glossary
ASHP Air source heat pump BM Biomass CHP Combined heat and power CLG Department for Communities and Local Government COP Coefficient of performance CSH Code for Sustainable Homes DER Dwelling Emission Rate Dph Dwellings per hectare E/O Extra over (cost) FRA Flood risk assessment GWP Global warming potential HW Hot water kW Kilowatt (a unit of power) kWe Kilowatt electric (electrical power) kWp Kilowatt peak kWth Kilowatt thermal (thermal power) LZC Low or Zero Carbon (technologies) MVHR Mechanical Ventilation with Heat Recovery PV Photovoltaic (array / system) SAP Standard Assessment Procedure SHW Solar hot water (solar thermal water heating) SUDS Sustainable urban drainage systems SWMP Site waste management plan TER Target Emission Rate TPPS Total percentage points score ZCH Zero Carbon Home

Code for Sustainable Homes 9 Cost review
Acknowledgements The authors would like to thank the following organisations for their contributions to this study: Accor Housing Association
CALA Homes
Circle Anglia
Countryside Properties
Crest Nicholson
Energy Efficiency Partnership for Homes
FairView Homes
Galiford Try
Good Homes Alliance
Home Builders Federation
Jones Lang Lasalle / UpStream
KeepMoat Homes
Kier Residential
Kingerlee
Mar City Developments
McCarthy & Stone
Metropolitan Housing Association
National House Building Council
Taylor Wimpey
Zero Carbon Hub

Code for Sustainable Homes 10 Cost review
1 EXECUTIVE SUMMARY
Background and Motivation
Approximately twenty-five percent of the UK’s total CO2 emissions come from the country’s housing stock. While improvements in the energy performance of existing dwellings is possible, and much work is on-going in this area, the approach to new build housing presents a unique opportunity to influence the performance of homes to be added to the stock. The Code for Sustainable Homes has been designed to guide the house building industry towards creating more sustainable homes, with a lower impact on the environment, both in their construction and throughout the buildings’ lifetimes. While the Code is voluntary, providing a rating against the Code is mandated by legislation. In addition to promoting the conservation of energy, the Code addresses wider issues including water conservation, environmental impact of building materials, and encouraging the construction of well-designed, adaptable homes suitable for an ageing population.
An update to the Code is due in 2010 to maintain alignment with amended building regulations and to incorporate feedback on current guidelines received from stakeholders within the construction industry. The Department for Communities and Local Government, which is responsible for administering the Code, requires an impact assessment on proposed changes before taking a decision on the most appropriate policy option. Element Energy and Davis Langdon were commissioned to undertake research into the costs of building to the Code, based on the practical experience of developers building Code homes. A comprehensive data set of market-tested costs is a fundamental requirement for undertaking the impact assessment, the results of which are presented in a separate document. This report presents the findings of research into the costs of building to the Code, based on recent real cost experience, superseding costing studies undertaken by Cyril Sweet in 2007/08.1
Methodology
This study considers the extra over cost of building to the Code above constructing homes to comply with building regulations. Four dwelling types were defined for this work, and were combined in a variety of ways (in terms of number of dwellings, dwelling mix and dwelling density) to create development scenarios. Cost data was obtained through a direct consultation with the house building industry, and was validated in order to retain the costs of typical mass-market measures, while filtering out any atypical costs, for bespoke solutions for example. These validated cost data were entered into a model, along with definitions of the dwelling types, development scenarios, and alternative approaches to meet the energy performance targets, which facilitated an analysis of the costs of building to each Code level. The approach taken also allowed the sensitivities of total cost of Code compliance to be explored.
Key Results
The Code for Sustainable Homes rates the sustainability of homes from level 1 to 6 on the basis of a points scoring system, where level 1 is a modest improvement on minimum regulatory standards and level 6 is an extremely challenging standard. Points are awarded under nine categories of sustainability on the basis of certain targets being met, e.g. reduced CO2 emissions or water consumption, or incorporation of certain elements of sustainable design. Under some categories, such as energy, minimum standards are stipulated that must be met to achieve a certain Code level, these are the
1 Cost Analysis of The Code for Sustainable Homes Final Report, published 21 July 2008 available at www.communities.gov.uk/thecode

Code for Sustainable Homes 11 Cost review
mandatory standards, whereas under other categories developers are given the flexibility to choose which actions to take to score the points required for a certain target Code level.
As a result of the mandatory standards, all dwellings achieving a certain Code level will have certain features and performance standards in common. However, because the home-builder has flexibility to select what measures to implement to achieve many of the points necessary to achieve a certain Code level, there are a great many possible combinations of measures at each level. The modelling methodology has been designed to identify the lowest cost means of achieving each Code level in each scenario (i.e. each combination of dwelling type and development scenario). This is achieved by first applying all measures required to achieve the mandatory standards (some of which are credited with points, others have no points attached) and then adding further measures in order of cost-effectiveness (i.e. £/point) until enough points have been scored to achieve a particular Code rating. The minimum costs associated with achieving each level of the Code are tabulated below for each dwelling type and in a range of development scenarios. The costs are reported as the extra-over cost from a baseline of building a 2006 Building Regulation compliant dwelling.
There is significant variation in the extra-over costs at each Code Level between the dwelling types and across the development scenarios. Typically, however, the extra-over costs expressed as a percentage of base build cost are < 1% for Code level 1, 1–2% at Level 2, 3–4% at level 3, 6–8% at Level 4, 25–30% at Level 5 and anything from 30 to 40 % at Level 6.
Costs are those currently applicable to building to the existing version of the Code, with no assumptions regarding potential future revisions. An analysis of how the extra-over cost of the Code (i.e. the costs associated with achieving a Code level in excess of constructing a Building Regulation compliant dwelling) changes with anticipated tightening of the Building Regulations is provided. In forecasting future extra-over cost of the Code, an allowance has been made for expected cost reductions in certain technologies (assumptions regarding cost reductions are based on industry consultation – see Section 10.1).
The most critical factor in determining the total cost of building to the Code is the approach taken to meeting the mandatory reduction in carbon emissions. At the lower Code levels (up to Code level 3) fabric improvement measures may be sufficient to achieve the required reduction in Dwelling Emission Rate (note that calculation of Dwelling Emissions Rates have been performed using SAP 2005). However, from Code level 4 and above it becomes necessary to employ some form of low or zero carbon technology to meet some or all of the dwelling’s thermal and / or electrical demands. These costs tend to dominate the overall expense of meeting a given Code level for all dwelling types.
The Department for Communities and Local Government has consulted on the definition of zero carbon homes and has announced certain decisions which are expected to reduce the cost of reaching zero carbon, when compared to the zero carbon definition utilised within the current version of Code level 6.
The variation in Code costs between development scenarios is largely a result of the variation in energy strategy costs, which can be dependent on the development’s scale and density. This is particularly the case when the energy strategy is based around some common, site-wide infrastructure, such as a district heating system. Furthermore, development scale and / or density may restrict the technology options available. For example an attractive means of meeting the very high DER reductions required at Code Levels 5 and 6 can be to utilise a biomass CHP system connected to a district heating network but, due to current limitations on technology availability, a large heat load (i.e. a significant scale development) is required for this strategy to be available. Limited availability of biomass CHP technology at smaller scales and the constraints on installation of medium to large-scale wind turbines in many development sites mean that the Code Level 6 energy strategy is very challenging.

Code for Sustainable Homes 12 Cost review
Summary of extra-over costs of building to each level of the Code in each of the dwelling types and for a range of development scenarios.
Extra-over costs (E/O) costs are measured from a baseline of constructing a 2006 Building Regulation compliant dwelling and are tabulated as an absolute cost and as a % increase over the base build cost.
E/O cost % E/O cost % E/O cost % E/O cost %
1 £310 0.5% £230 0.3% £360 0.4% £310 0.3%2 £1,670 2.8% £1,620 1.9% £1,040 1.1% £970 1.0%3 £2,460 4.1% £2,420 2.8% £3,020 3.2% £2,680 2.7%4 £5,610 9.4% £7,360 8.5% £8,140 8.7% £6,030 6.0%5 £17,740 29.7% £24,370 28.2% £26,830 28.6% £30,130 30.1%6 £28,510 47.7% £34,810 40.3% £38,730 41.2% £42,770 42.8%
1 £260 0.4% £170 0.2% £260 0.3% £270 0.3%2 £1,560 2.6% £1,500 1.7% £890 0.9% £810 0.8%3 £2,340 3.9% £2,000 2.3% £2,900 3.1% £2,510 2.5%4 £5,440 9.1% £7,190 8.3% £7,970 8.5% £5,860 5.9%5 £17,570 29.4% £24,200 28.0% £26,650 28.4% £29,960 30.0%6 £19,580 32.8% £26,550 30.7% £28,390 30.2% £31,230 31.2%
1 £250 0.4% £160 0.2% £250 0.3% £260 0.3%2 £1,550 2.6% £1,490 1.7% £890 0.9% £810 0.8%3 £2,340 3.9% £2,000 2.3% £2,890 3.1% £2,510 2.5%4 £6,360 10.6% £6,200 7.2% £6,580 7.0% £6,470 6.5%5 £16,640 27.9% £23,210 26.8% £25,580 27.2% £28,790 28.8%6 £23,210 38.9% £29,920 34.6% £32,390 34.5% £36,040 36.0%
1 £320 0.5% £230 0.3% £330 0.4% £320 0.3%2 £1,620 2.7% £1,560 1.8% £990 1.1% £880 0.9%3 £2,160 3.6% £2,120 2.5% £2,720 2.9% £2,380 2.4%4 £5,350 9.0% £7,150 8.3% £7,860 8.4% £6,910 6.9%5 £17,310 29.0% £26,970 31.2% £29,260 31.1% £32,270 32.3%6 £27,650 46.3% £37,400 43.3% £40,800 43.4% £45,230 45.2%
1 £270 0.5% £190 0.2% £370 0.4% £290 0.3%2 £1,550 2.6% £1,500 1.7% £920 1.0% £810 0.8%3 £2,090 3.5% £2,050 2.4% £2,650 2.8% £2,310 2.3%4 £5,280 8.8% £7,080 8.2% £7,800 8.3% £6,840 6.8%5 £17,240 28.9% £26,900 31.1% £29,190 31.1% £32,200 32.2%6 £24,080 40.3% £31,250 36.1% £33,090 35.2% £36,180 36.2%
1 £270 0.5% £180 0.2% £370 0.4% £290 0.3%2 £1,550 2.6% £1,490 1.7% £920 1.0% £810 0.8%3 £2,090 3.5% £2,050 2.4% £2,640 2.8% £2,310 2.3%4 £5,280 8.8% £7,080 8.2% £7,790 8.3% £6,830 6.8%5 £17,230 28.8% £26,890 31.1% £29,190 31.1% £32,200 32.2%6 £27,710 46.4% £34,620 40.0% £37,090 39.5% £40,990 41.0%
Large Urban (3600 dwellings at 80 dph)
Small greenfield (10 dwellings at 40dph)
Medium edge of town (650 dwellings at 40 dph)
Large edge of town (3,300 dwellings at 40 dph)
Code Level
Small brownfield (20 dwellings at 80 dph)
Medium Urban (350 dwellings at 80 dph)
2b-Flat 2b-Terrace 3b-Semi 4b-Detached

Code for Sustainable Homes 13 Cost review
2 INTRODUCTION
2.1 Overview This report presents the findings of research into the cost of building to the Code for Sustainable Homes. The study was conducted for the Department for Communities and Local Government (CLG), which is responsible for planning policy and building regulation in England, including administration of the Code. As part of its strategy to protect the environment and address carbon emissions, CLG is proposing to gradually tighten building regulations to increase the energy efficiency of new homes and thus reduce their carbon impact. In parallel with these changes to building regulations, the Code for Sustainable Homes has been introduced as a tool to encourage home builders to create more sustainable dwellings, and to inform buyers about the green credentials of their new property. The Code is intended to provide a route map, signalling the direction of change toward low carbon, sustainable homes that will be mandated through the Building Regulations.
The changes to building regulations will be phased over a number of years. The current strategy includes introducing changes to Part L (Conservation of Fuel and Power) in 2010 and 2013. A number of incremental changes to Code assessment are also being proposed, which aim to ensure that it remains effective in fulfilling its aims and to retain alignment with building regulations. Before any changes to Code assessment can be formally adopted, an Impact Assessment must be conducted to assess the costs and benefits of the proposed amendments. The requirement for an Impact Assessment, including a full cost-benefit analysis for all proposed amendments to the Code, provides the principal driver for the cost review detailed in this report.
2.2 Objectives The objectives of this study were to:
• Consult with the construction industry to build a comprehensive dataset of market-tested costs for complying with each level of the Code for Sustainable Homes.
• Assess the cost implications of building to the Code, including an analysis of the sensitivity of overall cost to the approach taken to Code compliance.
• Conduct an Impact Assessment in relation to the proposed changes to Code assessment criteria.

Code for Sustainable Homes 14 Cost review
3 BACKGROUND The Code for Sustainable Homes is a vital tool for improving environmental performance and reducing CO2 emissions from new homes. The extensive framework provided by the Code sets challenging targets in a range of categories; from energy use and CO2 emissions, to water consumption, to site ecology.
The Code was launched by the Department for Communities and Local Government in December 2006. Around that time and in the months following the introduction of the Code, studies were undertaken to review the cost of building to the Code and the technical implications of the different Code levels.2 Whilst the industry had some experience of achieving some of the targets set in the Code (through experience of the EcoHomes standard, for example), the cost estimations were based on a limited amount of data.
The CSH technical guidance came into effect in April 2007, and it became possible to assess new homes built in England from this date. Since then, the number of Code homes completed has steadily increased, leading to increased volume and robustness of cost data in terms of extra over cost of building to the Code. A review of and update to the costs was required by CLG in order to quantitatively assess the impacts of proposed future changes to the Code.
Although building to the Code remains voluntary, the number of Code homes is expected to increase significantly in the coming years. When the proposed changes to Part L of the building regulations come into effect in 2010 the energy efficiency standards required (in terms of Dwelling Emission Rate) will correspond to the mandatory requirement for Code level 3. Since meeting the energy performance targets is one of the more costly aspects of the Code, the extra over spend to build to Code level 3, will have declined. Furthermore, many local authorities now require some level of Code compliance in large scale developments, and Code level 3 is mandatory for social housing if a Government grant is sought.
The remainder of this section gives an overview of the Code, including proposed changes to the requirements. For full details of the Code please refer to the Technical Guide.3
3.1 Categories and Issues The Code requires new homes to be assessed against nine design categories:
• Energy / CO2
• Water
• Materials
• Surface water run-off
• Waste
• Pollution
• Health and well-being
• Management
• Ecology
2 See for example: http://www.communities.gov.uk/documents/planningandbuilding/pdf/codecostanalysis.pdf 3 http://www.communities.gov.uk/publications/planningandbuilding/codeguide

Code for Sustainable Homes 15 Cost review
Each category is further sub-divided into a number of discrete issues, for example, the Materials category consists of three issues: Mat 1 (Environmental impact), Mat 2 (Sourcing – basic elements), and Mat 3 (Sourcing – finishing elements).
The number of issues per category varies, with a sum total of issues across all categories of 34. Credits are scored against issues, with higher performance being rewarded with more credits against any particular issue, up to the maximum number of credits available for the issue.
3.2 Mandatory Issues Building to any given level of the Code is currently voluntary. However, a Code rating for new dwellings became mandatory from May 1st 2008. If no target Code level is sought, the dwelling is given a ‘Nil Rated’ status. In order to achieve any of the Code levels from 1–6, certain mandatory requirements must be met; these are summarised below.
Table 1: Mandatory issues
Code Level Issue Code Description
1 2 3 4 5 6
Environmental impact4
At least three key elements to achieve a Green Guide rating of A+ to D Mat 1
Mandatory Credits - - - - - -
Surface water run-off Ensure peak rate of run-off into watercourses will not increase as a result of development Sur 1
Mandatory Credits - - - - - -
Waste storage Allocate space for waste storage in line with British Standard 5906 Was 1
Mandatory Credits - - - - - - Construction waste
management Develop and implement a site waste management plan to
monitor and report on waste generated on site Was 2 Mandatory Credits - - - - - -
Uncredited m
andatory issues
% improvement on TER 10% 18% 25% 44% 100% ZCH
Ene 1 Mandatory Credits 1 3 5 8 14 15
Mandatory to comply with all principles of
Lifetime Homes No No No No No Yes
Hea 4
Mandatory Credits - - - - - 4 Maximum internal
water use (litres/person/day)
120 120 105 105 80 80 Wat 1
Mandatory Credits 1 1 3 3 5 5
Mandatory issues
Current Code assessment defines four mandatory issues with no associated credits. For each of these a single requirement must be met, irrespective of the Code level sought. Provided the minimum performance standards are met for each of the uncredited issues, further mandatory issues must be
4 Key elements include: Roof, External Walls, Internal Walls, Upper and Ground Floors, Windows.

Code for Sustainable Homes 16 Cost review
considered before a Code rating is granted. Minimum mandatory standards increase with Code level sought for the Ene 1 and Wat 1 issues (dwelling emission rate and indoor water use). The definition for zero carbon homes in the Code at Level 6 corresponds to a decrease in DER to a sufficient level to offset all predicted electricity use in the dwelling, and is calculated in accordance with the Code Technical Guide.
3.3 Credits and Scoring The overall Code level attained is based upon the Total Percentage Points Score (TPPS), subject to the mandatory requirements described above being met. The TPPS is calculated after credits are converted into points by applying environmental weighting factors. Different weighting factors apply for different categories, thus making credits in certain categories more valuable in terms of contribution to the overall score.
The following table summarises the Code issues, including the maximum number of credits available by issue and the weighting factors for each category.
Table 2: Summary of Code categories, issues, and available credits
Category Issue key Issue title
Maximum credits
available
Weighting factor (%)
Weighted value of
each credit
Ene 1 Dwelling Emission Rate (DER) 15
Ene 2 Building Fabric 2
Ene 3 Internal Lighting 2
Ene 4 Drying Space 1
Ene 5 Eco-labelled White Goods 2
Ene 6 External Lighting 2
Ene 7 LZC Energy Technologies 2
Ene 8 Cycle Storage 2
Energy / CO2
Ene 9 Home Office 1
36.4 1.26
Wat 1 Internal Water Consumption 5 Water
Wat 2 External Water Consumption 1 9 1.50
Mat 1 Environmental Impact 15
Mat 2 Sourcing - Basic Elements 6 Materials
Mat 3 Sourcing - Finishing Elements 3
7.2 0.30
Sur 1 SW Run-Off Management 2 Surface Water Sur 2 Flood Risk 2
2.2 0.55

Code for Sustainable Homes 17 Cost review
Was 1 Waste Storage 4
Was 2 Construction Waste Management 2 Waste
Was 3 Composting Facilities 1
6.4 0.91
Pol 1 Insulant GWP 1 Pollution
Pol 2 NOx Emissions 3 2.8 0.70
Hea 1 Daylight 3
Hea 2 Sound Insulation 4
Hea 3 Private Space 1
Health & Well-Being
Hea 4 Lifetime Homes 4
14 1.17
Man 1 Home User Guide 3
Man 2 Considerate Constructors Scheme 2
Man 3 Construction Site Impacts 2 Management
Man 4 Security 2
10 1.11
Eco 1 Ecological Value of Site 1
Eco 2 Ecological Enhancement 1
Eco 3 Protection of Ecological Features 1
Eco 4 Change in Ecological Value 4
Ecology
Eco 5 Building Footprint 2
12 1.33
The sum of the credits achieved in each category is divided by the total available for that category and multiplied by the category weighting factor, giving a percentage points score for the category. The TPPS is the sum of all the percentage points scores and the minimum TPPS requirement increases with Code level, as summarised below.
Table 3: Minimum Total Percentage Points Score requirement by Code level
Code Level 1 2 3 4 5 6 Minimum TPPS 36 48 57 68 84 90

Code for Sustainable Homes 18 Cost review
3.4 Changes to the Code There have been a number of changes to the Code Technical Guide since its first publication in April 2007. Changes are made in response to feedback from Code assessors, developers, and other stakeholders, and also to keep the Technical Guide in line with other related legislation (building regulations, SAP, etc).5
For the purposes of continuity, CLG generally aims to minimise changes to the Code. Details of currently proposed revisions to the Code are given in the December 2009 Impact Assessment which accompanies the consultation on the Code for Sustainable Homes and the Energy Efficiency standard for Zero Carbon Homes.6
5 See, for example: http://www.planningportal.gov.uk/uploads/code_for_sustainable_homes_techguide_changes_summary_april08.pdf http://www.planningportal.gov.uk/uploads/code_for_sustainable_homes_techguide_changes_summary.pdf 6 http://www.communities.gov.uk/publications/planningandbuilding/futureofcodeconsultation.

Code for Sustainable Homes 19 Cost review
4 RESEARCH METHODOLOGY
4.1 Industry Consultation The assembly of a high quality and comprehensive data set of the costs of achieving credits against each Code issue was central to this study. This involved an extensive consultation with the house building industry to understand the approaches taken to Code compliance and the associated costs of meeting various Code levels.
The industry consultation also guided the modelling approach taken, ensuring that the dwellings and developments considered were suitably representative. Furthermore, working with developers across the industry gave an understanding of the perception of the Code and the likely impacts on house builders.
A key finding arising from the industry consultation was that as-constructed cost data on Code homes remains relatively scarce. Despite the plans of many developers to build Code homes, at the time of the research the number of post-construction certificates (certifying Code homes) stood at a relatively modest figure at around 40. Feedback from the industry revealed a consensus that due to the relatively low number of Code homes completed, there has not yet been a convergence toward standard solutions for which the costs are well-understood. Instead, a wide variety of strategies are being adopted leading to large variations in the costs incurred at any given Code level.
Variation in extra over cost between developers also arises due to differences in standard practice between developers. For example, where measures to achieve Code compliance are added to a developer’s base specification the extra over cost is sensitive to the details of that base specification; i.e. measures that are standard for one developer may not be for another, and could therefore be viewed as free in one case but seen as an extra over cost in another.
Given the limited data, particularly at high Code levels, and variability in solutions adopted, the consultants’ own experience and costing expertise has been required to produce a complete cost data set for use in the cost modelling exercise.
4.2 Cost Data Validation The ultimate aim of consulting with the construction industry and gathering a cost data set was to obtain market-tested costs representative of mass market solutions that could be input into a model designed to analyse the costs of building to the Code. Given the wide range of data sources, a data validation exercise was necessary to ensure valid data was retained while atypical costs (such as expensive one-off bespoke solutions) were filtered out. This data validation process also highlighted where significant cost variations occur, against which issues for example, and therefore led to an understanding of the key sensitivities in deriving costs of building Code homes.
4.3 Modelling Methodology The key outputs of this work include estimations of the additional cost of building homes to the Code, above the base cost of construction in line with building regulations. These costs were derived from a model, designed to allow assessment of the extra over costs of building to each Code level, for different dwellings in a range of development types. Furthermore, the model can be used to analyse the costs of building to the Code in future years, based on technology cost projections and assumptions regarding the building regulations in the future. The following figure summarises the model operation.

Code for Sustainable Homes 20 Cost review
Figure 1: Overview of modelling methodology
The extra over costs to a developer of building to a given Code level are sensitive to numerous factors, including:
• Approach taken to achieve the required reduction in dwelling emission rate (DER) relative to target emission rate.
• Standard practice of the developer, including working practices and standard specifications.
• Development location – site characteristics may influence the cost of achieving the required DER and also affect the cost of achieving credits in categories such as Surface Water, Management, and Ecology.
• Building regulations in force in the year in question. Reported costs are over and above the cost of building to building regulations.
In order to capture and model these sensitivities a semi-automated modelling approach was adopted. Figure 1 shows that the inputs to the model, which include specification of the ‘Ene 1 option’. This is the strategy designed to achieve the mandatory improvement in DER for the target Code level. A variety of Ene 1 options was defined for each Code level, reflecting the range of alternative approaches possible. The options include individual (house-by-house) energy solutions and community (site-wide) energy schemes and are described in detail in section 6.
As well as the year in question and the target Code level, the other manual input to the model is the development to be modelled. The different development scenarios were characterised by varying scale (total number of dwellings constructed), ecology of site (greenfield and brownfield), dwelling mix (proportion of different dwelling types), and dwelling density. The main impact of development type is on the energy solutions available and their costs, as some technologies are only applicable at or above certain scales and district heating costs are sensitive to dwelling density.
Once all manual inputs are defined, the model checks whether all mandatory issues have been satisfied (including uncredited and credited issues), and if not corrective action is taken through the
Year
Target Code level Development
Scenario Energy Strategy (Ene
1 option)
Credits achieved by issue
E/O cost of achieving credits by issue
Benefits (dwelling fuel bill savings, annual CO2 savings, water
savings)
Implementation of mandatory issues (for
target Code level)
Automatic implementation of other measures to meet target
Code level (based on most cost effective
solutions)
INPUTS OUTPUTS MODEL
Code for Sustainable Homes 21 Cost review
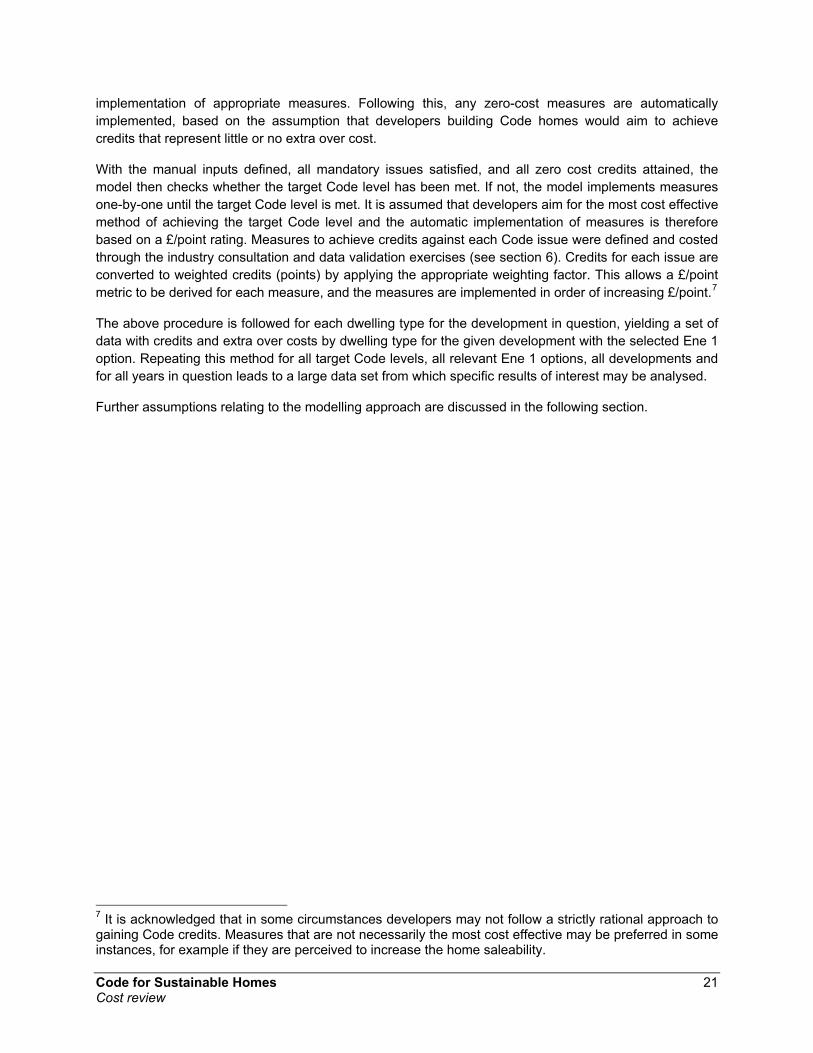
implementation of appropriate measures. Following this, any zero-cost measures are automatically implemented, based on the assumption that developers building Code homes would aim to achieve credits that represent little or no extra over cost.
With the manual inputs defined, all mandatory issues satisfied, and all zero cost credits attained, the model then checks whether the target Code level has been met. If not, the model implements measures one-by-one until the target Code level is met. It is assumed that developers aim for the most cost effective method of achieving the target Code level and the automatic implementation of measures is therefore based on a £/point rating. Measures to achieve credits against each Code issue were defined and costed through the industry consultation and data validation exercises (see section 6). Credits for each issue are converted to weighted credits (points) by applying the appropriate weighting factor. This allows a £/point metric to be derived for each measure, and the measures are implemented in order of increasing £/point.7
The above procedure is followed for each dwelling type for the development in question, yielding a set of data with credits and extra over costs by dwelling type for the given development with the selected Ene 1 option. Repeating this method for all target Code levels, all relevant Ene 1 options, all developments and for all years in question leads to a large data set from which specific results of interest may be analysed.
Further assumptions relating to the modelling approach are discussed in the following section.
7 It is acknowledged that in some circumstances developers may not follow a strictly rational approach to gaining Code credits. Measures that are not necessarily the most cost effective may be preferred in some instances, for example if they are perceived to increase the home saleability.

Code for Sustainable Homes 22 Cost review
5 BASELINE ASSUMPTIONS
5.1 Basic Dwelling Types The house types used for evaluating the cost of the Code are based on average types that are common to most developments, covering houses and flats. For consistency with other relevant policy work, the dwellings modelled are equivalent to those considered in recent analysis of changes to Part L (in support of the recent public consultation8).
Table 4: Dwelling types
2 bed mid-floor flat 2 bed mid-terrace 3 bed semi-
detached 4 bed detached
Total floor area (m2) 61 73 88 118
Ground floor area (m2) 61 36.5 44 59
First floor area (m2) N/A 36.5 44 59
Gross external wall area (m2) 38.8 52 101.5 154.5
Net external wall area (m2) 32.8 38 83.5 132.5
Roof area9 (m2) 61 36.5 44 59 Area of external
doors (m2) 0 4 4 4
Window area (m2) 6 10 14 18 Average storey
height (m) 2.5 2.5 2.5 2.5
The ‘ground floor area’ and ‘roof area’ figures for the flat were set to zero for the purposes of the SAP calculations; i.e. it is assumed that the flats above and below this mid-floor flat have the same internal temperature as the flat modelled, hence there is no heat loss through the ceiling or floor. A mid-floor flat is assessed rather than a ground floor or a top floor flat, since a mid-floor flat has the best baseline energy performance in a block, which makes achieving the required reduction in DER more challenging. It can then be concluded that, based on the same areas and plan configurations between all flats in a block, achieving Code levels 3, 4 and 5 for a top or a ground flat is no more expensive than achieving the same levels for a mid-floor flat.
5.1.1 Specifications of the Basic Dwelling Types Baseline specifications of the dwellings were set to achieve compliance with 2006 building regulations. Traditional masonry construction is the default construction method used in this study. Base specifications are summarised in the table below.
8 Proposals for amending Part L and Part F of the Building Regulations – Consultation, June 2009 9 This is the roof area for insulation, rather than area available for roof-mounted technologies such as PV arrays. Assumptions relating to LZC technologies are given in appendix 2.

Code for Sustainable Homes 23 Cost review
Table 5: Specifications of baseline dwellings
Specification U-value (W/m2K) Element
Masonry Timber Frame Flat Terrace Semi-
detached Detached
Ground floors, solid
Concrete screed (70mm) Rigid PIR board (65mm) 25mm edge insulation
0.25 0.20 0.25 0.20
External walls
Brick outer leaf (100mm) MiF batts
λ=0.032m2K/W (65mm)
Ties (12.5mm csa)
AAC Block (100mm) Plaster
Brick outer leaf
(100mm) Air gap Vapour
permeable layer
Rigid PIR board
(75mm) between 125 timber stud
VCL Air gap
Plasterboard
0.35 0.25 0.25 External walls
Roof (cold loft)
Cold loft, timber truss: Wool insulation (100mm)
Wool insulation between joists (100mm)
Concrete roof tile
0.25 0.18 0.18 0.18
Windows & doors
Timber frame with trickle vents
Double glazing 4/18/4 Air 2.2 1.8 1.8 2.2
Heating & hot water
90% efficient gas boiler to meet 90% of thermal
demands 100% efficient electric heating
to meet 10% of thermal demands
N/A N/A N/A N/A
Thermal bridging y value = 0.08W/m2K N/A N/A N/A N/A
Air permeability q50 = 10m3/m2/hr N/A N/A N/A N/A
Ventilation Natural ventilation N/A N/A N/A N/A Lighting 25% low energy light fittings N/A N/A N/A N/A
5.1.2 Energy Performance of Baseline Dwellings Carbon dioxide emissions from domestic dwellings are expressed as a Dwelling Emission Rate (DER), in kilograms of CO2 per square metre of floor area per year, and are calculated using the government’s Standard Assessment Procedure (SAP). The SAP methodology is also used to determine a Target

Code for Sustainable Homes 24 Cost review
Emission Rate (TER) for the dwelling in question. The TER is calculated for a building of the same form as the actual dwelling, but with specific areas of openings (windows, doors etc) and specific U-values for each of the primary elements (defined in the SAP Technical Guide). For the purposes of Part L, the performance of a dwelling in terms of CO2 emissions is measured by comparing the DER to the TER and expressing the difference as a percentage improvement (relative to TER).
The TER calculation was performed for each of the four dwelling types defined, giving a benchmark against which the effectiveness of alternative improvement measures was compared. The TER values and performance of the dwellings with baseline specifications are given below.
Table 6: Target emission rate and DER of reference dwellings
Dwelling TER (kgCO2/m2/yr)
DER with baseline specification (kgCO2/m2/yr)
% improvement (DER vs TER)
Flat 18.3 18.1 1.2% Terrace 20.6 20.5 0.6%
Semi 22.6 22.1 2.0% Detached 22.3 21.9 1.7%
The SAP methodology is currently being updated. However, the new version of SAP was not available for this study and all energy / CO2 modelling was performed using the existing SAP 2005 method (version 9.82).
5.1.3 Baseline Build Costs Detailed cost plans were prepared for each baseline dwelling, based on a Quantity Surveyor’s take-off from the drawings and an analysis of the baseline specifications. The cost plan for the flats was drawn up for a four storey block of eight flats. The estimated capital costs for each baseline dwelling are summarised below. The costs of Code compliance are over and above these base capital costs.
Table 7: Baseline build costs
Dwelling type Gross floor area (m2) Total Capital Cost (£) Cost (£/m2) 2 bed mid-floor flat 61 £59,725 £980 2 bed mid-terraced 73 £86,470 £1,185
3 bed semi-detached 88 £93,940 £1,070 4 bed detached 118 £99,975 £850
These costs exclude VAT, professional fees and any abnormal / foundation costs such as piling works. Costs are based on competitively tendered 4th Quarter 2008 prices with no allowance for future inflation.
5.2 Development Scenarios The dwelling types described above were combined in various ways to create a range of development scenarios. These scenarios were derived taking into account input from the house building industry, so as to best represent typical developments. The scenarios represent developments constructed and the range of developer sizes, from small scale developers with up to a few tens of completions per year to the largest national house builders with the expertise to develop sites of thousands of homes. The development scenarios are summarised in the table below.

Code for Sustainable Homes 25 Cost review
Table 8: Development scenarios
Dwelling mix Scenario number Description
Dwelling density (dph)
Total number
of dwellings Flats Terraced Semi Detached
Brownfield
1 Small brownfield 80 20 40% 35% 20% 5%
2 City infill 160 10 100% 0% 0% 0%
3 Medium urban
(mixed) 80 350 50% 25% 20% 5%
4 Medium urban (flats) 160 400 100% 0% 0% 0%
5 Large urban (mixed) 80 3,600 50% 25% 20% 5%
6 Large urban (flats) 160 4,300 100% 0% 0% 0%
Greenfield
7 Small infill 40 10 0% 60% 20% 20%
8 Small greenfield 40 50 40% 30% 20% 10%
9 Small edge of town 40 10 0% 40% 20% 40%
10 Medium edge of
town 40 650 30% 30% 20% 20%
11 Large edge of town 40 3,300 30% 30% 20% 20%
12 Strategic 40 5,000 30% 20% 25% 25%
The variation in the costs of meeting each Code Level are analysed with reference to these representative development scenarios.

Code for Sustainable Homes 26 Cost review
5.3 Key Assumptions The modelling work is based on a number of key assumptions. The costs of measures used to achieve credits and assumptions on an issue-by-issue basis are summarised in section 6 and the LZC technology costs and technical assumptions are given in appendix 2 (see Section 10). This section presents other key assumptions made in deriving the costs presented in section 7.
5.3.1 Changes to Building Regulations over Time Part L of the building regulations is due to change in 2010 and 2013, and will tighten the energy performance standards of all new dwellings. Changes in 2010 / 2013 will require new dwellings to achieve a 25% / 44% improvement in DER relative to TER, equivalent to Code 3 / Code 4 mandatory Ene 1 requirements.
This work considers the extra over cost of building to the Code, over and above the cost of constructing dwellings to comply with building regulations. The minimum cost of satisfying Part L in the year in question is therefore subtracted from the cost of whichever Ene 1 option is implemented. For example, analysis of the costs of achieving a 25% improvement in DER via the alternative Ene 1 options defined showed that the lowest cost method in certain scenarios is to specify ‘Better’ fabric and a small PV system (see section 6.1.1 for full list of options). The cost of this energy option is therefore subtracted from the cost of the energy option implemented in the years 2010 to 2012 inclusive in those development scenarios in order to determine the extra-over cost of the energy system. Similarly, the lowest cost solution for achieving the 44% improvement target is based on an air source heat pump with PV. This cost is subtracted from all energy options in the years from 2013.
The effect of tightening Part L standards was taken into account in the modelling work. For example, the Ene 1 options defined to satisfy the mandatory requirements of Code levels 1 and 2 (10% and 18% improvements respectively) become redundant after 2010 since building regulations require at least a 25% improvement in DER relative to TER. Similarly, the Code 3 Ene 1 options, which give a 25% improvement, are not implemented in the years from 2013. The implications of changes to the Building Regulations on the extra-over costs of the Code are specifically addressed in Section 7.4.
5.3.2 Low and Zero Carbon Technologies In order to meet the higher Code level requirements, some sort of LZC technology is generally required. It was assumed that developers would aim to just achieve the required improvement in DER in order to minimise the additional cost; hence PV and SHW technologies were sized to just allow the target to be met.
Where a technology able to meet all of the dwelling’s thermal demands was specified an offset benefit was included to account for the fact that a traditional heating system (gas boiler) would not be required. The installed cost of a high efficiency condensing gas boiler was assumed to be £1,000 for flats and terraced houses, £1,100 for semi-detached houses, and £1,200 for detached houses.

Code for Sustainable Homes 27 Cost review
6 MEETING CODE STANDARDS
6.1 Energy
6.1.1 Mandatory Requirement: Ene 1 – Dwelling Emission Rate With nine distinct issues and an overall weighting factor of 36.4%, the Energy category represents a major source of Code credits. In the Energy category Ene 1, Dwelling Emission Rate, is the only issue with mandatory requirements for each Code level. A mandatory requirement under Ene 2, Building Fabric, forces all Code 6 homes to achieve a Heat Loss Parameter of 0.8W/m2K or below. As discussed above, the required improvement in DER may be achieved via various methods, however a common approach is to improve the building’s fabric to reduce heat loss and minimise air permeability. Three different fabric improvement packages were therefore defined, giving the dwellings superior thermal performance compared to baseline specifications. These packages are referred to as ‘Good’, ‘Better’, and ‘Best’, and are summarised below. Details of the cost breakdown by element are included in appendix 1 (see Section 9).
Table 9: U-values for the fabric improvement packages
U-value (W/m2K) Element
Good Better Best Ground floors 0.20 0.15 0.10 External walls 0.25 0.20 0.15
Roof 0.18 0.15 0.10 Windows and Doors 1.5 1.10 0.70
Thermal bridging y value (W/m2K) 0.08 0.04 0.02
Air permeability, q50 (m3/m2/hr) 7 4 1
Table 10: Total fabric package costs (including costs of improving U-values, reducing air permeability and thermal bridging, and MVHR systems where necessary)10
Fabric package Flat Terrace Semi Detached Reference – base cost £5,266 £17,260 £25,516 £36,165
Good – E/O cost relative to ‘Reference’ package £215 £42 £186 £243
Better – E/O cost relative to ‘Reference’ package £1,358 £1,992 £2,539 £3,066
Best – E/O cost relative to ‘Reference’ package £4,268 £6,845 £8,642 £10,334
Standard practice dictates that when the air tightness of a dwelling is reduced to very low values (from c.3m3/m2/hr and below), a mechanical ventilation system becomes necessary. In this study it was assumed that where a mechanical ventilation system is required, a system incorporating heat recovery 10 For a full breakdown of cost assumptions see section 9.

Code for Sustainable Homes 28 Cost review
would be specified. Therefore, all dwellings with the ‘Best’ fabric package also include a mechanical ventilation with heat recovery (MVHR) system.
In order to meet the requirements of Code levels 3 and above it is often necessary to employ some form of low or zero carbon technology to provide the dwelling with heat and/or electricity. A variety of options for meeting the different mandatory DER targets were defined and are summarised below. It should be noted that while some of these options are used by developers, not all have necessarily been tested in practice. Some of the options are based on assumptions regarding the availability of future technology, for example the micro gas CHP unit in option 12 is based on a fuel cell system with a low heat to power ratio. Furthermore, this list is not intended to be fully comprehensive, but aims to represent the most common and most likely energy solutions. It is acknowledged that there are other alternative methods of achieving the target DER levels.

Code for Sustainable Homes 29 Cost review
Table 11: Ene1 options for meeting required improvements in DER
Actual % improvement (DER on TER) Option
no. Target % Description Flat Mid-
terrace Semi Detached
1 10% ‘Good’ fabric – flat, semi, detached ‘Good +’ fabric – terrace (see Note
1) 11% 10% 11% 11%
2 18% ‘Better +’ fabric – flat
‘Better’ fabric – terrace ‘Good+’ – semi, detached
18% 19% 19% 20%
3 25% ‘Good’ fabric, PV 30% 27% 26% 27%
4 25%
‘Better’ fabric – detached ‘Best’ fabric, MVHR – flat, terrace,
semi Add SHW for flat
25% 29% 36% 27%
5 25% ‘Good’ fabric, ASHP 30% 27% 30% 31%
6 25% ‘Better’ fabric – detached
‘Better’ fabric, PV – flat, terrace, semi
26% 26% 30% 27%
7 25% ‘Better’ fabric – detached
‘Better’ fabric, SHW – flat, terrace, semi
25% 25% 27% 27%
8 44% ‘Better’ fabric, ASHP
Add PV for flat, terrace, semi 48% 46% 46% 45%
9 44%
‘Best’ fabric, MVHR, biomass block heating – flat
‘Best’ fabric, MVHR, individual biomass boilers – houses
73% 71% 74% 75%
10 44% ‘Best’ fabric, MVHR, PV 47% 48% 45% 44%
11 44% ‘Good’ fabric, community gas CHP 67% 67% 68% 68%
12 44% ‘Good’ fabric, micro gas CHP 73% 76% 79% 80%
13 100%
‘Best’ fabric, MVHR, PV, biomass block heating – flat
‘Best’ fabric, MVHR, PV, individual biomass boilers – houses
101% 101% 101% 101%
14 100% ‘Best’ fabric, MVHR, PV, community gas CHP 100% 101% 101% 101%
15 ZCH ‘Best’ fabric, MVHR, PV, community gas CHP 185% 172% 163% 151%

Code for Sustainable Homes 30 Cost review
16 ZCH ‘Best’ fabric, MVHR, PV, community biomass CHP 186% 173% 162% 152%
17 ZCH
‘Best’ fabric, MVHR, PV, biomass block heating – flat
‘Best’ fabric, MVHR, PV, individual biomass boilers – houses
185% 172% 161% 151%
Note 1 – The ‘Good+’ and ‘Better+’ fabric packages describe fabric specifications that are in the range between Good to Better and Better to Best, respectively. These packages have been defined in order to closely match the DER reductions required by Code Levels 1 & 2, in cases where the ‘Good’, ‘Better’ and ‘Best’ packages do not provide a close match (e.g. for the terrace house type, the ‘Good’ fabric specification falls short of the 10% DER/TER improvement required at Code Level 1, whereas the ‘Better’ package is adequate to meet Code Level 2).
Due to the requirement to deal with unregulated emissions, to achieve Code 6 (ZCH) the target improvements of DER over TER are 184%, 171%, 160%, and 150% for the flat, terraced, semi-detached, and detached houses respectively.
The capital costs associated with each of the Ene 1 options described in Table 11 are shown in Figure 2. Capital costs are shown for each house type. Note that the cost of a number of these energy options, in particular those that involve an element of site-wide infrastructure such as a heating network, vary depending on the nature of the development the particular development. For the purposes of the chart shown below, a development scenario has been selected where all energy options are available (i.e. there is sufficient scale and density for site-wide systems to considered) and each house type is represented.
Assumptions on the cost of the technologies and sizing methods used are given in the Appendices (Section 10).

Code for Sustainable Homes 31 Cost review
£0
£5,000
£10,000
£15,000
£20,000
£25,000
£30,000
£35,000
£40,000
'Goo
d' fa
bric
(F&
D),
'Bet
ter'
fabr
ic (T
&S)
'Bet
ter'
fabr
ic (h
osue
s), 'B
est'
fabr
ic (F
)
'Goo
d' fa
bric
+ P
V
'Bet
ter'
fabr
ic (D
), 'B
est'
fabr
ic +
MV
HR
(F,T
,S)
+ S
HW
(F
onl
y)
'Goo
d' fa
bric
+ A
SH
P
'Bet
ter'
fabr
ic +
PV
(F,T
,S)
'Bet
ter'
fabr
ic +
SH
W (F
,T,S
)
'Bet
ter'
fabr
ic +
ASH
P +
PV (
F,T,
S)
'Bes
t' fa
bric
+ M
VHR
+ BM
blo
ck h
eatin
g (fl
ats)
/ in
divi
dual
BM
boi
lers
(hou
ses)
'Bes
t' fab
ric +
MVH
R +
PV
'Goo
d' fa
bric
+ c
omm
unity
gas
CH
P
'Bes
t' fab
ric +
MVH
R +
PV +
blo
ck B
M h
eatin
g (fl
ats)
/ in
divi
dual
BM
boi
lers
(hou
ses)
'Bes
t' fab
ric +
MVH
R +
PV +
com
mun
ity g
as C
HP
'Bes
t' fa
bric
+ M
VH
R +
gas
CH
P +
PV
'Bes
t' fab
ric +
MVH
R +
com
mun
ity B
M C
HP
+ PV
'Bes
t' fa
bric
+ M
VHR
+ BM
blo
ck h
eatin
g (fl
ats)
/ In
divi
dual
BM
boi
lers
+ P
V
E/0
cost
of o
ptio
ns t
o m
eet m
anda
tory
Ene
1 s
tand
ards
Flat
Terrace
Semi
Detached
Figure 2: Variation in extra-over cost of energy strategy for each house type in a Large Urban development scenario

32
6.1.2 Other Issues in the Energy Category With up to 15 credits available, the DER issue (Ene 1) accounts for the majority of credits in this category. However, there are a further 14 credits allocated against the remaining eight issues, which are summarised below.
Table 12: Energy issues
Issue Credits available Scoring criteria
Ene 1 – DER 15 Credits awarded based on percentage improvement of DER over TER.
Ene 2 – Building Fabric 2 Credits for achieving a heat loss parameter below given levels: HLP ≤ 1.3 = 1 credit, HLP ≤ 1.1 = 2 credits.
Ene 3 – Internal Lighting 2 Credits based on percentage of internal light fittings that are dedicated energy efficient: ≥40% = 1 credit, ≥75% = 2 credits.
Ene 4 – Drying Space 1 Provide adequate drying space (see Technical Guide).
Ene 5 – Eco-labelled White Goods 2
1 credit if fridges and freezers have an A+ rating. 1 further credit if washing machines/dishwashers have an A rating
and/or washer-driers have a B rating. If such goods are not supplied, 1 credit is awarded for
supplying information on the benefits of selecting efficient white goods.
Ene 6 – External Lighting 2 1 credit if all external lighting is provided by dedicated energy
efficient fittings. 1 credit if all security light fittings are designed for energy efficiency and are adequately controlled.
Ene 7 – LZC Energy Technologies 2
1 credit if LZC technology leads to 10% (or greater) reduction in carbon emissions. 2 credits if LZC technology gives a 15%
(or greater) reduction in carbon emissions.
Ene 8 – Cycle Storage 2 Up to 2 credits for providing adequate safe, weatherproof cycle storage facilities.
Ene 9 – Home Office 1 1 credit for providing sufficient space and services to allow a room to be set up as a home office.
The costs of achieving certain heat loss parameters derives from the cost of the fabric improvement packages and are given in appendix 1 (see Section 9). Credits may be scored against Ene 7 as a result of the package of energy measures adopted to achieve the mandatory requirement of Ene 1, and hence the costs of these credits are included in the cost of those packages.

33
Table 13: Cost of credits in the Energy category
Issue Requirement Cost/dwelling
Ene 1 – DER Meet DER improvement target for given dwelling
For cost of Ene 1 options see appendix 2
Ene 2 – Building Fabric Achieve given HLP targets Dependent on fabric
improvement package – see appendix 1
Ene 3 – Internal Lighting Increase proportion of dedicated energy efficient light fittings
£10 per additional energy efficient fitting
Ene 4 – Drying Space Provide adequate drying space £15 for internal tidy-dry over bath
High efficiency ratings £150
Assume £50 per unit and three units per dwelling11 Ene 5 – Eco-labelled White
Goods Information on benefits of
efficient white goods £5
All energy efficient fittings £0 Ene 6 – External Lighting
Sensors, timers etc £45 Ene 7 – LZC Energy
Technologies Reduce CO2 emissions by 10%
or 15% Cost included in cost of Ene 1
options
Ene 8 – Cycle Storage Provide adequate storage £200 for flat (communal storage)
£650 for terrace / semi (shed) £900 for detached house (shed)
Ene 9 – Home Office Provide space and services £80
11 Based on the assumption that the developer provides white goods as part of the base build. If this is not the case, the cost of white goods should also be included if this credit is sought.

34
6.2 Water As for the first Energy issue, Dwelling Emission Rate, the internal water consumption issue has an increasing mandatory requirement. In order to meet each of the water consumption targets, packages of water-saving measures were defined in conjunction with the Code Water Calculator Tool. The tables below summarise the credits available for achieving increasingly stringent water consumption targets and the measures required.
Table 14: Packages of measures to achieve Wat 1 credits – detached house
Water Consumption litres/person/day (CSH credits)
Measure 120 (1)
110 (2)
105 (3)
90 (4)
80 (5)
6/4 litre low flush WCs
4/2.5 litre low flush WCs
2 litre/min washbasin taps
9 litre/min shower
7.5 litre/min shower
7 litre/min shower
120 litre bath
100 litre bath
6 litre/min kitchen taps
Rainwater harvesting
Greywater recycling
Water efficient washing machine

35
Table 15: Packages of measures to achieve Wat 1 credits – flat, terraced, semi-detached
Water Consumption litre/person/day (CSH credits)
Measure 120 (1)
110 (2)
105 (3)
90 (4)
80 (5)
6/4 litre low flush WCs
4/2.5 litre low flush WCs
2 litre/min washbasin taps 9 litre/min shower
7.5 litre/min shower
7 litre/min shower
120 litre bath
100 litre bath
6 litre/min kitchen taps
Rainwater harvesting
Greywater recycling
Water efficient washing machine
The above packages of fittings were priced based on cost data received from developers and the costs of each package of measures are shown below.
Table 16: Cost of meeting internal water consumption targets
Extra over cost Water consumption
(litres/person/day) Flat Terraced Semi Detached
120 £0 £0 £0 £0 110 £0 £0 £0 £0 105 £200 £200 £200 £240 90 £1,550 £3,200 £3,200 £3,500 80 £1,750 £4,200 £4,200 £4,500
All of the fittings in the packages required to achieve water consumption of 120 and 110 litres/person/day can be obtained at no extra cost, since most of these fittings are now adopted as standard by developers.
Achieving a water consumption of 105 litres/person/day would incur an additional cost that relates to specifying more water efficient fittings that are not yet mainstream in the market. Developers reported various costs, with an average of £200. It is worth noting that certain developers, especially the volume house builders, reported that this specific package would incur no extra cost based on volume orders and due to the fact that the Code 3 minimum requirements are set as standard specifications.

36
Low flow fittings combined with rainwater harvesting (individual or communal) is sufficient to achieve 90 litres/person/day consumption. Costs listed are for an individual system for houses and a communal system for flats. A communal system may be available for houses (specifically for terraced) and could be a lower cost solution than the individual system.
A greywater recycling system is required to achieve the Code 6 level of 80 litres/person/day. This must be accompanied by a water efficient washing machine. Costs listed are for an individual greywater recycling system for houses and a communal system for flats. No extra cost is given for the washing machine, since if it is part of the base build, then upgrading to a water efficient model would not incur extra cost. If the washing machine is not part of the base build, the cost would then be part of achieving the Ene 5 credit (eco-labelled white goods).
The credit under the Wat 2 issue, external water consumption, may be achieved by specifying a water butt. An extra over cost of £50 per house is used based on a 200 litre water butt and assuming that roof to ground piping is part of the existing roof drainage system. For flats, it was assumed that two water butts per block would be sufficient (at a cost of £100) and the per dwelling cost was found by dividing this figure by number of flats per block.
6.3 Materials A common feature of the responses received during the consultation was the lack of data on extra over cost of achieving credits in the materials category. The general approach towards acquiring materials credits is that points are gained for the base specifications where possible. Where specifications can be slightly altered to gain extra points, then the enhanced specifications are adopted as long as no significant extra cost is incurred. Trying to achieve all points available would most likely mean a drastic change in specifications, construction and supply for certain developers, leading to a significant cost and unquantifiable impact to the developer. This implies that the maximum credits are not likely to be sought, at least for Code levels 3 and 4.
The base specifications for the dwellings considered in this study would ensure that 9 credits are achieved in the Mat 1 category. It is assumed for the purpose of this study that 4 credits and 2 credits can be achieved for no extra cost under Mat 2 and Mat 3 respectively.
Table 17: Cost of credits in the Materials category
Issue Scoring Cost / dwelling Higher Green Guide rating – up
to 9 credits £0 Mat 1: Environmental Impact of
Materials Higher Green Guide rating – additional 6 credits Unquantifiable
Up to 4 credits £0 Mat 2: Responsible Sourcing – Basic Elements Additional 2 credits Unquantifiable
Up to 2 credits £0 Mat 3: Responsible Sourcing – Finishing Elements Additional 1 credit Unquantifiable
6.4 Surface Water Run-off The mandatory requirement of this category forces the developer to ensure that the peak run-off rate of water into watercourses is no greater for the developed site than it was for the site pre-development. The industry consultation revealed no significant cost to meet this condition; hence for this study it is assumed

37
that there is no extra over cost to achieve the uncredited requirement. Reducing surface water run-off and mitigating flood risk is often governed by planning conditions and hence is not an extra over cost due to the Code. The credited issues in this category are shown in the following table.
Table 18: Surface water run-off issues
Issue Credits available Scoring criteria
Sur 1 – Surface Water Run-Off Management 2
2 credits are awarded if SUDS are used to improve the quality of discharged rainwater or if the quality of receiving waters is
protected.
Sur 2 – Flood Risk 2
2 credits available for developments situated in low flood risk areas, if Flood Risk Assessment indicates there is a low risk of
flooding from all sources. 1 credit is available for developments in areas with a medium or high annual probability of flooding if floors and access routes are
raised by at least 600mm above the design flood level of the flood zone.
Costs for flood mitigation are not easily quantified; however a study for the Association of British Insurers in 2005 identified benchmark costs for incorporating flood resilient materials on ground floors.
Table 19: Cost of credits in the surface water run-off category
Credit Requirement Cost Sur 1: Management of Surface
Water Run-off Sustainable Drainage Systems £1,100 per site12
Flood risk assessment £30 – £50 per dwelling Sur 2: Flood risk
Flood risk mitigation13 £4,160 per flat
£16,635 per house
The high cost of measures in this category suggests it is unlikely that developers would seek these credits, unless required by a development/planning condition, or when Code level 5 or 6 is sought.
Feedback from the industry consultation implied that the flood risk assessment is a zero extra over cost activity, but others provided a cost in the range of £30 to £50 per dwelling, based on fees for carrying out the flood risk assessment including surveys. In addition, most developers did not report a cost for sustainable drainage systems, due to either being naturally compliant with the requirement or because specific cost data for specific sites was lacking. A cost of £1,100 per dwelling was reported by one developer, based on whole site SUDS measures.
6.5 Waste The first uncredited mandatory requirement in the Waste category stipulates that space able to accommodate containers with at least the minimum volume recommended by British Standard 5906 must
12 As reported by one developer only. 13 Cost for houses based on data from Association of British Insurers report: http://www.abi.org.uk/display/File/Child/554/Making_Communities_Sustainable_housingsummary.pdf Costs for flats assuming four storey blocks.

38
be allocated for waste storage. Space provision for non-recyclable waste is considered to be part of the base specifications, hence no additional costs are included to meet this requirement. The second mandatory requirement is for a Site Waste Management Plan (SWMP) to be implemented to monitor and report on waste generated on site. A Site Waste Management Plan is a legal requirement on all major sites14 in England and Wales and therefore represents no extra cost.
A total of seven credits are available against voluntary issues in this category.
Table 20: Waste issues
Issue Credits available Scoring criteria
Was 1 – Waste Storage 4
2 credits awarded for providing dedicated internal storage for recyclable household waste (at least three internal storage
bins, of at least 15 litres capacity each, with a minimum total capacity of 60 litres).
4 credits for providing adequate internal storage with either a Local Authority collection scheme, or adequate external
storage capacity.
Was 2 – Construction Site Waste Management 2
1 credit if the SWMP includes procedures and commitments to reduce waste generated on site in accordance with best
practice and defined waste groups. 1 further credit if waste is sorted and diverted from landfill.
Was 3 – Composting Facilities 1 1 credit for providing individual home composting facilities or a
local / community composting service (run by Local Authority).
None of the respondent developers provided costs for external recyclable waste storage, since most Local Authorities have a collection scheme in place, which in addition to the internal storage space is sufficient to achieve all available credits under Was 1.
It is in developers’ interest to reduce waste generated and to reclaim / recycle materials on site as achieving best practice in this area reduces the demand for materials and reduces the need for waste disposal, which is becoming an increasingly costly activity. Achieving the maximum credits against Was 2 is therefore assumed to be free. This assumption was validated by the feedback received from developers in the consultation.
Table 21: Cost of credits in the Waste category
Credit Requirement Cost / dwelling Internal recyclable waste storage £25
Was 1: Waste Storage External recyclable waste storage N/A
Site Waste Management Plan £0 Was 2: Construction Waste Management Waste reduction/recovery £0
Was 3: Composting Facilities Garden composter for houses and internal composter for flats
£50 per house £30 per flat
14 The SWMP regulations are applicable to any development of value greater than £300k which applies to all developments reviewed for this study.

39
6.6 Pollution Four credits are available in this category, which covers the global warming potential (GWP) of insulants and NOx emissions from the heating system.
Table 22: Pollution issues
Issue Credits available Scoring criteria
Pol 1 – GWP of Insulants 1 1 credit if all materials in certain key elements of the dwelling
only use substances with a GWP<5 in manufacture and installation.
Pol 2 – NOx Emissions 3
Credits awarded based on NOx emissions from the space heating and hot water systems:
Dry NOx level (mg/kWh) ≤ 100 = 1 credit. Dry NOx level (mg/kWh) ≤ 70 = 2 credits. Dry NOx level (mg/kWh) ≤ 40 = 3 credits.
Compliance with the GWP requirement for insulation materials can be achieved at no extra cost, as confirmed by all respondent developers. Individual gas boilers with NOx emissions lower than 40mg/kWh are now standard for many developers and hence no extra cost is incurred to achieve all 3 credits for Pol 2. It is worth noting that it is not possible to achieve any of these 3 credits where biomass boilers (individual or site wide) are adopted. This is due to the relatively high NOx emissions resulting from burning biomass or other types of biofuel.
Table 23: Cost of credits in the Pollution category
Credit Requirement Cost / dwelling
Pol 1: Insulant GWP GWP of materials in key elements is less than 5 £0
Pol 2: NOx emissions Reduction of NOx emissions below 100, 70 or 40 mg/kWh £0

40
6.7 Health & Well-Being A total of 12 credits are available in the Health & Well-Being category, against four distinct issues as shown below.
Table 24: Health & Well-Being issues
Issue Credits available Scoring criteria
Hea 1 – Daylighting 3
1 credit if kitchens achieve a minimum average daylight factor of at least 2%.
1 credit if all living and dining rooms achieve a minimum average daylight factor of at least 1.5%.
1 credit if 80% of the working planes in kitchens, living rooms, dining rooms and studies receive direct light from the sky.
Hea 2 – Sound Insulation 4
Credits awarded based on improvement in sound insulation above Part E:
3dB improvement = 1 credit. 5dB improvement = 3 credits. 8dB improvement = 4 credits.
Detached dwellings are awarded 4 credits by default.
Hea 3 – Private Space 1
1 credit for providing private or semi-private outdoor space that allows all occupants to sit outside, allows easy access to all occupants
(including wheelchair users) and is accessible only to occupants of designated dwellings.
Hea 4 – Lifetime Homes 4 4 credits for complying with all principles of Lifetime Homes (see
Technical Guide for details).
On some developments, the clear view of the sky is achieved by default, however, it might be impossible to achieve on others due to site constraints and unavoidable blockages. Nevertheless, careful layout at the design stage that takes into consideration the clear view of the sky requirements can lead to achieving the credit at no extra cost.
Developers provided mixed responses to the cost of achieving the required average daylight factors in living rooms and kitchens. Some developers are revising their designs to ensure sufficient glazing is provided to achieve both credits for daylight factors at a zero cost in future developments. For non compliant designs, an average additional cost of £150 is allowed for extra glazing in kitchens and the same is allowed for extra glazing in living rooms. It is assumed that detached houses have more external wall exposure and hence larger windows are expected to be part of the design, leading to compliance with the required daylight factors.
Several developers reported that a 3dB and a 5dB improvement in sound insulation can be achieved at zero extra cost; however more robust details are required to achieve an 8dB improvement leading to extra works and higher costs. The costs presented in the table below for Hea 2 cover sound testing costs only per dwelling (based on testing requirements in Approved Document E) for the 3dB and 5dB improvements, and sound testing costs and improved details for the 8dB improvement.

41
Table 25: Cost of credits in the Health & Well-Being category
Credit Requirement Cost / dwelling Achieve view of the sky £0
Daylight factors in kitchen of 2% £150 Hea1: Daylight Daylight factors in living rooms of
1.5% £150 in flats, terraced, semi
£0 in detached
3dB improvement £150 for a flat
£100 for terraced & semi
5dB improvement £150 for a flat
£100 for terraced & semi Hea2: Sound insulation
8dB improvement £250 for a flat
£200 for terraced & semi
Hea 3: Private Space Provide a private or semi-private outdoor space £0
Hea 4: Lifetime Homes Comply with all principles of Lifetime Homes
£75 for a flat £235 for houses
Feedback from developers revealed a significant level of uncertainty in the cost of meeting Lifetime Homes standards. The costs used in this study are based on data from published studies.15
Table 26: Cost breakdown for Lifetime Homes
Measure part of standard specification ( = ‘yes’) Measure
Cost of measure / dwelling Flat Terraced Semi Detached
Entrance level WC £120
Bathroom/WC walls £50 - - - -
Entrance level bed space £100 - - -
Provision of space for a stair
lift or through floor lift
£60 - - -
Tracking hoist route £25 - - - -
Increasing 2 bed house area to
70m2 £192
Lift in low-rise flats £1,190 *
15 Reference report(s).

42
* It was assumed that a lift would be part of the standard specification in any development with more than c. 10 flats. The cost of a lift was included for those developments with a small number of flats – i.e. for development scenarios 1 and 2.
The cost of the above measures was included for each dwelling type only if the measure was not part of the standard specification.
6.8 Management This category covers issues from monitoring and reducing the impact of the construction site to providing occupants with information to allow them to operate their home efficiently.
Table 27: Management issues
Issue Credits available Scoring criteria
Man 1 – Home User Guide 3
2 credits for providing a home user guide (in accordance with the checklist given in the Technical Guide).
1 further credit if the guide also includes information relating to the site and its surroundings.
Man 2 – Considerate Constructors Scheme 2
1 credit for committing to meet best practice under a recognised certification scheme.
2 credits for committing to go significantly beyond best practice under a recognised certification scheme.
Man 3 – Construction Site Impacts 2
1 credit for implementing procedures to cover two items such as energy and water use from site activities, dust pollution, etc
(see Technical Guide for full list). 2 credits for implementing procedures to cover four or more
items.
Man 4 – Security 2 2 credits for consulting an Architectural Liaison Officer or Crime Prevention Design Advisor at the design stage and
following their recommendations.
Most of the Code requirements for the home user guide can be obtained through preparing the Home Information Pack, hence no extra cost is incurred in achieving the first 2 credits of Man 1. For achieving the third credit, extra time, and hence extra cost, is allowed for collecting site/locality information. A £500 extra over cost is an average additional cost per site for achieving the third credit.
The Considerate Constructors Scheme is common on all sites and hence developers comply with the scheme as part of standard practice. Furthermore, the consultation with developers suggested that exceeding the best practice threshold of the scheme can also be attained at zero cost.
Most developers gain the first credit of Construction Site Impacts easily and at zero cost. The measures usually adopted are air pollution and water pollution reductions. However not all developers adopt as standard the extra measures of monitoring and reporting CO2 production and water consumption. An average extra cost of £1,000 per site is reported, covering the extra monitoring of CO2 and water consumption on site.
Costs of achieving the Security credits are those for upgrading window/doors/fencing specifications to meet the required security standards. Such standards are not generally adopted as base specifications amongst developers.

43
Table 28: Cost of credits in the Management category
Credit Requirement Cost Provision of user guide £0
Man 1: Home Use Guide Provision of user guide including information related to site and
surroundings £500 per site
Man 2: Considerate Constructors Commitment to meet best practice and exceed best
practice £0
Procedures to cover 2 items £0 Man 3: Construction Site Impacts
Procedures to cover 4+ items £1,000 per site
Man 4: Security Appoint an ALO and comply with Secure by Design standards for
windows/doors
£450 for flats £515 for terraced/semi
£650 for detached
6.9 Ecology The final Code category is Ecology, which offers the potential for up to nine credits to be attained.
Table 29: Ecology issues
Issue Credits available Scoring criteria
Eco 1 – Ecological Value of Site 1 1 credit awarded if the development site is on land confirmed
as being of low ecological value.
Eco 2 – Ecological Enhancement 1
1 credit awarded for appointing a suitably qualified ecologist and adopting all key recommendations and 30% of additional
recommendations.
Eco 3 – Protection of Ecological Features 1
1 credit for adequately protecting all existing features of ecological value during site clearance, preparation and
construction works.
Eco 4 – Change in Ecological Value 4
The site’s ecological value is measured before and after development and credits are awarded based on overall
change in species per hectare: Minor negative change = 1 credit.
Neutral = 2 credits. Minor enhancement = 3 credits. Major enhancement = 4 credits.
Eco 5 – Building Footprint 2 Issue assessed on a site-wide basis. 1 or 2 credits awarded
based on net internal floor area : net internal ground floor ratio.
Achieving a maximum number of Ecology credits is site specific to a great extent, however the developer can adopt a proactive approach to the site ecology and achieve credits under ecological protection and enhancement. Conducting an ecological survey, which is a prerequisite to most ecology credits, often falls under planning requirements. It is assumed that in medium and large developments an ecologist would be employed as standard, hence the cost of conducting the survey, which covers ecologist fees, is

44
not considered an extra cost for most development scenarios. However, an ecologist would not necessarily be employed as standard in small developments and an extra over cost of £1,000 per site is assumed to cover an ecologist’s fees in the small brownfield, city infill, small infill, small greenfield, and small edge of town developments.
The model assumes that credits under Eco 2, Eco 3 and Eco 4 are only available if an ecologist has been employed. While protection of ecological features is an inexpensive activity and hence developers reported it as a zero cost credit, ecological enhancement does incur extra cost and £100 per dwelling is allowed for basic enhancement measures such as bird boxes. The change in ecological value (Eco 4) depends on the change in number of species on site as a result of development. It is assumed that up to two credits may be achieved at zero extra over cost (provided an ecologist has been employed) under Eco 4, and extra costs of £10 and £15 are allowed for planting native plant species to achieve three and four credits respectively.
No cost is allocated for achieving either one or two credits under Eco 5, building footprint. Whether or not these credits are achieved is a site-dependent issue and the method defined in the Technical Guide was followed to determine the number of credits awarded against this issue on a development-by-development basis.
Table 30: Cost of credits in the Ecology category
Credit Requirement Cost/dwelling (£)
Eco 1: Ecological Value of Site Confirm site is of low ecological value £0
Eco 2: Ecological Enhancement Follow and implement recommendations of ecologist
£100 £1,000 per site is also added for small developments to cover cost
of employing ecologist
Eco 3: Protection of Ecological Features
Protect ecological features during construction
Credits only available if ecologist is employed
£0
Eco 4: Change in Ecological Value
Level of negative or positive change in ecological value after
development Credits only available if ecologist
is employed
£0 for 2 credits £10 for 3 credits £15 for 4 credits
Eco 5: Building footprint Floor area : net internal ground floor area ratio £0

45
7 ASSESSMENT OF THE COST OF BUILDING TO THE CODE
This section presents the results of the analysis of costs of building to each level of the Code for Sustainable Homes in each of the four typical dwelling types and in the range of twelve development scenarios. Unless otherwise stated, the costs presented are the extra-over costs from a baseline of building a 2006 Building Regulation compliant home and assume the home is built in 2009. The results presented here are a summary of the outputs of extensive cost modelling. A full set of results are provided in the Appendices (see Section 12).
It will be seen that a dominant factor in the overall Code cost is the cost of meeting the mandatory requirements for reduction of the Dwelling Emissions Rate at each Code Level. To reflect the importance of costs under the Energy category, this section begins with a detailed discussion of the energy options available at the various Code levels and their associated cost implications.
7.1 Introduction The Code is flexible in that credits can be gained against many different issues, and hence a wide range of alternative approaches may be taken to achieve Code compliance. The modelling approach used (described in section 4) facilitated an analysis of the sensitivity of the overall cost to many of the input variables. For example, the total cost of meeting a given Code level might be expected to vary with approach taken to meeting the required DER, scale of development, characteristics of the development site, standard practice of the developer etc.
However, certain features will be common to all dwellings built to a given Code level, as dictated by the mandatory issues. The uncredited mandatory issues discussed in section 3.2 must be met regardless of Code level sought. These include environmental impact of basic elements (Mat 1), surface water run-off management (Sur 1), waste storage (Was 1), and construction waste management (Was 2).
In addition to the uncredited mandatory issues, a number of increasingly stringent credited mandatory issues must also be satisfied to comply with the Code, as summarised in the following table.
Table 31: Summary of credited mandatory requirements by Code level
Code level Mandatory issue (credited) Mandatory requirement
Ene 1 – Dwelling Emission Rate Achieve a 10% improvement relative to TER 1
Wat 1 – Internal Water Consumption Water consumption not to exceed 120 litres/person/day
Ene 1 – Dwelling Emission Rate Achieve an 18% improvement relative to TER 2
Wat 1 – Internal Water Consumption Water consumption not to exceed 120 litres/person/day
Ene 1 – Dwelling Emission Rate Achieve a 25% improvement relative to TER 3
Wat 1 – Internal Water Consumption Water consumption not to exceed 105 litres/person/day
Ene 1 – Dwelling Emission Rate Achieve a 44% improvement relative to TER 4
Wat 1 – Internal Water Consumption Water consumption not to exceed 105 litres/person/day
Ene 1 – Dwelling Emission Rate Achieve a 100% improvement relative to TER 5
Wat 1 – Internal Water Consumption Water consumption not to exceed 80 litres/person/day
6 Ene 1 – Dwelling Emission Rate Achieve a ZCH emission rating

46
Ene 2 – Building Fabric Building’s HLP to be ≤ 0.8W/m2K
Wat 1 – Internal Water Consumption Water consumption not to exceed 80 litres/person/day
Hea 4 – Lifetime Homes Comply with all principles of Lifetime Homes
7.2 Energy Strategies options There are a wide variety of approaches that house-builders could adopt to achieve the maximum dwelling emissions rate (DER) requirements of each level of the Code. Whatever technical approach is taken, the costs of achieving the mandatory DER requirement (i.e. the cost of gaining credits under Ene 1) is likely to dominate the overall costs of achieving a particular Code level.
At lower levels of the Code, the mandatory DER levels stipulated under Ene 1 can be met by improving the performance of the dwelling fabric. At higher Code levels, improved fabric performance must be combined with low or zero carbon generation technologies (LZCT) in order to meet the DER requirements. House-builders may choose to go further than the mandatory DER requirement of the target Code Level, although they are only likely to do this if the additional credits gained under Ene1 are more cost-effective than gaining credits under other categories.
A range of energy strategy options assessed in this study has been defined in Section 6.1 (see Table 11). The capital costs associated to each energy option are shown in Figure 2 for each house type and for a particular development scenario – the Large Urban (mixed brownfield) development scenario. A detailed description of the energy system options, including the required capacities of LZCTs, is given in the Appendices for the Medium Urban (brownfield) and Medium Edge of Town (greenfield) developments (see Section 10.3, Table 54 and Table 55).
The cost of each energy strategy varies between the house types, as the fabric costs and sizing and costs of LZCTs for any particular target DER will tend to be dependent on the size of the dwelling and its occupancy. The energy strategy cost will be largely independent of development scenario where the strategy involves fabric improvements and LZCTs at the individual dwelling scale (i.e. microgeneration technologies). However, where the energy strategy involves shared infrastructure, such as a district heating system, the cost will be dependent on the development type.
The energy strategy extra-over costs are plotted against the reduction of DER/TER they deliver in Figure 3. Plots are shown for the 2-bed flat and 3-bed semi dwelling types in a range of development scenarios. The plots highlight the general trend of increasing energy strategy extra-over costs with increasing reduction on TER and the variability of energy strategy extra-over cost at a particular DER/TER level, depending on the energy strategy chosen. These plots also allow the lowest cost energy strategy (of those assessed) at each Code Level to be identified.
At higher reductions on TER, consistent with Code Levels 5 and 6, energy strategies involving community heating infrastructure become more favourable. This is particularly the case in the higher density urban developments, where district heating infrastructure becomes more cost effective. For example, consider energy strategies to achieve a reduction of DER/TER of 1, i.e. the Code Level 5 minimum requirement. In the Strategic Greenfield development the lowest cost strategy is the dwelling-scale (or block-scale in the case of flats) biomass boilers with photovoltaics. In the Large Urban development, the gas CHP and district heating strategy becomes the more cost-effective approach to achieving this level of reduction of dwelling emissions rate.

47
0
5,000
10,000
15,000
20,000
25,000
30,000
0 0.5 1 1.5 2
E/O
cos
t of e
nerg
y st
rate
gy
% reduction on TER achieved
House type: FLATDev. scenario: Small brownfield
0
5,000
10,000
15,000
20,000
25,000
30,000
0 0.5 1 1.5 2
E/O
cos
t of e
nerg
y st
rate
gy
% reduction on TER achieved
Good fabric (GF)
Better fabric (BF)
GF + PV
Best fabric + MVHR (Best F) + SHW
GF + ASHP
BF + PV
BF + SHW
BF + ASHP + PV
Best F + Block BM
Best F + PV
GF + gas CHP / DH
Best F + Block BM + PV
Best F + gas CHP/DH + PV (1kW)
Best F + gas CHP/DH + PV (3.2kW)
Best F + block BM + PV
Best F + BM CHP/DH + PV
House type: FLATDev. scenario: Large Urban
0
5,000
10,000
15,000
20,000
25,000
30,000
0 0.5 1 1.5 2
E/O
cos
t of e
nerg
y st
rate
gy
% reduction on TER achieved
House type: FLATDev. scenario: Medium Edge of Town
0
5,000
10,000
15,000
20,000
25,000
30,000
0 0.5 1 1.5 2
E/O
cos
t of e
nerg
y st
rate
gy
% reduction on TER achieved
House type: FLATDev. scenario: Strategic Greenfield

48
0
5,000
10,000
15,000
20,000
25,000
30,000
35,000
0 0.5 1 1.5 2
E/O
cos
t of e
nerg
y st
rate
gy
% reduction on TER achieved
House type: 3b‐SEMIDev. scenario: Small brownfield
0
5,000
10,000
15,000
20,000
25,000
30,000
35,000
0 0.5 1 1.5 2
E/O
cos
t of e
nerg
y st
rate
gy
% reduction on TER
Better fabric (BF)
GF + PV
Best fabric + MVHR (Best F)
GF + ASHP
BF + PV
BF + SHW
BF + ASHP + PV
Best F + BM
Best F + PV
GF + gas CHP / DH
Best F + BM + PV
Best F + gas CHP/DH + PV (1kW)
Best F + gas CHP/DH + PV (3.2kW)
Best F + BM + PV
Best F + BM CHP/DH + PV
House type: 3b‐SEMIDev. scenario: Large Urban
0
5,000
10,000
15,000
20,000
25,000
30,000
35,000
0 0.5 1 1.5 2
E/O
cos
t of e
nerg
y st
rate
gy
% reduction on TER achieved
House type: 3b‐SEMIDev. scenario: Medium Edge of town
0
5,000
10,000
15,000
20,000
25,000
30,000
35,000
0 0.5 1 1.5 2
E/O
cos
t of e
nerg
y st
rate
gy
% reduction on TER achieved
House type: 3b‐SEMIDev. scenario: Strategic Greenfield
Figure 3: Plots of energy strategy E/O cost against reduction of DER/TER for a selection of dwelling types and development scenarios

49
For each development scenario, the energy strategy selection that results in the lowest overall cost of compliance with each Code Level has been identified. It is assumed in each case that the same energy strategy is applied to all dwelling types in the development. These lowest cost strategies are summarised in the tables in Figure 4, for each development scenario. Some of the key findings are discussed below: • At Code levels 1 and 2, the mandatory reductions of DER/TER are most cost-effectively met by
improving the fabric package. At Code Level 1, the Good fabric package provides the required level of improvement in the flat, semi and detached dwelling types. In the case of the terrace, a minor improvement over the good fabric package is necessary to achieve the 10% DER/TER reduction (an improvement of the external wall U-value from 0.25 to 0.2 W/m2.K and reduction in thermal bridging loss (y-value) from 0.08 to 0.06 W/m2.K is sufficient). The Code Level 2 DER/TER improvement is met by a slight variation on the ‘Better’ fabric package – a relaxation of the U-values specified in Table 9 is permissible in the case of the semi and detached dwelling types, whereas in the case of the flat a slight improvement on the ‘Better’ fabric specification is necessary (can be achieved by reduction of the thermal bridging loss from 0.04 to 0.02 W/m2K).
• At Code level 3 the lowest cost energy strategy varies is the Good fabric package with Air Source Heat Pump (ASHP). The comparably low on-cost of this energy strategy is a result of the offset costs resulting from avoidance of a domestic boiler and a gas connection to the property. In the case of blocks of flats, the cost of the Good fabric with ASHP and Better fabric with PV strategies are very closely comparable.
• At Code Level 4 the lowest cost energy strategy varies between Better fabric with an ASHP and the
Good fabric with community gas CHP, depending on the development type. Note that in some cases the Good fabric with community gas CHP provides the lowest overall cost of compliance, even though the Better fabric with ASHP is the least cost means of achieving a 44% reduction of DER/TER. This is because extra credits are awarded for providing a DER/TER improvement in excess of the minimum Code Level 5 standard at relatively little on-cost.
• At Code Level 5 in the higher density brownfield developments the least cost strategy is gas CHP linked to a district heating system, with photovoltaics to provide the additional CO2 reduction. In the lower density greenfield development scenarios, this energy strategy is favoured for the large sites, but in the smaller scale developments a strategy of biomass boilers within individual properties is favoured (block-scale boilers for blocks of flats). This is a result of the economy of scale effects for CHP systems (i.e. reducing cost per kW with increasing installed capacity), which favours CHP based strategies on larger developments.
• At Code Level 6, site-wide biomass CHP and district heating systems provide the lowest cost approach to achieving the required reduction on TER (assuming the CHP system is operated to follow the heat-load, then photovoltaics will also be required to achieve the mandatory Code Level 6 standard). Due to the current lack of availability of biomass CHP systems at small-scale, alternative strategies are required for the small sites, for example individual biomass heating systems with photovoltaics. It is important to note that achieving the Code Level 6 mandatory CO2 emissions standard on these small sites is very challenging. The area required for installation of sufficient PV capacity, for example, will not be feasible on many small-scale sites.
In addition to the challenges of meeting Code Level 6 mandatory CO2 reduction standards on small-scale developments, it is interesting to note the reliance on biomass of the energy strategies that meet the highest levels of the Code (i.e. level 5 and 6). There are alternatives to biomass based strategies for achieving high Code levels that have not been included in the core list of energy strategies considered here. For example, integration of large-scale wind turbines may provide a cost-effective route to achieving high Code Levels, however, the developments that this strategy is applicable to will for the most part be limited to those on larger, rural sites. For this reason this has not been considered as a mass-market solution for achieving high Code Levels.

50
The costs associated with each of the energy strategies defined above for each dwelling type are shown in the charts in Figure 5. These charts demonstrate the variation in least cost approach to meeting the CO2 requirement of each Code Level with the nature of the development, in terms of its scale and density.

51
Lowest cost energy strategy at each Code Level Development Scenario
1 2 3 4 5 6
City Infill Best fabric + ASHP
Small brownfield Good fabric +
Community gas CHP
Best fabric + gas CHP + PV
Medium brownfield (mixed) Best fabric + ASHP
Medium brownfield (flats)
Large Urban (flats)
Large Urban (mixed)
Good fabric (F, S&D),
Good+ fabric (T)
Better+ fabric (F),
Better Fabric*
(T)
Good+ fabric (S,D)
Good fabric + ASHP
Good fabric + Community gas
CHP
Best fabric + Community gas
CHP + PV Best fabric +
community BM CHP + PV
Lowest cost energy strategy at each Code Level
Development Scenario 1 2 3 4 5 6
Small infill
Small Greenfield
Medium Greenfield
Best fabric + block BM (F)
BM boilers
(T,S,D) + PV
Best fabric + block BM (F) +
PV
BM boilers (T,S,D) + PV
Medium edge of town
Large edge of town
Strategic Greenfield
Good fabric (F, S&D),
Good+ fabric (T)
Better+ fabric (F),
Better Fabric*
(T)
Good+ fabric (S,D
Good fabric + ASHP
Best fabric + ASHP
Best fabric + Community gas
CHP + PV
Best fabric + community BM
CHP + PV
* To achieve Code Level 2 standard in flats, a fabric package slightly in advance of ‘Better’ would be required. Figure 4: Summary of lowest cost energy strategy at each Code level for each development scenario

52
The costs associated with the lowest cost energy strategies at each Code Level and for each development scenario are shown in Figure 5 for the four house types. The costs shown in these plots have been derived assuming that a common energy strategy is applied to all dwellings within a development (where the energy strategy involves common infrastructure, the overall costs have been apportioned between the various dwelling types). There is little variation in the energy strategy extra-over costs between development scenarios for Code Levels 1 to 3, as the lowest cost strategies involve technologies employed at individual dwelling scale (note the cost modelling does not account for the potential for cost reductions for larger orders, i.e. lager-scale developments or purchased by volume house-builders). There is some variation in the costs of energy strategy at these Code levels between the dwelling types, as the cost of fabric packages vary with dwelling scale as does the sizing of microgeneration technologies. A variation in the cost of energy strategy is seen at Code Level 4, as the least cost strategy varies between ASHP-based and community gas CHP based strategies. There is significant variation in the extra-over costs of the Code Level 5 and 6 energy strategies between the development scenarios, due to the effects of development scale and density on least cost solution selection and variations in technology costs with installed capacity. The extra-over cost of Code Level 3 compliant energy strategies varies in the range from £1,500 to £2,000. The least cost energy strategy at Code Level 4 (Best fabric with an air source heat pump or good fabric with community gas CHP, depending in the development scenario) has an associated extra-over cost of in the range from £4,750 to £6,000. The extra-over cost of Code Level 5 compliant energy strategies is more than £15,000 for all development scenarios, with the exception of the flats, for which the extra-over cost of energy strategy in most development scenarios is in the range of £10,000 to £15,000. The highest energy strategy costs for Code Level 5 are found in larger house types in small greenfield developments, where the energy strategy is biomass heating in individual properties combined with photovoltaics (energy strategy extra-over costs of ~ £23,500 in the semi-detached dwelling type and just over £26,000 in the detached dwelling type). The greatest variation in energy strategy extra-over cost is found at Code Level 6. The highest Code Level 6 energy strategy costs (more than £30,000 in large houses) are associated with the small-scale sites, particularly where density is low. Note that although costs are shown for Code Level 6 for each development scenario, the corresponding least cost energy solutions may not be technically feasible in many real site scenarios. For example, the capacity of photovoltaics that must be installed in combination with biomass boilers or gas CHP will not be practically accommodated in many small infill sites. The extra-over costs of Code Level 6 compliant energy strategies are significantly reduced on sites where there is adequate scale. i.e. sufficient heat load, to justify the installation of a biomass CHP system. This is particularly the case on the higher density brownfield sites, for example large urban extensions that are predominantly flatted, where the cost of district heating network infrastructure per dwelling is reduced.

53
2-bed flat
0
5,000
10,000
15,000
20,000
25,000
30,000
1 2 3 4 5 6 1 2 3 4 5 6 1 2 3 4 5 6 1 2 3 4 5 6 1 2 3 4 5 6 1 2 3 4 5 6 1 2 3 4 5 6 1 2 3 4 5 6 1 2 3 4 5 6
Small brownfield City infill Medium Urban (mixed)
Medium Urban (flats)
Large urban (mixed)
Large urban (flats)
Small greenfield Medium edge of town
Large edge of town / Strategic
greenfield
E/O
cos
t of e
nerg
y st
rate
gy
2-bed terrace house
0
5,000
10,000
15,000
20,000
25,000
30,000
35,000
1 2 3 4 5 6 1 2 3 4 5 6 1 2 3 4 5 6 1 2 3 4 5 6 1 2 3 4 5 6 1 2 3 4 5 6
Small brownfield Medium urban (mixed) Large Urban (mixed Small greenfield / infill / edge of town
Medium edge of town Large edge of t own / strategic greenfield
E/O
cos
t of e
nerg
y st
rate
gy

54
3-bed semi-detached house
0
5,000
10,000
15,000
20,000
25,000
30,000
35,000
40,000
1 2 3 4 5 6 1 2 3 4 5 6 1 2 3 4 5 6 1 2 3 4 5 6 1 2 3 4 5 6 1 2 3 4 5 6
Small brownfield Medium urban (mixed) Large Urban (mixed Small greenfield / infill / edge of town
Medium edge of town Large edge of t own / strategic greenfield
E/O
cos
t of e
nerg
y st
rate
gy
4-bed detached house
0
5,000
10,000
15,000
20,000
25,000
30,000
35,000
40,000
45,000
1 2 3 4 5 6 1 2 3 4 5 6 1 2 3 4 5 6 1 2 3 4 5 6 1 2 3 4 5 6 1 2 3 4 5 6
Small brownfield Medium urban (mixed) Large Urban (mixed Small greenfield / infill / edge of town
Medium edge of town Large edge of t own / strategic greenfield
E/O
cos
t of e
nerg
y st
rate
gy
Figure 5: Variation of lowest cost energy strategy at each Code level with development scenario for each dwelling type

55
7.2.1 Energy strategy summary A range of energy solutions, which provide reductions of DER/TER ranging from 10% to more than 150% (i.e. suitable to achieve the mandatory DER standard of Code Level 6) have been costed. Although this cannot be considered an exhaustive analysis of potential energy strategies, there are many possible configurations at each level of DER/TER, it is intended to represent a range of solutions that are likely to be popular choices among developers when constructing Code compliant developments. There are a number of other potential energy strategies that have been excluded from this core list, as their applicability will be limited to certain kinds of developments. These strategies include those based on large-scale wind turbines and ground source heat pumps. A discussion of these technologies is given in Section 7.3.2.
The analysis has shown that Code Levels 1 and 2 can be most cost-effectively achieved through improvement of the energy efficiency of the dwellings alone. The dwelling energy modelling has shown that the ‘good’ fabric package (see Table 9) is sufficient to meet the requirements of Code Level 1 in the flat, semi and detached dwelling types, but that a slight increase in fabric specification is required in the terrace (e.g. reduction in the wall U-value). The ‘Better’ fabric package , as defined in Table 9, is slightly short of reaching the Code Level 2 standard in the Flat dwelling type and significantly exceeds the required 18% reduction of DER/TER in the Semi and Detached dwelling types. Hence, variations on the ‘Better’ fabric package are likely to be used in practice to meet the Code Level 2 standard.
The energy modelling suggests that the Code Level 3 standard could be met by combination of either the Good or Better fabric package with some form of low carbon generation or by application of a very high – Best – fabric package. Due to the low air permeability standard and requirement of MVHR in the Best fabric package, it will generally be more cost-effective to combine a lower fabric standard with low carbon generation (note that in large houses, a fabric package similar to the Better standard may be sufficient to achieve a 25% reduction without low carbon generation). As shown in the charts in Figure 3, there are a number of fabric improvement plus low carbon generations options that are fairly closely clustered in terms of extra-over cost and DER/TER improvement provided, including the Good standard of fabric with an air source heat pump and the Better fabric standard combined with PV or solar hot-water heater. The lowest cost of these strategies has been found to be the Good fabric with ASHP in each of the development scenarios assessed, partly a result of the offset costs relating to avoidance of a boiler and gas connection. The use of efficient electric heating systems has the potential to deliver an increasing CO2 benefit over time, as the electricity grid decarbonises over time (as a result of increasing renewable electricity generation or widespread implementation of carbon capture and storage at power stations). A large-scale shift from gas to electric heating will place significant extra load on the electricity transmission and distribution systems – the cost of grid reinforcement that may be required in certain locations has not been accounted for here.
Of the strategies considered, the lowest cost approach to meeting the Code Level 4 DER standard has been shown to be either a Good fabric standard with community gas CHP or a Better fabric standard with air source heat pump and PV (based on the defined dwelling types, the amount of PV required varies from zero in the detached house to 0.4 kW per flat for blocks of flats). The extra-over cost of these strategies varies from around £4,500 in flats up to £6,000 in the larger house types. The community heating based system provides the route to the lowest cost of Code compliance in several of the higher density brownfield development scenarios. In some cases even where the community gas CHP strategy is selected, the ASHP system is the lower cost route to achieving the 44% DER/TER reduction required at Code Level 4. In these cases, however, the extra credits awarded for providing the higher level of DER reduction achieved by the community gas CHP system (a DER/TER reduction of around 70%) are cost-

56
effective compared to other opportunities to gain credits and so selection of this energy system gives the lowest overall Code compliance cost.
In the higher density developments, the lowest cost energy strategy at Code level 5 has been found to be based on a district heating system and gas CHP, supplemented by photovoltaics (between 1 to 2 kW of PV, depending on the size of the dwelling). The same energy strategy is most cost-effective for the larger greenfield developments, but the associated extra-over costs are significantly higher. For example, the extra-over cost to achieve the Code Level 5 DER standard in a semi-detached house in the Large Urban development (density of 80 dwellings per hectare) via this strategy has been costed at £20,600, whereas the same improvement in the large edge of town (40 dwellings per hectare) has an associated cost of £24,700. In the smaller greenfield sites, the more cost effective means of achieving Code Level 5 DER standard has been found to be individual biomass boilers, rather than a community heating approach.
At Code Level 6, the lowest cost approach to achieving the zero carbon standard in the larger developments (at both 40 dph and 80 dph densities) is via a district heating system and biomass CHP system, with additional PV. The extra-over cost of this strategy varies from £23,000 to £30,500 for the semi-detached house, between the 80dph to 40 dph sites, respectively. The limited availability of small-scale biomass CHP systems currently precludes their use on smaller-scale sites. The alternative approaches, e.g. individual biomass boilers or gas CHP / district heating, are significantly more expensive due to the additional PV capacity required – extra-over costs in excess of £30k for the energy strategy alone have been estimated for the larger houses. The practicality of these strategies is also questionable, as PV capacity of 3 kW per dwelling for flats and more than 4 kW per dwelling for larger houses are required. Space constraints, particularly on smaller urban sites, may prevent installation of sufficient PV capacity to achieve the Code level 6 zero carbon standard.

57
7.3 Total Code costs The overall cost of achieving a particular Code Level will depend on the energy strategy selected to meet the required DER level. In this section it is assumed that the energy solution selected for a given development type is that which gives the lowest cost of compliance with a particular Code Level for the whole development when the same energy strategy is applied to all dwellings (note the details of the energy systems, such as sizing of components, will vary between dwelling types as appropriate).
The total Code costs for a range of development scenarios are shown in Figure 6 for each of the standard dwelling types. The split of the overall Code extra-over cost between costs associated with the Energy category of the Code and costs associated with gaining credits under the other Code categories is shown in these plots.
The most striking feature of the plots shown in Figure 6 is how heavily dominated the overall Code costs are by the cost of the energy strategy. As a result the variation in overall Code costs between dwelling types and development scenarios is very similar to the variation seen in the energy system extra-over costs.
The ranges of total extra-over costs for each Code level are tabulated below, for each dwelling type. Note that the range shown here encompasses all development scenarios, e.g. the lowest cost for meeting Code Level 6 in a 2-bed flat of £17,650 corresponds to the case of the Medium Urban development and the upper bound of £28,510 corresponds to the case of the Small Brownfield development (assuming the lowest cost energy strategy is applied to each development scenario). The total Code extra-over costs for dwelling type in each of the development scenarios are tabulated in the Appendices (Section 12, Table 59 to Table 70).
Table 32: Upper and lower bound on overall Code extra-over cost (assuming the energy strategy that gives the lowest overall compliance cost is selected in each development scenario)
2-bed flat 2-bed terrace 3-bed semi 4-bed detached Code Level Lower Upper Lower Upper Lower Upper Lower Upper
1 £230 £320 £160 £350 £250 £430 £260 £320
2 £1,550 £1,770 £1,490 £1,840 £890 £1,260 £810 £1,090
3 £2,090 £2,760 £2,000 £2,420 £2,640 £3,020 £2,310 £2,680
4 £4,290 £6,360 £6,200 £7,410 £6,580 £8,150 £5,860 £7,190
5 £14,690 £17,740 £23,210 £27,250 £25,580 £29,550 £28,790 £32,560
6 £17,650 £28,510 £26,550 £37,690 £28,390 £41,090 £31,230 £45,510

58
£0
£5,000
£10,000
£15,000
£20,000
£25,000
£30,000
1 2 3 4 5 6 1 2 3 4 5 6 1 2 3 4 5 6 1 2 3 4 5 6 1 2 3 4 5 6 1 2 3 4 5 6 1 2 3 4 5 6
Small brownfield City infill Medium urban (100% flats)
Large urban (100% flats)
Small infill Medium edge of town Strategic greenfield / Large edge of town
Tota
l E/O
cos
t per
dw
ellin
g
2-bed flat
Other categories
Energy costs
0
5,000
10,000
15,000
20,000
25,000
30,000
35,000
40,000
45,000
50,000
1 2 3 4 5 6 1 2 3 4 5 6 1 2 3 4 5 6 1 2 3 4 5 6 1 2 3 4 5 6 1 2 3 4 5 6
Small brownfield Medium Urban Large Urban Small infill Medium edge of town Strategic greenfield / Large edge of town
Tota
l E/O
cos
t per
dw
ellin
g
2-bed terrace
Other categories
Energy costs

59
0
5,000
10,000
15,000
20,000
25,000
30,000
35,000
40,000
45,000
50,000
1 2 3 4 5 6 1 2 3 4 5 6 1 2 3 4 5 6 1 2 3 4 5 6 1 2 3 4 5 6 1 2 3 4 5 6
Small brownfield Medium Urban Large Urban Small infill Medium edge of town Strategic greenfield / Large edge of town
Tota
l E/O
cos
t per
dw
ellin
g
3-bed semi-detached
Other categories
Energy costs
0
5,000
10,000
15,000
20,000
25,000
30,000
35,000
40,000
45,000
50,000
1 2 3 4 5 6 1 2 3 4 5 6 1 2 3 4 5 6 1 2 3 4 5 6 1 2 3 4 5 6 1 2 3 4 5 6
Small brownfield Medium Urban Large Urban Small infill Medium edge of town Strategic greenfield / Large edge of town
Tota
l E/O
cos
t per
dw
ellin
g
4-bed detached
Other categories
Energy costs
Figure 6: Variation in total Code cost at each Code level with development scenario for each dwelling type

60
7.3.1 Composition of non-energy Code costs
The breakdown of the non-energy Code costs are shown in Figure 7 for the 2-bed flat and 3-bed semi dwelling types in a number of development scenarios. It is immediately clear from these plots that excluding energy, the other Code extra-over costs are dominated by the costs associated with achieving credits in the Water and Health categories, with the Water-related costs becoming increasingly important at higher Code levels (i.e. Code level 5 and 6).
The model developed to assess Code extra-over costs optimises the measures applied in order to achieve the lowest cost of compliance with a particular Code Level, having achieved the mandatory Ene1 standard and satisfied the other mandatory Code requirements. The costs associated with the Water category, as shown in Figure 7, are related to meeting the mandatory internal water consumption levels (see Table 16). The costs related to the Health category increase sharply at Code level 6, due to the introduction of Lifetime Homes as a mandatory element. There are no mandatory Health category requirements below Code Level 6, however Health costs feature prominently in the Code extra-over costs at lower Code levels as there are cost-effective credits available in this category, for example by achieving daylighting and sound insulation standards.
A strong variation of non-energy Code extra-over costs with development scenario has not been found, although the composition of the costs (in terms of specific credits gained) does vary. In general, the non-energy Code costs tend to be higher in the greenfield developments compared to the brownfield sites. This is largely a result of fewer credits being available under the Ecology category on greenfield sites and higher costs being incurred to achieve those credits that are available. This means that extra-costs are incurred in other categories to achieve the required score at each Code Level. The build up of Code credits and costs associated with those credits are shown in Figure 8 for the 2-bed flat and 3-bed semi dwelling types and in a selection of development scenarios. Tables providing the detailed build up of credits at the issue-by-issue level are given in the Appendices for each Code Level and for the Small Brownfield and Strategic Greenfield development scenarios (Section 12, Table 57 and Table 58).
Note that the Code cost build-ups shown in Figure 7 and Figure 8 assume that relatively low-cost credits can be achieved in the Surface Water Run-Off category. This assumes that the development is constructed in a low flood risk area (demonstrated by a flood risk assessment) and that, at higher Code levels, SUDS measures are applied. If a development is located in an area of high or medium annual flooding probability, then the costs associated with gaining credits in this category become very high (see Table 19).

61
£0
£500
£1,000
£1,500
£2,000
£2,500
£3,000
£3,500
£4,000
1 2 3 4 5 6 1 2 3 4 5 6 1 2 3 4 5 6 1 2 3 4 5 6 1 2 3 4 5 6 1 2 3 4 5 6 1 2 3 4 5 6
Small brownfield City infill Medium urban (100% flats)
Large urban (100% flats)
Small infill Medium edge of town Strategic greenfield / Large edge of town
E/O
cos
t of e
nerg
y stra
tegy
2-bed flat
Ecology
Management
Health
Pollution
Waste
Surface
Materials
Water
£0
£1,000
£2,000
£3,000
£4,000
£5,000
£6,000
£7,000
£8,000
1 2 3 4 5 6 1 2 3 4 5 6 1 2 3 4 5 6 1 2 3 4 5 6 1 2 3 4 5 6 1 2 3 4 5 6
Small brownfield Medium Urban Large Urban Small infill Medium edge of town Strategic greenfield / Large edge of town
E/O
cos
t per
dw
ellin
g (£
)
3-bed semi-detached
Ecology
Management
Health
Pollution
Waste
Surface
Materials
Water
Figure 7: Build up of non-energy extra-over costs at each Code level and variation with development scenario

62
2-bed Flat 3-bed Semi
Code LevelCredits E/O cost Credits E/O cost Credits E/O cost Credits E/O cost Credits E/O cost Credits E/O cost
Energy 6 £265 9 £1,408 11 £1,668 17 £4,611 26 £15,089 27 £25,214Water 2 £0 2 £0 4 £200 4 £200 6 £1,750 6 £1,750Materials 17 £0 17 £0 17 £0 17 £0 17 £0 17 £0Surface 2 £0 2 £0 2 £0 4 £55 4 £55 4 £55Waste 6 £25 6 £25 6 £55 7 £55 7 £55 7 £55Pollution 4 £0 4 £0 1 £0 1 £0 4 £0 4 £0Health 2 £0 2 £0 7 £300 8 £450 8 £550 12 £1,200Management 7 £25 7 £75 7 £75 7 £75 7 £75 7 £75Ecology 1 £0 7 £165 7 £165 7 £165 7 £165 7 £165Total 47 £315 56 £1,673 62 £2,463 72 £5,611 86 £17,739 91 £28,514
Energy 5 £250 8 £1,408 11 £1,668 18 £5,692 26 £14,169 27 £20,091Water 2 £0 2 £0 4 £200 4 £200 6 £1,750 6 £1,750Materials 17 £0 17 £0 17 £0 17 £0 17 £0 17 £0Surface 4 £0 4 £0 4 £0 4 £0 4 £0 4 £0Waste 6 £0 6 £25 6 £55 6 £55 7 £55 7 £55Pollution 4 £0 4 £0 1 £0 4 £0 4 £0 1 £0Health 2 £0 2 £0 7 £300 7 £300 8 £550 12 £1,200Management 7 £0 7 £0 7 £0 7 £0 7 £0 9 £0Ecology 1 £0 7 £115 7 £115 7 £115 7 £115 7 £115Total 48 £250 57 £1,549 64 £2,338 74 £6,363 86 £16,640 90 £23,212
Energy 6 £265 9 £1,408 11 £1,418 18 £4,361 28 £14,113 29 £24,012Water 2 £0 2 £0 4 £200 4 £200 6 £1,750 6 £1,750Materials 17 £0 17 £0 17 £0 17 £0 17 £0 17 £0Surface 4 £0 4 £22 4 £22 4 £22 4 £22 4 £22Waste 6 £25 6 £25 6 £55 7 £55 7 £55 7 £55Pollution 4 £0 4 £0 1 £0 1 £0 1 £0 1 £0Health 2 £0 2 £0 7 £300 8 £550 8 £1,200 12 £1,200Management 7 £30 7 £30 7 £30 7 £30 9 £30 9 £480Ecology 0 £0 6 £135 6 £135 6 £135 6 £135 6 £135Total 48 £320 57 £1,620 63 £2,160 72 £5,353 86 £17,305 91 £27,654
Energy 5 £265 9 £1,408 11 £1,418 18 £4,361 28 £14,113 29 £24,141Water 2 £0 2 £0 4 £200 4 £200 6 £1,750 6 £1,750Materials 17 £0 17 £0 17 £0 17 £0 17 £0 17 £0Surface 4 £0 4 £0 4 £0 4 £0 4 £0 4 £0Waste 6 £0 6 £25 6 £55 7 £55 7 £55 7 £55Pollution 4 £0 4 £0 1 £0 1 £0 1 £0 1 £0Health 2 £0 2 £0 7 £300 8 £550 8 £1,200 12 £1,200Management 7 £0 7 £0 7 £0 7 £0 9 £0 9 £450Ecology 6 £0 6 £115 6 £115 6 £115 6 £115 6 £115Total 53 £265 57 £1,549 63 £2,088 72 £5,282 86 £17,234 91 £27,712
6
Small Brownfield
Large Urban Extension
Small Greenfield
Large Edge of Town
1 2 3 4 5 Code LevelCredits E/O cost Credits E/O cost Credits E/O cost Credits E/O cost Credits E/O cost Credits E/O cost
Energy 6 £256 9 £775 11 £2,104 17 £7,022 26 £21,705 27 £32,377Water 2 £0 2 £0 4 £250 4 £250 6 £4,250 6 £4,250Materials 17 £0 17 £0 17 £0 17 £0 17 £0 17 £0Surface 2 £0 2 £0 2 £0 4 £55 4 £55 4 £55Waste 6 £25 6 £25 6 £25 7 £75 7 £75 7 £75Pollution 4 £0 4 £0 1 £0 1 £0 4 £0 4 £0Health 2 £0 2 £0 7 £400 8 £500 8 £500 12 £1,735Management 7 £75 7 £75 7 £75 7 £75 7 £75 7 £75Ecology 1 £0 7 £165 7 £165 7 £165 7 £165 7 £165Total 47 £356 56 £1,040 62 £3,019 72 £8,142 86 £26,825 91 £38,732
Energy 5 £226 8 £745 11 £2,104 18 £5,790 26 £20,642 27 £25,701Water 2 £0 2 £0 4 £250 4 £250 6 £4,250 6 £4,250Materials 17 £0 17 £0 17 £0 17 £0 17 £0 17 £0Surface 4 £0 4 £0 4 £0 4 £0 4 £0 4 £0Waste 6 £25 6 £25 6 £25 6 £25 7 £75 7 £75Pollution 4 £0 4 £0 1 £0 4 £0 4 £0 1 £0Health 2 £0 2 £0 7 £400 7 £400 8 £500 12 £1,735Management 7 £0 7 £0 7 £0 7 £0 7 £0 9 £515Ecology 1 £0 7 £115 7 £115 7 £115 7 £115 7 £115Total 48 £252 57 £886 64 £2,895 74 £6,581 86 £25,583 90 £32,392
Energy 6 £256 9 £775 11 £1,854 18 £6,852 28 £23,732 29 £34,036Water 2 £0 2 £0 4 £250 4 £250 6 £4,250 6 £4,250Materials 17 £0 17 £0 17 £0 17 £0 17 £0 17 £0Surface 4 £22 4 £22 4 £22 4 £22 4 £22 4 £22Waste 6 £25 6 £25 6 £25 7 £75 7 £75 7 £75Pollution 4 £0 4 £0 1 £0 1 £0 1 £0 1 £0Health 2 £0 2 £0 7 £400 8 £500 8 £500 12 £1,735Management 7 £30 7 £30 7 £30 7 £30 9 £545 9 £545Ecology 0 £0 6 £135 6 £135 6 £135 6 £135 6 £135Total 48 £333 57 £987 63 £2,716 72 £7,864 86 £29,259 91 £40,798
Energy 5 £226 9 £775 11 £1,854 18 £6,852 28 £23,732 29 £30,401Water 2 £0 2 £0 4 £250 4 £250 6 £4,250 6 £4,250Materials 17 £0 17 £0 17 £0 17 £0 17 £0 17 £0Surface 4 £0 4 £0 4 £0 4 £0 4 £0 4 £0Waste 6 £25 6 £25 6 £25 7 £75 7 £75 7 £75Pollution 4 £0 4 £0 1 £0 1 £0 1 £0 1 £0Health 2 £0 2 £0 7 £400 8 £500 8 £500 12 £1,735Management 7 £0 7 £0 7 £0 7 £0 9 £515 9 £515Ecology 6 £115 6 £115 6 £115 6 £115 6 £115 6 £115Total 53 £367 57 £916 63 £2,645 72 £7,793 86 £29,187 91 £37,092
6
Small Brownfield
Large Urban Extension
Small Greenfield
Large Edge of Town
1 2 3 4 5
Figure 8: Examples of lowest cost approaches to meeting each Code level, in terms of credits gained by category and associated costs, for Flat and Semi-detached dwelling types and in a selection of development scenarios

63
7.3.2 Non-standard energy solutions The assessment of energy strategies given in Section 7.2 focussed on a range of potential approaches to meeting the various DER standards of Ene1 that are expected to be commonly taken up by developers building to the Code. This core list of strategies omitted a number of energy solutions that, due to their particular characteristics and constraints on their installation, are not widely applicable across the range of development types. However, these solutions, which include medium to large-scale wind turbines and ground source heat pumps, may provide attractive solutions on certain types of sites. A discussion of these options is given here.
7.3.3 Ground Source Heat Pump Ground source heat pumps (GSHPs) are similar to air source heat pumps (ASHPs), in that they extract thermal energy from the surroundings, increase the quality of the heat (i.e. the temperature) and deliver it to meet the thermal demands of a building. The principal difference between ground and air source heat pumps is, as the names suggest, the source of the heat. GSHPs extract heat from the earth and therefore require ground loops, which are typically in the form of either coils buried in trenches or vertical boreholes. The cost associated with the ground loops, both capital and installation (which can be substantial where drilling of boreholes is required), mean that GSHPs are more expensive than air source, however the lower losses incurred in transferring heat from the ground compared to transferring heat from the air (into the heat pump’s circulating fluid) mean that GSHPs are more efficient than ASHPs.
The following table summarises the assumed efficiencies for the heat pumps modelled in terms of coefficient of performance (COP).
Table 33: Co-efficient of Performance (COP) assumptions for ground and air source heat pumps
ASHP GSHP Space heating COP 3.0 4.0 Water heating COP 2.5 3.2
The actual COP values will depend on factors such as temperature difference between heat source and heat sink, ratio of hot water to space heating demands and quality of the heat pump technology. The COP values used in this study are considered to be relatively conservative which means that carbon savings will be under-estimated rather than over-estimated.
As for the ASHP energy options, it is assumed that where specified a GSHP would be sized to meet all of the dwelling’s thermal demands. The costs associated with energy strategies based on GSHPs are shown in the table below. The strategies have been devised for compliance with Code Level 4 Ene 1 standards and are based on the small greenfield development scenario (currently GSHPs tend to be installed in off-gas areas).

64
Table 34: Ground source heat pump based energy strategies – extra-over costs and percentage DER improvement delivered
Flat Terraced Semi-detached Detached
Technology ‘’Good’ fabric
Community GSHP (3kWth per flat)
’Good’ fabric 5kWth GSHP
‘Good’ fabric 6.5kWth GSHP
‘Good’ fabric 8kWth GSHP
Percentage improvement
(DER/TER) 57% 51% 52% 51%
E/O cost of Ene 1 option16 £3,375 £8,295 £8,690 £10,240
The following graph shows the total extra over cost by category for achieving Code level 4, assuming the energy strategies tabulated above.
£0
£2,000
£4,000
£6,000
£8,000
£10,000
£12,000
£14,000
£16,000
Flat Terraced Semi Detached
E/O
cos
t
Total E/O cost of meeting Code level 4 with GSHPs in a small greenfield development (2009)
EcologyManagementHealthPollutionWasteSurface WaterMaterialsWaterEnergy
Figure 9: Extra over cost of achieving Code level 4 with a GSHP in a small greenfield development
The higher efficiency (COP) of the ground source heat pump compared to the air source system means that there is no requirement for photovoltaics to achieve the required DER/TER reduction for Code level 4. The cost saving attributable to the reduced requirement for PV is offset by the higher capital and installation cost of the ground coupled system. In flats capital costs of the ground loops and heat pump(s)
16 Costs of GSHP systems are sensitive to many factors, include ground conditions, which are highly site-specific. Here indicative costs of between £10,000 and £12,000 have been assumed for the installed cost of the GSHP system in houses. Communal GSHP system costs are based on a figure of £1,000 per kWth, which is a reasonable estimate for systems over around 20kW capacity. Note that the E/O costs given above include the offset benefit of not requiring a gas boiler or gas connection.

65
can be split between dwellings. However, this benefit is offset to some degree by the costs of distributing and metering the heat in individual units.
7.3.4 Wind Due to the nature of many housing developments and wind resource constraints, large on-site wind energy has not been considered a central technology in meeting the Code. However, where sufficient resource exists and there is adequate space for installation of medium to large wind turbines, this source of low carbon electricity can have a significant impact on the cost of building to the Code.
This section considers the case when large-scale wind energy is available on a Strategic Greenfield site (5,000 dwellings). It is assumed that wind turbines are installed to provide the additional CO2 reduction required once fabric improvements have been applied and an efficient heating technology installed (in this case air source heat pumps). On this basis, medium to large-scale wind turbines are only relevant at Code levels 4 and above. The extra-over costs associated with heat pump and wind turbine energy strategies, sized to meet Code levels 4, 5 and 6, are shown in Figure 10 (total extra-over costs for the Strategic Greenfield site have been apportioned on a per dwelling basis).
The extra-over costs for the wind-based energy strategies are significantly lower than those shown in Figure 5 particularly at Code Levels 5 and 6. The very sharp increase in energy strategy extra-over cost between Code levels 4 and 5 that is seen when the central (i.e. widely applicable) energy strategies are applied is much less pronounced when wind energy is available. This is because the greater requirement for wind electricity at Code Level 5 justifies a switch from medium-scale (100s of kW) to large-scale (MW) wind turbines, which have lower specific costs (£/kW) and better load factors. The increase in energy strategy cost from Code Level 5 to 6 results from the increased need for wind turbine generating capacity and the requirement for the ‘Best’ fabric package, necessitated by the low heat loss parameter requirement.
£-
£2,000
£4,000
£6,000
£8,000
£10,000
£12,000
£14,000
£16,000
CL4 - Better fabric + ASHP + med. wind
CL5 - Better fabric + large wind
CL6 - Best fabric + large wind
E/O
cos
t of e
nerg
y st
rate
gy
2b flat
2b terrace
3b semi
4b detached
Figure 10: Extra-over cost of energy strategies involving medium to large-scale wind turbines, sized to meet Code levels 4 to 6

66
The overall costs for achieving Code Levels 4 to 6 with an energy strategy involving medium to large-scale wind energy deployment is shown in Figure 11 (for the Strategic Greenfield development). The comparison of overall Code costs for sites with wind deployment compared to sites based on the lowest cost non-wind energy strategies (i.e. sites that rely on photovoltaics to provide the additional CO2 reduction needed to reach minimum DER levels) is tabulated in Table 35. The large differences in overall Code costs at Code Level 5 and 6 are virtually entirely attributable to the reduced extra-over cost of the energy system, as the credits and associated costs in other categories are largely the same.
£0
£5,000
£10,000
£15,000
£20,000
£25,000
F T S D F T S D F T S D
Code Level 4 Code Level 5 Code Level 6
Tota
l Cod
e E/
O c
ost
Ecology
Management
Health
Pollution
Waste
Surface Water
Materials
Water
Energy
Figure 11: Total extra-over costs of achieving Code levels 4 to 6 based on an energy strategy involving medium to large scale wind
Table 35: Comparison of total Code extra-over costs between a development with a large wind based energy strategy to a similar development with a biomass CHP / district heating strategy
Energy strategy ASHP + wind turbines Non-wind strategy
Code Level 4 5 6 4 5 6
2b flat £3,770 £7,250 £10,350 £5,280 £17,250 £27,500
2b terrace £4,400 £11,000 £16,800 £6,850 £26,900 £34,300
3b semi £5,300 £12,350 £19,100 £7,800 £29,200 £36,750
4b detached £5,600 £13,400 £21,450 £6,900 £32,200 £40,600
This analysis demonstrates that additional costs of compliance with higher levels of the Code, particularly Code Levels 5 and 6, can be dramatically lower on sites where there is adequate space and wind resource for installation of wind turbines compared to sites without access to this resource. These results are based on typical costs for wind turbines in the scale from 500 kW (Code Level 4) to several MW –

67
based on the Strategic Greenfield development scenario, there is a requirement for 10.5 MW of wind turbine capacity to achieve Code Level 6 (assuming a 20% load factor is achieved, consistent with a good wind resource).
7.4 Code cost variation with time All costs presented in the preceding sections of this study have been extra-over costs measured in 2009 prices from a baseline of compliance with the 2006 Building Regulations. Over the period to 2016 and beyond the extra-over costs will change, due to a number of factors:
• The costs of measures implemented within new dwellings to earn credits under the Code will change, due to, for example, technology cost curves, innovation and learning effects.
• The Building Regulations will change such that credits under the Code that currently represent an extra-over cost will become the minimum standard required for compliance with the Building Regulations. This is particularly the case for Part L of the Regs, which will be tightened such that the mandatory DER standards of the Code become regulatory minimums, but will also have an impact on other categories (notably water).
The changing cost of measures is anticipated to primarily exert a downward influence on the cost of compliance with the Code (neglecting the possible effect of supply chains failing to meet increasing demand, which are assumed to be short-term).
The impact of the changes to Building Regulations will be to reduce the extra-over costs associated with meeting Code Levels, as a greater part of the construction cost becomes the cost of building a Building Regulation compliant dwelling (and not part of the cost of achieving the Code rating). This is not a change in the overall cost of constructing the dwelling, but simply a shift in accounting for a proportion of that cost from a Code cost to a cost of meeting regulations. A second effect of the tightening of the Building Regulations is that certain credited elements of the Code will fall behind the minimum requirement of the Regulations. This is particularly the case in the energy category, as the changes to Part L will mean that by 2016 the mandatory DER standards of all but Code Levels 5 and 6 will be behind the minimum standards required by Building Regulations and Zero Carbon Homes policy. The impact of these changes are summarised below:
Table 36: Impact of Building Regulation changes on minimum DER/TER reductions required at each Code Level
Mandatory reduction of DER / TER at each Code Level
Date
Reduction of DER/TER enforced by Building Regs /
ZCH policy CL1 CL2 CL3 CL4 CL5 CL6
2009 0 10% 18% 25% 44% 100% 100% + Unreg.
2010 25% 25% 25% 25% 44% 100% 100% + Unreg.
2013 44% 44% 44% 44% 44% 100% 100% + Unreg
2016 70% 70% 70% 70% 70% 100% 100% + Unreg

68
Assuming the Code credit scoring system is not modified as the Building Regulations change, e.g. credits are still awarded under the Energy category for achieving a standard that is a minimum regulatory requirement, then the extra-over cost of achieving Code Levels 1 and 2 will fall to a low level once Part L changes in 2010 (and will be zero or negligible from 2013). The change in Code 3 and 4 costs are shown in Figure 12. In this chart, the change in construction cost from a baseline of Part L2006 compliance is shown by the bars, i.e. the cost of building to the Code combined with the impact of changes to the Building Regs. The broken red lines indicate the increase in construction cost associated with Building Reg changes alone and, therefore, the height of the bars above the broken lines is the extra-over cost associated with the Code above the cost of compliance with the Building Regulations in force at the time.
£0
£2,000
£4,000
£6,000
£8,000
£10,000
£12,000
£14,000
£16,000
£18,000
CL3 CL4 CL3 CL4 CL3 CL4 CL3 CL4 CL3 CL4
2009 2011 2013 2015 2017
E/O
Cod
e co
st (f
rom
a b
asel
ine
of 2
006
Reg
s co
mpl
ianc
e)
Other costs
Energy
Figure 12: Changing additional cost of building a Code Level 3 and 4 compliant dwelling (3-bd semi) over time as Building Regulations change, measured from a baseline of building a 2006 Building Regulation compliant dwelling. The height of the bars below the broken red lines indicate the cost associated with meeting the higher Building Regulation standard and the height of the bars above the broken red line is the extra-over cost associated with the Code.
As shown in Figure 12, the extra-over cost associated with Code Level 3 compared with the cost of meeting Building Regulations drops considerably following the 2010 changes to the Regs. The overall cost of constructing a Code Level 3 compliant dwelling increases in 2013 due to the need to meet the increased minimum regulatory DER standards, such that the cost difference between achieving Code Level 3 and 4 becomes fairly small. The diminishing overall additional cost of building a Code Level 4 compliant dwelling between 2009 and 2015 is a result of reductions in the cost of measures over time. In 2016 there is a sharp increase in the cost of building a regulation compliant home, due to the introduction

69
of the Zero Carbon Homes policy. The extra-over cost associated with reaching Code Level 3 and 4 post-2016 is small. (Note that the Energy costs shown in this chart post-2016 relate to achieving a 70% Carbon Compliance level, the cost of Allowable Solutions is not shown in the chart and would be additional).
The future change in the costs associated with building Code Level 5 and 6 homes is shown in Figure 13, below. Again, the bars represent the additional cost of building a Code Level 5 or 6 rated dwelling, from a baseline of a 2006 Building Regulation compliant dwelling, and the broken red lines indicate the increasing additional cost of only meeting the Building Regulations.
£0
£5,000
£10,000
£15,000
£20,000
£25,000
£30,000
£35,000
£40,000
£45,000
CL5 CL6 CL5 CL6 CL5 CL6 CL5 CL6 CL5 CL6
2009 2011 2013 2015 2017
E/O
Cod
e co
st (f
rom
a b
asel
ine
of 2
006
Reg
s co
mpl
ianc
e)
Other costs
Energy
Figure 13: Changing additional cost of building a Code Level 5 and 6 compliant dwelling (3-bd semi) over time as Building Regulations change, measured from a baseline of building a 2006 Building Regulation compliant dwelling. The height of the bars below the broken red lines indicate the cost associated with meeting the higher Building Regulation standard and the height of the bars above the broken red line is the extra-over cost associated with the Code.
In the case of Code Levels 5 and 6 a gradual reduction in the cost of achieving the rating is seen over time, due to reductions in the costs associated with the measures applied. The changes to the Building Regulations and introduction of Zero Carbon Homes policy does not enforce at any point a higher DER reduction to be achieved than is required by the mandatory requirements of the Code. However, after 2016 an additional investment in Allowable Solutions will be required in the case of the Code Level 5 compliant dwelling, whereas if Code Level 6 is achieved there will be no requirement for further investment in Allowable Solutions (as all emissions have been dealt with by onsite measures). This will have the effect of bringing the overall costs of building a Code Level 5 and 6 compliant dwelling closer together after 2016, to an extent that will depend on the cost of the Allowable Solutions.

70
7.5 Lifecycle and management cost This section explores the potential impact of the Code on costs experienced by individual householders. Total energy costs for each Ene 1 option were calculated using the SAP 2005 method, with the fuel prices given in appendix 3 (see Section 11).17 However, where a community energy system was employed, the fuel price was adjusted to take into account maintenance and management charges that would have to be passed on to the householders. This adjustment was in terms of an additional premium on top of the stated fuel price (in p/kWh). The premium was calculated based on the total maintenance and management costs of the community system, and split over the total thermal output. Therefore, households with higher thermal demands would pay a proportionally higher amount of the management and maintenance charges. Assumed maintenance costs for the various technologies are stated in appendix 2 (see Section 10).
The other on-going costs considered were those related to the servicing and maintenance of any other LZC technologies employed, for PV or SHW systems, for example. These were subtracted from the fuel bill savings.
For those energy options that displaced a traditional gas boiler, a benefit was also gained as the need for boiler servicing was eliminated. This benefit was taken to be £65 per year, which is an average annual cost for gas boiler servicing. The following formula was used to calculate the net savings for each dwelling for every energy option:
The resulting savings are shown in the following table.
17 Note that this method considers energy use for space heating and hot water, and electricity use for fixed lighting and fans and pumps associated with the heating and ventilation system. Energy for cooking and appliance use is not considered.
Net savings (£/yr) =
Saving due to reduced fuel bill
(£/yr)
Maintenance cost of LZC technology
(£/yr)
Gas boiler servicing cost (if boiler is displaced)
(£/yr) – +

71
Table 37: Fuel costs for Part L 2006 compliant dwellings and net savings for each Ene 1 option for a large edge of town development
Ene 1 option
Code level Short name Flat Terrace Semi Detached
Fuel bill (£/yr) N/A N/A Part L compliant dwelling £301 £391 £504 £657
1 1 Good/Better fabric £73 £122 £183 £177 2 2 Better/Best fabric £86 £122 £183 £252 3 3 Good, PV £100 £80 £121 £185 4 3 Better/Best (SHW) £97 £147 £217 £252 5 3 ASHP £60 £93 £64 £82 6 3 Better, PV £98 £86 £147 £252 7 3 Better, SHW £96 £118 £169 £252 8 4 MVHR, ASHP (PV) £99 £98 £197 £275 9 4 BM heating £254 £241 £309 £402 10 4 MVHR, PV £127 £131 £187 £276 11 4 Community gas CHP £237 £296 £376 £478 12 4 Micro gas CHP £99 £163 £248 £353 13 5 BM heating, PV (100%) £283 £14 £97 £203 14 5 Community gas CHP, PV £263 £296 £400 £528 15 6 Community BM heating, PV £245 £366 £478 £644 16 6 BM CHP, PV £271 £369 £473 £601
Annual saving
relative to Part L
compliant dwelling
(£/yr)
17 6 BM heating, PV (ZCH) £245 £101 £198 £348
The maintenance costs used cover servicing, plant maintenance, and replacement parts. It should be noted that these costs are relatively uncertain and potentially highly variable, depending on service contracts and plant reliability. The figures in the table above should be used as a guide and should not be taken as definitive. The percentage reductions in fuel bills, taking into account the servicing and maintenance costs of any LZC technologies are shown below.
Table 38: Typical net savings as a percentage of Part L dwelling’s fuel bill for a large edge of town development
Net saving as a percentage of Part L dwelling’s annual fuel bill Code level Ene 1 option
Flat Terrace Semi Detached 1 1 24% 31% 36% 27% 2 2 29% 31% 36% 38% 3 6 32% 22% 29% 38% 4 10 42% 33% 37% 42% 5 14 88% 76% 79% 80% 6 16 90% 94% 94% 91%

72
8 SUMMARY OF KEY ISSUES
8.1 Energy The results presented above highlight a number of key points concerning the Energy category of the Code:
• Overall costs of Code compliance are most sensitive to the energy strategy employed to achieve the mandatory improvement in Dwelling Emission Rate. While house-by-house energy solutions are generally available in all development types, and associated costs are relatively insensitive to development scale and dwelling density, certain community energy solutions may only be available in certain development types. Furthermore, the costs of such options depend strongly on the technology chosen (development scale) and the heat distribution costs (dwelling density).
• Very high levels of thermal insulation, combined with low air permeability and low thermal bridging can be used to achieve significant reductions in DER relative to TER. For example, the ‘Best’ fabric package combined with a MVHR system gives an improvement of the order 40% for the detached house. Achieving such levels of thermal performance and air tightness in practice is highly sensitive to workmanship. Particular care and attention must be paid to finishing, especially when it comes to minimising thermal bridging and achieving the target air tightness levels.
• The effectiveness of fabric improvement packages in reducing DER decreases as the ratio of exposed areas to total internal floor area decreases. (Exposed area is any area through which heat is lost). This means achieving the mandatory DER levels is generally more challenging in dwellings such as flats and terraced houses.
• The number of energy options available tends to decrease as target Code level increases. Gas boilers cannot be used to meet thermal demands at the highest Code levels (5 and 6) unless a source of low or zero carbon electricity is also available.
• Achieving the required DER to meet the current ZCH (Code 6) target represents a significant challenge. Of the energy strategies considered, only the biomass CHP with PV solution led to the target levels being met, and then only in houses. It was not possible to meet the mandatory DER improvement for the mid-floor flat considered, given the assumptions on available space for LZC technologies.
• Over time, as the Building Regulations are tightened the extra-over cost associated with building to the Code will drop, as costs that are currently Code costs will be incurred just to meet the minimum regulatory standards. A further effect of changes to the Building Regulations, in particular Part L, is that some standards currently defined in the Code will fall behind the minimum standards required by the Regulations. The overall cost of building a Code compliant dwelling may therefore increase as a result of the increased cost of construction of a Building Regulation compliant dwelling.
While the results of this study suggest that community energy systems offer the potential to meet the higher Code levels, particularly those based on biomass energy plant, realising such schemes in practice can present a wide range of issues; from technical and economic challenges to non-technical barriers. Widespread provision of heat to dwellings over community heating systems is a significant change from the currently typical model of individual heating plant in each dwelling, requiring local organisations to take on management of the infrastructure and billing of householders for their heat consumption. House builders do not typically see a role for themselves in the ongoing operation and management of energy systems (although there are some exceptions) and so there is an opportunity for third party organisations

73
with specialist skills in operation of energy systems and provision of energy services – Energy Service Companies (ESCOs) – to fulfil this role. There are a wide range of services that ESCOs may offer, ranging from simple maintenance contracts to complete design, build, finance and operate (DBFO) contracts. In the majority of cases, the economics of energy systems that are capable of delivering high Code level compliance, e.g. biomass based district heating systems, do not provide an adequate rate of return to attract full financing by a commercial ESCO. Typically an ESCO will make a capital contribution, based on a forecast of revenues from sale of energy services over the project lifetime, leaving a substantial amount of the capital investment to be met by the developer. With the introduction of various financial incentives to support investment in renewable energy systems, such as the renewable feed-in tariff (a kWh-based payment for generation of renewable electricity by systems of less than 5MWe) and renewable heat incentive (a kWh-based payment for local use of renewably generated heat), the economics of these systems will improve and therefore the capital contribution expected from developers may increase.
There are significant risks associated with the operation of site-wide energy systems, both financial and technical, that will be factored into any decision to implement these systems. The following are some of the challenges to implementing a successful community energy scheme:
• Perception: gaining public acceptance for the change from individual heating systems to shared infrastructure.
• Financing: community energy schemes demand a large capital outlay, often in the early stages of a development before the whole development has been built out and buildings become occupied. The early capital investment is therefore at risk, based on the expectation that revenues will develop over time.
• Phasing: site-wide energy solutions tend to be better suited to larger developments. However, a site consisting of thousands of homes may be completed over a number of years, with early occupants in residence before the whole development is complete. The plant must be sized to meet the demands of the whole site (once complete) and in the early years a trade-off must be made between under-utilisation of plant and heat dumping.
• Ownership: typically an organisation must take ownership of the community energy system and be responsible for delivering heat to consumers. Specialist companies such as ESCOs that provide this service are becoming more commonplace.
8.2 Water This category represents one of the major concerns for house builders in terms of impact of the Code on saleability of homes. Prospective buyers will expect certain standards and might be deterred by measures such as low flow taps, low flow showers, shorter baths etc, and could have concerns in relation to maintenance and on-going costs of a greywater recycling / rainwater harvesting system where these are specified.
Not only is the cost of meeting the most stringent internal water use requirements fairly high (estimated as being up to £4,500 for a detached house), meeting these standards may have the perverse effect of underestimating water use in the medium to long term. Low flow fittings can be replaced by standard faucets, flow restrictors removed etc if the purchaser of a new home is not satisfied with the performance of taps and showers, for example.

74
A review of the Water category and the water calculator tool is currently underway and changes are likely to be incorporated into the revised Technical Guide from 2010.
8.3 Other Code categories Feedback from the developers during the consultation suggested that there is no significant extra over cost associated with meeting the uncredited mandatory issues in the Materials, Surface Water Run-off and Waste categories. The Green Guide rating requirement for Mat 1 is generally met by default for base specifications and minimising peak water run-off from a site is often a planning requirement (rather than a Code related cost). Waste storage provision to satisfy the Was 1 mandatory element is generally part of the standard build and site waste management plans are now a legal requirement for sites in England and Wales where construction works will cost in excess of £300,000.
Other issues with substantial cost implications include provision of cycle storage, meeting the mandatory internal water consumption targets of Code levels 5 and 6 and achieving the credit against the flood risk issue (Sur 2) in developments situated in areas of medium or high flood risk.
Meeting Lifetime Homes standard is also a significant additional cost. This is currently limited to Code Level 6, where it is mandatory, although there is some consideration of implementing the standard at progressively lower levels of the Code. There is currently significant uncertainty surrounding what the actual cost of meeting the Lifetime Homes standard should be. During the consultation process, house builders reported high costs to meet the Lifetime Homes standard, which have been reflected in the costs used in this analysis. These costs, however, are based on adaption of current standard housing designs to incorporate Lifetime Homes principles. Many believe that the additional cost of Lifetime Homes can be reduced substantially if the standard housing templates are redesigned to incorporate the principles from the outset.

75
9 APPENDIX 1: FABRIC IMPROVEMENT PACKAGES The following table summarises baseline U-values and base costs. Costs are per square metre of building element.
Table 39: Baseline U-values and costs
Element Baseline U-value (W/m2K) Baseline cost (£/m2) Roof 0.25 £136
External wall 0.35 £115 Ground floor 0.25 £107
Windows / doors 2.2 £250
From these baseline specifications, packages of measures were designed to ensure that the baseline dwellings complied with Part L 2006, these are known as the ‘Reference’ packages. In addition, three other fabric packages were defined, giving increasing levels of thermal performance and air tightness. These are known as ‘Good’, ‘Better’, and ‘Best’. The following table shows the U-values used in the ‘Reference’ fabric package for each dwelling type.
Table 40: ‘Reference’ U-values
‘Reference’ U-value (W/m2K) Element
Flat Terrace Semi Detached Roof 0.25 0.18 0.18 0.18
External wall 0.35 0.25 0.25 0.25 Ground floor 0.25 0.20 0.25 0.25
Windows / doors 2.2 1.8 1.8 2.2
Improved U-values and extra over costs (per square metre of element) for the fabric enhancement are given below. The U-values in each of the improved fabric packages were the same for each dwelling type.
Table 41: Improved fabric U-values and costs
U-value (W/m2K) E/O cost relative to baseline costs (£/m2)
Element ‘Good’ fabric
‘Better’ fabric ‘Best’ fabric ‘Good’
fabric ‘Better’ fabric ‘Best’ fabric
Roof 0.18 0.15 0.10 £1 £3 £8 External wall 0.25 0.20 0.15 £6 £8 £11 Ground floor 0.20 0.15 0.10 £3 £9 £18 Windows /
doors 1.5 1.1 0.7 £3 £66 £218

76
The two other variables that changed between fabric packages were air tightness and thermal bridging, as summarised below.
Table 42: Air tightness and thermal bridging values and costs
Value E/O cost relative to baseline costs (£/dwelling)
Ref. ‘Good’
fabric ‘Better’ fabric
‘Best’ fabric
‘Good’ fabric
‘Better’ fabric
‘Best’ fabric
Air permeability q50 (m3/m2/hr)
10 7 4 1 £0 £700 £1,000
Thermal bridging y-value (W/m2K) 0.08 0.08 0.04 0.02 £0 £0 £0
The UK building industry has relatively limited experience in achieving very low thermal bridging values. The technical feasibility of completing dwellings with y-values as low as 0.02 has been questioned by some in the industry and the costs of reducing thermal bridging are relatively uncertain (and likely to vary with dwelling type, construction method etc). For the purposes of this study no cost has been allocated to improving the thermal bridging y-value. This means that the overall costs of fabric improvement could be regarded as relatively optimistic.
Based on the costs above, and appropriate assumptions regarding elemental areas, the total costs of the ‘Reference’ fabric packages were £5,266, £17,260, £25,516, £36,165 for the flat, terraced, semi-detached and detached dwellings respectively. The low cost for the flat is due to no costs being included for roof or floor insulation, since it is a mid-floor flat. The following table summarises the extra cost (above the ‘Reference’ fabric packages) for each of the improved fabric measures.
Table 43: Extra over cost of improved fabric package
E/O cost of improved U-values, air permeability and thermal bridging relative to ‘Reference’ package Fabric package
Flat Terrace Semi Detached Good £215 £42 £186 £243 Better £1,358 £1,992 £2,539 £3,066 Best £2,668 £5,045 £6,442 £7,934
With such a low air permeability value, dwellings with the ‘Best’ fabric measures require a mechanical ventilation system. It was assumed that a mechanical ventilation system with heat recovery would be specified in Code homes, due to the energy savings available by incorporating heat recovery. The MVHR system costs are given below.
Table 44: Cost of mechanical ventilation with heat recovery systems
Flat Terrace Semi Detached MVHR system
cost £1,600 £1,800 £2,200 £2,400

77
10 APPENDIX 2: LZC TECHNOLOGY COSTS AND SIZING
10.1 Technology cost projections The following tables summarise the technology costs used in this study. The costs are typical representative figures and include delivery and installation, but exclude VAT. Cost projections are based on market tested, pier reviewed data.
10.1.1 Photovoltaics
Table 45: Photovoltaic system costs
Houses Flats
Year Fixed cost (£/installation)
Variable cost
(£/kWp)
System cost
(£/kWp)
Maintenance cost (£/yr)
Notes
2009 £1,500 £3,680 £4,500 £50 / yr 2010 £1,500 £3,400 £4,157 £50 / yr 2011 £1,500 £3,160 £3,864 £50 / yr 2012 £1,500 £2,960 £3,619 £50 / yr 2013 £1,500 £2,760 £3,375 £50 / yr 2014 £1,500 £2,600 £3,179 £50 / yr 2015 £1,500 £2,440 £2,984 £50 / yr 2016 £1,500 £2,336 £2,856 £50 / yr 2017 £1,500 £2,232 £2,729 £50 / yr 2018 £1,500 £2,128 £2,602 £50 / yr 2019 £1,500 £2,024 £2,475 £50 / yr 2020 £1,500 £1,920 £2,348 £50 / yr
Maintenance cost based on the following assumptions:
Electrical inspection every 5 years at a cost of £80 (5
inspections over the lifetime of the system)
One inverter replacement during the system’s lifetime (of 30 years) at a cost of £1,200
Approximate maintenance cost per year = £50

78
10.1.2 Solar Hot Water
Table 46: Solar hot water system costs
SHW system cost Year
(£/kWp) £/installation Maintenance
cost (£/yr) Notes
2009 £777 £1,335 £15 2010 £744 £1,264 £15 2011 £720 £1,207 £15 2012 £687 £1,136 £15 2013 £663 £1,065 £15 2014 £638 £1,037 £15 2015 £622 £994 £15 2016 £605 £974 £15 2017 £589 £954 £15 2018 £573 £934 £15 2019 £556 £914 £15 2020 £540 £895 £15
Solar thermal systems are designed for low maintenance. A cost of £15 per year is allowed for occasional cleaning and to cover the cost of a replacement
pump once in the system’s 30 year life.

79
10.1.3 Air Source Heat Pumps The installed cost for an ASHP in 2009 is based upon quotes from a major heat pump manufacturer. Given the smaller thermal demands of a flat or a terraced house, a slightly smaller heat pump unit may be specified, with a thermal output up to around 5kW. The semi-detached and detached house would require a slightly larger unit (with an output up to around 10kW), and this is reflected in the costs given below. Discussions with manufacturers and installers suggest that the installation of an ASHP may require around an extra day relative to fitting a standard gas boiler. An additional labour cost of £500 has therefore been allowed and is included in the stated costs. In terms of maintenance, a closed system ASHP requires an annual inspection only. Maintenance costs are therefore assumed to be no higher than for a traditional condensing gas boiler.
Table 47: Air source heat pump system costs
ASHP installed cost Year
Flat/terrace Semi/detached Maintenance cost (£/yr)
2009 £2,858 £3,553 £65 2010 £2,770 £3,443 £65 2011 £2,681 £3,333 £65 2012 £2,593 £3,223 £65 2013 £2,504 £3,113 £65 2014 £2,446 £3,040 £65 2015 £2,387 £2,967 £65 2016 £2,339 £2,901 £65 2017 £2,292 £2,835 £65 2018 £2,245 £2,769 £65 2019 £2,198 £2,703 £65 2020 £2,151 £2,637 £65

80
10.1.4 Biomass Heating The cost of individual biomass boilers can vary depending on the exact specification. An installed cost of £10,000 for a pellet-fed boiler for an individual house has been used as a representative figure. The community biomass heating costs are based on industry data for subterranean tip-in woodchip boilers. As for all the community energy solutions, a heat distribution cost is also added to determine the total cost.
Table 48: Biomass heating costs
Biomass boiler plant cost Maintenance cost
Year Individual boiler (£)
Community boiler (up to
200kW) (£/kW)
Community boiler (above
200kW) (£/kW)
Individual boiler (£/yr)
Community boiler (up to 200kW) (% of
cap.ex.)
Community boiler (above 200kW) (% of
cap.ex.)
2009 £10,000 £800 £250 £300 2% 2% 2010 £10,000 £800 £250 £300 2% 2% 2011 £10,000 £800 £250 £300 2% 2% 2012 £10,000 £800 £250 £300 2% 2% 2013 £10,000 £800 £250 £300 2% 2% 2014 £10,000 £800 £250 £300 2% 2% 2015 £10,000 £800 £250 £300 2% 2% 2016 £10,000 £800 £250 £300 2% 2% 2017 £10,000 £800 £250 £300 2% 2% 2018 £10,000 £800 £250 £300 2% 2% 2019 £10,000 £800 £250 £300 2% 2% 2020 £10,000 £800 £250 £300 2% 2%

81
10.1.5 Gas-fired Combined Heat and Power The micro gas CHP unit modelled in this study was based on fuel cell technology, with a 1kWe system per dwelling, with a heat : power ratio of unity. For the purposes of the SAP calculation, it was assumed that such a system may meet 60% of the dwelling’s thermal demands, with the remainder being met by a 90% efficient side-boiler. Although fuel cell CHP units are not currently available, development work continues and they are set to appear on the market within the next few years. Manufacturers have implied that the target price will be around £4,000 to £4,500 installed.
Table 49: Gas combined heat and power costs
Gas CHP cost Maintenance cost Medium CHP (up to
200kWe) Large CHP (>200kWe) Year Micro
CHP (£) £/kWe £/dwelling £/kWe £/dwelling
Micro (£/yr)
Medium (% of
cap.ex.)
Large (% of
cap.ex.)
2009 N/A £2,045 £900 £1,000 £300 £110 4% 3% 2010 N/A £2,045 £900 £1,000 £300 £110 4% 3% 2011 £5,000 £2,045 £900 £1,000 £300 £110 4% 3% 2012 £5,000 £2,045 £900 £1,000 £300 £110 4% 3% 2013 £4,800 £2,045 £900 £1,000 £300 £110 4% 3% 2014 £4,600 £2,045 £900 £1,000 £300 £110 4% 3% 2015 £4,400 £2,045 £900 £1,000 £300 £110 4% 3% 2016 £4,200 £2,045 £900 £1,000 £300 £110 4% 3% 2017 £4,000 £2,045 £900 £1,000 £300 £110 4% 3% 2018 £4,000 £2,045 £900 £1,000 £300 £110 4% 3% 2019 £4,000 £2,045 £900 £1,000 £300 £110 4% 3% 2020 £4,000 £2,045 £900 £1,000 £300 £110 4% 3%

82
10.1.6 Biomass Combined Heat and Power The small biomass CHP plant is based on Talbott’s BG100 unit, which gives 100kWe output and has a heat to power ratio of around 3:1. The cost used includes delivery, installation (including grid connection), and commissioning. The medium and medium-large systems are based on Organic Rankine Cycle technology, with a heat to power ratio of 4.3:1.
Table 50: Biomass combined heat and power costs
Biomass CHP plant cost (£/kWe) Maintenance cost
Year Small (100kWe)
Medium (500kWe)
Medium-large
(800kWe)
Small (100kWe)
Medium (500kWe)
Medium-large
(800kWe)
2009 £4,850 £6,767 £4,395 4% 4% 4%
2010 £4,702 £6,632 £4,307 4% 4% 4%
2011 £4,603 £6,429 £4,175 4% 4% 4%
2012 £4,504 £6,293 £4,087 4% 4% 4%
2013 £4,355 £6,158 £3,999 4% 4% 4%
2014 £4,256 £5,955 £3,867 4% 4% 4%
2015 £4,157 £5,820 £3,779 4% 4% 4%
2016 £4,058 £5,684 £3,692 4% 4% 4%
2017 £3,959 £5,549 £3,604 4% 4% 4%
2018 £3,860 £5,414 £3,516 4% 4% 4%
2019 £3,761 £5,278 £3,428 4% 4% 4%
2020 £3,662 £5,143 £3,340 4% 4% 4%
10.1.7 Heat Distribution The heat distribution costs included for community heating schemes are given below. These costs were derived from a Combined Heat and Power Association report.18
Table 51:District heating costs
Dwelling density (dwellings/hectare) Pipe length Cost (£/dwelling)
40 20 £9,000 80 12 £4,700
160 8 £2,800 A heat distribution cost of £2,500 per flat was assumed for block heating in flats.
18 www.tcpa.org.uk/press_files/pressreleases_2008/20080331_CEG.pdf

83
10.2 Technology sizing
10.2.1 Photovoltaics A range of PV systems are now available on the market. This study considered polycrystalline cells, with a power density of 0.125kWp/m2 of panel area. The following table shows the roof area assumptions made, which allowed calculation of the maximum PV system size possible for each dwelling type.
Table 52: Maximum PV capacity by dwelling type
Dwelling type Suitable roof area available for PV (m2/dwelling)
Maximum PV power output (kWp)
Flat 6 0.75 Terraced house 20 2.5
Semi-detached house 24 3.0 Detached house 32 4.0
The electricity generated by PV systems was calculated in accordance with SAP 2005 (Appendix M), which gives the formula:
Where kWp is the peak power output of the array, S is the annual solar radiation (which is given in the SAP tables and depends on orientation), and Zpv is the overshading factor (also given in SAP tables).
For both the PV and SHW technologies, it was assumed that systems would be installed with a SE/SW orientation, at 30o tilt angle and with little or no overshading.
10.2.2 Solar Hot Water The solar hot water systems modelled in this study were based on evacuated tube systems, which were assumed to have a peak output of 0.7kW/m2 of panel area. The maximum available area for SHW on a given dwelling was assumed to be the same as that for PV systems (though the selection of these systems was mutually exclusive). However, the areas of the systems specified did not approach these limits as the consideration of percentage of hot water demands met was the first limiting factor. Solar thermal systems are typically sized to meet up to 50–60% of hot water demands and this guideline was adhered to in this work. The energy input from the SHW systems specified was calculated in accordance with the methodology set out in SAP 2005.
10.2.3 Air Source Heat Pumps The performance of heat pumps in terms of efficiency (or coefficient of performance, COP) increases when the temperature difference between the source of heat and the heat sink is minimised. That is, efficiency is maximised when heat is delivered at a low temperature. New houses tend to have better levels of insulation and air tightness than existing buildings, and therefore lower thermal demands. Heat may be delivered at a lower temperature in new builds (especially if an underfloor heating system is specified) and ASHPs are therefore better suited to the new build market than use in retrofit applications.
Electricity produced (kWh/yr)
= 0.75 x kWp x S x Zpv

84
The COP of the ASHPs modelled in SAP was taken as 2.5. Based on discussions with heat pump manufacturers, this may be considered as a relatively conservative figure and higher efficiencies may be possible.
10.2.4 Biomass Heating The size of the community biomass heating boilers for each development was derived based on total thermal demands for the development and assumed load factors in the region of 10–15%.19 Diversity effects mean that demands tend to be smoothed to a greater extent in larger developments, which means that higher load factors may be assumed.
For biomass block heating of flats, the plant size was derived by assuming a capacity of 4kW per flat and a given number of flats per block (8, 10, or 20), depending on the development scenario.
The efficiency of community biomass boilers was taken to be 81%, and it was assumed that they would meet all thermal demands.
19 Total thermal demands were calculated by summing the demands of each dwelling type. Since only mid-floor flats were modelled, an adjustment was made to account for the fact that the heat loss from a block of flats would be higher than the sum of the heat losses from mid-floor flats only due to ground and top floor flats. This adjustment was made by calculating the thermal demands of a typical ground or top floor flat, assuming a suitable ratio of mid-floor to ground/top floor flats and thus deriving an adjustment factor.

85
10.2.5 Gas-fired Combined Heat and Power As mentioned above, the micro gas CHP unit considered in this work is based on fuel cell technology. It was assumed that a 1kWe unit could be installed per house, with a heat to power ratio of 1 and an overall efficiency of 82%. Due to a lack of detailed data (no micro CHP units are currently defined in the SEDBUK database, for example), calculation of the carbon savings from micro gas CHP could not be done following the SAP methodology. Instead, the calculations were based on the technical details mentioned above and the following assumptions:
• CHP unit meets 60% of thermal demands.
• Remaining thermal demands are met by a 90% efficient side-boiler.
• 60% of the electricity generated is available for export to the grid.
• All electricity generated is credited with a carbon saving at 0.568kgCO2/kWh, as directed by SAP 2005.
Community CHP systems (both gas and biomass-fired) were sized using the following methodology:
CALCULATION ASSUMPTIONS
Calculate total thermal demand for all dwellings in the development in
question (kWh/yr)
Assume proportion of total thermal demands that are to be
met by the CHP plant (%)
Calculate thermal demands to be met by the CHP plant
(kWh/yr)
Assume the number of full-load run hours the plant should
achieve (hours/yr)
Calculate size of CHP plant
(kWth)
Determine heat : power ratio for the CHP technology in question
Calculate size of CHP plant
(kWe)
Figure 14: CHP sizing methodology

86
In all cases, it was assumed that the community CHP plant would meet 80% of the total thermal demands. Also, the number of full-load run hours was taken to be 5,000, which is a typical figure often cited as CHP units should generally exceed this for economic operation. For gas CHP units, a heat to power ratio of 1.5 was assumed, and an overall efficiency value of 80%. These are typical values for CHP technologies suitable for use at the community scale, such as internal combustion engines and gas turbines. For biomass CHP, the heat to power ratio depends upon the technology employed (which depends on development scenario – see below).
10.2.6 Biomass Combined Heat and Power The sizing methodology for biomass CHP was the same as for gas CHP (see figure 2, above). However, depending on the size of the development, and therefore total thermal demands (hence CHP plant size), one of two biomass CHP technologies was considered. These are summarised in the table below.
Table 53: Biomass CHP technologies
BG100 Organic Rankine Cycle Indicative size (kWe) 100 500+ Heat to Power ratio 2.0 4.3 Overall efficiency 80% 80%
An alternative technology type is the steam turbine, which is suitable for systems of around 2,500kWe and above. However, biomass CHP was only considered for the highest Code levels, which means that thermal demands are relatively low (due to the high levels of insulation) and the required plant size did not approach this level for any of the developments considered.

87
10.3 Cost of Ene 1 Options Based on the cost assumptions and sizing methodology outlined above, and the target percentage improvement in DER required, each of the Ene 1 options was costed for each dwelling in every development scenario. The costs per dwelling for community heating solutions vary depending on the characteristics of the development (scale and dwelling density) and the tables below show the costs for two development types: medium scale edge of town (650 dwellings, 40dph), and medium urban (350 dwellings, 80dph).
Table 54: Technology sizes and costs (2009) for a medium urban development
Technology size Total E/O cost of Ene 1 option (£k / dwelling) No. CL Short name
F T S D F T S D 1 1 Good fabric N/A 0.2 0.1 0.2 0.2
2 2 Good+ / Better fabric N/A 1.4 1.3 0.7 0.6
3 3 Good, PV 0.5kW 0.75kW 0.75kW 1kW 2.5 4.3 4.4 5.4
4 3 Better/Best (SHW) 0.7kW No SHW required 6.1 6.8 8.6 3.1
5 3 ASHP 5kW 5kW 9kW 9kW 1.6 1.4 2.0 2.0
6 3 Better, PV 0.25kW 0.25kW 0.25kW 0kW 2.5 4.4 5.0 3.1
7 3 Better, SHW 1.6kW 1.6kW 0.7kW 0kW 3.9 4.6 4.4 3.1
8 4 ASHP, PV 0.4kW PV
0.35kW PV
0.25kW PV
0kW PV 4.5 6.1 6.8 4.9
9 4 BM heating Block heating (flats) – 4kW per flat Individual BM boilers for houses
10.5 15.3 16.9 18.6
10 4 MVHR, PV 0.75kW 0.75kW 0.5kW 0.25kW 7.6 11.1 12.0 12.8
11 4 Community gas CHP 190kWe 6.6 6.8 7.0 7.6
12 4 Micro gas CHP 1kWe unit per dwelling Not available in 2009
Block heating (flats) – 4kW per flat Individual BM boilers for houses 13 5 BM heating, PV
(100%) 0.75kW 1.05kW 1.25kW 1.6kW
13.8 20.7 23.0 26.0
130kWe gas CHP 14 5 Community gas
CHP, PV 0.95kW 1.15kW 1.35kW 1.75kW 14.8 18.9 21.4 24.7
130kWe gas CHP 15 6 Community gas
CHP, PV 3.2kW 3.65kW 4.25kW 4.85kW 24.9 28.1 32.0 36.1
c.100kWe 16 6 BM CHP, PV
1.3kW 1.4kW 1.4kW 1.6kW 15.9 19.5 21.4 24.1
Block heating (flats) – 4kW per flat Individual BM boilers for houses 17 6 BM heating, PV
(ZCH) 2.95kW 3.55kW 4.05kW 4.7kW
23.7 29.9 33.3 37.4
No. = Ene 1 option number. CL = Target Code Level.

88
Table 55: Technology sizes and costs (2009) for a medium edge of town development
Technology size Total E/O cost of Ene 1 option (£k / dwelling) No. CL Short name
F T S D F T S D 1 1 Good fabric N/A 0.2 0.1 0.2 0.2
2 2 Good+ / Better fabric N/A 1.4 1.3 0.7 0.6
3 3 Good, PV 0.5kW 0.75kW 0.75kW 1kW 2.5 4.3 4.4 5.4
4 3 Better/Best (SHW) 0.7kW No SHW required 6.1 6.8 8.6 3.1
5 3 ASHP 5kW 5kW 9kW 9kW 1.3 1.2 1.7 1.8
6 3 Better, PV 0.25kW 0.25kW 0.25kW 0kW 2.5 4.4 5.0 3.1
7 3 Better, SHW 1.6kW 1.6kW 0.7kW 0kW 3.9 4.6 4.4 3.1
8 4 ASHP, PV 0.4kW PV
0.35kW PV
0.25kW PV
0kW PV 4.3 5.9 6.5 4.6
9 4 BM heating Block heating (flats) – 4kW per flat Individual BM boilers for houses
10.2 15.1 16.6 18.3
10 4 MVHR, PV 0.75kW 0.75kW 0.5kW 0.25kW 7.6 11.1 12.0 12.8
11 4 Community gas CHP 190kWe 9.6 9.7 9.7 10.0
12 4 Micro gas CHP 1kWe unit per dwelling Not available in 2009
Block heating (flats) – 4kW per flat Individual BM boilers for houses 13 5 BM heating, PV
(100%) 0.75kW 1.05kW 1.25kW 1.6kW
13.6 20.5 22.7 25.7
130kWe gas CHP 14 5 Community gas
CHP, PV 0.95kW 1.15kW 1.35kW 1.75kW 17.9 22.0 24.4 27.6
130kWe gas CHP 15 6 Community gas
CHP, PV 3.2kW 3.65kW 4.25kW 4.85kW 28.0 31.2 35.0 39.0
c.100kWe 16 6 BM CHP, PV
1.3kW 1.4kW 1.4kW 1.6kW 20.0 23.6 25.4 28.1
Block heating (flats) – 4kW per flat Individual BM boilers for houses 17 6 BM heating, PV
(ZCH) 2.95kW 3.55kW 4.05kW 4.7kW
23.5 29.7 33.0 37.1
No. = Ene 1 option number. CL = Target Code Level.

89
11 APPENDIX 3: FUEL AND ELECTRICITY PRICES The gas and electricity prices used in this study were taken from a report by the government’s inter-departmental analysts group, published by defra.20 The biomass fuel prices used were those given in SAP 2005 and were assumed constant in all years: 3p/kWh for wood pellets and 1.6p/kWh for wood chips.
Table 56: Gas and electricity prices
Year Domestic gas price (p/kWh)
Domestic electricity price (p/kWh)
2009 3.1 12.5 2010 3.1 12.3 2011 3.1 11.4 2012 3.1 11.4 2013 3.1 11.4 2014 3.1 11.5 2015 3.1 11.6 2016 3.1 11.6 2017 3.1 11.7 2018 3.1 11.7 2019 3.2 11.8 2020 3.2 11.8
20 http://www.defra.gov.uk/environment/climatechange/uk/ukccp/pdf/greengas-policyevaluation.pdf

90
12 APPENDIX 4: COST DATA TABLES
Table 57: E/O costs and credits by issue: Small Brownfield development
Small Brownfield Development: Code Level 1 Flat Terraced house Semi-detached Detached
Category Issue Details of measures Credits E/O
Cost Credits E/O Cost Credits E/O
Cost Credits E/O Cost
Ene 1 Good fabric 1 £215 1 £118 1 £186 1 £243
Ene 2 Credits awarded based on HLP achieved with given fabric package 2 £0 1 £0 0 £0 0 £0
Ene 3 >40% of internal light fittings dedicated energy efficient (flat) 2 £30 2 £40 2 £50 0 £0
Ene 4 Internal tidy-dry 1 £15 1 £15 1 £15 1 £15
Ene 5 Information on benefits of
purchasing energy efficient white goods provided
1 £5 1 £5 1 £5 1 £5
Ene 6 One zero cost credit assumed for ensuring all external light fittings
are energy efficient 1 £0 1 £0 1 £0 1 £0
Ene 7 No LZC technologies employed 0 £0 0 £0 0 £0 0 £0 Ene 8 Cycle storage not provided 0 £0 0 £0 0 £0 0 £0
Energy / CO2
Ene 9 Home office fixtures not provided 0 £0 0 £0 0 £0 0 £0 Energy / CO2
Totals 8 £265 7 £178 6 £256 4 £263
Wat 1 Assumed achieving 110 litres/person/day is zero cost 2 £0 2 £0 2 £0 2 £0
Water Wat 2 No water butts included 1 £0 0 £0 0 £0 0 £0
Water Totals 3 £0 2 £0 2 £0 2 £0 Materials
Mat 1 Assumed 12 zero cost credits (out 12 £0 12 £0 12 £0 12 £0

91
of 15)
Mat 2 Assumed 4 zero cost credits (out of 6) 4 £0 4 £0 4 £0 4 £0
Mat 3 Assumed 1 zero cost credit (out of 3) 1 £0 1 £0 1 £0 1 £0
Materials Totals 17 £0 17 £0 17 £0 17 £0 Sur 1 No SUDS systems specified 0 £0.0 0 £0.0 0 £0.0 0 £0.0
Surface Water Sur 2 Assumed development is in an
area of low flood risk 2 £0 2 £0 2 £0 2 £0
Surface Water Totals 2 £0 2 £0 2 £0 2 £0
Was 1 Internal storage for recyclable
waste provided, assumed collection scheme exists
4 £25 4 £25 4 £25 4 £25
Was 2 Assumed maximum credits could be achieved for no extra cost 2 £0 2 £0 2 £0 2 £0
Waste
Was 3 Composting facilities not provided 0 £0 0 £0 0 £0 0 £0 Waste Totals 6 £25 6 £25 6 £25 6 £25
Pol 1 Zero cost credit 1 £0 1 £0 1 £0 1 £0 Pollution
Pol 2 High efficiency gas boiler meets requirement for 3 credits 3 £0 3 £0 3 £0 3 £0
Pollution Totals 4 £0 4 £0 4 £0 4 £0
Hea 1
Assumed view of sky can be achieved at no E/O cost in all
dwellings and that ADF of >1.5% in living rooms is met by default in
detached house
1 £0 1 £0 1 £0 2 £0
Hea 2 Detached house scores maximum credits by default 0 £0 0 £0 0 £0 4 £0
Hea 3 Assumed zero cost credit 1 £0 1 £0 1 £0 1 £0
Health & Well-Being
Hea 4 Lifetime Homes standards not met 0 £0 0 £0 0 £0 0 £0 Health & Well-Being Totals 2 £0 2 £0 2 £0 7 £0

92
Man 1 Home user guide provided,
including information on site and surroundings
3 £25 £3 £25 £3 £25 £3 £25
Man 2 Assumed zero cost credits 2 £0 2 £0 2 £0 2 £0
Man 3 Covering two items in site
management strategy assumed to be zero cost
1 £0 £1 £0 £2 £50 £1 £0
Manage-ment
Man 4 Credits not sought 0 £0 0 £0 0 £0 0 £0 Management
Totals 6 £25 6 £25 7 £75 6 £25
Eco 1 Brownfield site, 1 credit by default 1 £0 1 £0 1 £0 1 £0 Eco 2 Ecologist not employed 0 £0 0 £0 0 £0 0 £0
Eco 3 Credit only achieved if ecologist is employed 0 £0 0 £0 0 £0 0 £0
Eco 4 Credits only achieved if ecologist is employed 0 £0 0 £0 0 £0 0 £0
Ecology
Eco 5 No credits achieved 0 £0 0 £0 0 £0 0 £0 Ecology Totals 1 £0 1 £0 1 £0 1 £0
Total Code Credits 49 47 47 49 Total Percentage Points Score 39 36 36 38
Total Extra Over Cost £315 £228 £356 £313

93
Small Brownfield Development: Code Level 2
Flat Terraced house Semi-detached Detached Category Issue Details of measures
Credits E/O Cost Credits E/O
Cost Credits E/O Cost Credits E/O
Cost Ene 1 Good+ / Better fabric 2 £1,358 2 £1,292 3 £705 3 £626
Ene 2 Credits awarded based on HLP achieved with given fabric package 2 £0 2 £0 1 £0 1 £0
Ene 3 >75% of internal light fittings dedicated energy efficient 2 £30 2 £40 2 £50 2 £60
Ene 4 Internal tidy-dry 1 £15 1 £15 1 £15 1 £15
Ene 5 Information on benefits of
purchasing energy efficient white goods provided
1 £5 1 £5 1 £5 1 £5
Ene 6 One zero cost credit assumed for ensuring all external light fittings
are energy efficient 1 £0 1 £0 1 £0 1 £0
Ene 7 Insufficient contribution from LZC technologies 0 £0 0 £0 0 £0 0 £0
Ene 8 Cycle storage not provided 0 £0 0 £0 0 £0 0 £0
Energy / CO2
Ene 9 Home office fixtures not provided 0 £0 0 £0 0 £0 0 £0 Energy / CO2
Totals 9 £1,408 9 £1,352 9 £775 9 £706
Wat 1 Assumed achieving 110 litres/person/day is zero cost 2 £0 2 £0 2 £0 2 £0
Water Wat 2 Water butts included for block of
flats 1 £0 0 £0 0 £0 0 £0
Water Totals 3 £0 2 £0 2 £0 2 £0
Mat 1 Assumed 12 zero cost credits (out of 15) 12 £0 12 £0 12 £0 12 £0
Mat 2 Assumed 4 zero cost credits (out of 6) 4 £0 4 £0 4 £0 4 £0 Materials
Mat 3 Assumed 1 zero cost credit (out of 1 £0 1 £0 1 £0 1 £0

94
3) Materials Totals 17 £0 17 £0 17 £0 17 £0
Sur 1 No SUDS systems specified 0 £0.0 0 £0.0 0 £0.0 0 £0.0 Surface Water Sur 2 Assumed development is in an
area of low flood risk 2 £0 2 £0 2 £0 2 £0
Surface Water Totals 2 £0 2 £0 2 £0 2 £0
Was 1 Internal storage for recyclable
waste provided, assumed collection scheme exists
4 £25 4 £25 4 £25 4 £25
Was 2 Assumed maximum credits could be achieved for no extra cost 2 £0 2 £0 2 £0 2 £0
Waste
Was 3 Composting facilities not provided 0 £0 0 £0 0 £0 0 £0 Waste Totals 6 £25 6 £25 6 £25 6 £25
Pol 1 Zero cost credit 1 £0 1 £0 1 £0 1 £0 Pollution
Pol 2 High efficiency gas boiler meets requirement for 3 credits 3 £0 3 £0 3 £0 3 £0
Pollution Totals 4 £0 4 £0 4 £0 4 £0
Hea 1
Assumed view of sky can be achieved at no E/O cost in all
dwellings and that ADF of >1.5% in living rooms is met by default in
detached house
1 £0 1 £0 1 £0 2 £0
Hea 2 Detached house scores maximum credits by default 0 £0 0 £0 0 £0 4 £0
Hea 3 Assumed zero cost credit 1 £0 1 £0 1 £0 1 £0
Health & Well-Being
Hea 4 Lifetime Homes standards not met 0 £0 0 £0 0 £0 0 £0 Health & Well-Being Totals 2 £0 2 £0 2 £0 7 £0
Man 1 Home user guide provided,
including information on site and surroundings
3 £25 £3 £25 £3 £25 £3 £25 Manage-ment
Man 2 Assumed zero cost credits 2 £0 2 £0 2 £0 2 £0

95
Man 3 Procedures to cover four items in site management procedures 2 £50 £2 £50 £2 £50 £2 £50
Man 4 Credits not sought 0 £0 0 £0 0 £0 0 £0 Management
Totals 7 £75 7 £75 7 £75 7 £75
Eco 1 Brownfield site, 1 credit by default 1 £0 1 £0 1 £0 1 £0 Eco 2 Ecologist employed 1 £150 1 £150 1 £150 1 £150
Eco 3 Credit only achieved if ecologist is employed 1 £0 1 £0 1 £0 1 £0
Eco 4 Cost of increasing number of plant species 4 £15 4 £15 4 £15 4 £15
Ecology
Eco 5 No credits achieved 0 £0 0 £0 0 £0 0 £0 Ecology Totals 7 £165 7 £165 7 £165 7 £165
Total Code Credits 57 56 56 61 Total Percentage Points Score 49 48 48 54
Total Extra Over Cost £1,673 £1,617 £1,040 £971

96
Small Brownfield Development: Code Level 3
Flat Terraced house Semi-detached Detached Category Issue Details of measures
Credits E/O Cost Credits E/O
Cost Credits E/O Cost Credits E/O
Cost Ene 1 Good fabric, ASHP 5 £1,573 5 £1,400 5 £1,989 6 £2,046
Ene 2 Credits awarded based on HLP achieved with given fabric package 2 £0 1 £0 0 £0 0 £0
Ene 3 >75% of internal light fittings dedicated energy efficient 2 £30 2 £40 2 £50 2 £60
Ene 4 Internal tidy-dry 1 £15 1 £15 1 £15 1 £15
Ene 5 Information on benefits of
purchasing energy efficient white goods provided
1 £5 1 £5 1 £5 1 £5
Ene 6 Cost of sensors, timers etc for external lighting 2 £45 2 £45 2 £45 1 £0
Ene 7 No credits achieved 0 £0 0 £0 0 £0 0 £0 Ene 8 Cycle storage not provided 0 £0 0 £0 0 £0 0 £0
Energy / CO2
Ene 9 Home office fixtures not provided 0 £0 0 £0 0 £0 0 £0 Energy / CO2
Totals 13 £1,668 12 £1,505 11 £2,104 11 £2,126
Wat 1 Cost of low flow fittings etc to achieve 105 litres/person/day 3 £200 3 £200 3 £200 3 £240
Water Wat 2 Water butts included for block of
flats and for houses 1 £0 1 £50 1 £50 1 £50
Water Totals 4 £200 4 £250 4 £250 4 £290
Mat 1 Assumed 12 zero cost credits (out of 15) 12 £0 12 £0 12 £0 12 £0
Mat 2 Assumed 4 zero cost credits (out of 6) 4 £0 4 £0 4 £0 4 £0 Materials
Mat 3 Assumed 1 zero cost credit (out of 3) 1 £0 1 £0 1 £0 1 £0

97
Materials Totals 17 £0 17 £0 17 £0 17 £0 Sur 1 No SUDS systems specified 0 £0.0 0 £0.0 0 £0.0 0 £0.0
Surface Water Sur 2 Assumed development is in an
area of low flood risk 2 £0 2 £0 2 £0 2 £0
Surface Water Totals 2 £0 2 £0 2 £0 2 £0
Was 1 Internal storage for recyclable
waste provided, assumed collection scheme exists
4 £25 4 £25 4 £25 4 £25
Was 2 Assumed maximum credits could be achieved for no extra cost 2 £0 2 £0 2 £0 2 £0 Waste
Was 3 Composting facilities provided (flats) 1 £30 0 £0 0 £0 0 £0
Waste Totals 7 £55 6 £25 6 £25 6 £25 Pol 1 Zero cost credit 1 £0 1 £0 1 £0 1 £0
Pollution Pol 2 ASHP is electrically powered,
credits not achieved 0 £0 0 £0 0 £0 0 £0
Pollution Totals 1 £0 1 £0 1 £0 1 £0
Hea 1
Assumed view of sky can be achieved at no E/O cost in all
dwellings and that ADF of >1.5% in living rooms is met by default in detached house, extra glazing
included in flat, terraced and semi-detached
3 £300 3 £300 3 £300 2 £0
Hea 2
Detached house scores maximum credits by default, cost of sound
testing in terraced and semi-detached houses
0 £0 3 £100 3 £100 4 £0
Hea 3 Assumed zero cost credit 1 £0 1 £0 1 £0 1 £0
Health & Well-Being
Hea 4 Lifetime Homes standards not met 0 £0 0 £0 0 £0 0 £0 Health & Well-Being Totals 4 £300 7 £400 7 £400 7 £0
Manage-Man 1 Home user guide provided, 3 £25 £3 £25 £3 £25 £3 £25

98
including information on site and surroundings
Man 2 Assumed zero cost credits 2 £0 2 £0 2 £0 2 £0
Man 3 Procedures to cover four items in site management procedures 2 £50 £2 £50 £2 £50 £2 £50
ment
Man 4 Credits not sought 0 £0 0 £0 0 £0 0 £0 Management
Totals 7 £75 7 £75 7 £75 7 £75
Eco 1 Brownfield site, 1 credit by default 1 £0 1 £0 1 £0 1 £0 Eco 2 Ecologist employed 1 £150 1 £150 1 £150 1 £150
Eco 3 Credit only achieved if ecologist is employed 1 £0 1 £0 1 £0 1 £0
Eco 4 Cost of increasing number of plant species 4 £15 4 £15 4 £15 4 £15
Ecology
Eco 5 No credits achieved 0 £0 0 £0 0 £0 0 £0 Ecology Totals 7 £165 7 £165 7 £165 7 £165
Total Code Credits 62 63 62 62 Total Percentage Points Score 57 58 57 57
Total Extra Over Cost £2,463 £2,420 £3,019 £2,681

99
Small Brownfield Development: Code Level 4
Flat Terraced house Semi-detached Detached Category Issue Details of measures
Credits E/O Cost Credits E/O
Cost Credits E/O Cost Credits E/O
Cost
Ene 1 Better fabric, ASHP, PV for flat
(0.4kW), terraced (0.35kW), semi-detached (0.25kW)
8 £4,516 8 £6,138 8 £6,762 8 £4,869
Ene 2 Credits awarded based on HLP achieved with given fabric package 2 £0 2 £0 2 £0 1 £0
Ene 3 >75% of internal light fittings dedicated energy efficient 2 £30 2 £40 2 £50 2 £60
Ene 4 Internal tidy-dry 1 £15 1 £15 1 £15 1 £15
Ene 5 Information on benefits of
purchasing energy efficient white goods provided
1 £5 1 £5 2 £150 2 £150
Ene 6 Cost of sensors, timers etc for external lighting 2 £45 2 £45 2 £45 2 £45
Ene 7 Credits based on CO2 emission
reduction due to LZC technologies, cost included in Ene 1 costs
2 £0 1 £0 0 £0 0 £0
Ene 8 Cycle storage not provided 0 £0 0 £0 0 £0 0 £0
Energy / CO2
Ene 9 Home office fixtures not provided 0 £0 0 £0 0 £0 1 £80 Energy / CO2
Totals 18 £4,611 17 £6,243 17 £7,022 17 £5,219
Wat 1 Cost of low flow fittings etc to achieve 105 litres/person/day 3 £200 3 £200 3 £200 3 £240
Water Wat 2 Water butts included for block of
flats and for houses 1 £0 1 £50 1 £50 1 £50
Water Totals 4 £200 4 £250 4 £250 4 £290
Mat 1 Assumed 12 zero cost credits (out of 15) 12 £0 12 £0 12 £0 12 £0 Materials
Mat 2 Assumed 4 zero cost credits (out of 4 £0 4 £0 4 £0 4 £0

100
6)
Mat 3 Assumed 1 zero cost credit (out of 3) 1 £0 1 £0 1 £0 1 £0
Materials Totals 17 £0 17 £0 17 £0 17 £0
Sur 1 Site-wide SUDS system cost of £1,100 split between all dwellings 2 £55.0 2 £55.0 2 £55.0 2 £55.0
Surface Water
Sur 2 Assumed development is in an area of low flood risk 2 £0 2 £0 2 £0 2 £0
Surface Water Totals 4 £55 4 £55 4 £55 4 £55
Was 1 Internal storage for recyclable
waste provided, assumed collection scheme exists
4 £25 4 £25 4 £25 4 £25
Was 2 Assumed maximum credits could be achieved for no extra cost 2 £0 2 £0 2 £0 2 £0 Waste
Was 3 Composting facilities provided (flats) 1 £30 1 £50 1 £50 1 £50
Waste Totals 7 £55 7 £75 7 £75 7 £75 Pol 1 Zero cost credit 1 £0 1 £0 1 £0 1 £0
Pollution Pol 2 ASHP is electrically powered,
credits not achieved 0 £0 0 £0 0 £0 0 £0
Pollution Totals 1 £0 1 £0 1 £0 1 £0
Hea 1
Assumed view of sky can be achieved at no E/O cost in all
dwellings and that ADF of >1.5% in living rooms is met by default in
detached house, extra glazing also included
3 £300 3 £300 3 £300 3 £150
Hea 2
Detached house scores maximum credits by default, cost of sound testing in flat, terraced and semi-
detached houses
3 £150 4 £200 4 £200 4 £0
Hea 3 Assumed zero cost credit 1 £0 1 £0 1 £0 1 £0
Health & Well-Being
Hea 4 Lifetime Homes standards met in 0 £0 0 £0 0 £0 0 £0

101
detached house Health & Well-Being Totals 7 £450 8 £500 8 £500 8 £150
Man 1 Home user guide provided,
including information on site and surroundings
3 £25 £3 £25 £3 £25 £3 £25
Man 2 Assumed zero cost credits 2 £0 2 £0 2 £0 2 £0
Man 3 Procedures to cover four items in site management procedures 2 £50 £2 £50 £2 £50 £2 £50
Manage-ment
Man 4
Cost of measures to comply with secured by design principles in
terraced and semi-detached houses
0 £0 0 £0 0 £0 0 £0
Management Totals 7 £75 7 £75 7 £75 7 £75
Eco 1 Brownfield site, 1 credit by default 1 £0 1 £0 1 £0 1 £0 Eco 2 Ecologist employed 1 £150 1 £150 1 £150 1 £150
Eco 3 Credit only achieved if ecologist is employed 1 £0 1 £0 1 £0 1 £0
Eco 4 Cost of increasing number of plant species 4 £15 4 £15 4 £15 4 £15
Ecology
Eco 5 No credits achieved 0 £0 0 £0 0 £0 0 £0 Ecology Totals 7 £165 7 £165 7 £165 7 £165
Total Code Credits 72 72 72 72 Total Percentage Points Score 68 68 68 68
Total Extra Over Cost £5,611 £7,363 £8,142 £6,029

102
Small Brownfield Development: Code Level 5
Flat Terraced house Semi-detached Detached Category Issue Details of measures
Credits E/O Cost Credits E/O
Cost Credits E/O Cost Credits E/O
Cost
Ene 1
Best fabric, community gas CHP, PV (0.75kW, 1.05kW, 1.25kW, 1.6kW for flat, terraced, semi,
detached)
14 £14,769 14 £18,922 14 £21,365 14 £24,708
Ene 2 Credits awarded based on HLP achieved with given fabric package 2 £0 2 £0 2 £0 2 £0
Ene 3 >75% of internal light fittings dedicated energy efficient 2 £30 2 £40 2 £50 2 £60
Ene 4 Internal tidy-dry 1 £15 1 £15 1 £15 1 £15
Ene 5
Information on benefits of purchasing energy efficient white
goods provided (houses) Efficient white goods included (flat)
2 £150 2 £150 2 £150 2 £150
Ene 6 Cost of sensors, timers etc for external lighting 2 £45 2 £45 2 £45 2 £45
Ene 7 Credits based on CO2 emission
reduction due to LZC technologies, cost included in Ene 1 costs
2 £0 2 £0 2 £0 2 £0
Ene 8 Cycle storage not provided 0 £0 0 £0 0 £0 0 £0
Energy / CO2
Ene 9 Home office fixtures provided in flat 1 £80 1 £80 1 £80 1 £80 Energy / CO2
Totals 26 £15,089 26 £19,252 26 £21,705 26 £25,058
Wat 1
Low flow fittings and greywater recycling system to achieve
consumption of 80 litres/person/day
5 £1,750 5 £4,200 5 £4,200 5 £4,500 Water
Wat 2 Water butts included for block of flats and for houses 1 £0 1 £50 1 £50 1 £50
Water Totals 6 £1,750 6 £4,250 6 £4,250 6 £4,550

103
Mat 1 Assumed 12 zero cost credits (out of 15) 12 £0 12 £0 12 £0 12 £0
Mat 2 Assumed 4 zero cost credits (out of 6) 4 £0 4 £0 4 £0 4 £0 Materials
Mat 3 Assumed 1 zero cost credit (out of 3) 1 £0 1 £0 1 £0 1 £0
Materials Totals 17 £0 17 £0 17 £0 17 £0
Sur 1 Site-wide SUDS system cost of £1,100 split between all dwellings 2 £55.0 2 £55.0 2 £55.0 2 £55.0
Surface Water
Sur 2 Assumed development is in an area of low flood risk 2 £0 2 £0 2 £0 2 £0
Surface Water Totals 4 £55 4 £55 4 £55 4 £55
Was 1 Internal storage for recyclable
waste provided, assumed collection scheme exists
4 £25 4 £25 4 £25 4 £25
Was 2 Assumed maximum credits could be achieved for no extra cost 2 £0 2 £0 2 £0 2 £0 Waste
Was 3 Composting facilities provided (flats) 1 £30 1 £50 1 £50 1 £50
Waste Totals 7 £55 7 £75 7 £75 7 £75 Pol 1 Zero cost credit 1 £0 1 £0 1 £0 1 £0
Pollution Pol 2 Gas CHP meets requirement for 3
credits 3 £0 3 £0 3 £0 3 £0
Pollution Totals 4 £0 4 £0 4 £0 4 £0
Hea 1
Assumed view of sky can be achieved at no E/O cost in all
dwellings and that ADF of >1.5% in living rooms is met by default in
detached house, extra glazing also included
3 £300 3 £300 3 £300 3 £150 Health & Well-Being
Hea 2 Detached house scores maximum credits by default, cost of sound testing in flat, terraced and semi-
4 £250 4 £200 4 £200 4 £0

104
detached houses Hea 3 Assumed zero cost credit 1 £0 1 £0 1 £0 1 £0
Hea 4 Lifetime Homes standards met in houses 0 £0 0 £0 0 £0 0 £0
Health & Well-Being Totals 8 £550 8 £500 8 £500 8 £150
Man 1 Home user guide provided,
including information on site and surroundings
3 £25 £3 £25 £3 £25 £3 £25
Man 2 Assumed zero cost credits 2 £0 2 £0 2 £0 2 £0
Man 3 Procedures to cover four items in site management procedures 2 £50 £2 £50 £2 £50 £2 £50
Manage-ment
Man 4
Cost of measures to comply with secured by design principles in
terraced and semi-detached houses
0 £0 0 £0 0 £0 0 £0
Management Totals 7 £75 7 £75 7 £75 7 £75
Eco 1 Brownfield site, 1 credit by default 1 £0 1 £0 1 £0 1 £0 Eco 2 Ecologist employed 1 £150 1 £150 1 £150 1 £150
Eco 3 Credit only achieved if ecologist is employed 1 £0 1 £0 1 £0 1 £0
Eco 4 Cost of increasing number of plant species 4 £15 4 £15 4 £15 4 £15
Ecology
Eco 5 No credits achieved 0 £0 0 £0 0 £0 0 £0 Ecology Totals 7 £165 7 £165 7 £165 7 £165
Total Code Credits 86 86 86 86 Total Percentage Points Score 84 84 84 84
Total Extra Over Cost £17,739 £24,372 £26,825 £30,128

105
Small Brownfield Development: Code Level 6
Flat Terraced house Semi-detached Detached Category Issue Details of measures
Credits E/O Cost Credits E/O
Cost Credits E/O Cost Credits E/O
Cost
Ene 1
Best fabric, community gas CHP, PV (3.2kW, 3.65kW, 4.25kW,
4.85kW for flat, terraced, semi, detached)
15 £24,894 15 £28,122 15 £32,037 15 £36,116
Ene 2 Credits awarded based on HLP achieved with given fabric package 2 £0 2 £0 2 £0 2 £0
Ene 3 >75% of internal light fittings dedicated energy efficient 2 £30 2 £40 2 £50 2 £60
Ene 4 Internal tidy-dry 1 £15 1 £15 1 £15 1 £15
Ene 5
Information on benefits of purchasing energy efficient white
goods provided (houses) Efficient white goods included (flat)
2 £150 2 £150 2 £150 2 £150
Ene 6 Cost of sensors, timers etc for external lighting 2 £45 2 £45 2 £45 2 £45
Ene 7 Credits based on CO2 emission
reduction due to LZC technologies, cost included in Ene 1 costs
2 £0 2 £0 2 £0 2 £0
Ene 8 Cycle storage not provided 0 £0 0 £0 0 £0 0 £0
Energy / CO2
Ene 9 Home office fixtures provided in flats and detached houses 1 £80 1 £80 1 £80 1 £80
Energy / CO2 Totals 27 £25,214 27 £28,452 27 £32,377 27 £36,466
Wat 1
Low flow fittings and greywater recycling system to achieve
consumption of 80 litres/person/day
5 £1,750 5 £4,200 5 £4,200 5 £4,500 Water
Wat 2 Water butts included for block of flats and for houses 1 £0 1 £50 1 £50 1 £50

106
Water Totals 6 £1,750 6 £4,250 6 £4,250 6 £4,550
Mat 1 Assumed 12 zero cost credits (out of 15) 12 £0 12 £0 12 £0 12 £0
Mat 2 Assumed 4 zero cost credits (out of 6) 4 £0 4 £0 4 £0 4 £0 Materials
Mat 3 Assumed 1 zero cost credit (out of 3) 1 £0 1 £0 1 £0 1 £0
Materials Totals 17 £0 17 £0 17 £0 17 £0
Sur 1 Site-wide SUDS system cost of £1,100 split between all dwellings 2 £55.0 2 £55.0 2 £55.0 2 £55.0
Surface Water
Sur 2 Assumed development is in an area of low flood risk 2 £0 2 £0 2 £0 2 £0
Surface Water Totals 4 £55 4 £55 4 £55 4 £55
Was 1 Internal storage for recyclable
waste provided, assumed collection scheme exists
4 £25 4 £25 4 £25 4 £25
Was 2 Assumed maximum credits could be achieved for no extra cost 2 £0 2 £0 2 £0 2 £0
Waste
Was 3 Composting facilities provided 1 £30 1 £50 1 £50 1 £50 Waste Totals 7 £55 7 £75 7 £75 7 £75
Pol 1 Zero cost credit 1 £0 1 £0 1 £0 1 £0 Pollution
Pol 2 Gas CHP meets requirement for 3 credits 3 £0 3 £0 3 £0 3 £0
Pollution Totals 4 £0 4 £0 4 £0 4 £0
Hea 1
Assumed view of sky can be achieved at no E/O cost in all
dwellings and that ADF of >1.5% in living rooms is met by default in
detached house, extra glazing also included
3 £300 3 £300 3 £300 3 £150 Health & Well-Being
Hea 2 Detached house scores maximum credits by default, cost of sound testing in flat, terraced and semi-
4 £250 4 £200 4 £200 4 £0

107
detached houses Hea 3 Assumed zero cost credit 1 £0 1 £0 1 £0 1 £0
Hea 4
Lifetime Homes standards met E/O cost for lift included for flats (assumed lift not standard in this
small development)
4 £650 4 £1,235 4 £1,235 4 £1,235
Health & Well-Being Totals 12 £1,200 12 £1,735 12 £1,735 12 £1,385
Man 1 Home user guide provided,
including information on site and surroundings
3 £25 £3 £25 £3 £25 £3 £25
Man 2 Assumed zero cost credits 2 £0 2 £0 2 £0 2 £0
Man 3 Procedures to cover four items in site management procedures 2 £50 £2 £50 £2 £50 £2 £50
Manage-ment
Man 4
Cost of measures to comply with secured by design principles in
terraced and semi-detached houses
0 £0 0 £0 0 £0 0 £0
Management Totals 7 £75 7 £75 7 £75 7 £75
Eco 1 Brownfield site, 1 credit by default 1 £0 1 £0 1 £0 1 £0 Eco 2 Ecologist employed 1 £150 1 £150 1 £150 1 £150
Eco 3 Credit only achieved if ecologist is employed 1 £0 1 £0 1 £0 1 £0
Eco 4 Cost of increasing number of plant species 4 £15 4 £15 4 £15 4 £15
Ecology
Eco 5 No credits achieved 0 £0 0 £0 0 £0 0 £0 Ecology Totals 7 £165 7 £165 7 £165 7 £165
Total Code Credits 91 91 91 91 Total Percentage Points Score 90 90 90 90
Total Extra Over Cost £28,514 £34,807 £38,732 £42,771

108
Table 58: E/O costs and credits by issue: Strategic development
Strategic Development: Code Level 1 Flat Terraced house Semi-detached Detached
Category Issue Details of measures Credits E/O
Cost Credits E/O Cost Credits E/O
Cost Credits E/O Cost
Ene 1 Good fabric 1 £215 1 £118 1 £186 1 £243
Ene 2 Credits awarded based on HLP achieved with given fabric package 2 £0 1 £0 0 £0 0 £0
Ene 3 >75% of internal light fittings dedicated energy efficient (flat) 2 £30 1 £20 1 £20 0 £0
Ene 4 Internal tidy-dry 1 £15 1 £15 1 £15 1 £15
Ene 5 Information on benefits of
purchasing energy efficient white goods provided
1 £5 1 £5 1 £5 1 £5
Ene 6 One zero cost credit assumed for ensuring all external light fittings
are energy efficient 1 £0 1 £0 1 £0 1 £0
Ene 7 No LZC technologies employed 0 £0 0 £0 0 £0 0 £0 Ene 8 Cycle storage not provided 0 £0 0 £0 0 £0 0 £0
Energy / CO2
Ene 9 Home office fixtures not provided 0 £0 0 £0 0 £0 0 £0 Energy / CO2
Totals 8 £265 6 £158 5 £226 4 £263
Wat 1 Assumed achieving 110 litres/person/day is zero cost 2 £0 2 £0 2 £0 2 £0
Water Wat 2 Water butts included for blocks of
flats 1 £0 0 £0 0 £0 0 £0
Water Totals 3 £0 2 £0 2 £0 2 £0
Mat 1 Assumed 12 zero cost credits (out of 15) 12 £0 12 £0 12 £0 12 £0
Mat 2 Assumed 4 zero cost credits (out of 6) 4 £0 4 £0 4 £0 4 £0 Materials
Mat 3 Assumed 1 zero cost credit (out of 1 £0 1 £0 1 £0 1 £0

109
3) Materials Totals 17 £0 17 £0 17 £0 17 £0
Sur 1 Site-wide SUDS system cost of £1,100 split between all dwellings 2 £0.2 2 £0.2 2 £0.2 2 £0.2
Surface Water
Sur 2 Assumed development is in an area of low flood risk 2 £0 2 £0 2 £0 2 £0
Surface Water Totals 4 £0 4 £0 4 £0 4 £0
Was 1
Internal storage for recyclable waste provided in terraced and
detached houses, assumed collection scheme exists
0 £0 4 £25 4 £25 4 £25
Was 2 Assumed maximum credits could be achieved for no extra cost 2 £0 2 £0 2 £0 2 £0
Waste
Was 3 Composting facilities not provided 0 £0 0 £0 0 £0 0 £0 Waste Totals 2 £0 6 £25 6 £25 6 £25
Pol 1 Zero cost credit 1 £0 1 £0 1 £0 1 £0 Pollution
Pol 2 High efficiency gas boiler meets requirement for 3 credits 3 £0 3 £0 3 £0 3 £0
Pollution Totals 4 £0 4 £0 4 £0 4 £0
Hea 1
Assumed view of sky can be achieved at no E/O cost in all
dwellings and that ADF of >1.5% in living rooms is met by default in
detached house
1 £0 1 £0 1 £0 2 £0
Hea 2 Detached house scores maximum credits by default 0 £0 0 £0 0 £0 4 £0
Hea 3 Assumed zero cost credit 1 £0 1 £0 1 £0 1 £0
Health & Well-Being
Hea 4 Lifetime Homes standards not met 0 £0 0 £0 0 £0 0 £0 Health & Well-Being Totals 2 £0 2 £0 2 £0 7 £0
Manage-ment Man 1 Home user guide provided,
including information on site and 3 £0 £3 £0 £3 £0 £3 £0

110
surroundings Man 2 Assumed zero cost credits 2 £0 2 £0 2 £0 2 £0
Man 3 Procedures to cover four items in site management procedures 2 £0 £2 £0 £2 £0 £2 £0
Man 4 Credits not sought 0 £0 0 £0 0 £0 0 £0 Management
Totals 7 £0 7 £0 7 £0 7 £0
Eco 1 Greenfield site, no credits gained 0 £0 0 £0 0 £0 0 £0 Eco 2 Ecologist not employed 0 £0 0 £0 1 £100 0 £0
Eco 3 Credit only achieved if ecologist is employed 0 £0 0 £0 1 £0 0 £0
Eco 4 Credits only available if ecologist is employed 0 £0 0 £0 4 £15 0 £0
Ecology
Eco 5 No credits achieved 0 £0 0 £0 0 £0 0 £0 Ecology Totals 0 £0 0 £0 6 £115 0 £0
Total Code Credits 47 48 53 51 Total Percentage Points Score 36 36 42 39
Total Extra Over Cost £265 £184 £367 £289

111
Strategic Development: Code Level 2
Flat Terraced house Semi-detached Detached Category Issue Details of measures
Credits E/O Cost Credits E/O
Cost Credits E/O Cost Credits E/O
Cost Ene 1 Better fabric, 0.05kW PV (flats) 2 £1,358 2 £1,292 3 £705 3 £626
Ene 2 Credits awarded based on HLP achieved with given fabric package 2 £0 2 £0 1 £0 1 £0
Ene 3
>75% of internal light fittings dedicated energy efficient (flat, terraced), >40% in semi and
detached houses
2 £30 2 £40 2 £50 1 £20
Ene 4 Internal tidy-dry 1 £15 1 £15 1 £15 1 £15
Ene 5 Information on benefits of
purchasing energy efficient white goods provided
1 £5 1 £5 1 £5 1 £5
Ene 6 One zero cost credit assumed for ensuring all external light fittings
are energy efficient 1 £0 1 £0 1 £0 1 £0
Ene 7 Insufficient contribution from LZC technologies 0 £0 0 £0 0 £0 0 £0
Ene 8 Cycle storage not provided 0 £0 0 £0 0 £0 0 £0
Energy / CO2
Ene 9 Home office fixtures not provided 0 £0 0 £0 0 £0 0 £0 Energy / CO2
Totals 9 £1,408 9 £1,352 9 £775 8 £666
Wat 1 Assumed achieving 110 litres/person/day is zero cost 2 £0 2 £0 2 £0 2 £0
Water Wat 2 Water butts included for blocks of
flats 1 £0 0 £0 0 £0 0 £0
Water Totals 3 £0 2 £0 2 £0 2 £0
Mat 1 Assumed 12 zero cost credits (out of 15) 12 £0 12 £0 12 £0 12 £0 Materials
Mat 2 Assumed 4 zero cost credits (out of 4 £0 4 £0 4 £0 4 £0
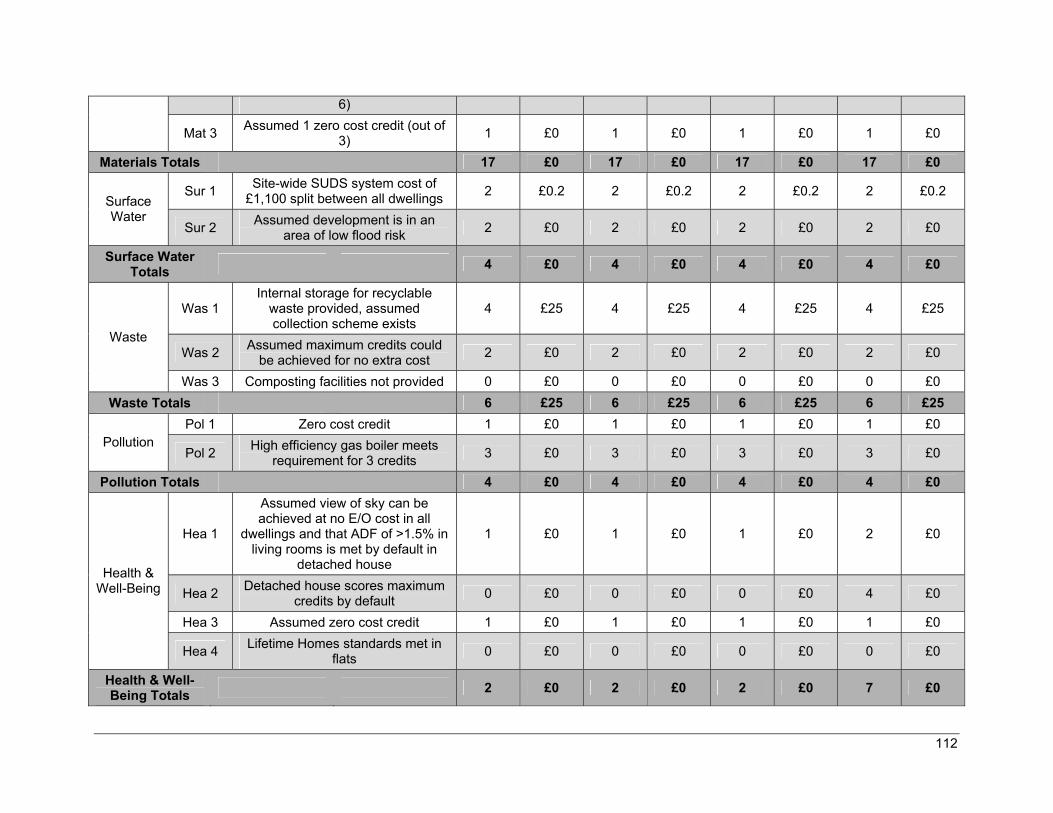
112
6)
Mat 3 Assumed 1 zero cost credit (out of 3) 1 £0 1 £0 1 £0 1 £0
Materials Totals 17 £0 17 £0 17 £0 17 £0
Sur 1 Site-wide SUDS system cost of £1,100 split between all dwellings 2 £0.2 2 £0.2 2 £0.2 2 £0.2
Surface Water
Sur 2 Assumed development is in an area of low flood risk 2 £0 2 £0 2 £0 2 £0
Surface Water Totals 4 £0 4 £0 4 £0 4 £0
Was 1 Internal storage for recyclable
waste provided, assumed collection scheme exists
4 £25 4 £25 4 £25 4 £25
Was 2 Assumed maximum credits could be achieved for no extra cost 2 £0 2 £0 2 £0 2 £0
Waste
Was 3 Composting facilities not provided 0 £0 0 £0 0 £0 0 £0 Waste Totals 6 £25 6 £25 6 £25 6 £25
Pol 1 Zero cost credit 1 £0 1 £0 1 £0 1 £0 Pollution
Pol 2 High efficiency gas boiler meets requirement for 3 credits 3 £0 3 £0 3 £0 3 £0
Pollution Totals 4 £0 4 £0 4 £0 4 £0
Hea 1
Assumed view of sky can be achieved at no E/O cost in all
dwellings and that ADF of >1.5% in living rooms is met by default in
detached house
1 £0 1 £0 1 £0 2 £0
Hea 2 Detached house scores maximum credits by default 0 £0 0 £0 0 £0 4 £0
Hea 3 Assumed zero cost credit 1 £0 1 £0 1 £0 1 £0
Health & Well-Being
Hea 4 Lifetime Homes standards met in flats 0 £0 0 £0 0 £0 0 £0
Health & Well-Being Totals 2 £0 2 £0 2 £0 7 £0

113
Man 1 Home user guide provided,
including information on site and surroundings
3 £0 £3 £0 £3 £0 £3 £0
Man 2 Assumed zero cost credits 2 £0 2 £0 2 £0 2 £0
Man 3 Procedures to cover four items in site management procedures 2 £0 £2 £0 £2 £0 £2 £0
Manage-ment
Man 4 Credits not sought 0 £0 0 £0 0 £0 0 £0 Management
Totals 7 £0 7 £0 7 £0 7 £0
Eco 1 Greenfield site, no credits gained 0 £0 0 £0 0 £0 0 £0 Eco 2 Ecologist employed 1 £100 1 £100 1 £100 1 £100
Eco 3 Credit only achieved if ecologist is employed 1 £0 1 £0 1 £0 1 £0
Eco 4 Cost of increasing number of plant species 4 £15 4 £15 4 £15 4 £15
Ecology
Eco 5 No credits achieved 0 £0 0 £0 0 £0 0 £0 Ecology Totals 6 £115 6 £115 6 £115 6 £115
Total Code Credits 58 57 57 61 Total Percentage Points Score 49 47 47 52
Total Extra Over Cost £1,549 £1,493 £916 £807

114
Strategic Development: Code Level 3
Flat Terraced house Semi-detached Detached Category Issue Details of measures
Credits E/O Cost Credits E/O
Cost Credits E/O Cost Credits E/O
Cost Ene 1 Good fabric, ASHP21 5 £1,323 5 £1,150 5 £1,739 6 £1,796
Ene 2 Credits awarded based on HLP achieved with given fabric package 2 £0 1 £0 0 £0 0 £0
Ene 3 >75% of internal light fittings dedicated energy efficient 2 £30 2 £40 2 £50 2 £60
Ene 4 Internal tidy-dry 1 £15 1 £15 1 £15 1 £15
Ene 5 Information on benefits of
purchasing energy efficient white goods provided
1 £5 1 £5 1 £5 1 £5
Ene 6
One zero cost credit assumed for ensuring all external light fittings are energy efficient, E/O cost for
sensors, timers etc
2 £45 2 £45 2 £45 1 £0
Ene 7 No credits achieved 0 £0 0 £0 0 £0 0 £0 Ene 8 Cycle storage not provided 0 £0 0 £0 0 £0 0 £0
Energy / CO2
Ene 9 Home office fixtures not provided 0 £0 0 £0 0 £0 0 £0 Energy / CO2
Totals 13 £1,418 12 £1,255 11 £1,854 11 £1,876
Wat 1 Cost of low flow fittings etc to achieve 105 litres/person/day 3 £200 3 £200 3 £200 3 £240
Water Wat 2 Water butts included for blocks of
flats and for houses 1 £0 1 £50 1 £50 1 £50
Water Totals 4 £200 4 £250 4 £250 4 £290
Materials Mat 1 Assumed 12 zero cost credits (out of 15) 12 £0 12 £0 12 £0 12 £0
21 Note that the E/O cost of this house-by-house Ene1 option differs slightly from the results for the small brownfield development. This is due to different offset benefits for avoiding the need for a gas connection between brownfield and greenfield sites.

115
Mat 2 Assumed 4 zero cost credits (out of 6) 4 £0 4 £0 4 £0 4 £0
Mat 3 Assumed 1 zero cost credit (out of 3) 1 £0 1 £0 1 £0 1 £0
Materials Totals 17 £0 17 £0 17 £0 17 £0
Sur 1 Site-wide SUDS system cost of £1,100 split between all dwellings 2 £0.2 2 £0.2 2 £0.2 2 £0.2
Surface Water
Sur 2 Assumed development is in an area of low flood risk 2 £0 2 £0 2 £0 2 £0
Surface Water Totals 4 £0 4 £0 4 £0 4 £0
Was 1 Internal storage for recyclable
waste provided, assumed collection scheme exists
4 £25 4 £25 4 £25 4 £25
Was 2 Assumed maximum credits could be achieved for no extra cost 2 £0 2 £0 2 £0 2 £0
Waste
Was 3 Composting facilities not provided 1 £30 0 £0 0 £0 0 £0 Waste Totals 7 £55 6 £25 6 £25 6 £25
Pol 1 Zero cost credit 1 £0 1 £0 1 £0 1 £0 Pollution
Pol 2 ASHP is electrically powered, credits not achieved 0 £0 0 £0 0 £0 0 £0
Pollution Totals 1 £0 1 £0 1 £0 1 £0
Hea 1
Assumed view of sky can be achieved at no E/O cost in all
dwellings and that ADF of >1.5% in living rooms is met by default in detached house extra glazing included in terraced and semi
3 £300 3 £300 3 £300 2 £0
Hea 2 Detached house scores maximum credits by default, cost of sound
testing in terraced and semi 0 £0 3 £100 3 £100 4 £0
Hea 3 Assumed zero cost credit 1 £0 1 £0 1 £0 1 £0
Health & Well-Being
Hea 4 Lifetime Homes standards met in flats 0 £0 0 £0 0 £0 0 £0

116
Health & Well-Being Totals 4 £300 7 £400 7 £400 7 £0
Man 1 Home user guide provided,
including information on site and surroundings
3 £0 £3 £0 £3 £0 £3 £0
Man 2 Assumed zero cost credits 2 £0 2 £0 2 £0 2 £0
Man 3 Procedures to cover four items in site management procedures 2 £0 £2 £0 £2 £0 £2 £0
Manage-ment
Man 4 Credits not sought 0 £0 0 £0 0 £0 0 £0 Management
Totals 7 £0 7 £0 7 £0 7 £0
Eco 1 Greenfield site, no credits gained 0 £0 0 £0 0 £0 0 £0 Eco 2 Ecologist employed 1 £100 1 £100 1 £100 1 £100
Eco 3 Credit only achieved if ecologist is employed 1 £0 1 £0 1 £0 1 £0
Eco 4 Cost of increasing number of plant species 4 £15 4 £15 4 £15 4 £15
Ecology
Eco 5 No credits achieved 0 £0 0 £0 0 £0 0 £0 Ecology Totals 6 £115 6 £115 6 £115 6 £115
Total Code Credits 63 64 63 63 Total Percentage Points Score 57 58 57 57
Total Extra Over Cost £2,088 £2,046 £2,645 £2,307

117
Strategic Development: Code Level 4
Flat Terraced house Semi-detached Detached Category Issue Details of measures
Credits E/O Cost Credits E/O
Cost Credits E/O Cost Credits E/O
Cost
Ene 1 Better fabric, ASHP, PV for flats
(0.4kW), terraced (0.35kW), semi(0.25kW)
8 £4,266 8 £5,888 8 £6,512 8 £4,619
Ene 2 Credits awarded based on HLP achieved with given fabric package 2 £0 2 £0 2 £0 1 £0
Ene 3 >75% of internal light fittings dedicated energy efficient 2 £30 2 £40 2 £50 2 £60
Ene 4 Internal tidy-dry 1 £15 1 £15 1 £15 1 £15
Ene 5 Information on benefits of
purchasing energy efficient white goods provided
1 £5 2 £150 2 £150 2 £150
Ene 6 Cost of sensors, timers etc for external lighting 2 £45 2 £45 2 £45 2 £45
Ene 7 Credits based on CO2 reduction due to LZC technologies, cost
included in Ene 1 2 £0 1 £0 0 £0 0 £0
Ene 8 Cycle storage not provided 0 £0 0 £0 0 £0 0 £0
Energy / CO2
Ene 9 Home office fixtures not provided 0 £0 0 £0 1 £80 1 £80 Energy / CO2
Totals 18 £4,361 18 £6,138 18 £6,852 17 £4,969
Wat 1 Cost of low flow fittings etc to achieve 105 litres/person/day 3 £200 3 £200 3 £200 3 £240
Water Wat 2 Water butts included for blocks of
flats and for houses 1 £0 1 £50 1 £50 1 £50
Water Totals 4 £200 4 £250 4 £250 4 £290
Mat 1 Assumed 12 zero cost credits (out of 15) 12 £0 12 £0 12 £0 12 £0 Materials
Mat 2 Assumed 4 zero cost credits (out of 4 £0 4 £0 4 £0 4 £0

118
6)
Mat 3 Assumed 1 zero cost credit (out of 3) 1 £0 1 £0 1 £0 1 £0
Materials Totals 17 £0 17 £0 17 £0 17 £0
Sur 1 Site-wide SUDS system cost of £1,100 split between all dwellings 2 £0.2 2 £0.2 2 £0.2 2 £0.2
Surface Water
Sur 2 Assumed development is in an area of low flood risk 2 £0 2 £0 2 £0 2 £0
Surface Water Totals 4 £0 4 £0 4 £0 4 £0
Was 1 Internal storage for recyclable
waste provided, assumed collection scheme exists
4 £25 4 £25 4 £25 4 £25
Was 2 Assumed maximum credits could be achieved for no extra cost 2 £0 2 £0 2 £0 2 £0 Waste
Was 3 Composting facilities provided (flats) 1 £30 1 £50 1 £50 1 £50
Waste Totals 7 £55 7 £75 7 £75 7 £75 Pol 1 Zero cost credit 1 £0 1 £0 1 £0 1 £0
Pollution Pol 2 ASHP is electrically powered,
credits not achieved 0 £0 0 £0 0 £0 0 £0
Pollution Totals 1 £0 1 £0 1 £0 1 £0
Hea 1
Assumed view of sky can be achieved at no E/O cost in all
dwellings and that ADF of >1.5% in living rooms is met by default in
detached house extra glazing also included
3 £300 3 £300 3 £300 3 £150
Hea 2 Detached house scores maximum credits by default, cost of sound
testing in terraced and semi 4 £250 4 £200 4 £200 4 £0
Hea 3 Assumed zero cost credit 1 £0 1 £0 1 £0 1 £0
Health & Well-Being
Hea 4 Lifetime Homes standards met in flat, semi and detached houses 0 £0 0 £0 0 £0 4 £1,235

119
Health & Well-Being Totals 8 £550 8 £500 8 £500 12 £1,385
Man 1 Home user guide provided,
including information on site and surroundings
3 £0 £3 £0 £3 £0 £3 £0
Man 2 Assumed zero cost credits 2 £0 2 £0 2 £0 2 £0
Man 3 Procedures to cover four items in site management procedures 2 £0 £2 £0 £2 £0 £2 £0
Manage-ment
Man 4 Cost of measures to meet secured by design principles in terraced and
semi-detached houses 0 £0 0 £0 0 £0 0 £0
Management Totals 7 £0 7 £0 7 £0 7 £0
Eco 1 Greenfield site, no credits gained 0 £0 0 £0 0 £0 0 £0 Eco 2 Ecologist employed 1 £100 1 £100 1 £100 1 £100
Eco 3 Credit only achieved if ecologist is employed 1 £0 1 £0 1 £0 1 £0
Eco 4 Cost of increasing number of plant species 4 £15 4 £15 4 £15 4 £15
Ecology
Eco 5 No credits achieved 0 £0 0 £0 0 £0 0 £0 Ecology Totals 6 £115 6 £115 6 £115 6 £115
Total Code Credits 72 72 72 75 Total Percentage Points Score 68 68 68 71
Total Extra Over Cost £5,281 £7,079 £7,793 £6,835

120
Strategic Development: Code Level 5
Flat Terraced house Semi-detached Detached Category Issue Details of measures
Credits E/O Cost Credits E/O
Cost Credits E/O Cost Credits E/O
Cost
Ene 1
Best fabric, MVHR, BM block heating (flats), BM boilers
(houses), PV (0.75kW, 1.05kW, 1.25kW, 1.6kW)
14 £13,593 14 £20,459 14 £22,742 14 £25,722
Ene 2 Credits awarded based on HLP achieved with given fabric package 2 £0 2 £0 2 £0 2 £0
Ene 3 >75% of internal light fittings dedicated energy efficient 2 £30 2 £40 2 £50 2 £60
Ene 4 Internal tidy-dry 1 £15 1 £15 1 £15 1 £15
Ene 5 Information on benefits of
purchasing energy efficient white goods provided
2 £150 2 £150 2 £150 2 £150
Ene 6 Cost of sensors, timers etc for external lighting 2 £45 2 £45 2 £45 2 £45
Ene 7 Credits based on CO2 reduction due to LZC technologies, cost
included in Ene 1 2 £0 2 £0 2 £0 2 £0
Ene 8 Cycle storage not provided 2 £200 2 £650 2 £650 0 £0
Energy / CO2
Ene 9 Home office fixtures not provided 1 £80 1 £80 1 £80 1 £80 Energy / CO2
Totals 28 £14,113 28 £21,439 28 £23,732 26 £26,072
Wat 1 Low flow fittings and greywater
recycling to achieve consumption of 80 litres/person/day
5 £1,750 5 £4,200 5 £4,200 5 £4,500 Water
Wat 2 Water butts included for blocks of flats and for houses 1 £0 1 £50 1 £50 1 £50
Water Totals 6 £1,750 6 £4,250 6 £4,250 6 £4,550
Materials Mat 1 Assumed 12 zero cost credits (out of 15) 12 £0 12 £0 12 £0 12 £0

121
Mat 2 Assumed 4 zero cost credits (out of 6) 4 £0 4 £0 4 £0 4 £0
Mat 3 Assumed 1 zero cost credit (out of 3) 1 £0 1 £0 1 £0 1 £0
Materials Totals 17 £0 17 £0 17 £0 17 £0
Sur 1 Site-wide SUDS system cost of £1,100 split between all dwellings 2 £0.2 2 £0.2 2 £0.2 2 £0.2
Surface Water
Sur 2 Assumed development is in an area of low flood risk 2 £0 2 £0 2 £0 2 £0
Surface Water Totals 4 £0 4 £0 4 £0 4 £0
Was 1 Internal storage for recyclable
waste provided, assumed collection scheme exists
4 £25 4 £25 4 £25 4 £25
Was 2 Assumed maximum credits could be achieved for no extra cost 2 £0 2 £0 2 £0 2 £0 Waste
Was 3 Composting facilities provided (flats and detached houses) 1 £30 1 £50 1 £50 1 £50
Waste Totals 7 £55 7 £75 7 £75 7 £75 Pol 1 Zero cost credit 1 £0 1 £0 1 £0 1 £0
Pollution Pol 2 NOx emissions too high to achieve
credits with biomass heating 0 £0 0 £0 0 £0 0 £0
Pollution Totals 1 £0 1 £0 1 £0 1 £0
Hea 1
Assumed view of sky can be achieved at no E/O cost in all
dwellings and that ADF of >1.5% in living rooms is met by default in
detached house extra glazing also included
3 £300 3 £300 3 £300 3 £150
Hea 2 Detached house scores maximum credits by default, cost of sound
testing in other dwellings 4 £250 4 £200 4 £200 4 £0
Hea 3 Assumed zero cost credit 1 £0 1 £0 1 £0 1 £0
Health & Well-Being
Hea 4 Lifetime Homes standards met 4 £650 0 £0 0 £0 4 £1,235

122
Health & Well-Being Totals 12 £1,200 8 £500 8 £500 12 £1,385
Man 1 Home user guide provided,
including information on site and surroundings
3 £0 £3 £0 £3 £0 £3 £0
Man 2 Assumed zero cost credits 2 £0 2 £0 2 £0 2 £0
Man 3 Procedures to cover four items in site management procedures 2 £0 £2 £0 £2 £0 £2 £0
Manage-ment
Man 4 Cost of measures to meet secured by design principles in terraced and
semi-detached houses 0 £0 2 £515 2 £515 0 £0
Management Totals 7 £0 9 £515 9 £515 7 £0
Eco 1 Greenfield site, no credits gained 0 £0 0 £0 0 £0 0 £0 Eco 2 Ecologist employed 1 £100 1 £100 1 £100 1 £100
Eco 3 Credit only achieved if ecologist is employed 1 £0 1 £0 1 £0 1 £0
Eco 4 Cost of increasing number of plant species 4 £15 4 £15 4 £15 4 £15
Ecology
Eco 5 No credits achieved 0 £0 0 £0 0 £0 0 £0 Ecology Totals 6 £115 6 £115 6 £115 6 £115
Total Code Credits 88 86 86 86 Total Percentage Points Score 88 85 85 85
Total Extra Over Cost £17,234 £26,895 £29,187 £32,197

123
Strategic Development: Code Level 6
Flat Terraced house Semi-detached Detached Category Issue Details of measures
Credits E/O Cost Credits E/O
Cost Credits E/O Cost Credits E/O
Cost
Ene 1 Best fabric, MVHR, BM CHP, PV (2.2kW, 2.45kW, 2.65kW, 3.1kW) 15 £23,375 15 £26,655 15 £29,054 15 £32,532
Ene 2 Credits awarded based on HLP achieved with given fabric package 2 £0 2 £0 2 £0 2 £0
Ene 3 >75% of internal light fittings dedicated energy efficient 2 £30 2 £40 2 £50 2 £60
Ene 4 Internal tidy-dry 1 £15 1 £15 1 £15 1 £15
Ene 5 Energy efficient white goods provided 2 £150 2 £150 2 £150 2 £150
Ene 6 Cost of sensors, timers etc for external lighting 2 £45 2 £45 2 £45 2 £45
Ene 7 Credits based on CO2 reduction due to LZC technologies, cost
included in Ene 1 2 £0 2 £0 2 £0 2 £0
Ene 8 Cycle storage provided 2 £200 2 £650 2 £650 2 £900
Energy / CO2
Ene 9 Home office fixtures included 1 £80 1 £80 1 £80 1 £80 Energy / CO2
Totals 29 £23,895 29 £27,635 29 £30,044 29 £33,782
Wat 1 Low flow fittings and greywater
recycling to achieve consumption of 80 litres/person/day
5 £1,750 5 £4,200 5 £4,200 5 £4,500 Water
Wat 2 Water butts included for blocks of flats and for houses 1 £0 1 £50 1 £50 1 £50
Water Totals 6 £1,750 6 £4,250 6 £4,250 6 £4,550
Mat 1 Assumed 12 zero cost credits (out of 15) 12 £0 12 £0 12 £0 12 £0 Materials
Mat 2 Assumed 4 zero cost credits (out of 6) 4 £0 4 £0 4 £0 4 £0

124
Mat 3 Assumed 1 zero cost credit (out of 3) 1 £0 1 £0 1 £0 1 £0
Materials Totals 17 £0 17 £0 17 £0 17 £0
Sur 1 Site-wide SUDS system cost of £1,100 split between all dwellings 2 £0.2 2 £0.2 2 £0.2 2 £0.2
Surface Water
Sur 2 Assumed development is in an area of low flood risk 2 £0 2 £0 2 £0 2 £0
Surface Water Totals 4 £0 4 £0 4 £0 4 £0
Was 1 Internal storage for recyclable
waste provided, assumed collection scheme exists
4 £25 4 £25 4 £25 4 £25
Was 2 Assumed maximum credits could be achieved for no extra cost 2 £0 2 £0 2 £0 2 £0 Waste
Was 3 Composting facilities provided (flats and detached houses) 1 £30 1 £50 1 £50 1 £50
Waste Totals 7 £55 7 £75 7 £75 7 £75 Pol 1 Zero cost credit 1 £0 1 £0 1 £0 1 £0
Pollution Pol 2 NOx emissions too high to achieve
credits with biomass as main fuel 0 £0 0 £0 0 £0 0 £0
Pollution Totals 1 £0 1 £0 1 £0 1 £0
Hea 1
Assumed view of sky can be achieved at no E/O cost in all
dwellings and that ADF of >1.5% in living rooms is met by default in
detached house extra glazing also included
3 £300 3 £300 3 £300 3 £150
Hea 2 Detached house scores maximum credits by default, cost of sound
testing in other dwellings 4 £250 4 £200 4 £200 4 £0
Hea 3 Assumed zero cost credit 1 £0 1 £0 1 £0 1 £0
Health & Well-Being
Hea 4 Lifetime Homes standards met 4 £650 4 £1,235 4 £1,235 4 £1,235 Health & Well-Being Totals 12 £1,200 12 £1,735 12 £1,735 12 £1,385

125
Man 1 Home user guide provided,
including information on site and surroundings
3 £0 £3 £0 £3 £0 £3 £0
Man 2 Assumed zero cost credits 2 £0 2 £0 2 £0 2 £0
Man 3 Procedures to cover four items in site management procedures 2 £0 £2 £0 £2 £0 £2 £0
Manage-ment
Man 4 Cost of measures to meet secured by design principles 2 £450 2 £515 2 £515 2 £650
Management Totals 9 £450 9 £515 9 £515 9 £650
Eco 1 Greenfield site, no credits gained 0 £0 0 £0 0 £0 0 £0 Eco 2 Ecologist employed 1 £100 1 £100 1 £100 1 £100
Eco 3 Credit only achieved if ecologist is employed 1 £0 1 £0 1 £0 1 £0
Eco 4 Cost of increasing number of plant species 4 £15 4 £15 4 £15 4 £15
Ecology
Eco 5 No credits achieved 0 £0 0 £0 0 £0 0 £0 Ecology Totals 6 £115 6 £115 6 £115 6 £115
Total Code Credits 91 91 91 91 Total Percentage Points Score 91 91 91 91
Total Extra Over Cost £27,465 £34,325 £36,735 £40,558

126
Table 59: E/O cost (in 2009) as £/m2 of floor area and as a percentage of baseline build costs (cost of building dwelling to Part L 2006): Small Brownfield
Flat Terraced house Semi-detached house Detached house E/O cost E/O cost E/O cost E/O cost
Code Level
(£) (£/m2) %
(£) (£/m2) %
(£) (£/m2) %
(£) (£/m2) %
Minimum cost options (based on E/O cost for whole development) 1 £315 £5 0.5% £228 £3 0% £356 £4 0% £313 £3 0.3% 2 £1,673 £27 3% £1,617 £22 2% £1,040 £12 1% £971 £8 1% 3 £2,463 £40 4% £2,420 £33 3% £3,019 £34 3% £2,681 £23 3% 4 £5,611 £92 9% £7,363 £101 9% £8,142 £93 9% £6,029 £51 6% 5 £17,739 £291 30% £24,372 £334 28% £26,825 £305 29% £30,128 £255 30% 6 £28,514 £467 48% £34,807 £477 40% £38,732 £440 41% £42,771 £362 43%
Maximum cost (based on E/O cost for whole development) 1 £315 £5 0.5% £228 £3 0% £356 £4 0% £313 £3 0.3% 2 £1,673 £27 3% £1,617 £22 2% £1,040 £12 1% £971 £8 1% 3 £6,737 £110 11% £7,520 £103 9% £9,277 £105 10% £3,651 £31 4% 4 £11,508 £189 19% £16,365 £224 19% £17,922 £204 19% £19,219 £163 19% 5 £17,013 £279 28% £26,674 £365 31% £28,967 £329 31% £32,627 £276 33% 6 £27,562 £452 46% £37,109 £508 43% £40,506 £460 43% £44,685 £379 45%

127
Table 60: E/O cost (in 2009) as £/m2 of floor area and as a percentage of baseline build costs (cost of building dwelling to Part L 2006): City Infill
Flat Terraced house Semi-detached house Detached house E/O cost E/O cost E/O cost E/O cost
Code Level
(£) (£/m2) %
(£) (£/m2) %
(£) (£/m2) %
(£) (£/m2) %
Minimum cost options (based on E/O cost for whole development) 1 £290 £5 0.5% - - - - - - - - - 2 £1,773 £29 3% - - - - - - - - - 3 £2,763 £45 5% - - - - - - - - - 4 £5,888 £97 10% - - - - - - - - - 5 £16,134 £264 27% - - - - - - - - - 6 £26,909 £441 45% - - - - - - - - -
Maximum cost (based on E/O cost for whole development) 1 £290 £5 0.5% - - - - - - - - - 2 £1,773 £29 3% - - - - - - - - - 3 £7,062 £116 12% - - - - - - - - - 4 £11,658 £191 20% - - - - - - - - - 5 £17,308 £284 29% - - - - - - - - - 6 £27,857 £457 47% - - - - - - - - -

128
Table 61: E/O cost (in 2009) as £/m2 of floor area and as a percentage of baseline build costs (cost of building dwelling to Part L 2006): Medium Urban (mixed)
Flat Terraced house Semi-detached house Detached house E/O cost E/O cost E/O cost E/O cost
Code Level
(£) (£/m2) %
(£) (£/m2) %
(£) (£/m2) %
(£) (£/m2) %
Minimum cost options (based on E/O cost for whole development) 1 £257 £4 0.4% £170 £2 0% £258 £3 0% £270 £2 0.3% 2 £1,555 £25 3% £1,499 £21 2% £892 £10 1% £813 £7 1% 3 £2,345 £38 4% £2,002 £27 2% £2,901 £33 3% £2,513 £21 3% 4 £5,438 £89 9% £7,190 £98 8% £7,969 £91 9% £5,856 £50 6% 5 £17,567 £288 29% £24,200 £332 28% £26,653 £303 29% £29,955 £254 30% 6 £19,580 £321 33% £26,550 £364 31% £28,392 £323 30% £31,232 £265 31%
Maximum cost (based on E/O cost for whole development) 1 £257 £4 0.4% £170 £2 0% £258 £3 0% £270 £2 0.3% 2 £1,555 £25 3% £1,499 £21 2% £892 £10 1% £813 £7 1% 3 £6,574 £108 11% £7,352 £101 9% £9,059 £103 10% £3,493 £30 3% 4 £11,241 £184 19% £15,947 £218 18% £17,504 £199 19% £19,051 £161 19% 5 £16,840 £276 28% £26,501 £363 31% £28,794 £327 31% £32,454 £275 32% 6 £27,390 £449 46% £36,936 £506 43% £40,333 £458 43% £44,512 £377 45%

129
Table 62: E/O cost (in 2009) as £/m2 of floor area and as a percentage of baseline build costs (cost of building dwelling to Part L 2006): Medium Urban (flats)
Flat Terraced house Semi-detached house Detached house E/O cost E/O cost E/O cost E/O cost
Code Level
(£) (£/m2) %
(£) (£/m2) %
(£) (£/m2) %
(£) (£/m2) %
Minimum cost options (based on E/O cost for whole development) 1 £236 £4 0.4% - - - - - - - - - 2 £1,555 £25 3% - - - - - - - - - 3 £2,174 £36 4% - - - - - - - - - 4 £5,299 £87 9% - - - - - - - - - 5 £15,616 £256 26% - - - - - - - - - 6 £17,654 £289 30% - - - - - - - - -
Maximum cost (based on E/O cost for whole development) 1 £236 £4 0.4% - - - - - - - - - 2 £1,555 £25 3% - - - - - - - - - 3 £6,544 £107 11% - - - - - - - - - 4 £11,115 £182 19% - - - - - - - - - 5 £16,815 £276 28% - - - - - - - - - 6 £27,364 £449 46% - - - - - - - - -

130
Table 63: E/O cost (in 2009) as £/m2 of floor area and as a percentage of baseline build costs (cost of building dwelling to Part L 2006): Large Urban (mixed)
Flat Terraced house Semi-detached house Detached house E/O cost E/O cost E/O cost E/O cost
Code Level
(£) (£/m2) %
(£) (£/m2) %
(£) (£/m2) %
(£) (£/m2) %
Minimum cost (based on E/O cost for whole development) 1 £250 £4 0.4% £164 £2 0% £252 £3 0% £264 £2 0.3% 2 £1,549 £25 3% £1,493 £20 2% £886 £10 1% £807 £7 1% 3 £2,338 £38 4% £1,996 £27 2% £2,895 £33 3% £2,507 £21 3% 4 £6,363 £104 11% £6,205 £85 7% £6,581 £75 7% £6,467 £55 6% 5 £16,640 £273 28% £23,212 £318 27% £25,583 £291 27% £28,794 £244 29% 6 £23,212 £381 39% £29,919 £410 35% £32,392 £368 35% £36,035 £305 36%
Maximum cost (based on E/O cost for whole development) 1 £250 £4 0.4% £164 £2 0% £252 £3 0% £264 £2 0.3% 2 £1,549 £25 3% £1,493 £20 2% £886 £10 1% £807 £7 1% 3 £6,568 £108 11% £7,346 £101 8% £9,052 £103 10% £3,487 £30 3% 4 £11,234 £184 19% £15,941 £218 18% £17,497 £199 19% £19,044 £161 19% 5 £16,834 £276 28% £26,495 £363 31% £28,787 £327 31% £32,447 £275 32% 6 £27,383 £449 46% £36,930 £506 43% £40,326 £458 43% £44,505 £377 45%

131
Table 64: E/O cost (in 2009) as £/m2 of floor area and as a percentage of baseline build costs (cost of building dwelling to Part L 2006): Large Urban (flats)
Flat Terraced house Semi-detached house Detached house E/O cost E/O cost E/O cost E/O cost
Code Level
(£) (£/m2) %
(£) (£/m2) %
(£) (£/m2) %
(£) (£/m2) %
Minimum cost (based on E/O cost for whole development) 1 £230 £4 0.4% - - - - - - - - - 2 £1,549 £25 3% - - - - - - - - - 3 £2,168 £36 4% - - - - - - - - - 4 £4,293 £70 7% - - - - - - - - - 5 £14,690 £241 25% - - - - - - - - - 6 £21,287 £349 36% - - - - - - - - -
Maximum cost (based on E/O cost for whole development) 1 £230 £4 0.4% - - - - - - - - - 2 £1,549 £25 3% - - - - - - - - - 3 £6,538 £107 11% - - - - - - - - - 4 £11,109 £182 19% - - - - - - - - - 5 £16,809 £276 28% - - - - - - - - - 6 £27,358 £448 46% - - - - - - - - -

132
Table 65: E/O cost (in 2009) as £/m2 of floor area and as a percentage of baseline build costs (cost of building dwelling to Part L 2006): Small Infill
Flat Terraced house Semi-detached house Detached house E/O cost E/O cost E/O cost E/O cost
Code Level
(£) (£/m2) %
(£) (£/m2) %
(£) (£/m2) %
(£) (£/m2) %
Minimum cost (based on E/O cost for whole development) 1 - - - £353 £5 0% £431 £5 0% £288 £2 0.3% 2 - - - £1,837 £25 2% £1,260 £14 1% £1,091 £9 1% 3 - - - £2,295 £31 3% £2,994 £34 3% £2,651 £22 3% 4 - - - £7,408 £101 9% £8,152 £93 9% £7,194 £61 7% 5 - - - £27,254 £373 32% £29,547 £336 32% £32,557 £276 33% 6 - - - £37,689 £516 44% £41,086 £467 44% £45,515 £386 46%
Maximum cost (based on E/O cost for whole development) 1 - - - £353 £5 0% £431 £5 0% £288 £2 0.3% 2 - - - £1,837 £25 2% £1,260 £14 1% £1,091 £9 1% 3 - - - £7,590 £104 9% £9,397 £107 10% £3,771 £32 4% 4 - - - £16,240 £222 19% £17,797 £202 19% £19,189 £163 19% 5 - - - £29,117 £399 34% £31,570 £359 34% £35,593 £302 36% 6 - - - £39,552 £542 46% £43,477 £494 47% £47,651 £404 48%

133
Table 66: E/O cost (in 2009) as £/m2 of floor area and as a percentage of baseline build costs (cost of building dwelling to Part L 2006): Small Greenfield
Flat Terraced house Semi-detached house Detached house E/O cost E/O cost E/O cost E/O cost
Code Level
(£) (£/m2) %
(£) (£/m2) %
(£) (£/m2) %
(£) (£/m2) %
Minimum cost (based on E/O cost for whole development) 1 £320 £5 0.5% £233 £3 0% £333 £4 0% £318 £3 0.3% 2 £1,620 £27 3% £1,564 £21 2% £987 £11 1% £878 £7 1% 3 £2,160 £35 4% £2,117 £29 2% £2,716 £31 3% £2,378 £20 2% 4 £5,353 £88 9% £7,150 £98 8% £7,864 £89 8% £6,906 £59 7% 5 £17,305 £284 29% £26,966 £369 31% £29,259 £332 31% £32,269 £273 32% 6 £27,654 £453 46% £37,401 £512 43% £40,798 £464 44% £45,227 £383 45%
Maximum cost (based on E/O cost for whole development) 1 £320 £5 0.5% £233 £3 0% £333 £4 0% £318 £3 0.3% 2 £1,620 £27 3% £1,564 £21 2% £987 £11 1% £878 £7 1% 3 £6,984 £114 12% £7,467 £102 9% £9,224 £105 10% £3,598 £30 4% 4 £11,205 £184 19% £16,062 £220 19% £17,619 £200 19% £18,916 £160 19% 5 £21,781 £357 36% £28,829 £395 33% £31,282 £355 34% £35,305 £299 35% 6 £32,556 £534 55% £39,264 £538 45% £43,189 £491 46% £47,363 £401 47%

134
Table 67: E/O cost (in 2009) as £/m2 of floor area and as a percentage of baseline build costs (cost of building dwelling to Part L 2006): Small Edge of Town
Flat Terraced house Semi-detached house Detached house E/O cost E/O cost E/O cost E/O cost
Code Level
(£) (£/m2) %
(£) (£/m2) %
(£) (£/m2) %
(£) (£/m2) %
Minimum cost (based on E/O cost for whole development) 1 - - - £353 £5 0% £431 £5 0% £288 £2 0.3% 2 - - - £1,837 £25 2% £1,260 £14 1% £1,091 £9 1% 3 - - - £2,295 £31 3% £2,994 £34 3% £2,651 £22 3% 4 - - - £7,408 £101 9% £8,152 £93 9% £7,194 £61 7% 5 - - - £27,254 £373 32% £29,547 £336 32% £32,557 £276 33% 6 - - - £37,689 £516 44% £41,086 £467 44% £45,515 £386 46%
Maximum cost (based on E/O cost for whole development) 1 - - - £353 £5 0% £431 £5 0% £288 £2 0.3% 2 - - - £1,837 £25 2% £1,260 £14 1% £1,091 £9 1% 3 - - - £7,590 £104 9% £9,397 £107 10% £3,771 £32 4% 4 - - - £16,240 £222 19% £17,797 £202 19% £19,189 £163 19% 5 - - - £29,117 £399 34% £31,570 £359 34% £35,593 £302 36% 6 - - - £39,552 £542 46% £43,477 £494 47% £47,651 £404 48%

135
Table 68: E/O cost (in 2009) as £/m2 of floor area and as a percentage of baseline build costs (cost of building dwelling to Part L 2006): Medium Edge of Town
Flat Terraced house Semi-detached house Detached house E/O cost E/O cost E/O cost E/O cost
Code Level
(£) (£/m2) %
(£) (£/m2) %
(£) (£/m2) %
(£) (£/m2) %
Minimum cost (based on E/O cost for whole development) 1 £269 £4 0.4% £187 £3 0% £370 £4 0% £292 £2 0.3% 2 £1,552 £25 3% £1,496 £20 2% £919 £10 1% £810 £7 1% 3 £2,092 £34 4% £2,049 £28 2% £2,648 £30 3% £2,310 £20 2% 4 £5,285 £87 9% £7,082 £97 8% £7,796 £89 8% £6,838 £58 7% 5 £17,237 £283 29% £26,898 £368 31% £29,191 £332 31% £32,201 £273 32% 6 £24,076 £395 40% £31,247 £428 36% £33,089 £376 35% £36,179 £307 36%
Maximum cost (based on E/O cost for whole development) 1 £269 £4 0.4% £187 £3 0% £370 £4 0% £292 £2 0.3% 2 £1,552 £25 3% £1,496 £20 2% £919 £10 1% £810 £7 1% 3 £6,916 £113 12% £7,399 £101 9% £9,156 £104 10% £3,530 £30 4% 4 £11,137 £183 19% £15,994 £219 18% £17,551 £199 19% £18,848 £160 19% 5 £20,793 £341 35% £27,780 £381 32% £30,151 £343 32% £34,083 £289 34% 6 £31,568 £518 53% £38,215 £523 44% £42,058 £478 45% £46,141 £391 46%

136
Table 69: E/O cost (in 2009) as £/m2 of floor area and as a percentage of baseline build costs (cost of building dwelling to Part L 2006): Large Edge of Town
Flat Terraced house Semi-detached house Detached house E/O cost E/O cost E/O cost E/O cost
Code Level
(£) (£/m2) %
(£) (£/m2) %
(£) (£/m2) %
(£) (£/m2) %
Minimum cost (based on E/O cost for whole development) 1 £265 £4 0.4% £184 £3 0% £367 £4 0% £289 £2 0.3% 2 £1,549 £25 3% £1,493 £20 2% £916 £10 1% £807 £7 1% 3 £2,088 £34 3% £2,046 £28 2% £2,645 £30 3% £2,307 £20 2% 4 £5,282 £87 9% £7,079 £97 8% £7,793 £89 8% £6,835 £58 7% 5 £17,234 £283 29% £26,895 £368 31% £29,187 £332 31% £32,197 £273 32% 6 £27,712 £454 46% £34,619 £474 40% £37,092 £421 40% £40,985 £347 41%
Maximum cost (based on E/O cost for whole development) 1 £265 £4 0.4% £184 £3 0% £367 £4 0% £289 £2 0.3% 2 £1,549 £25 3% £1,493 £20 2% £916 £10 1% £807 £7 1% 3 £6,913 £113 12% £7,396 £101 9% £9,152 £104 10% £3,527 £30 4% 4 £11,134 £183 19% £15,991 £219 18% £17,547 £199 19% £18,844 £160 19% 5 £20,790 £341 35% £27,777 £381 32% £30,148 £343 32% £34,079 £289 34% 6 £31,564 £517 53% £38,212 £523 44% £42,055 £478 45% £46,137 £391 46%

137
Table 70: E/O cost (in 2009) as £/m2 of floor area and as a percentage of baseline build costs (cost of building dwelling to Part L 2006): Strategic
Flat Terraced house Semi-detached house Detached house E/O cost E/O cost E/O cost E/O cost
Code Level
(£) (£/m2) %
(£) (£/m2) %
(£) (£/m2) %
(£) (£/m2) %
Minimum cost (based on E/O cost for whole development) 1 £265 £4 0.4% £184 £3 0% £367 £4 0% £289 £2 0.3% 2 £1,549 £25 3% £1,493 £20 2% £916 £10 1% £807 £7 1% 3 £2,088 £34 3% £2,046 £28 2% £2,645 £30 3% £2,307 £20 2% 4 £5,281 £87 9% £7,079 £97 8% £7,793 £89 8% £6,835 £58 7% 5 £17,234 £283 29% £26,895 £368 31% £29,187 £332 31% £32,197 £273 32% 6 £27,465 £450 46% £34,325 £470 40% £36,735 £417 39% £40,558 £344 41%
Maximum cost (based on E/O cost for whole development) 1 £265 £4 0.4% £184 £3 0% £367 £4 0% £289 £2 0.3% 2 £1,549 £25 3% £1,493 £20 2% £916 £10 1% £807 £7 1% 3 £6,913 £113 12% £7,396 £101 9% £9,152 £104 10% £3,527 £30 4% 4 £11,134 £183 19% £15,991 £219 18% £17,547 £199 19% £18,844 £160 19% 5 £20,790 £341 35% £27,777 £381 32% £30,148 £343 32% £34,079 £289 34% 6 £31,564 £517 53% £38,212 £523 44% £42,055 £478 45% £46,137 £391 46%