codewarrior for armv7 targeting manual - nxp · pdf file1.5.2 c/c++ compiler ... discusses how...
TRANSCRIPT

CodeWarrior for ARMv7 Targeting Manual
Freescale Semiconductor, Inc. Document Number: CW_ARMv7_Targeting_ManualReference Manual 10.0.8, 01/2016


Contents
Chapter 1 Introduction.......................................................................................91.1 Release Notes....................................................................................................................................91.2 Contents of this Manual......................................................................................................................91.3 Accompanying documentation......................................................................................................... 101.4 ARM Embedded Application Binary Interface.................................................................................. 101.5 CodeWarrior Development Studio Tools.......................................................................................... 11
1.5.1 Eclipse IDE......................................................................................................................... 111.5.2 C/C++ Compiler..................................................................................................................111.5.3 Assembler...........................................................................................................................111.5.4 Linker..................................................................................................................................121.5.5 Debugger............................................................................................................................121.5.6 GNU newlib libraries........................................................................................................... 12
1.6 CodeWarrior IDE.............................................................................................................................. 121.6.1 Project files......................................................................................................................... 131.6.2 Code editing........................................................................................................................131.6.3 Compiling............................................................................................................................131.6.4 Linking................................................................................................................................ 131.6.5 Debugging.......................................................................................................................... 14
Chapter 2 Working with Projects..................................................................... 152.1 CodeWarrior Bareboard Project Wizard........................................................................................... 15
2.1.1 Create CodeWarrior Bareboard Project page.....................................................................162.1.2 Processor page...................................................................................................................172.1.3 Debug Target Settings page...............................................................................................182.1.4 Build Settings page.............................................................................................................202.1.5 Configurations page............................................................................................................22
2.2 CodeWarrior Linux Project Wizard................................................................................................... 232.2.1 Create CodeWarrior Linux Project page.............................................................................242.2.2 Processor page...................................................................................................................252.2.3 Build Settings page.............................................................................................................262.2.4 Linux Application page........................................................................................................27
2.3 Creating projects.............................................................................................................................. 292.3.1 Creating CodeWarrior Bareboard Application project.........................................................292.3.2 Creating CodeWarrior Bareboard Library project............................................................... 312.3.3 Creating CodeWarrior Linux Application project.................................................................32
2.4 Building projects............................................................................................................................... 342.4.1 Manual-Build mode.............................................................................................................342.4.2 Auto-Build mode................................................................................................................. 35
Chapter 3 Build Properties.............................................................................. 373.1 Changing build properties.................................................................................................................373.2 Restoring build properties.................................................................................................................383.3 Defining C/C++ build settings and behavior..................................................................................... 38
3.3.1 Define build settings........................................................................................................... 383.3.2 Define build behavior..........................................................................................................40
3.4 Properties for <project>....................................................................................................................423.4.1 Target Processor................................................................................................................ 43
Contents
CodeWarrior for ARMv7 Targeting Manual, Rev. 10.0.8, 01/2016Freescale Semiconductor, Inc. 3

3.4.2 Debugging.......................................................................................................................... 443.4.3 ARM Sourcery GCC Assembler......................................................................................... 44
3.4.3.1 Preprocessor.........................................................................................................453.4.3.2 Warnings...............................................................................................................45
3.4.4 ARM Sourcery GCC C Compiler........................................................................................ 463.4.4.1 Preprocessor.........................................................................................................463.4.4.2 Optimization.......................................................................................................... 473.4.4.3 Warnings...............................................................................................................483.4.4.4 Miscellaneous....................................................................................................... 48
3.4.5 ARM Sourcery GCC C Linker............................................................................................. 493.4.5.1 General................................................................................................................. 503.4.5.2 Libraries................................................................................................................ 503.4.5.3 Miscellaneous....................................................................................................... 50
Chapter 4 Debug Configurations.....................................................................534.1 Using Debug Configurations dialog..................................................................................................53
4.1.1 Main....................................................................................................................................544.1.2 Arguments.......................................................................................................................... 584.1.3 Debugger............................................................................................................................59
4.1.3.1 Debug................................................................................................................... 604.1.3.2 Exceptions............................................................................................................ 624.1.3.3 Interrupts...............................................................................................................624.1.3.4 Download..............................................................................................................634.1.3.5 PIC........................................................................................................................654.1.3.6 Other Executables................................................................................................ 664.1.3.7 Symbolics..............................................................................................................674.1.3.8 OS Awareness...................................................................................................... 68
4.1.4 Trace and Profile ............................................................................................................... 704.1.5 Source................................................................................................................................ 724.1.6 Environment........................................................................................................................734.1.7 Common............................................................................................................................. 74
4.2 Customizing Debug Configurations..................................................................................................754.3 Reverting Debug Configuration settings...........................................................................................77
Chapter 5 Working with Debugger.................................................................. 795.1 Debugging CodeWarrior project.......................................................................................................795.2 Consistent debug control..................................................................................................................805.3 Secure Debug mode.........................................................................................................................805.4 Connection types..............................................................................................................................805.5 Editing remote system configuration................................................................................................ 81
5.5.1 Initialization tab...................................................................................................................825.5.2 Memory tab.........................................................................................................................83
5.6 CodeWarrior command-line debugger............................................................................................. 845.7 Working with Breakpoints.................................................................................................................86
5.7.1 Setting Breakpoints.............................................................................................................865.7.2 Setting Hardware Breakpoints............................................................................................89
5.7.2.1 Using IDE to set Hardware Breakpoints............................................................... 895.7.2.2 Using Debugger Shell to set Hardware Breakpoints.............................................89
5.7.3 Removing Breakpoints........................................................................................................905.7.3.1 Remove Breakpoints using Marker Bar................................................................ 905.7.3.2 Remove Breakpoints using Breakpoints view.......................................................90
5.8 Working with Watchpoints................................................................................................................ 905.8.1 Setting Watchpoints............................................................................................................91
Contents
CodeWarrior for ARMv7 Targeting Manual, Rev. 10.0.8, 01/20164 Freescale Semiconductor, Inc.

5.8.2 Removing Watchpoints.......................................................................................................935.9 Working with Registers.....................................................................................................................93
5.9.1 Changing bit value of register.............................................................................................945.9.2 Viewing Register details..................................................................................................... 94
5.9.2.1 Bit Fields............................................................................................................... 965.9.2.2 Actions.................................................................................................................. 975.9.2.3 Description............................................................................................................ 98
5.9.3 Registers view context menu..............................................................................................985.9.4 Working with Register Groups............................................................................................ 99
5.9.4.1 Adding Register Group......................................................................................... 995.9.4.2 Editing Register Group........................................................................................1005.9.4.3 Removing Register Group.................................................................................. 101
5.10 Viewing Memory...........................................................................................................................1015.10.1 Adding Memory Monitor..................................................................................................102
5.11 Changing Program Counter Value............................................................................................... 1035.12 Hard Resetting..............................................................................................................................1035.13 Setting Stack Depth......................................................................................................................1035.14 Importing CodeWarrior Executable file Wizard.............................................................................104
5.14.1 Import a CodeWarrior Executable file page....................................................................1055.14.2 Import C/C++/Assembler Executable Files page............................................................1055.14.3 Processor page...............................................................................................................1055.14.4 Linux Application Launch Configurations page...............................................................1065.14.5 Debug Target Settings page...........................................................................................1075.14.6 Configurations page........................................................................................................107
5.15 Debugging Externally Built Executable Files................................................................................1085.15.1 Import Executable File....................................................................................................1085.15.2 Edit Launch Configuration.............................................................................................. 1105.15.3 Specify Source Lookup Path.......................................................................................... 1105.15.4 Debug Executable File....................................................................................................112
Chapter 6 Multicore Debugging.....................................................................1136.1 Debugging Multicore projects.........................................................................................................113
6.1.1 Setting launch configurations............................................................................................1136.1.2 Debugging multiple cores................................................................................................. 116
6.2 Multicore debugging commands.....................................................................................................1196.2.1 Multicore commands in CodeWarrior IDE........................................................................ 1196.2.2 Multicore commands in Debugger Shell........................................................................... 120
Chapter 7 Debugging Embedded Linux Software......................................... 1257.1 Debugging Linux application.......................................................................................................... 125
7.1.1 Install CodeWarrior TRK on target system....................................................................... 1257.1.2 Start CodeWarrior TRK on target system......................................................................... 126
7.1.2.1 TCP/IP connections............................................................................................ 1267.1.2.2 Serial connections...............................................................................................127
7.1.3 Create a CodeWarrior Download Launch Configuration for the Linux Application........... 1287.1.4 Specify Console I/O redirections for Linux application..................................................... 1317.1.5 Configure Linux Process Signal Policy............................................................................. 132
7.1.5.1 Signal inheritance............................................................................................... 1327.1.5.2 Default Signal Policy........................................................................................... 1327.1.5.3 Modifying Signal Policy....................................................................................... 132
7.1.6 Debug Linux application................................................................................................... 1347.2 Viewing multiple processes and threads........................................................................................ 1347.3 Debugging Applications that Use fork() and exec() System Calls.................................................. 135
Contents
CodeWarrior for ARMv7 Targeting Manual, Rev. 10.0.8, 01/2016Freescale Semiconductor, Inc. 5

7.4 Debugging shared library............................................................................................................... 1457.4.1 Create an example project................................................................................................1457.4.2 Configure shared library build configuration..................................................................... 1487.4.3 Configure executable build configuration..........................................................................1487.4.4 Build shared library...........................................................................................................1497.4.5 Build executable............................................................................................................... 1497.4.6 Configure launch configuration.........................................................................................1497.4.7 Debug shared library........................................................................................................ 151
7.5 Debugging Linux Kernel................................................................................................................. 1537.5.1 Setting up target hardware............................................................................................... 154
7.5.1.1 Establishing console connection.........................................................................1547.5.2 Installing Board Support Package (BSP)..........................................................................1557.5.3 Configuring build tool........................................................................................................1567.5.4 Configuring Linux kernel...................................................................................................1567.5.5 Creating a CodeWarrior Project using Linux kernel image...............................................158
7.5.5.1 Updating Linux kernel image.............................................................................. 1597.5.6 Configuring kernel project for debugging..........................................................................160
7.5.6.1 Configuring attach kernel debug scenario.......................................................... 1607.5.7 Debugging kernel by attaching to a running U-Boot.........................................................163
7.6 Debugging loadable kernel modules.............................................................................................. 1657.6.1 Loadable Kernel Modules - An Introduction......................................................................1657.6.2 Creating CodeWarrior project for Linux Kernel image...................................................... 1657.6.3 Configuring Modules' Symbolics Mapping........................................................................168
Chapter 8 JTAG Configuration Files............................................................. 1718.1 JTAG configuration file syntax........................................................................................................1718.2 Using a JTAG configuration file to override RCW.......................................................................... 1728.3 Using JTAG configuration file to specify multiple linked devices on a JTAG chain........................ 1738.4 Setting up a remote system to use a JTAG configuration file.........................................................174
Chapter 9 Target Initialization Files...............................................................1779.1 Using target initialization files......................................................................................................... 177
Chapter 10 Memory Configuration Files........................................................18110.1 Using memory configuration files................................................................................................. 181
Chapter 11 Working with Hardware Tools.....................................................18311.1 Flash programmer........................................................................................................................ 183
11.1.1 Create flash programmer target task.............................................................................. 18311.1.2 Configure flash programmer target task......................................................................... 185
11.1.2.1 Add flash device................................................................................................18611.1.2.2 Specify target RAM settings..............................................................................18611.1.2.3 Add flash programmer actions.......................................................................... 186
11.1.3 Execute flash programmer target task............................................................................19011.1.4 SD/eMMC flash programmer.......................................................................................... 192
11.1.4.1 Programming U-Boot using SD/eMMC flash programmer................................19211.1.5 Flash File to Target.........................................................................................................193
11.1.5.1 Erasing flash device..........................................................................................19411.1.5.2 Programming file...............................................................................................194
11.2 Hardware diagnostics...................................................................................................................19511.2.1 Creating hardware diagnostics task................................................................................195
Contents
CodeWarrior for ARMv7 Targeting Manual, Rev. 10.0.8, 01/20166 Freescale Semiconductor, Inc.

11.2.2 Working with Hardware Diagnostic Action editor............................................................19611.2.2.1 Action Type....................................................................................................... 19711.2.2.2 Memory Access................................................................................................ 19711.2.2.3 Loop Speed.......................................................................................................19811.2.2.4 Memory Tests................................................................................................... 198
Contents
CodeWarrior for ARMv7 Targeting Manual, Rev. 10.0.8, 01/2016Freescale Semiconductor, Inc. 7

Contents
CodeWarrior for ARMv7 Targeting Manual, Rev. 10.0.8, 01/20168 Freescale Semiconductor, Inc.

Chapter 1IntroductionThis manual explains how to use CodeWarrior Development Studio tools to develop software for bareboardapplications and embedded Linux® operating system running on NXP QorIQ LS series - ARM V7 ISA.
This chapter provides an overview of this manual and introduces you to the CodeWarrior development tools anddevelopment process.
This chapter includes the following sections:
• Release Notes on page 9: Lists new features, bug fixes, and incompatibilities.
• Contents of this Manual on page 9: Describes contents of this manual.
• Accompanying documentation on page 10: Describes the documentation included in this version ofCodeWarrior Development Studio for QorIQ LS series - ARM V7 ISA.
• ARM Embedded Application Binary Interface on page 10: Provides information about the ARM EmbeddedApplication Binary Interface (ARM EABI).
• CodeWarrior Development Studio Tools on page 11: Describes some important tools of CodeWarriorDevelopment Studio.
• CodeWarrior IDE on page 12: Explains the CodeWarrior IDE and tells how to perform basic IDEoperations.
1.1 Release NotesRelease notes include information about new features, last-minute changes, bug fixes, incompatibleelements, or other sections that may not be included in this manual.
You should read release notes before using the CodeWarrior IDE.
1.2 Contents of this ManualEach chapter of this manual describes a different area of software development.
The table below lists each chapter in the manual.
Table 1: Organization of this Manual
Chapter Description
Introduction on page 9 This chapter.
Working with Projects on page15
Describes the different types of projects you can create, provides anoverview of CodeWarrior project wizards.
Build Properties on page 37 Explains build properties for QorIQ LS series - ARM V7 ISA projects.
Debug Configurations on page53
Describes the different types of launch configurations you can create,provides an overview of the debugger.
Table continues on the next page...
IntroductionRelease Notes
CodeWarrior for ARMv7 Targeting Manual, Rev. 10.0.8, 01/2016Freescale Semiconductor, Inc. 9

Table 1: Organization of this Manual (continued)
Chapter Description
Working with Debugger on page79
Explains various aspects of CodeWarrior debugging, such as debugging aproject, configuring connections, setting breakpoints and watchpoints,working with registers, viewing memory, viewing cache, and debuggingexternally built executable files.
Multicore Debugging on page113
Explains multi-core debugging capabilities of CodeWarrior debugger.
JTAG Configuration Files onpage 171
Explains JTAG configuration files that pass specific configuration settingsto the debugger and support chaining of multiple devices.
Target Initialization Files on page177
Discusses how to use a target initialization file, describes target initializationfile commands, and explains how to perform target initialization using a tclscript.
Memory Configuration Files onpage 181
Discusses how to use a memory configuration file and describes memoryconfiguration file commands.
Working with Hardware Tools onpage 183
Explains CodeWarrior hardware tools used for board bring-up, test, andanalysis.
1.3 Accompanying documentationThe Documentation page describes the documentation included in this version of CodeWarrior DevelopmentStudio for QorIQ LS series - ARM V7 ISA.
You can access the Documentation page by:
• Opening START_HERE.html from the <CWInstallDir>\CW_ARMv7\ARMv7\Help folder
• Choosing Help > Documentation from the CodeWarrior IDE menu bar
1.4 ARM Embedded Application Binary InterfaceThe ARM Embedded Application Binary Interface (ARM EABI) specifies data structure alignment, callingconventions, and other information about how high-level languages can be implemented on a ARMprocessor.
The code generated by CodeWarrior for ARMv7 conforms to the ARM EABI. To learn more about the ARMEABI, information and documentation about all supported ARM hardware is available here: ARM® Technology-Based Solutions
The ARM EABI also specifies the object and symbol file format. It specifies Executable and Linkable Format(ELF) as the output file format and Debug With Arbitrary Record Formats (DWARF) as the debugging informationformat. For more information about these formats, see:
• Executable and Linkable Format, Version 1.1, published by UNIX System Laboratories.
• DWARF Debugging Standard website available at:
infocenter.arm.com
IntroductionAccompanying documentation
CodeWarrior for ARMv7 Targeting Manual, Rev. 10.0.8, 01/201610 Freescale Semiconductor, Inc.

1.5 CodeWarrior Development Studio ToolsThis section talks about some important tools of CodeWarrior Development Studio.
Programming for processors is much like programming for any other CodeWarrior platform target. If you havenot used CodeWarrior tools before, start by studying the Eclipse IDE, which is used to host the tools. For moredetails on IDE, see CodeWarrior Development Studio Common Features Guide available in the<CWInstallDir>\CW_ARMv7\ARMv7\Help\PDF folder.
The following are some important tools of CodeWarrior Development Studio:
• Eclipse IDE on page 11
• C/C++ Compiler on page 11
• Assembler on page 11
• Linker on page 12
• Debugger on page 12
• GNU newlib libraries on page 12
1.5.1 Eclipse IDEThe Eclipse Integrated Development Environment (IDE) is an open-source development environment that letsyou develop and debug your software.
It controls the project manager, the source code editor, the class browser, the compilers and linkers, and thedebugger. The Eclipse workspace organizes all files related to your project. This allows you to see your projectat a glance and navigate easily through the source code files.
The Eclipse IDE has an extensible architecture that uses plug-in compilers and linkers to target various operatingsystems and microprocessors. The IDE can be hosted on Microsoft Windows, Linux, and other platforms. Thereare many development tools available for the IDE, including C, C++, and Java compilers for desktop andembedded processors.
For more information about the Eclipse IDE, read the Eclipse documentation at:
http://www.eclipse.org/documentation/
1.5.2 C/C++ CompilerThe CodeWarrior ARMv7 C/C++ compiler is an ANSI-compliant compiler.
It compiles C and C++ statements and assembles inline assembly language statements. You can generateARMv7 applications and libraries that conform to the ARM EABI by using the CodeWarrior compiler inconjunction with the CodeWarrior linker for ARMv7 processors.
The IDE manages the execution of the compiler. The IDE invokes the compiler if you:
• Change a source file and issue the make command.
• Select a source file in your project and issue the compile, preprocess, or precompile command.
1.5.3 AssemblerThe CodeWarrior ARMv7 assembler is a standalone assembler that translates assembly-language sourcecode to machine-language object files or executable programs.
Either you can provide the assembly-language source code to the assembler, or the assembler can take theassembly-language source code generated by the compiler.
IntroductionCodeWarrior Development Studio Tools
CodeWarrior for ARMv7 Targeting Manual, Rev. 10.0.8, 01/2016Freescale Semiconductor, Inc. 11

For each assembly-language module in a build target, the ARMv7 assembler can generate a file that lists thegenerated code side-by-side with the assembly-language source code.
1.5.4 LinkerThe CodeWarrior ARMv7 linker generates binaries that conform to the ARM EABI (Embedded ApplicationBinary Interface).
The linker combines object modules created by the compiler and/or assembler with modules in static librariesto produce a binary file in executable and linkable (ELF) format.
Among many powerful features, the linker lets you:
• Use absolute addressing
• Create multiple user-defined sections
• Generate S-Record files
• Generate PIC/PID binaries
The IDE runs the linker each time you build your project.
1.5.5 DebuggerThe CodeWarrior ARMv7 debugger controls the execution of your program and allows you to see what ishappening internally as the program runs.
You can use the debugger to find problems in your program. The debugger can execute your program onestatement at a time and suspend execution when control reaches a specified point. When the debugger stopsa program, you can view the chain of function calls, examine and change the values of variables, and inspectthe contents of registers.
The debugger allows you to debug your CodeWarrior project using target hardware. The ARMv7 debuggercommunicates with the board through a hardware probe (such as the CodeWarrior TAP).
1.5.6 GNU newlib librariesThe GNU newlib runtime libraries are ANSI-compliant C and C++ standard libraries.
Use these libraries to help you create applications for processors. The versions of the GNU newlib runtimelibraries have been customized and the runtime has been adapted for processor development.
For more information about GNU newlib, see GNU C Reference and GNU C++ Reference.
1.6 CodeWarrior IDEWhile working with the CodeWarrior IDE, you will proceed through the development stages familiar to allprogrammers: writing code, compiling and linking, and debugging.
The difference between the CodeWarrior development environment and traditional command-line environmentsis how the software, in this case the CodeWarrior IDE, helps you manage your work more effectively.
See CodeWarrior Development Studio Common Features Guide for:
• Complete information on tasks, such as editing, compiling, and linking
• Basic information on debugging
The following sections explain the CodeWarrior IDE and describe how to perform basic CodeWarrior IDEoperations:
IntroductionCodeWarrior IDE
CodeWarrior for ARMv7 Targeting Manual, Rev. 10.0.8, 01/201612 Freescale Semiconductor, Inc.

• Project files
• Code editing
• Compiling
• Linking
• Debugging
1.6.1 Project filesA CodeWarrior project is analogous to a set of make files, because a project can have multiple settings thatare applied when building the program.
For example, you can have one project that has both a debug version and a release version of your program.You can build one or the other, or both as you wish. The different settings used to launch your program withina single project are called launch configurations.
The CodeWarrior IDE uses the CodeWarrior Projects view to list all the files in a project. A project includes files,such as source code files and libraries. You can add or remove files easily. You can assign files to one or moredifferent build configurations within the project, so files common to multiple build configurations can be managedsimply.
The CodeWarrior IDE itself manages all the interdependencies between files and tracks which files havechanged since the last build.
The CodeWarrior IDE also stores the settings for the compiler and linker options for each build configuration.You can modify these settings using the IDE, or with the #pragma statements in your code.
1.6.2 Code editingCodeWarrior IDE has an integral text editor designed for programmers. It handles text files in ASCII,Microsoft® Windows®, and UNIX® formats.
To edit a file in a project, double-click the file name in the CodeWarrior Projects view. CodeWarrior IDE opensthe file in the editor associated with the file type.
The editor view has excellent navigational features that allow you to switch between related files, locate anyparticular function, mark any location within a file, or go to a specific line of code.
1.6.3 CompilingTo compile a source code file, it must be among the files that are part of the current launch configuration.
If the file is in the configuration, select it in the CodeWarrior Projects view and select Project > Build Project fromthe CodeWarrior IDE menu bar.
To automatically compile all the files in the current launch configuration after you modify them, select Project >Build Automatically from the CodeWarrior IDE menu bar.
1.6.4 LinkingChoose Project > Build Project from the CodeWarrior IDE menu bar to link object code into a final binary file.
The Build Project command makes the active project up-to-date and links the resulting object code into a finaloutput file.
You can control the linker through the IDE. There is no need to specify a list of object files. The workspace tracksall the object files automatically.
You can also modify the build configuration settings to specify the name of the final output file.
IntroductionCodeWarrior IDE
CodeWarrior for ARMv7 Targeting Manual, Rev. 10.0.8, 01/2016Freescale Semiconductor, Inc. 13

1.6.5 DebuggingChoose Run > Debug from the CodeWarrior IDE menu bar to debug your project.
This command downloads the current project's executable to the target board and starts a debug session.
The CodeWarrior IDE uses the settings in the launch configuration to generatedebugging information and initiate communications with the target board.
NOTE
You can now use the debugger to step through the program code, view and change the value of variables, setbreakpoints, and much more.
IntroductionCodeWarrior IDE
CodeWarrior for ARMv7 Targeting Manual, Rev. 10.0.8, 01/201614 Freescale Semiconductor, Inc.

Chapter 2Working with ProjectsThis chapter explains how to create and build projects for NXP QorIQ LS series - ARM V7 ISA processors usingthe CodeWarrior tools.
This chapter explains:
• CodeWarrior Bareboard Project Wizard on page 15
• CodeWarrior Linux Project Wizard on page 23
• Creating projects on page 29
• Building projects on page 34
2.1 CodeWarrior Bareboard Project WizardThe term bareboard refers to hardware systems that do not need an operating system to operate. TheCodeWarrior Bareboard Project Wizard presents a series of pages that prompt you for the features andsettings to be used when making your program.
This section describes the various pages that the CodeWarrior Bareboard Project Wizard displays as it assistsyou in creating a bareboard project.
The pages of the CodeWarrior Bareboard Project Wizard are:
• Create CodeWarrior Bareboard Project page on page 16
• Processor page on page 17
• Debug Target Settings page on page 18
• Build Settings page on page 20
• Configurations page on page 22
Working with ProjectsCodeWarrior Bareboard Project Wizard
CodeWarrior for ARMv7 Targeting Manual, Rev. 10.0.8, 01/2016Freescale Semiconductor, Inc. 15

2.1.1 Create CodeWarrior Bareboard Project pageUse this page to specify the project name and the directory where the project files are located.
Figure 1: Create CodeWarrior Bareboard Project page
The table below describes the various options available on the Create a CodeWarrior Bareboard Project page.
Table 2: Create CodeWarrior Bareboard Project page settings
Option Description
Project name Enter the name for the project in this text box.
Use default location Select to choose the directory to store the files required to build the program.Use the Location option to select the desired directory.
Location Specifies the directory that contains the project files. Use Browse to navigateto the desired directory. This option is only available when Use defaultlocation is cleared.
Working with ProjectsCodeWarrior Bareboard Project Wizard
CodeWarrior for ARMv7 Targeting Manual, Rev. 10.0.8, 01/201616 Freescale Semiconductor, Inc.

2.1.2 Processor pageThis page displays the target devices supported by the current installation. Use this page to specify the typeof processor and the output for the new project.
Figure 2: Processor page
The table below describes the various options available on the Processor page.
Table 3: Processor page settings
Option Description
Processor Expand the processor family tree and select a supported target. The toolchainuses this choice to generate code that makes use of processor-specificfeatures, such as multiple cores.
Project Output Select any one of the following supported project output:
• Application: Select to create an application with ".elf" extension, thatincludes information related to the debug over a board.
• Static Library: Select to create a library with ".a" extension, that can beincluded in other projects. Library files created using this option do notinclude board specific details.
Working with ProjectsCodeWarrior Bareboard Project Wizard
CodeWarrior for ARMv7 Targeting Manual, Rev. 10.0.8, 01/2016Freescale Semiconductor, Inc. 17

2.1.3 Debug Target Settings pageUse this page to select debugger connection type, board type, launch configuration type, and connection typefor your project.
This page also lets you configure connection settings for your project.
Figure 3: Debug Target Settings page
The table below describes the various options available on the Debug Target Settings page.
Working with ProjectsCodeWarrior Bareboard Project Wizard
CodeWarrior for ARMv7 Targeting Manual, Rev. 10.0.8, 01/201618 Freescale Semiconductor, Inc.

Table 4: Debug Target Settings page
Option Description
Debugger Connection Types Specifies the available target types:
• Hardware - Select to execute the program on the target hardware available.
• Emulator - Select to execute the program on a hardware emulator.
Board Specifies the hardware supported by the selected processor. It could beeither QDS or Tower board.
Launch Specifies the launch configurations and corresponding connection,supported by the selected processor.
Connection Type Specifies the interface to communicate with the hardware.
• CMSIS-DAP - Select to use the CMSIS-DAP interface to communicate withthe hardware device. This is the default connection type for Tower boards.
• CodeWarrior TAP (over USB) - Select to use the USB interface tocommunicate with the hardware device.
• CodeWarrior TAP (over Ethernet) - Select to use the Ethernet interface tocommunicate with the hardware device.
TAP address Enter the IP address of the selected TAP device. Enter the IP address of theTAP device here. This option is available only if CodeWarrior TAP (overEthernet) is selected as the connection type.
Working with ProjectsCodeWarrior Bareboard Project Wizard
CodeWarrior for ARMv7 Targeting Manual, Rev. 10.0.8, 01/2016Freescale Semiconductor, Inc. 19

2.1.4 Build Settings pageUse this page to select a programming language, toolchain, and the output project typ for the new project foryour project.
Figure 4: Build Settings page
The table below describes the various options available on the Build Settings page.
Working with ProjectsCodeWarrior Bareboard Project Wizard
CodeWarrior for ARMv7 Targeting Manual, Rev. 10.0.8, 01/201620 Freescale Semiconductor, Inc.

Table 5: Build Settings page
Option Description
Language Specifies the programming language used by the new project. The currentinstallation supports the following languages:
• C - Select to generate ANSI C-compliant startup code, and initializes globalvariables.
• C++ - Select to generate ANSI C++ startup code, and performs global classobject initialization.
• ASM - Select to generate Assembly startup code.
I/O Support • Semihosting I/O Support - Configures how the application deals with the I/O calls. For this case, it uses a virtual connection with the debugger (alsoknown as `semi hosting').
• UART I/O - Configures how the application deals with the I/O calls. With`UART' it uses the physical serial device connection.
• No I/O - No I/O support.
Toolchain Specifies the toolchains supported by the current installation. Selectedtoolchain sets up the default compiler, linker, and libraries used to build thenew project. Each toolchain generates code targeted for a specific platform.
Floating Point Specifies how the compiler handles floating-point operations, encountered inthe source code.
Working with ProjectsCodeWarrior Bareboard Project Wizard
CodeWarrior for ARMv7 Targeting Manual, Rev. 10.0.8, 01/2016Freescale Semiconductor, Inc. 21

2.1.5 Configurations pageUse this page to specify the processing model and the processor core that executes the project.
Figure 5: Configurations page
The table below describes the various options available on the Configurations page.
Working with ProjectsCodeWarrior Bareboard Project Wizard
CodeWarrior for ARMv7 Targeting Manual, Rev. 10.0.8, 01/201622 Freescale Semiconductor, Inc.

Table 6: Configurations page setting
Option Description
Processing Model The current installation supports the following processing models:
• SMP - This option is disabled for this installation.
• AMP (one project per core) - Select this option to generate a separateproject for each selected core. The option will also set the core index foreach project based on the core selection.
• AMP (one build configuration per core) - Select this option to generate oneproject with multiple targets, each containing an lcf file for the specifiedcore.
Selecting the AMP (One build configuration percore) option displays a checkbox, Set up buildreferences for build configurations of all cores, justbelow this option. If you select the Set up buildreferences for build configurations of all corescheckbox, then building the project for one corewill automatically build the project for other coresas well. If you do not select this checkbox, thenyou would need to manually build the project foreach core.
NOTE
Core Index Select the processor core that executes the project.
2.2 CodeWarrior Linux Project WizardThe CodeWarrior Linux Project Wizard helps you create a Linux project by displaying various pages that allowyou to specify settings for your project.
The pages that the wizard presents can differ, based upon the choice of project type orexecution target.
NOTE
The pages of the CodeWarrior Linux Project Wizard are:
• Create CodeWarrior Linux Project page on page 24
• Processor page on page 25
• Build Settings page on page 26
• Linux Application page on page 27
Working with ProjectsCodeWarrior Linux Project Wizard
CodeWarrior for ARMv7 Targeting Manual, Rev. 10.0.8, 01/2016Freescale Semiconductor, Inc. 23

2.2.1 Create CodeWarrior Linux Project pageUse this page to specify the project name and the directory where the project files are located.
Figure 6: Create CodeWarrior Linux Project page
The table below describes the various options available on the Create CodeWarrior Linux Project page.
Table 7: Create CodeWarrior Linux Project page settings
Option Description
Project name Enter the name for the project in this text box.
Use default location Select to choose the directory to store the files required to build the program.Use the Location option to select the desired directory.
Location Specifies the directory that contains the project files. Use Browse to navigateto the desired directory. This option is only available when Use defaultlocation is cleared. Ensure that you append the name of the project to thepath to create a new location for your project.
Working with ProjectsCodeWarrior Linux Project Wizard
CodeWarrior for ARMv7 Targeting Manual, Rev. 10.0.8, 01/201624 Freescale Semiconductor, Inc.

2.2.2 Processor pageThis page displays the processors supported by the current installation. Use this page to specify the type ofprocessor and the output for the new project.
Figure 7: Processor page
The table below describes the various options available on the Processor page.
Table 8: Processor page settings
Option Description
Processor Expand the processor family tree and select a supported target. The toolchainuses this choice to generate code that makes use of processor-specificfeatures, such as multiple cores.
Project Output Select any one of the following supported project output:
• Application - Select to create an application with ".elf" extension, thatincludes information related to the debug over a board.
• Library - Select to create a library with ".a" extension, that can be includedin other projects. Library files created using this option do not include boardspecific details.
Working with ProjectsCodeWarrior Linux Project Wizard
CodeWarrior for ARMv7 Targeting Manual, Rev. 10.0.8, 01/2016Freescale Semiconductor, Inc. 25

2.2.3 Build Settings pageThis page displays the toolchains supported by the current installation. Use this page to specify the toolchainfor the new project.
The current release does not include toolchains for Linux applications by default. To addthe required build tools support, you should install the corresponding service pack forthe required target.
NOTE
Figure 8: Build Settings page
The table below describes the various options available on the Build Settings page.
Working with ProjectsCodeWarrior Linux Project Wizard
CodeWarrior for ARMv7 Targeting Manual, Rev. 10.0.8, 01/201626 Freescale Semiconductor, Inc.

Table 9: Build Settings page setting
Option Description
Toolchain Specifies the toolchains supported by the current installation. Selectedtoolchain sets up the default compiler, linker, and libraries used to build thenew project. Each toolchain generates code targeted for a specific platform.
Language Specifies the programming language used by the new project. The currentinstallation supports the following languages:
• C - Select to generate ANSI C-compliant startup code, and initializes globalvariables.
• C++ - Select to generate ANSI C++ startup code, and performs global classobject initialization.
Build Tools Architecture Specifies the processor used by the new project. The current installationsupports the following architectures:
• 32 bit - 32-bit option is available by default for LS1021A processors.
• 64 bit - this option is disabled for this release.
2.2.4 Linux Application pageUse this page to specify how the debugger communicates with the host Linux system and controls your Linuxapplication.
The Linux Application page appears, in the CodeWarrior Linux Project Wizard, onlywhen you add the Linux build tools support, by installing the corresponding service packfor the required target.
NOTE
Working with ProjectsCodeWarrior Linux Project Wizard
CodeWarrior for ARMv7 Targeting Manual, Rev. 10.0.8, 01/2016Freescale Semiconductor, Inc. 27

Figure 9: Linux Application page
When debugging a Linux application, you must use the CodeWarrior TRK to managethe communications interface between the debugger and Linux system.
NOTE
The table below describes the various options available on the Linux Application page.
Table 10: Linux Application page setting
Option Description
CodeWarrior TRK Select to use the CodeWarrior Target Resident Kernel (TRK) protocol, todownload and control application on the Linux host system.
IP Address Specifies the IP address of the Linux host system, the project executes on.
Port Specifies the port number that the debugger will use to communicate to theLinux host.
Remote Download Path Specifies the host directory into which the debugger downloads theapplication.
Working with ProjectsCodeWarrior Linux Project Wizard
CodeWarrior for ARMv7 Targeting Manual, Rev. 10.0.8, 01/201628 Freescale Semiconductor, Inc.

2.3 Creating projectsYou can use a project creation wizard provided by CodeWarrior Development Studio to create a CodeWarriorproject according to your requirements.
This section explains you how to use the CodeWarrior Bareboard Project Wizard to quickly create new projectswith default settings (build and launch configurations). After the project has been created, you can easily changeany default setting to suit your needs.
This section explains:
• Creating CodeWarrior Bareboard Application project on page 29
• Creating CodeWarrior Bareboard Library project on page 31
• Creating CodeWarrior Linux Application project on page 32
2.3.1 Creating CodeWarrior Bareboard Application projectYou can create a CodeWarrior bareboard application project using the CodeWarrior Bareboard ProjectWizard.
To create a CodeWarrior bareboard application project, perform these steps:
For details about the options in the CodeWarrior Bareboard Project wizard pages, seethe topic CodeWarrior Bareboard Project Wizard on page 15.
NOTE
1. Select Start > All Programs > Freescale CodeWarrior > CW for ARMv7 vnumber > CodeWarrior, wherenumber is the version number of your product.
The Workspace Launcher dialog appears, prompting you to select a workspace to use.
Click Browse to change the default location for workspace folder. You can also selectthe Use this as the default and do not ask again checkbox to set default or selected pathas the default location for storing all your projects.
NOTE
2. Click OK.
The default workspace is accepted. The CodeWarrior IDE launches and the Welcome page appears.
The Welcome page appears only if the CodeWarrior IDE or the selected workspace isstarted for the first time. Otherwise, the Workbench window appears.
NOTE
3. Click Go to Workbench from the Welcome page.
The workbench window appears.
4. Select File > New > CodeWarrior Bareboard Project Wizard, from the CodeWarrior IDE menu bar.
The CodeWarrior Bareboard Project Wizard launches and the Create a CodeWarrior Bareboard Project pageappears.
5. Specify a name for the new project in the Project name text box.
For example, enter the project name as Hello_World.
6. If you do not want to create your project in the default workspace:
Working with ProjectsCreating projects
CodeWarrior for ARMv7 Targeting Manual, Rev. 10.0.8, 01/2016Freescale Semiconductor, Inc. 29

a. Clear the Use default location checkbox.
b. Click Browse and select the desired location from the Browse For Folder dialog.
c. In the Location text box, append the location with the name of the directory in which you want to createyour project. In the Location text box, append the location with the name of the directory in which youwant to create your project.
An existing directory cannot be specified for the project location. If created, theCodeWarrior will prompt an error message.
NOTE
7. Click Next.
The Processor page appears.
8. Select the target processor for the new project, from the Processor list.
9. Select Application from the Project Output group, to create an application with .elf extension, thatincludes information required to debug the project.
10.Click Next.
The Debug Target Settings page appears.
11.Select a supported connection type (hardware or emulator), from the Debugger Connection Types group.Your selection determines the launch configurations that you can include in your project.
12.Select the board you are targeting, from the Board drop-down list. You can select a QDS or Tower, or anIOT or RDB board, depending on the processor selected on the Processor page.
13.Select the launch configurations that you want to include in your project and the corresponding connection,from the Launch group.
14.Select the interface to communicate with the hardware, from the Connection Type drop-down list.
15.Enter the IP address of the TAP device in the TAP address text box. This option is disabled and cannot beedited, if you select CodeWarrior TAP (over USB) from the Connection Type drop-down list. This option isavailable only if CodeWarrior TAP (over Ethernet) is selected as the connection type. CMSIS-DAP is thedefault connection type for Tower boards.
16.Click Next.
The Build Settings page appears.
17.Select the programming language, you want to use, from the Language group.
The language you select determines the libraries that are linked with your program and the contents of themain source file that the wizard generates.
18.Select the architecture type used by the new project, from the Build Tools Architecture group.
19.Select a toolchain from the Toolchain group.
Selected toolchain sets up the default compiler, linker, and libraries used to build the new project. Eachtoolchain generates code targeted for a specific platform.
The current release does not include toolchains for Linux applications by default. To addthe required Linux build tools support, you should install the corresponding service packfor the required target.
NOTE
20.Select an option from the Floating Point drop-down list, to prompt the compiler to handle the floating-pointoperations by generating instructions for the selected floating-point unit.
Working with ProjectsCreating projects
CodeWarrior for ARMv7 Targeting Manual, Rev. 10.0.8, 01/201630 Freescale Semiconductor, Inc.

21.Click Next.
The Configurations page appears.
22.Select a processing model option from the Processing Model group.
• Select SMP (One build configuration for all the cores) to generate a single project for the selected cores.This option is disabled for this release.
• Select AMP (One project per core) to generate a separate project for each selected core. The option willalso set the core index for each project based on the core selection.
• Select AMP (One build configuration per core) to generate one project with multiple targets, eachcontaining an .lcf file for the specified core.
23.Select the processor core that executes the project, from the Core index list.
24.Click Next.
25.Click Finish.
The wizard creates an application project according to your specifications. You can access the project fromthe CodeWarrior Projects view on the Workbench.
The new project is ready for use. You can now customize the project by adding your own source code files,changing debugger settings and adding libraries.
2.3.2 Creating CodeWarrior Bareboard Library projectYou can create a CodeWarrior bareboard library project using the CodeWarrior Bareboard Project Wizard.
To create a CodeWarrior bareboard library project, perform these steps:
1. Select Start > All Programs > Freescale CodeWarrior > CW for ARMv7 vnumber > CodeWarrior, wherenumber is the version number of your product.
The Workspace Launcher dialog appears, prompting you to select a workspace to use.
Click Browse to change the default location for workspace folder. You can also selectthe Use this as the default and do not ask again checkbox to set default or selected pathas the default location for storing all your projects.
NOTE
2. Click OK.
The default workspace is accepted. The CodeWarrior IDE launches and the Welcome page appears.
The Welcome page appears only if the CodeWarrior IDE or the selected workspace isstarted for the first time. Otherwise, the Workbench window appears.
NOTE
3. Click Go to Workbench, on the Welcome page.
The workbench window appears.
4. Select File > New > CodeWarrior Bareboard Project Wizard, from the CodeWarrior IDE menu bar.
The CodeWarrior Bareboard Project Wizard launches and the Create a CodeWarrior Bareboard Project pageappears.
5. Specify a name for the new project in the Project name text box.
For example, enter the project name as library_project.
6. If you do not want to create your project in the default workspace:
Working with ProjectsCreating projects
CodeWarrior for ARMv7 Targeting Manual, Rev. 10.0.8, 01/2016Freescale Semiconductor, Inc. 31

a. Clear the Use default location checkbox.
b. Click Browse and select the desired location from the Browse For Folder dialog.
c. In the Location text box, append the location with the name of the directory in which you want to createyour project.
An existing directory cannot be specified for the project location.
NOTE
7. Click Next.
The Processor page appears.
8. Select the target processor for the new project, from the Processor list.
9. Select Static Library from the Project Output group, to create a library with .a extension, that can beincluded in other projects. Library files created using this option do not include board specific details.
10.Click Next.
The Build Settings page appears.
11.Select the programming language, you want to use, from the Language group.
The language you select determines the libraries that are linked with your program and the contents of themain source file that the wizard generates.
12.Select a toolchain from the Toolchain group.
Selected toolchain sets up the default compiler, linker, and libraries used to build the new project. Eachtoolchain generates code targeted for a specific platform.
The current release does not include toolchains for Linux applications by default. To addthe required build tools support, you should install the corresponding service pack forthe required target.
NOTE
13.Select an option from the Floating Point drop-down list, to prompt the compiler to handle the floating-pointoperations by generating instructions for the selected floating-point unit.
14.Click Finish.
The wizard creates a library project according to your specifications. You can access the project from theCodeWarrior Projects view on the Workbench.
The new library project is ready for use. You can now customize the project to match your requirements.
2.3.3 Creating CodeWarrior Linux Application projectYou can create a CodeWarrior Linux application project using the CodeWarrior Linux Project Wizard.
To create a CodeWarrior Linux application project, perform these steps:
1. Select Start > All Programs > Freescale CodeWarrior > CW for ARMv7 vnumber > CodeWarrior , wherenumber is the version number of your product.
The Workspace Launcher dialog appears, prompting you to select a workspace to use.
Click Browse to change the default location for workspace folder. You can also selectthe Use this as the default and do not ask again checkbox to set default or selected pathas the default location for storing all your projects.
NOTE
Working with ProjectsCreating projects
CodeWarrior for ARMv7 Targeting Manual, Rev. 10.0.8, 01/201632 Freescale Semiconductor, Inc.

2. Click OK.
The default workspace is accepted. The CodeWarrior IDE launches and the Welcome page appears.
The Welcome page appears only if the CodeWarrior IDE or the selected workspace isstarted for the first time. Otherwise, the Workbench window appears.
NOTE
3. Click Go to Workbench, on the Welcome page.
The workbench window appears.
4. Select File > New > CodeWarrior Linux Project Wizard, from the CodeWarrior IDE menu bar.
The CodeWarrior Linux Project Wizard launches and the Create a CodeWarrior Linux Project page appears.
5. Specify a name for the new project in the Project name text box.
For example, enter the project name as linux_project.
6. If you do not want to create your project in the default workspace:
a. Clear the Use default location checkbox.
b. Click Browse and select the desired location from the Browse For Folder dialog.
c. In the Location text box, append the location with the name of the directory in which you want to createyour project.
An existing directory cannot be specified for the project location.
NOTE
7. Click Next.
The Processor page appears.
8. Select the target processor for the new project, from the Processor list.
9. Select Application from the Project Output group, to create an application with .elf extension, thatincludes information required to debug the project.
10.Click Next.
The Build Settings page appears.
11.Select a toolchain for Linux applications from the Toolchain group.
Selected toolchain sets up the default compiler, linker, and libraries used to build the new project. Eachtoolchain generates code targeted for a specific platform.
To add the required Linux build tools support, you should install the correspondingservice pack for the required target.
NOTE
12.Select the programming language, you want to use, from the Language group.
The language you select determines the libraries that are linked with your program and the contents of themain source file that the wizard generates.
13.Select the architecture type used by the new project, from the Build Tools Architecture group.
14.Click Next.
The Linux Application page appears.
Working with ProjectsCreating projects
CodeWarrior for ARMv7 Targeting Manual, Rev. 10.0.8, 01/2016Freescale Semiconductor, Inc. 33

15.Select CodeWarrior TRK to use the CodeWarrior Target Resident Kernel (TRK) protocol, to download andcontrol application on the Linux host system.
When debugging a Linux application, you must use the CodeWarrior TRK to managethe communications interface between the debugger and Linux system. For details, seeInstall CodeWarrior TRK on target system on page 125 topic.
NOTE
16.Specify a Remote System Configuration option.
17.In the IP Address text box, enter the IP address of the Linux host system, the project executes on.
18.In the Port text box, enter the port number that the debugger will use to communicate to the Linux hostsystem.
19.In the Remote Download Path text box, enter the absolute path for the host directory, into which thedebugger downloads the application.
20.Click Finish.
The wizard creates a CodeWarrior Linux application project according to your specifications. You can accessthe project from the CodeWarrior Projects view on the Workbench.
The new CodeWarrior Linux application project is ready for use. You can now customize the project to matchyour requirements.
2.4 Building projectsCodeWarrior IDE supports two modes of building projects.
These modes are:
• Manual-Build mode on page 34
• Auto-Build mode on page 35
2.4.1 Manual-Build modeThis section explains the manual mode of building projects.
In large workspaces, building the entire workspace can take a long time if users make changes with a significantimpact on dependent projects. Often there are only a few projects that really matter to a user at a given time.
To build only the selected projects, and any prerequisite projects that need to be built in order to correctly buildthe selected projects, select Project > Build Project from the CodeWarrior IDE menu bar.
Working with ProjectsBuilding projects
CodeWarrior for ARMv7 Targeting Manual, Rev. 10.0.8, 01/201634 Freescale Semiconductor, Inc.

Figure 10: Project Menu- Build Project
Alternatively, right-click the selected project in the CodeWarrior Projects view and select Build Project from thecontext menu.
To build all projects available in the CodeWarrior Projects view, select Project > Build All.
2.4.2 Auto-Build modeThis section explains the automatic mode of building projects.
CodeWarrior IDE takes care of compiling source files automatically. When auto-build is enabled, project buildoccurs automatically in the background every time you change files in the workspace (for example, saving aneditor).
To automatically build all the projects in a workspace, select Project > Build Automatically from the CodeWarriorIDE menu bar.
Working with ProjectsBuilding projects
CodeWarrior for ARMv7 Targeting Manual, Rev. 10.0.8, 01/2016Freescale Semiconductor, Inc. 35

Figure 11: Project Menu-Build Automatically
If auto-build is taking too long and is interfering with ongoing development, it can be turned off. Select Project >Build Automatically from the CodeWarrior IDE menu bar to disable auto-build mode.
It is advised that you do not use the Build Automatically option for C/C++ development.Using this option will result in building the entire project whenever you save a changeto the makefile or source files. This can take a significant amount of time for very largeprojects.
NOTE
Working with ProjectsBuilding projects
CodeWarrior for ARMv7 Targeting Manual, Rev. 10.0.8, 01/201636 Freescale Semiconductor, Inc.

Chapter 3Build PropertiesThis chapter explains build properties for projects. A project can contain multiple build and launch configurations.
A build configuration is a named collection of build tools options. The set of options in a given build configurationcauses the build tools to generate a final binary with specific characteristics. For example, the binary producedby a Debug build configuration might contain symbolic debugging information and have no optimizations, whilethe binary product by a Release build configuration might contain no symbolics and be highly optimized.
This chapter explains:
• Changing build properties on page 37
• Restoring build properties on page 38
• Defining C/C++ build settings and behavior on page 38
• Properties for <project> on page 42
3.1 Changing build propertiesYou can modify the build properties of a project to better suit your needs.
Follow these steps to change build properties:
1. Start the CodeWarrior IDE.
2. In the CodeWarrior Projects view, select the project for which you want to modify the build properties.
3. Select Project > Properties.
The Properties for <project> dialog appears. The left side of this window has a Properties list. This list showsthe build properties that apply to the current project.
4. Expand the C/C++ Build property node.
5. Select Settings.
6. Use the Configuration drop-down list to specify the launch configuration for which you want to modify thebuild properties.
7. Click the Tool Settings tab. The corresponding page appears.
8. From the list of tools on the Tool Settings page, select the tool for which you want to modify properties.
9. Change the settings as per the requirements.
10.Click Apply.
The CodeWarrior IDE saves your new settings.
You can select other tool pages and modify their settings. When you finish, click OK to save your changes andclose the Properties for <project> dialog.
Build PropertiesChanging build properties
CodeWarrior for ARMv7 Targeting Manual, Rev. 10.0.8, 01/2016Freescale Semiconductor, Inc. 37

3.2 Restoring build propertiesYou can modify a build configuration of a project and might choose to restore the build properties to have afactory-default configuration, or to revert to a last-known working build configuration.
To undo your modifications to build properties, click the Restore Defaults button at the bottom of the Propertiesfor <project> dialog.
This changes the values of the options to the absolute default of the toolchain.
3.3 Defining C/C++ build settings and behaviorThe C/C++ Build page includes all builder-specific property pages.
This section contains the following subsections:
• Define build settings
• Define build behavior
Modifying settings such as the Generate makefiles automatically option, might enableor disable some parameters in some situations and change the availability of otherproperty pages.
NOTE
3.3.1 Define build settingsThe Build Settings page of the C/C++ Build page allows you to define build settings for your project.
To define build settings, perform these steps:
1. Start CodeWarrior IDE.
2. In the CodeWarrior Projects view, select the project for which you want to modify the build settings.
3. Select Project > Properties.
The Properties for <project> window appears. The left side of this window has a properties list. This list showsthe build properties that apply to the current project.
4. Select C/C++ Build.
The C/C++ Build page appears.
Build PropertiesRestoring build properties
CodeWarrior for ARMv7 Targeting Manual, Rev. 10.0.8, 01/201638 Freescale Semiconductor, Inc.

Figure 12: C/C++ build page - builder settings
5. In the Builder Settings tab, the builder settings for the selected build configuration appears.
The table below describes the builder settings options.
Table 11: Builder settings options
Group Option Description
Build Configuration Configuration Specifies the type of configurations for the selected project.
Build Configuration Manage configurations Click to open the Manage Configurations dialog that lets youset configurations based on the specified toolchains of theselected project.
You can also create new configurations, rename an existingconfiguration, or remove the ones that are no longer required.
Builder Builder type Specifies the type of builder to use:
• Internal builder - Builds C/C++ programs using a compilerthat implements the C/C++ Language Specifications.
• External builder - External tools let you configure and runprograms and Ant buildfiles using the Workbench, whichcan be saved and run at a later time to perform a build.
Builder Use default buildcommand
Select to indicate that you want to use the default makecommand.
Clear when you want to use a new make command. Thisoption is only available when the Builder type option is set toExternal.
Table continues on the next page...
Build PropertiesDefining C/C++ build settings and behavior
CodeWarrior for ARMv7 Targeting Manual, Rev. 10.0.8, 01/2016Freescale Semiconductor, Inc. 39

Table 11: Builder settings options (continued)
Group Option Description
Builder Build command Specifies the default command used to start the build utilityfor your specific toolchain. Use this field if you want to use abuild utility other than the default make command.
Builder Variables Click to open the Select build variable dialog and add thedesired environment variables and custom variables to thebuild command.
Makefile generation Generate Makefilesautomatically
Select to enable Eclipse change between two different CDTmodes: it either uses the customer's makefile for the build, ifone exists, or it generates makefiles for the user.
Makefile generation Expand Env. VariableRefs in Makefiles
Select to define whether environment variables should beexpanded in makefile.
Build location Build directory Specifies the location where the build operation takes place.This location will contain the generated artifacts from the buildprocess. This option appears disabled when the GenerateMakefiles automatically option is enabled.
Build location Workspace Click to open the Folder Selectiondialog and select aworkspace location for the project. This is the directory thatwill contain the plug-ins and features to build, including anygenerated artifacts.
Build location File system Click to open the Browse For Folder dialog and select a folder.
Build location Variables Click to open the Select build variable dialog and select avariable to specify as an argument for the build directory, orcreate and configure simple build variables which you canreference in build configurations that support variables.
6. Make the desired changes and click OK.
The Properties for <project> window will close.
3.3.2 Define build behaviorThe Behaviour page of the C/C++ Build page allows you to define build behavior for your project.
To define build behavior, perform these steps:
1. Start CodeWarrior IDE.
2. In the CodeWarrior Projects view, select the project for which you want to modify the build settings.
3. Select Project > Properties.
The Properties window appears. The left side of this window has a properties list. This list shows the buildproperties that apply to the current project.
4. Select C/C++ Build.
The C/C++ Build page appears.
5. Click the Behaviour tab.
The behavior settings for the selected build configuration appears.
The table below describes the behavior settings options.
Build PropertiesDefining C/C++ build settings and behavior
CodeWarrior for ARMv7 Targeting Manual, Rev. 10.0.8, 01/201640 Freescale Semiconductor, Inc.

Table 12: Behavior options
Group Option Description
Build settings Enable project specificsettings
Select if you want to enable project specific settings.
Build settings Stop on first build error Select to stop building when Eclipse encounters anerror.
Clearing this option is helpful for building large projects asit enables make to continue making other independentrules even when one rule fails.
Configure WorkspaceSettings
Enable parallel build Select to activate the generation of parallel builds.However, you need to determine the number of paralleljobs to perform:
• Use optimal jobs number - Lets the system determinethe optimal number of parallel jobs to perform.
• Use parallel jobs - Lets you specify the maximumnumber of parallel jobs to perform.
• Use unlimited jobs - Lets the system perform unlimitedjobs.
Workbench BuildBehavior
Workbench build type Specifies the builder settings when instructed to build,rebuild, and clean.
Workbench BuildBehavior
Build on resource save(Auto build)
Select to build your project whenever resources aresaved. By default, this option is selected and buildsoccur automatically each time resources are modified.
Clear if you do want that the build occurs only manuallyusing a menu item.
Workbench BuildBehavior
Build (Incremental Build) Defines what the standard builder will call when anincremental build is performed.
Workbench BuildBehavior
Variables Click to open the Select build variable dialog and addvariables to the make build target command.
Workbench BuildBehavior
Clean Defines what the standard builder calls when a clean isperformed. The make clean is defined in the makefile.
Workbench BuildBehavior
Variables Click to open the Select build variable dialog and addvariables to the make build target command.
6. Make the desired changes and click OK.
The Properties for <project> window will close.
Build PropertiesDefining C/C++ build settings and behavior
CodeWarrior for ARMv7 Targeting Manual, Rev. 10.0.8, 01/2016Freescale Semiconductor, Inc. 41

3.4 Properties for <project>The Properties for <project> window shows the corresponding build properties for a bareboard project.
Figure 13: Build properties
The following table lists the build properties specific to developing software for.
The properties that you specify in the Tool Settings panels apply to the selected build tool on the Tool Settingspage of the Properties for <project> dialog.
Table 13: Build properties for bareboard project
Tool Settings Sub Tool Settings
Target Processor on page 43 Target Processor on page 43
Debugging on page 44 Debugging on page 44
ARM Sourcery GCC Assembler on page44
Preprocessor on page 45
Warnings on page 45
ARM Sourcery GCC C Compiler on page46
Preprocessor on page 46
Table continues on the next page...
Build PropertiesProperties for <project>
CodeWarrior for ARMv7 Targeting Manual, Rev. 10.0.8, 01/201642 Freescale Semiconductor, Inc.

Table 13: Build properties for bareboard project (continued)
Tool Settings Sub Tool Settings
Optimization on page 47
Warnings on page 48
Miscellaneous on page 48
ARM Sourcery GCC C Linker on page49
General on page 50
Libraries on page 50
Miscellaneous on page 50
3.4.1 Target ProcessorThis section describes the options in the Target Processor panel.
The options are listed in the table below.
Table 14: Target Processor options
Option Description
Processor Use to specify the processor.
Default: cortex-a7
Thumb (-mthumb) Select to have the processor generate Thumb code instructions. Clear toprevent the processor from generating Thumb code instructions. The IDEenables this setting only for architectures and processors that support theThumb instruction set.
Default: Clear
Thumb interwork (-mthumb-interwork)
Use to generate suitable interworking veneers when it links the assembleroutput. You must enable this option if you write ARM code that you want tointerwork with Thumb code or vice versa. The only functions that need to becompiled for interworking are the functions that are called from the otherstate. You must ensure that your code uses the correct interworking returninstructions.
Default: Clear
Endianness Use to specify the byte order of the target hardware architecture:
• Little Endian: Right-most bytes (those with a higher address) are mostsignificant
• Big Endian: Left-most bytes (those with a lower address) are mostsignificant
Default: Toolchain Default
Float ABI Use to specify the float Appiication Binary Interface (ABI).
Default: FP instructions (-mfloat-abi=hard)
Table continues on the next page...
Build PropertiesProperties for <project>
CodeWarrior for ARMv7 Targeting Manual, Rev. 10.0.8, 01/2016Freescale Semiconductor, Inc. 43

Table 14: Target Processor options (continued)
Option Description
FPU Type Use to specify the type of floating-point unit (FPU) for the target hardwarearchitecture: The assembler might display error messages or warnings if theselected FPU architecture is not compatible with the target architecture.
Default: VFPv3-D16 (-mfpu=vfpv3-d16)
3.4.2 DebuggingThis section describes the options in the Debugging panel.
The options are listed in the table below.
Table 15: Debugging options
Option Description
Debug level Specify the debug levels:
• None - No Debug level.
• Minimal ( -g1) - The compiler provides minimal debugging support.
• Default ( -g) - The compiler generates DWARF 1.xconforming debugginginformation.
• Maximum ( -g3) - The compiler provides maximum debugging support.
Debug format Specify the debug formats for the compiler.
Generate prof information (-p) Generates extra code to write profile information suitable for the analysisprogram prof. You must use this option when compiling the source files youwant data about, and you must also use it when linking.
Generate gprof information (-pg)
Generates extra code to write profile information suitable for the analysisprogram gprof. You must use this option when compiling the source files youwant data about, and you must also use it when linking.
Other debugging flags Specify additional command line options; type in custom debugging flags thatare not otherwise available in the UI.
3.4.3 ARM Sourcery GCC AssemblerThis section describes the options in the ARM Sourcery GCC Assembler panel.
The options are listed in the table below.
Table 16: ARM sourcery GCC assembler options
Option Description
Command Shows the location of the assembler executable file. Default:arm-none-eabi-gcc
All Options Shows the actual command line the assembler will be called with. Default: -xassembler-with-cpp -Wall -Wa,-adhlns="[email protected]" -c -fmessage-length=0 -mcpu=cortex-a7 -mfloat-abi=hard -mfpu=vfpv3-d16 -g -gdwarf-2
Table continues on the next page...
Build PropertiesProperties for <project>
CodeWarrior for ARMv7 Targeting Manual, Rev. 10.0.8, 01/201644 Freescale Semiconductor, Inc.

Table 16: ARM sourcery GCC assembler options (continued)
Option Description
Expert settings
Command linepatterns
Shows the expert settings command line parameters. Default: "${ARMv7GCCToolsDir}/${COMMAND}" ${INPUTS} ${FLAGS} ${OUTPUT_FLAG}${OUTPUT_PREFIX}${OUTPUT}
This section contains the following subsections:
• Preprocessor on page 45
• Warnings on page 45
3.4.3.1 PreprocessorUse this panel to specify preprocessor-related settings of the ARM sourcery GCC assembler.
The available options are listed in the table below.
Table 17: Preprocessor settings of ARM sourcery GCC assembler
Option Description
Use preprocessor Select this option to use the preprocessor for the assembler.
Do not search systemdirectories (-nostdinc)
Select this option if you do not want the assembler to search the systemdirectories. By default, this checkbox is clear. The assembler performs a fullsearch that includes the system directories.
Preprocess only (-E) Select this option if you want the assembler to preprocess source files and notto run the compiler. By default, this checkbox is clear and the source files arenot preprocessed.
Defined symbols (-D) Use this option to specify the substitution strings that the assembler applies toall the assembly-language modules in the build target. Enter just the stringportion of a substitution string. The IDE prepends the -D token to each stringthat you enter. For example, entering opt1 x produces this result on thecommand line: -Dopt1 x. Note: This option is similar to the DEFINE directive,but applies to all assembly-language modules in a build target.
Undefined symbols (-U) Undefines the substitution strings you specify in this panel.
3.4.3.2 WarningsUse this panel to specify warning-related settings of the ARM sourcery GCC assembler.
The available options are listed in the table below.
Table 18: Warning options for ARM sourcery GCC assembler
Option Description
Check syntax only (-fsynatx-only)
Check the code for syntax errors, but don't do anything beyond that.
Table continues on the next page...
Build PropertiesProperties for <project>
CodeWarrior for ARMv7 Targeting Manual, Rev. 10.0.8, 01/2016Freescale Semiconductor, Inc. 45

Table 18: Warning options for ARM sourcery GCC assembler (continued)
Option Description
Pedantic (-pedantic) Issue all the warnings demanded by strict ISO C and ISO C++; reject allprograms that use forbidden extensions, and some other programs that donot follow ISO C and ISO C++. For ISO C, follows the version of the ISO Cstandard specified by any -std option used.
Pedantic warnings as errors (-pedantic-errors)
Like -Wpedantic, except that errors are produced rather than warnings.
Inhibit all warnings (-w) Inhibit all warnings
All warnings (-Wall) This enables all the warnings about constructions that some users considerquestionable, and that are easy to avoid (or modify to prevent the warning),even in conjunction with macros.
Extra warnings (-Wextra) This enables some extra warning flags that are not enabled by -Wall.
Warnings as errors (-Werror) Make all warnings into errors.
3.4.4 ARM Sourcery GCC C CompilerThis section describes the options in the ARM Sourcery GCC C Compiler panel.
The options are listed in the table below.
Table 19: ARM sourcery GCC C compiler options
Option Description
Command Shows the location of the compiler executable file. Default: arm-none-eabi-gcc
All Options Shows the actual command line the compiler will be called with.
Expert settings
Command linepatterns
Shows the expert settings command line parameters. Default: "${ARMv7GCCToolsDir}/${COMMAND}" ${INPUTS} ${FLAGS} ${OUTPUT_FLAG}${OUTPUT_PREFIX}${OUTPUT}
This section contains the following subsections:
• Preprocessor on page 46
• Optimization on page 47
• Warnings on page 48
• Miscellaneous on page 48
3.4.4.1 PreprocessorUse this panel to specify preprocessor-related settings of the ARM sourcery GCC C compiler.
The available options are listed in the table below.
Build PropertiesProperties for <project>
CodeWarrior for ARMv7 Targeting Manual, Rev. 10.0.8, 01/201646 Freescale Semiconductor, Inc.

Table 20: Preprocessor settings of ARM sourcery GCC C compiler
Option Description
Do not search systemdirectories (-nostdinc)
Select this option if you do not want the compiler to search the systemdirectories. By default, this checkbox is clear. The compiler performs a fullsearch that includes the system directories.
Preprocess only (-E) Select this option if you want the compiler to preprocess source files and notto run the compiler. By default, this checkbox is clear and the source files arenot preprocessed.
Defined symbols (-D) Use this option to specify the substitution strings that the compiler appliesmodules in the build target. Enter just the string portion of a substitution string.The IDE prepends the -D token to each string that you enter. For example,entering opt1 x produces this result on the command line: -Dopt1 x. Note: Thisoption is similar to the DEFINE directive, but applies to all assembly-languagemodules in a build target.
Undefined symbols (-U) Undefines the substitution strings you specify in this panel.
3.4.4.2 OptimizationUse this panel to specify optimization-related settings of the ARM sourcery GCC C compiler.
The available options are listed in the table below.
Table 21: Optimization settings of ARM sourcery GCC C compiler
Option Description
Optimization level Select the required optimization level
• None (-O0) - Reduce compilation time and make debugging produce theexpected results. This is the default.
• Optimize (-O1) - Optimize. Optimizing compilation takes somewhat moretime, and a lot more memory for a large function.
• Optimize more (-O2) - Optimize even more. GCC performs nearly allsupported optimizations that do not involve a space-speed tradeoff. Ascompared to -O, this option increases both compilation time and theperformance of the generated code.
• Optimize most (-O3) - Optimize yet more. -O3 turns on all optimizationsspecified by -O2 and also turns on the -finline-functions, -funswitch-loops, -fpredictive-commoning, -fgcse-after-reload, -ftree-loop-vectorize, -ftree-slp-vectorize, -fvect-cost-model,-ftree-partial-pre and -fipa-cp-clone options.
• Optimize size (-Os) - Optimize for size. -Os enables all -O2 optimizationsthat do not typically increase code size. It also performs furtheroptimizations designed to reduce code size.
Table continues on the next page...
Build PropertiesProperties for <project>
CodeWarrior for ARMv7 Targeting Manual, Rev. 10.0.8, 01/2016Freescale Semiconductor, Inc. 47

Table 21: Optimization settings of ARM sourcery GCC C compiler (continued)
Option Description
Pack structures Packed data structures are supported in the compiler with the keyword__packed or __attribute__((packed)). There is no code generationsupport for accessing un-aligned, packed data members.Users shouldexercise caution when accessing packed data structures because datamight not be aligned.
Short enumerations Select to use short enumerated constants and is equivalent to -fshort-enums.
Function sections Select to use function sections and is equivalent to -ffunction-sections.
Data sections Select to use short data sections and is equivalent to -ffunction-sections.
Other optimization flags Specify additional command line options; type in custom optimization flagsthat are not otherwise available in the UI.
3.4.4.3 WarningsUse this panel to specify warning-related settings of the ARM sourcery GCC C compiler.
The available options are listed in the table below.
Table 22: Warning options for ARM sourcery GCC C compiler
Option Description
Check syntax only Select the code for syntax errors, but don't do anything beyond that.
No common Select this option if you want to issue all the warnings demanded by strictISO C and ISO C++; reject all programs that use forbidden extensions, andsome other programs that do not follow ISO C and ISO C++. For ISO C,follows the version of the ISO C standard specified by any ̀ -std' option used.
Pedantic Issue all the warnings demanded by strict ISO C and ISO C++; reject allprograms that use forbidden extensions, and some other programs that donot follow ISO C and ISO C++. For ISO C, follows the version of the ISO Cstandard specified by any -std option used.
Pedantic warnings as errors Like -Wpedantic, except that errors are produced rather than warnings.
Inhibit all warnings Inhibit all warnings
All warnings This enables all the warnings about constructions that some users considerquestionable, and that are easy to avoid (or modify to prevent the warning),even in conjunction with macros.
Extra warnings This enables some extra warning flags that are not enabled by -Wall.
Warnings as errors Make all warnings into errors.
3.4.4.4 MiscellaneousYou can use this panel to specify miscellaneous settings related to the ARM sourcery GCC C compiler.
The available options are listed in the table below.
Build PropertiesProperties for <project>
CodeWarrior for ARMv7 Targeting Manual, Rev. 10.0.8, 01/201648 Freescale Semiconductor, Inc.

Table 23: Miscellaneous ARM sourcery GCC C compiler options
Option Description
LanguageStandard
Select the programming language or standard to which the compiler should conform.
• ISO C90 (-ansi) - Select this option to compile code written in ANSI standard C. Thecompiler does not enforce strict standards. For example, your code can contain someminor extensions, such as C++ style comments (//), and $ characters in identifiers.
• ISO C99 (-std=c99) - Select this option to instruct the compiler to enforce stricteradherence to the ANSI/ISO standard.
• Compiler Default (ISO C90 with GNU extensions) - Select this option to enforceadherence to ISO C90 with GNU extensions.
• ISO C99 with GNU Extensions (-std=gnu99)
Assembler Listing(-Wa, -adhlns="[email protected]")
Enables the assembler to create a listing file as it compiles assembly language into objectcode.
Do not inlinefunctions
Select this option if you do not want to inline function.
'char' is signed Select this option if you want to ensure that the char is signed.
Bitfields areunsigned
Select this option to ensure bitfields are unsigned.
Verbose (-v) Select this option if you want the IDE to show each command-line that it passes to theshell, along with all progress, error, warning, and informational messages that the toolsemit. This setting is equivalent to specifying the -v command-line option. By default, thischeckbox is clear. The IDE displays just error messages that the compiler emits. The IDEsuppresses warning and informational messages.
Other compilerflags
Specify additional command line options; type in custom flags that are not otherwiseavailable in the UI.
3.4.5 ARM Sourcery GCC C LinkerThis section describes the options in the ARM Sourcery GCC C Linker panel.
The options are listed in the table below.
Table 24: ARM sourcery GCC C linker options
Option Description
Command Shows the location of the linker executable file. Default:arm-none-eabi-gcc
All Options Shows the actual command line the assembler will be called with. Default: -T "${ProjDirPath}"/Linker_Files/aarch64elf.x -nostartfiles -nodefaultlibs-L"C:\Users\b14174\workspace-15\FirstProjectTest" -Wl,-Map,"FirstProjectTest.map"
Expert settings
Command linepatterns
Shows the expert settings command line parameters. Default: ${COMMAND} ${cross_toolchain_flags} ${FLAGS} ${OUTPUT_FLAG} ${OUTPUT_PREFIX}${OUTPUT} ${INPUTS}
Build PropertiesProperties for <project>
CodeWarrior for ARMv7 Targeting Manual, Rev. 10.0.8, 01/2016Freescale Semiconductor, Inc. 49

This section contains the following subsections:
• General on page 50
• Libraries on page 50
• Miscellaneous on page 50
3.4.5.1 GeneralUse this panel to specify general settings of the ARM sourcery GCC C linker.
The available options are listed in the table below.
Table 25: General ARM sourcery GCC C linker options
Option Description
Script file ${ProjDirPath}/Linker_Files/LS1021A_QDS_Core0_ram.ld
Do not use standard startfiles
Marks the object that the search for dependencies of this object will ignore startfiles
Do not use default libraries Marks the object that the search for dependencies of this object will ignore anydefault library search paths.
No startup or default libs Marks the object that the search for dependencies of this object will ignore anydefault library search paths and start files.
Remove unused sections List all sections removed by garbage collection. The listing is printed on stderr.This option is only effective if garbage collection has been enabled via the `--gc-sections') option.
Print removed sections List all sections removed by garbage collection. The listing is printed on stderr.This option is only effective if garbage collection has been enabled via the `--gc-sections') option.
Omit all symbol information Omit all symbol information from the output file.
3.4.5.2 LibrariesUse this panel to specify library-related settings of the ARM sourcery GCC C linker.
The available options are listed in the table below.
Table 26: Library settings for ARM sourcery GCC C linker
Option Description
Libraries (-l) This option changes the build target's search order of access paths to start with the systempaths list. The compiler can search #include files in several different ways. You can alsoset the search order as follows: For include statements of the form #include"xyz", thecompiler first searches user paths, then the system paths. For include statements of theform #include<xyz>, the compiler searches only system paths. This option is global.
Library searchpath (-L)
Use this option to specify the include library search path.
3.4.5.3 MiscellaneousYou can use this panel to specify miscellaneous settings related to the ARM sourcery GCC C linker.
The available options are listed in the table below.
Build PropertiesProperties for <project>
CodeWarrior for ARMv7 Targeting Manual, Rev. 10.0.8, 01/201650 Freescale Semiconductor, Inc.

Table 27: Miscellaneous ARM sourcery GCC C linker options
Option Description
Linker flags This option specifies the flags to be passed with the linker file.
Other objects The linker searches the paths in the order shown in this list.
Generate Map This option specifies the map filename. Default: $ {BuildArtifactFileBaseName}.map
Cross Reference (-Xlinker --cref)
Select this option to instruct the linker to list cross-reference information on symbols. Thisincludes where the symbols were defined and where they were used, both inside andoutside macros.
Print link map (-Xlinker --printf-map)
Select this option to instruct the linker to print the map file.
Verbose (-v) Select this option to show verbose information, including hex dump of program segmentsin applications; default setting
Other flags Specify additional command line options for the linker; type in custom flags that are nototherwise available in the UI.
Build PropertiesProperties for <project>
CodeWarrior for ARMv7 Targeting Manual, Rev. 10.0.8, 01/2016Freescale Semiconductor, Inc. 51

Build PropertiesProperties for <project>
CodeWarrior for ARMv7 Targeting Manual, Rev. 10.0.8, 01/201652 Freescale Semiconductor, Inc.

Chapter 4Debug ConfigurationsA CodeWarrior project can have multiple associated debug configurations. A debug configuration is a namedcollection of settings that the CodeWarrior tools use.
Debug configurations let you specify settings, such as:
• The files that belong to the debug configuration
• Behavior of the debugger and the related debugging tools
This chapter explains:
• Using Debug Configurations dialog on page 53
• Customizing Debug Configurations on page 75
• Reverting Debug Configuration settings on page 77
4.1 Using Debug Configurations dialogThe Debug Configurations dialog allows you to specify debugger-related settings for your CodeWarriorproject.
As you modify a launch configuration's debugger settings, you create pending, orunsaved, changes to that launch configuration. To save the pending changes, you mustclick the Apply button of the Debug Configurations dialog or click the Close button andthen the Yes button.
NOTE
Table 28: Debug Configuration tabs
Main on page 54
Arguments on page 58
Debugger on page 59 Debug on page 60
Exceptions on page 62
Interrupts on page 62
Download on page 63
PIC on page 65
Other Executables on page 66
Symbolics on page 67
OS Awareness on page 68
Source on page 72
Environment on page 73
Common on page 74
Debug ConfigurationsUsing Debug Configurations dialog
CodeWarrior for ARMv7 Targeting Manual, Rev. 10.0.8, 01/2016Freescale Semiconductor, Inc. 53

4.1.1 MainUse this page to specify the project and application you want to run or debug.
You can also specify a remote system configuration on this tab. The remote system configuration is separatedinto connection and system configurations allowing you to define a single system configuration that can bereferred to by multiple connection configurations. The launch configurations refer to a connection configuration,which in turn refers to a system configuration.
The options displayed on the Main tab vary depending on the selected debug sessiontype.
NOTE
The following figure shows the Main tab.
Figure 14: Debug Configurations-Main tab
The table below lists the various options available on the Main page.
Debug ConfigurationsUsing Debug Configurations dialog
CodeWarrior for ARMv7 Targeting Manual, Rev. 10.0.8, 01/201654 Freescale Semiconductor, Inc.

Table 29: Main tab options
Option Description
Debug session type Specifies the options to initiate a debug session using pre-configured debugconfigurations. The options include:
• Download - Resets the target if the debug configuration specifies the action.Further, the command stops the target, (optionally) runs an initializationscript, downloads the specified ELF file, and modifies the program counter(PC).
• Attach - Assumes that code is already running on the board and thereforedoes not run a target initialization file. The state of the running program isundisturbed. The debugger loads symbolic debugging information for thecurrent build target's executable. The result is that you have the samesource-level debugging facilities you have in a normal debug session (theability to view source code and variables, and so on). The function doesnot reset the target, even if the launch configuration specifies this action.Further, the command loads symbolics, does not stop the target, run aninitialization script, download an ELF file, or modify the program counter(PC).
The debugger does not support restartingdebugging sessions that you start by attaching thedebugger to a process.
NOTE
• Connect - Runs the target initialization file specified in the RSEconfiguration to set up the board before connecting to it. The Connectdebug session type does not load any symbolic debugging information forthe current build target's executable thereby, denying access to source-level debugging and variable display. The Connect command resets thetarget if the launch configuration specifies this action. Further, thecommand stops the target, (optionally) runs an initialization script, does notload symbolics, download an ELF file, or modify the program counter (PC).
The default debugger configuration causes thedebugger to cache symbolics between sessions.However, selecting the Connect option invalidatesthis cache. If you must preserve the contents ofthe symbolics cache, and you plan to use theConnect option, clear the Cache SymbolicsBetween Sessions checkbox in the Symbolics tabpage.
NOTE
• Custom - Provides user an advantage to create a custom debugconfiguration.
Table continues on the next page...
Debug ConfigurationsUsing Debug Configurations dialog
CodeWarrior for ARMv7 Targeting Manual, Rev. 10.0.8, 01/2016Freescale Semiconductor, Inc. 55

Table 29: Main tab options (continued)
Option Description
C/C++ application Specifies the settings for the C/C++ application. The options include:
• Project - Specifies the name of the project associated with the selecteddebug launch configuration. Click Browse to select a different project.
• Application - Specifies the name of the C or C++ application executable.
This option is disabled when Connect debugsession type is selected.
NOTE
• Search Project - Click to open the Program Selection dialog box and selecta binary.
This option is disabled when Connect debugsession type is selected.
NOTE
• Variables - Click to open the Select build variable dialog and select the buildvariables to be associated with the program.
The dialog displays an aggregation of multiple variable databases and notall these variables are suitable to be used from a build environment. Givenbelow are the variables that should be used:
ProjDirPath - returns the absolute path of the current project location inthe file system
${ProjDirPath}/Source/main.c"
workspace_loc - returns the absolute path of a workspace resource in thefile system, or the location of the workspace if no argument is specified
${workspace_loc:/ProjectName/Source main.c"${workspace_loc}
Gnu_Make_Install_Dir - returns the absolute path of the GNU make.exetool
${Gnu_Make_Install_Dir}\make.exe
This option is disabled when Connect debugsession type is selected.
NOTE
Table continues on the next page...
Debug ConfigurationsUsing Debug Configurations dialog
CodeWarrior for ARMv7 Targeting Manual, Rev. 10.0.8, 01/201656 Freescale Semiconductor, Inc.

Table 29: Main tab options (continued)
Option Description
Build (if required) beforelaunching
Controls how auto build is configured for the launch configuration. Changingthis setting overrides the global workspace setting and can provide somespeed improvements.
These options are set to default and collapsedwhen Connect debug session type is selected.
NOTE
The options include:
• Build configuration - Specifies the build configuration either explicitly or usethe current active configuration.
• Select configuration using `C/C++ Application' - Select/clear to enable/disable automatic selection of the configuration to be built, based on thepath to the program.
• Enable auto build - Enables auto build for the debug configuration whichcan slow down launch performance.
• Disable auto build - Disables auto build for the debug configuration whichmay improve launch performance. No build action will be performed beforestarting the debug session. You have to rebuild the project manually.
• Use workspace settings (default) - Uses the global auto build settings.
• Configure Workspace Settings - Opens the Launching preference panelwhere you can change the workspace settings. It will affect all projects thatdo not have project specific settings.
Target settings Specifies the connection and other settings for the target. The optionsinclude:
• Connection - Specifies the applicable Remote System configuration.
• Edit - Click to edit the selected Remote System configuration.
• New - Click to create a new Remote System configuration for the selectedproject and application.
• Execute reset sequence - Select to apply reset settings, specified in thetarget configuration, when attaching to a target. Alternatively, clear theoption to ignore reset settings.
This option is not available when Attach debugsession type is selected.
NOTE
• Execute initialization script(s) - Select to execute the initialization script(s),specified in the target configuration, when attaching to a target.Alternatively, clear the option to ignore the initialization script(s).
• Target (multicore only) - Select the core to be debugged. For SMPdebugging, select all cores in the SMP group.
Debug ConfigurationsUsing Debug Configurations dialog
CodeWarrior for ARMv7 Targeting Manual, Rev. 10.0.8, 01/2016Freescale Semiconductor, Inc. 57

4.1.2 ArgumentsUse this tab to specify the program arguments that an application uses and the working directory for a run ordebug configuration.
Figure 15: Debug Configurations-Arguments tab
The table below lists the various options available on the Arguments page.
Table 30: Arguments tab options
Option Description
Program arguments Specifies the arguments passed on the command line.
Variables Click to select variables by name to include in the program arguments list.
Working Directory Specifies the run/debug configuration working directory.
Use default Select to specify the default run/debug configuration working directory, whichis a directory within the current project directory, or clear to specify a differentworkspace, a file system location, or a variable. For Linux applications, thedefault working directory is the current directory on the process that startedCodeWarrior TRK on the target. This should not be confused with thedirectory where the CodeWarrior TRK binary resides.
Workspace Click to specify the path of, or browse to, a workspace relative workingdirectory.
File System Click to specify the path of, or browse to, a file system directory.
Variables Click to specify variables by name to include in the working directory.
Debug ConfigurationsUsing Debug Configurations dialog
CodeWarrior for ARMv7 Targeting Manual, Rev. 10.0.8, 01/201658 Freescale Semiconductor, Inc.

4.1.3 DebuggerUse this tab to configure the debugger settings.
The Debugger tab presents different pages for specifying different configuration settings specific to the selecteddebugger type.
The content in the Debugger Options panel changes, depending on the Debug sessiontype selected on the Main page.
NOTE
Figure 16: Debug Configurations-Debugger tab
The different pages available on the Debugger tab are grouped in the Debugger options group. The pages arelisted below:
• Debug on page 60
• Exceptions on page 62
• Interrupts on page 62
• Download on page 63
• PIC on page 65
• Other Executables on page 66
• Symbolics on page 67
• OS Awareness on page 68
Debug ConfigurationsUsing Debug Configurations dialog
CodeWarrior for ARMv7 Targeting Manual, Rev. 10.0.8, 01/2016Freescale Semiconductor, Inc. 59

4.1.3.1 DebugUse this page to specify the program execution options, breakpoint and watchpoint options, and target accessbehavior.
Figure 17: Debugger options-Debug page
The options displayed on the Debug tab varies depending on the selected launchconfiguration.
NOTE
The table below lists the various options available on the Debug page.
Table 31: Debugger options - Debug
Option Description
Initialize program counter at Controls the initialization of program counter.
• Program entry point - Select to initialize the program counter ata specified program entry pont.
• User specified - Select to initialize the program counter at auser-specified function. The default location is main.
Disabling this option will also disablethe Resume program and Stop onstartup at options.
NOTE
Table continues on the next page...
Debug ConfigurationsUsing Debug Configurations dialog
CodeWarrior for ARMv7 Targeting Manual, Rev. 10.0.8, 01/201660 Freescale Semiconductor, Inc.

Table 31: Debugger options - Debug (continued)
Option Description
Resume program Select to resume the execution after the program counter isinitialized.
Disabling this option will also disablethe Stop on startup at option.
NOTE
Stop on startup at Stops program at specified location. When cleared, the programruns until you interrupt it manually, or until it hits a breakpoint.
• Program entry point - Select to stop the debugger at a specifiedprogram entry point.
• User specified - Select to stop the debugger at a user-specifiedfunction. The default location is main.
Stop on exit Select this option to have the debugger set a breakpoint at thecode's exit point. For multicore projects, when you set this optionfor one project on one core, it is set for projects on the other cores.Clear this option to prevent the debugger from setting a breakpointat the code's exit point.
Install regular breakpoints as Select this option to install breakpoints as either:
• Regular
• Hardware
• Software
Clear this option to install breakpoints as Regular breakpoints.
Restore watchpoints Select this option to restore previous watchpoints.
Disable display of variable values bydefault
Select this option to disable the display of variable values. Clearthis option to enable the display of variable values
Disable display of register values by default Select this option to disable the display of register values. Clearthis option to enable the display of register values
Refresh while running period (seconds) Specifies the refresh period used when a view is configured torefresh, while the application is running. By default, the refreshperiod is set to two seconds.
Debug ConfigurationsUsing Debug Configurations dialog
CodeWarrior for ARMv7 Targeting Manual, Rev. 10.0.8, 01/2016Freescale Semiconductor, Inc. 61

4.1.3.2 ExceptionsUse this page to specify the processor exceptions you want the CodeWarrior debugger to catch.
Figure 18: Debugger options- Exceptions page
Selecting the checkboxes, available on the Exceptions page, configures the core to automatically halt when thecorresponding exception is taken. The debugger stops at the entry point of the interrupt handler for the selectedexception, allowing you to inspect the processor state and continue debugging from there.
4.1.3.3 InterruptsUse this tab to inhibit or allow interrupts.
Debugging an application involves single-stepping through code. However, if you do not modify the behavior ofinterrupts that are part of normal code execution, an interrupt may occur and the debugger jumps to the interrupthandler code, rather than single-stepping to the next instruction. Therefore, you must mask, or inhibit, certaininterrupt levels to prevent the interrupts from happening. When inhibiting interrupts, you can mask interruptsbelow a level that you specify.
Debug ConfigurationsUsing Debug Configurations dialog
CodeWarrior for ARMv7 Targeting Manual, Rev. 10.0.8, 01/201662 Freescale Semiconductor, Inc.

Figure 19: Debugger options-Interrupts page
The table below lists the various options available on the Interrupts page.
Table 32: Debugger options - Interrupts
Option Description
Disable interrupts duringstepping
Select this checkbox if you want to disable interrupts during stepping.
4.1.3.4 DownloadUse this page to specify which executable code sections the debugger downloads to the target, and whetherthe debugger should read back those sections and verify them.
Selecting all options in the Program Download Options group significantly increasesdownload time.
NOTE
Initial Launch options apply to the first debugging session. Successive Runs options apply to subsequentdebugging sessions.
The Download options control whether the debugger downloads the specified Program Section Data type to thetarget hardware. The Verify options control whether the debugger reads the specified Program Section Datatype from the target hardware and compares the read data against the data written to the device.
Debug ConfigurationsUsing Debug Configurations dialog
CodeWarrior for ARMv7 Targeting Manual, Rev. 10.0.8, 01/2016Freescale Semiconductor, Inc. 63

Figure 20: Debugger options-Download page
The table below lists the various options available on the Download page.
Table 33: Debugger options - Download
Section Data Type Explanation
Perform standard download Controls download of the target application using memory write command.
First Represents a group of settings that are used when an application isdebugged for the first time.
Subsequent Represents a group of settings that are used when the application isdebugged subsequent times. To make these settings be used duringdebugging, you need to select the Cache Symbolics Between Sessionsoption on the Symbolics page.
Executable Controls downloading and verification for executable sections. Checkappropriate checkboxes to specify downloading and verifications, for initiallaunch and for successive runs.
Constant Data Controls downloading and verification for constant-data sections. Checkappropriate checkboxes to specify downloading and verifications, for initiallaunch and for successive runs.
Table continues on the next page...
Debug ConfigurationsUsing Debug Configurations dialog
CodeWarrior for ARMv7 Targeting Manual, Rev. 10.0.8, 01/201664 Freescale Semiconductor, Inc.

Table 33: Debugger options - Download (continued)
Section Data Type Explanation
Initialized Data Controls downloading and verification for initialized-data sections. Checkappropriate checkboxes to specify downloading and verifications, for initiallaunch and for successive runs.
Uninitialized Data Controls downloading and verification for uninitialized-data sections. Checkappropriate checkboxes to specify downloading and verifications, for initiallaunch and for successive runs.
Execute Tasks Enables the execution of target tasks.
Name For target tasks, this is the name of the target task as seen in the TargetTask view. For Debugger Shell scripts, this is the path to the CLDE script.
Task Type Contains either Debugger Shell scripts or target tasks (such as FlashProgrammer).
First Represents a task that is executed first.
Subsequent Represents a task that is executed subsequent times.
4.1.3.5 PICUse this page to specify an alternate address at which the debugger loads the PIC module onto targetmemory.
Usually, Position Independent Code (PIC) is linked in such a way that the entire image starts at address0x00000000.
Figure 21: Debugger options-PIC page
The table below lists the various options available on the PIC page.
Debug ConfigurationsUsing Debug Configurations dialog
CodeWarrior for ARMv7 Targeting Manual, Rev. 10.0.8, 01/2016Freescale Semiconductor, Inc. 65

Table 34: PIC page options
Option Description
Alternate Load Address Specify the starting address at which the debugger loads your program. Youcan also use this setting when you have an application which is built withROM addresses and then relocates itself to RAM (such as U-Boot).Specifying a relocation address lets the debugger map the symbolicdebugging information contained in the original ELF file (built for ROMaddresses) to the relocated application image in RAM. Clear the checkboxto have the debugger load your program at a default starting address.
The debugger does not verify whether your code can execute at the specified address.As a result, the PIC generation settings of the compiler, linker and your program's startuproutines must correctly set any base registers and perform any required relocations.
NOTE
4.1.3.6 Other ExecutablesUse this page to specify additional ELF files to download or debug in addition to the main executable fileassociated with the launch configuration.
Figure 22: Debugger options-Other Executables page
The table below lists the various options available on the Other Executables page.
Debug ConfigurationsUsing Debug Configurations dialog
CodeWarrior for ARMv7 Targeting Manual, Rev. 10.0.8, 01/201666 Freescale Semiconductor, Inc.
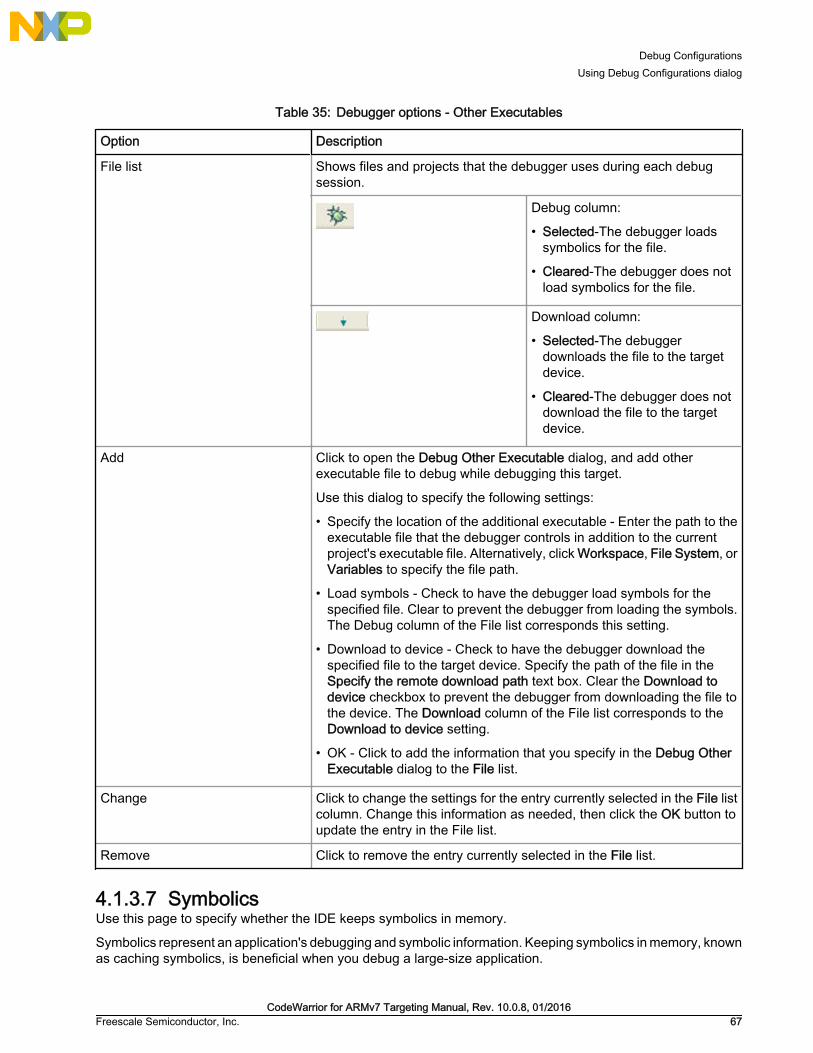
Table 35: Debugger options - Other Executables
Option Description
File list Shows files and projects that the debugger uses during each debugsession.
Debug column:
• Selected-The debugger loadssymbolics for the file.
• Cleared-The debugger does notload symbolics for the file.
Download column:
• Selected-The debuggerdownloads the file to the targetdevice.
• Cleared-The debugger does notdownload the file to the targetdevice.
Add Click to open the Debug Other Executable dialog, and add otherexecutable file to debug while debugging this target.
Use this dialog to specify the following settings:
• Specify the location of the additional executable - Enter the path to theexecutable file that the debugger controls in addition to the currentproject's executable file. Alternatively, click Workspace, File System, orVariables to specify the file path.
• Load symbols - Check to have the debugger load symbols for thespecified file. Clear to prevent the debugger from loading the symbols.The Debug column of the File list corresponds this setting.
• Download to device - Check to have the debugger download thespecified file to the target device. Specify the path of the file in theSpecify the remote download path text box. Clear the Download todevice checkbox to prevent the debugger from downloading the file tothe device. The Download column of the File list corresponds to theDownload to device setting.
• OK - Click to add the information that you specify in the Debug OtherExecutable dialog to the File list.
Change Click to change the settings for the entry currently selected in the File listcolumn. Change this information as needed, then click the OK button toupdate the entry in the File list.
Remove Click to remove the entry currently selected in the File list.
4.1.3.7 SymbolicsUse this page to specify whether the IDE keeps symbolics in memory.
Symbolics represent an application's debugging and symbolic information. Keeping symbolics in memory, knownas caching symbolics, is beneficial when you debug a large-size application.
Debug ConfigurationsUsing Debug Configurations dialog
CodeWarrior for ARMv7 Targeting Manual, Rev. 10.0.8, 01/2016Freescale Semiconductor, Inc. 67

Consider a situation in which the debugger loads symbolics for a large application, but does not download contentto a hardware device and the project uses custom makefiles with several build steps to generate this application.In such a situation, caching symbolics helps speed up the debugging process. The debugger uses the readilyavailable cached symbolics during subsequent debugging sessions. Otherwise, the debugger spends significanttime creating an in-memory representation of symbolics during subsequent debugging sessions.
Caching symbolics provides the most benefit for large applications, where doing sospeeds up application-launch time. If you debug a small application, caching symbolicsdoes not significantly improve the launch times.
NOTE
Figure 23: Debugger options-Symbolics page
The table below lists the various options available on the Symbolics page.
Table 36: Debugger options - Symbolics
Option Description
Cache Symbolics Between Sessions Select this option to have the debugger cache symbolics betweendebugging sessions. If you select this checkbox and clear theCreate and Use Copy of Executable checkbox, the executablefile remains locked after the debugging session ends. In theDebug view, right-click the locked file and select Un-targetExecutables to have the debugger delete its symbolics cache andrelease the file lock. The IDE enables this menu command whenthere are currently unused cached symbolics that it can purge.
Clear this option so that the debugger does not cache symbolicsbetween debugging sessions.
Create and Use Copy of Executable Select this option to have the debugger create and use a copy ofthe executable file. Using the copy helps avoid file-locking issueswith the build system. If you select this checkbox, the IDE canbuild the executable file in the background during a debuggingsession.
Clear this option so that the debugger does not create and use acopy of the executable file.
4.1.3.8 OS AwarenessUse this page to specify the operating system (OS) that resides on the target device.
The table below lists the options available on the OS Awareness page.
Debug ConfigurationsUsing Debug Configurations dialog
CodeWarrior for ARMv7 Targeting Manual, Rev. 10.0.8, 01/201668 Freescale Semiconductor, Inc.

Table 37: OS Awareness page options
Option Description
Target OS Use the Target OS list box to specify the OS that runs on thetarget device, or specify None to have the debugger use thebareboard.
Boot Parameters tab Enable Command Line Settings - Select this option to specifysettings for regular initialization. Enter the specific commandline parameters in the Command Line and Base Address textboxes.Enable Initial RAM Disk Settings - Select this option tospecify settings for flattened device tree initialization thatdownloads parameters to the kernel during its initialization.You specify a .dts file that contains initialization information.
• File Path - Specifies the path of the ramdisk that youtransferred from the Linux machine
• Address - Specifies the address specified in Linux, initrd-start from the dts file
• Size - Specifies the size of the dts file
• Download to target - Downloads the initial RAM disksettings to the target
Open Firmware Device Tree Settings - Select this option toload parameters to the kernel from a bootloader on theARMv7 processors
• File Path - Specifies the path to the dtb file for kernel debug
• Address - Specifies the address specified in Linux, initrd-start from the dts file
Table continues on the next page...
Debug ConfigurationsUsing Debug Configurations dialog
CodeWarrior for ARMv7 Targeting Manual, Rev. 10.0.8, 01/2016Freescale Semiconductor, Inc. 69

Table 37: OS Awareness page options (continued)
Option Description
Debug tab Specifies the parameters required for Linux kernel debug.
• Enable Memory Translation - Select this option to translatememory by specifying the following values Physical BaseAddress - this is the CONFIG_PHYSICAL_START optionof the kernel configuration Virtual Base Address - this is theCONFIG_KERNEL_START option of the kernelconfigurationMemory Size - this is theCONFIG_LOWMEM_SIZE option of the kernelconfiguration
Note: The virtual memory space should not overflow the 32-bit memory space. This indicates that the Virtual BaseAddress + Memory Size shouldn't be greater than0xFFFFFFFF. CodeWarrior displays an error when thishappens.
• Enable Threaded Debugging Support - Select this option toenable support for Linux kernel threaded debugging
• Update Background Threads on Stop - Select this optiononly if you want to update the background threads on stop.Keep this option unchecked as it may increase debugspeed.
• Enable Delayed Software Breakpoint Support - Select thisoption to enable support for delayed software breakpointsduring kernel debug
Modules tab This tab allows you to add modules to the Linux kernel projectand configure the module's symbolics mapping. For moreinformation on the Modules tab, see Configure the Modules'Symbolics Mapping topic.
4.1.4 Trace and ProfileCodeWarrior Tracing and Performance Analysis Tools provide visibility into an application as it runs on thehardware. This visibility can help you understand how your application runs, as well as identify operationalproblems.
The UI Platform Configurator tool reads the user settings from the input XML file and transforms them into targetaccess memory writes to the configuration registers.
Figure 24: Core Trace Path
Debug ConfigurationsUsing Debug Configurations dialog
CodeWarrior for ARMv7 Targeting Manual, Rev. 10.0.8, 01/201670 Freescale Semiconductor, Inc.

The figure above shows the core trace path within the ARMv7 architecture. The UI Platform Configuratorconfigures the ARMv7 cores embedded trace macrocell (ETM), Funnel, embedded trace FIFO (ETF) andembedded trace router (ETR) modules. The ETF stores and forwards trace data using a dedicated RAM buffer.This reduces trace loss by absorbing spikes in trace data. The ETR redirects trace to the system bus for collectionfrom alternative channels. For ARMv7, it is double data rate (DDR) memory.
The destination of the raw trace is either the internal trace buffer of the ETF module or a user defined buffer inDDR.
The basic setup can be done using the Trace and Profile tab in the Debug launch configuration:
• To enable tracing for any new project created, go to the Debug Configuration, select a launch configurationfrom CodeWarrior in the left panel. Select Trace and Profile tab from the right panel.
Figure 25: Main tab
• The Overview tab displays the information about the ARMv7 architecture.
• The Basic tab displays the predefined settings. For Platform Configuration Settings, you can apply differentvalues based on what you want to achieve. The values are called profiles, and the framework allowscreation of different profiles for a configuration block. The profiles dialog is used to create new, rename,delete or edit the settings of a profile for a configuration provider.
Debug ConfigurationsUsing Debug Configurations dialog
CodeWarrior for ARMv7 Targeting Manual, Rev. 10.0.8, 01/2016Freescale Semiconductor, Inc. 71

Figure 26: Trace and Profile tab
4.1.5 SourceUse this tab to specify the location of source files used when debugging a C or C++ application.
By default, this information is taken from the build path of your project.
Figure 27: Debug Configurations-Source tab
The table below lists the various options available on the Source page.
Debug ConfigurationsUsing Debug Configurations dialog
CodeWarrior for ARMv7 Targeting Manual, Rev. 10.0.8, 01/201672 Freescale Semiconductor, Inc.

Table 38: Source tab options
Option Description
Source Lookup Path Lists the source paths used to load an image afterconnecting the debugger to the target.
Add Click to add new source containers to the SourceLookup Path search list.
Edit Click to modify the content of the selected sourcecontainer.
Remove Click to remove selected items from the SourceLookup Path list.
Up Click to move selected items up the Source LookupPath list.
Down Click to move selected items down the Source LookupPath list.
Restore Default Click to restore the default source search list.
Search for duplicate source files on the path Select to search for files with the same name on aselected path.
4.1.6 EnvironmentUse this tab to specify the environment variables and values to use when an application runs.
Figure 28: Debug Configuration-Environment tab
The table below lists the various options available on the Environment page.
Table 39: Environment tab options
Option Description
Environment variables to set Lists the environment variable name and its value.
Table continues on the next page...
Debug ConfigurationsUsing Debug Configurations dialog
CodeWarrior for ARMv7 Targeting Manual, Rev. 10.0.8, 01/2016Freescale Semiconductor, Inc. 73

Table 39: Environment tab options (continued)
Option Description
New Click to create a new environment variable.
Select Click to select an existing environment variable.
Edit Click to modify the name and value of a selectedenvironment variable.
Remove Click to remove selected environment variables fromthe list.
Append environment to native environment Select to append the listed environment variables tothe current native environment.
Replace native environment with specifiedenvironment
Select to replace the current native environment withthe specified environment set.
4.1.7 CommonUse this page to specify the location to store your run configuration, standard input and output, andbackground launch options.
Figure 29: Debug Configuration-Common tab
The table below lists the various options available on the Common page.
Debug ConfigurationsUsing Debug Configurations dialog
CodeWarrior for ARMv7 Targeting Manual, Rev. 10.0.8, 01/201674 Freescale Semiconductor, Inc.

Table 40: Common tab options
Option Description
Local file Select to save the launch configuration locally.
Shared file Select to specify the path of, or browse to, a workspace to store the launchconfiguration file, and be able to commit it to a repository.
Display in favorites menu Select to add the configuration name to Run or Debug menus for easyselection.
Allocate console (necessary forinput)
Select to assign a console view to receive the output. You must select thisoption if you want to use the host CodeWarrior to view the output of thedebugged application.
File Specify the file name to save output. For Linux applications, this optionprovides a way to select a host-side file to redirect the output forwarded byCodeWarrior TRK to host CodeWarrior (if redirections are specified in theArguments tab, then this feature makes no sense because redirections areusing target-side files).
Append Select to append output. Clear to recreate file each time. Selecting this optionmeans that the file (host-side file, in case of Linux applications) mentioned inthe File text box will not be overwritten for new content. Instead, the newcontent will be appended to the file.
Port Select to redirect standard output ( stdout, stderr) of a process beingdebugged to a user specified socket.
You can also use the redirect command indebugger shell to redirect standard outputstreams to a socket.
NOTE
Act as Server Select to redirect the output from the current process to a local server socketbound to the specified port.
Hostname/IP Address Select to redirect the output from the current process to a server socketlocated on the specified host and bound to the specified port. The debuggerwill connect and write to this server socket via a client socket created on anephemeral port
Launch in background Select to launch configuration in background mode.
4.2 Customizing Debug ConfigurationsWhen you use the CodeWarrior wizard to create a new project, the wizard sets the project's launchconfigurations to default values. You can change the default values of your project's launch configurations,according to your program's requirements.
To modify the launch configurations:
1. Start the CodeWarrior IDE.
2. From the main menu bar of the IDE, select Run > Debug Configurations.
Debug ConfigurationsCustomizing Debug Configurations
CodeWarrior for ARMv7 Targeting Manual, Rev. 10.0.8, 01/2016Freescale Semiconductor, Inc. 75

The Debug Configurations dialog appears. The left side of this dialog has a list of debug configurations thatapply to the current application.
3. Expand the CodeWarrior configuration.
4. From the expanded list, select the debug configuration that you want to modify.
The following figure shows the Debug Configurations dialog with the settings for the debug configuration youselected.
Figure 30: CodeWarrior Debug Configuration-Main tab
5. In the group of tabs in the upper-right side of the dialog, click a tab.
6. Change the settings on the debug configuration page as per your requirements. See Using DebugConfigurations dialog on page 53 for details on the various settings of this page.
7. Click Apply to save the new settings.
When you finish, you can click Debug to start a new debugging session, or click Close to save your changesand close the Debug Configurations dialog.
Debug ConfigurationsCustomizing Debug Configurations
CodeWarrior for ARMv7 Targeting Manual, Rev. 10.0.8, 01/201676 Freescale Semiconductor, Inc.

4.3 Reverting Debug Configuration settingsAfter making some modifications in a debug configuration's settings, you can either save the pending(unsaved) changes or revert to last saved settings.
To save the pending changes, click the Apply button of the Debug Configurations dialog, or click the Close buttonand then the Yes button.
To undo pending changes and restore the last saved settings, click the Revert button at the bottom of the DebugConfigurations dialog.
The IDE restores the last set of saved settings to all pages of the Debug Configurations dialog. Also, the IDEdisables the Revert button until you make new pending changes.
Debug ConfigurationsReverting Debug Configuration settings
CodeWarrior for ARMv7 Targeting Manual, Rev. 10.0.8, 01/2016Freescale Semiconductor, Inc. 77

Debug ConfigurationsReverting Debug Configuration settings
CodeWarrior for ARMv7 Targeting Manual, Rev. 10.0.8, 01/201678 Freescale Semiconductor, Inc.

Chapter 5Working with DebuggerThis chapter explains various aspects of CodeWarrior debugging, such as debugging a project, configuringconnections, setting breakpoints and watchpoints, working with registers, viewing memory, viewing cache, anddebugging externally built executable files.
This chapter documents debugger features that are specific to CodeWarriorDevelopment Studio for QorIQ LS series - ARM V7 ISA.
NOTE
This chapter explains:
• Debugging CodeWarrior project on page 79
• Consistent debug control on page 80
• Secure Debug mode on page 80
• Connection types on page 80
• Editing remote system configuration on page 81
• CodeWarrior command-line debugger on page 84
• Working with Breakpoints on page 86
• Working with Watchpoints on page 90
• Working with Registers on page 93
• Viewing Memory on page 101
• Changing Program Counter Value on page 103
• Hard Resetting on page 103
• Setting Stack Depth on page 103
• Importing CodeWarrior Executable file Wizard on page 104
• Debugging Externally Built Executable Files on page 108
5.1 Debugging CodeWarrior projectThis section explains how to change the debugger settings and how to debug a CodeWarrior project.
The CodeWarrior Bareboard Project Wizard or the CodeWarrior Linux Project Wizard sets the debugger settingsof a project's launch configurations to default values. You can change these default values as per yourrequirements.
To change the debugger settings and start debugging a CodeWarrior project, perform these steps:
1. From the CodeWarrior IDE menu bar, select Run > Debug Configurations. The CodeWarrior IDE uses thesettings in the launch configuration to generate debugging information and initiate communications with thetarget board.
The Debug Configurations dialog appears. The left side of this dialog box has a list of debug configurationsthat apply to the current application.
2. Expand the CodeWarrior configuration.
3. From the expanded list, select the debug configuration that you want to modify.
Working with DebuggerDebugging CodeWarrior project
CodeWarrior for ARMv7 Targeting Manual, Rev. 10.0.8, 01/2016Freescale Semiconductor, Inc. 79

4. Click Apply to save the new settings.
You can click Revert to undo any of the unsaved changes. The CodeWarrior IDErestores the last set of saved settings to all pages of the Debug Configurations dialog.Also, the IDE disables Revert until you make new pending changes.
TIP
5. Click Debug to start the debugging session.
You just modified the debugger settings and initialized a debugging session.
5.2 Consistent debug controlThis section describes the consistent debug control feature of the CodeWarrior debugger.
When you attempt to stop the target during a debugging session, the consistent debug control feature enablesthe debugger to report core's Doze and Nap low power management states.
In addition, the debugger at the same time grants you access to the system states, such as core registers, TLBregisters, caches, and so on.
When you attempt to resume the debugging session, the debugger displays a warning message and puts therespective core in the same power management state (Doze or Nap, whichever is the previous one). Thedebugger waits for the core to exit out of Doze or Nap state to continue with the attempted operation.
5.3 Secure Debug modeThis section describes the secure debug feature of the CodeWarrior debugger.
If the processor is in the Secure Debug mode and if the unlock key is not provided, then a popup is displayedrequesting the unlock key. If you provide a wrong key and an unlock sequence is run by the debugger with theerroneous key, then the associated part will be locked until a rest occurs, and you will need to hard reset thetarget board to connect to it again.
5.4 Connection typesThis section describes the different connection types provided by the CodeWarrior debugger for connectingthe target board to the host computer.
The CodeWarrior debugger provides the following three connection types for connecting the target board to thehost computer:
• CMSIS-DAP: Available only for TWR and IOT boards
• CodeWarrior TAP (over USB): Available for QDS, RDB, TWR, and IOT boards
• CodeWarrior TAP (over Ethernet): Available for QDS, RDB, TWR, and IOT boards
Working with DebuggerConsistent debug control
CodeWarrior for ARMv7 Targeting Manual, Rev. 10.0.8, 01/201680 Freescale Semiconductor, Inc.

5.5 Editing remote system configurationThe remote system configuration model defines the connection and system configurations where you candefine a single system configuration that can be referred to by multiple connection configurations.
To edit the system configuration, perform these steps:
1. Select Run > Debug Configurations.
The Debug Configurations dialog appears.
2. In the Target Settings panel, click Edit next to the Connection drop-down list.
The Properties for <connection launch configuration> window appears.
For targets that support the secure debug feature, the Secure debug key option is available on the Advancedtab of the Properties for <connection launch configuration> window, as shown in the figure below.
Figure 31: Setting Secure debug key option
Select the Secure debug key checkbox to enable the CodeWarrior debugger to unlock the secured boardwith the secure debug key provided in the associated text box. If this option is not selected, then you willreceive a secure debug violation error when you try to perform debugging on the locked board, and a windowwill appear where you can provide a secure debug key.
If you provide a wrong key and an unlock sequence is run by the debugger with the erroneous key, then theassociated part will be locked until a rest occurs, and you will need to hard reset the target board to connectto it again.
CodeWarrior connection server (CCS) checks if the board is secured or not during chain configurationand/or reset to handle automatic unlocking with the provided secure debug key.
3. Click Edit next to the Target drop-down list.
The Properties for <system launch configuration> window appears.
4. Select the appropriate system type from the Target type drop-down list.
Working with DebuggerEditing remote system configuration
CodeWarrior for ARMv7 Targeting Manual, Rev. 10.0.8, 01/2016Freescale Semiconductor, Inc. 81

5. Make the respective settings in Initialization tab on page 82 and Memory tab on page 83.
6. Click OK to save the settings.
7. Click OK to close the Properties window.
This section contains the following subsections:
• Initialization tab on page 82
• Memory tab on page 83
5.5.1 Initialization tabUse the Initialization tab to specify the target initialization file for various cores.
The figure below shows the settings on the Initialization tab.
Figure 32: CodeWarrior TAP connection type - Initialization tab
The table below lists the various options available on the Initialization page.
Table 41: Initialization tab options
Option Description
Execute target reset Select to execute target system reset.
Target Lists the targets and the supported cores.
Run out of reset Select to include the respective core for run out of reset operation.
Table continues on the next page...
Working with DebuggerEditing remote system configuration
CodeWarrior for ARMv7 Targeting Manual, Rev. 10.0.8, 01/201682 Freescale Semiconductor, Inc.

Table 41: Initialization tab options (continued)
Option Description
Initialize target Click to specify a target initialization file for the respective core.
Initialize target script Lists the path to a Debugger Shell Tcl script that runs when launching adebug session for the respective core. To edit, select a cell, then click theellipsis button to open the Target InitializationFile dialog. The settings for agroup of cores can be changed all at once by editing the cell of a commonancestor node in the Target hierarchy.
5.5.2 Memory tabUse the Memory tab to specify the memory configuration file for various cores.
The figure below shows the settings on the Memory tab.
Figure 33: CodeWarrior TAP connection type - Memory tab
The table below lists the various options available on the Memory page.
Table 42: Memory tab options
Option Description
Target Lists the targets and the supported cores.
Table continues on the next page...
Working with DebuggerEditing remote system configuration
CodeWarrior for ARMv7 Targeting Manual, Rev. 10.0.8, 01/2016Freescale Semiconductor, Inc. 83

Table 42: Memory tab options (continued)
Option Description
Memory configuration Select to specify a memory configuration file for the respective core.
Memory configuration file Lists the path to the memory configuration file for the respective core. To edit,select a cell, then click the ellipsis button to open the Memory ConfigurationFile dialog. The settings for a group of cores can be changed all at once byediting the cell of a common ancestor node in the Target hierarchy.
5.6 CodeWarrior command-line debuggerCodeWarrior supports a command-line interface that you can use to interact with the CodeWarrior debugger,by issuing commands.
You can use the command-line interface together with various scripting engines, such as the Microsoft® VisualBasic® script engine, the Java™ script engine, TCL, Python, and Perl. You can even issue a command thatsaves your command-line activity to a log file.
You use the Debugger Shell view to issue command lines to the IDE. For example, you enter the commanddebug in this window to start a debugging session. The window displays the standard output and standard errorstreams of command-line activity.
To open the Debugger Shell view, follow these steps:
1. Switch the IDE to the Debug perspective and start a debugging session.
2. Select Window > Show View > Other.
The Show View dialog appears.
3. Expand the Debug group.
4. Select Debugger Shell.
5. Click OK.
The Debugger Shell view appears in the view stack at the bottom of the IDE.
To issue a command-line command, type the desired command at the command prompt (%>) in the DebuggerShell view, then press Enter or Return. The command-line debugger executes the specified command.
To display a list of the commands the command-line debugger supports, type help atthe command prompt and press Enter. The help command lists each supportedcommand along with a brief description of each command.
NOTE
Working with DebuggerCodeWarrior command-line debugger
CodeWarrior for ARMv7 Targeting Manual, Rev. 10.0.8, 01/201684 Freescale Semiconductor, Inc.

Figure 34: Debugger Shell view
If you work with hardware as part of your project, you can use the command-line debugger to issue commandsto the debugger while the hardware is running.
To view page-wise listing of the debugger shell commands, right-click in the DebuggerShell view and select Paging from the context menu. Alternatively, click the Enable
Paging icon from the view toolbar.
TIP
The table below lists the instructions for common command-line debugging tasks.
Table 43: Common command-line debugging tasks
Task Instruction Comments
Open the Debugger Shell view. Choose Window > Show View >Other > Debugger Shell.
The Debugger Shell view appears.
Use the help command. 1. On the Debugger shellcommand prompt (%>), typehelp.
2. Press Enter key.
The command list for CodeWarriorappears.
Enter a command. 1. On the Debugger shell, type acommand followed by a space.
2. Type any valid command-lineoptions, separating each with aspace.
3. Press Enter key.
You can use shortcuts instead ofcomplete command names, suchas k for kill.
View debug command hints. Type alias followed by a space. The syntax for the rest of thecommand appears.
Table continues on the next page...
Working with DebuggerCodeWarrior command-line debugger
CodeWarrior for ARMv7 Targeting Manual, Rev. 10.0.8, 01/2016Freescale Semiconductor, Inc. 85

Table 43: Common command-line debugging tasks (continued)
Task Instruction Comments
Review previous commands. Press Up Arrow and Down Arrowkeys.
Clear command from thecommand line.
Press the Esc key.
Stop an executing script. Press the Esc key.
Toggle between insert/overwritemode.
Press the Insert key.
Scroll up/ down a page. Press Page Up or Page Down key.
Scroll left/right one column. Press Ctrl+Left Arrow or Ctrl+RightArrow keys.
Scroll to beginning or end ofbuffer.
Press Ctrl+Home or Ctrl+Endkeys.
5.7 Working with BreakpointsA breakpoint is set on an executable line of a program; if the breakpoint is enabled when you debug, theexecution suspends before that line of code executes.
The different breakpoint types that you can set are listed below:
• Software breakpoints: The debugger sets a software breakpoint into target memory. When programexecution reaches the breakpoint, the processor stops and activates the debugger. The breakpoint remainsin the target memory until the user removes it.
The breakpoint can only be set in writable memory, such as SRAM or DDR. You cannot use this type ofbreakpoints in ROM.
• Hardware breakpoints: Selecting the Hardware menu option causes the debugger to use the internalprocessor breakpoints. These breakpoints are usually very few and can be used with all types of memories(ROM/RAM) because they are implemented by using processor registers.
You can also set breakpoint types by issuing the bp command in the Debugger Shellview.
TIP
In this section:
• Setting Breakpoints on page 86
• Setting Hardware Breakpoints on page 89
• Removing Breakpoints on page 90
5.7.1 Setting BreakpointsThis section explains how to set breakpoints within a program in CodeWarrior IDE.
To set a breakpoint, perform the following steps:
1. Switch to the Debug perspective in CodeWarrior IDE.
Working with DebuggerWorking with Breakpoints
CodeWarrior for ARMv7 Targeting Manual, Rev. 10.0.8, 01/201686 Freescale Semiconductor, Inc.

2. Open the Debug view if it is not already open by selecting Window > Show View > Debug.
The Debug view appears, shown in the figure below.
Figure 35: Debug view
3. Expand the Thread group.
4. Under the Thread group, select the thread that has the main() function.
The source code appears in the Editor view (shown in the figure below). The small blue arrow to the left ofthe source code indicates which code statement the processor's program counter is set to execute next.
Figure 36: Editor view
5. In the Editor view, place the cursor on the line that has this statement: counter++;
6. Select Run > Toggle Line Breakpoint.
A blue dot appears in the marker bar to the left of the line (shown in the figure below). This dot indicates anenabled breakpoint. After the debugger installs the breakpoint, a blue checkmark appears beside the dot.The debugger installs a breakpoint by loading into the Java™ virtual machine the code in which you set thatbreakpoint.
Working with DebuggerWorking with Breakpoints
CodeWarrior for ARMv7 Targeting Manual, Rev. 10.0.8, 01/2016Freescale Semiconductor, Inc. 87

An alternate way to set a breakpoint is to double-click the marker bar to the left of anysource-code line. If you set the breakpoint on a line that does not have an executablestatement, the debugger moves the breakpoint to the closest subsequent line that hasan executable statement. The marker bar shows the installed breakpoint location. If youwant to set a hardware breakpoint instead of a software breakpoint, use the bpcommand in the Debugger Shell view. You can also right-click the marker bar to the leftof any source-code line, and select Set Special Breakpoint from the context menu thatappears.
TIP
Figure 37: Editor view - after setting breakpoints
7. From the menu bar, select Run > Resume.
The debugger executes all lines up to, but not including, the line at which you set the breakpoint. The editorview highlights the line at which the debugger suspended execution (shown in the figure below). Note alsothat the program counter (blue arrow) is positioned here.
Working with DebuggerWorking with Breakpoints
CodeWarrior for ARMv7 Targeting Manual, Rev. 10.0.8, 01/201688 Freescale Semiconductor, Inc.

Figure 38: Editor view - after reaching a breakpoint
5.7.2 Setting Hardware BreakpointsThis section explains how to set hardware breakpoints within a program in CodeWarrior IDE.
There are two ways to set hardware breakpoints:
• Using IDE to set Hardware Breakpoints on page 89
• Using Debugger Shell to set Hardware Breakpoints on page 89
5.7.2.1 Using IDE to set Hardware BreakpointsThis section explains how to set a hardware breakpoint using CodeWarrior IDE.
The steps are as follows:
1. In the CodeWarrior IDE, select Run > Breakpoint Types > C/C++ Hardware Breakpoints.
2. In the Editor view, click in the source line where you want to place the breakpoint.
3. Select Run > Toggle Breakpoint.
A hardware breakpoint appears in the marker bar on the left side of the source line.
5.7.2.2 Using Debugger Shell to set Hardware BreakpointsThis section explains how to set a hardware breakpoint using the Debugger Shell view.
The steps are as follows:
1. Open the Debugger Shell view.
2. Begin the command line with the text:
bp -hw
3. Complete the command line by specifying the function, address, or file at which you want to set thehardware breakpoint.
Working with DebuggerWorking with Breakpoints
CodeWarrior for ARMv7 Targeting Manual, Rev. 10.0.8, 01/2016Freescale Semiconductor, Inc. 89

For example, to set a breakpoint for line 6 in your program, type:
bp -hw 6
4. Press the Enter key.
The debugger shell executes the command and sets the hardware breakpoint.
Enter help bp at the command-line prompt to see examples of the bp command syntaxand usage.
TIP
5.7.3 Removing BreakpointsThis section explains how to remove breakpoints from a program in CodeWarrior IDE.
To remove a breakpoint from your program, you have two options:
• Remove Breakpoints using Marker Bar on page 90
• Remove Breakpoints using Breakpoints view on page 90
5.7.3.1 Remove Breakpoints using Marker BarThis section explains how to remove an existing breakpoint using the marker bar.
The steps are as follows:
1. Right-click the breakpoint in the marker bar.
2. Select Toggle Breakpoint from the menu that appears.
5.7.3.2 Remove Breakpoints using Breakpoints viewThis section explains how to remove an existing breakpoint using the Breakpoints view.
The steps are as follows:
1. Open the Breakpoints view if it is not already open by selecting Window > Show View > Breakpoints.
The Breakpoints view appears, displaying a list of breakpoints.
2. Right-click the breakpoint you wish to remove and select Remove from the menu that appears.
The selected breakpoint is removed, and it disappears from the both the marker bar and the list in the view.
To remove all of the breakpoints from the program at once, select Remove All from themenu.
NOTE
5.8 Working with WatchpointsA watchpoint is another name for a data breakpoint that you can set on an address or a range of addresses inthe memory.
The debugger halts execution each time the watchpoint location is read, written, or accessed (read or written).You can set a watchpoint using the Add Watchpoint dialog. To open the Add Watchpoint dialog, use one of thefollowing views:
• Breakpoints view
Working with DebuggerWorking with Watchpoints
CodeWarrior for ARMv7 Targeting Manual, Rev. 10.0.8, 01/201690 Freescale Semiconductor, Inc.

• Memory view
• Variables view
The debugger handles both watchpoints and breakpoints in similar manners. You can use the Breakpoints viewto manage both watchpoints and breakpoints. It means, you can use the Breakpoints view to add, remove,enable, and disable both watchpoints and breakpoints. The debugger attempts to set the watchpoint if a sessionis in progress based on the active debugging context (the active context is the selected project in the Debugview).
If the debugger sets the watchpoint when no debugging session is in progress, or when re-starting a debuggingsession, the debugger attempts to set the watchpoint at startup as it does for breakpoints. The Problems viewdisplays error messages when the debugger fails to set a watchpoint. For example, if you set watchpoints onoverlapping memory ranges, or if a watchpoint falls out of execution scope, an error message appears in theProblems view. You can use this view to see additional information about the error.
The following sections explain how to set or remove watchpoints:
• Setting Watchpoints on page 91
• Removing Watchpoints on page 93
5.8.1 Setting WatchpointsUse the Add Watchpoint dialog to create a watchpoint for a memory range.
You can specify these parameters for a watchpoint:
• An address (including memory space)
• An expression that evaluates to an address
• A memory range
• An access type on which to trigger
To open the Add Watchpoint dialog, follow these steps:
1. Open the Debug perspective.
2. Click one of these tabs:
• Breakpoints
• Memory
• Variables
The corresponding view appears.
3. Right-click the appropriate content inside the view as mentioned in the table below.
Table 44: Opening Add Watchpoint dialog
In the view... Right-click...
Breakpoints An empty area inside the view.
Memory The cell or range of cells on which you want to set the watchpoint.
Variables A global variable.
The debugger does not support setting a watchpoint on a stack variable or a registervariable.
NOTE
4. Select Add Watchpoint (C/C++) from the context menu that appears.
Working with DebuggerWorking with Watchpoints
CodeWarrior for ARMv7 Targeting Manual, Rev. 10.0.8, 01/2016Freescale Semiconductor, Inc. 91

The Add Watchpoint dialog appears (shown in the figure below). The debugger sets the watchpoint accordingto the settings that you specify in the Add Watchpoint dialog. The Breakpoints view shows information aboutthe newly set watchpoint. The Problems view shows error messages when the debugger fails to set thewatchpoint.
Figure 39: Add Watchpoint dialog
The table below describes the options available in the Add Watchpoint dialog.
Table 45: Add Watchpoint dialog options
Option Description
Expression to watch Enter an expression that evaluates to an address on the target device.When the specified expression evaluates to an invalid address, thedebugger halts execution and displays an error message. You canenter these types of expressions:
• An r-value, such as &variable
• A register-based expression. Use the $ character to denote registernames. For example, enter $SP-12 to have the debugger set awatchpoint on the stack pointer address minus 12 bytes.
The Add Watchpoint dialog does not support entering expressions thatevaluate to registers.
Memory space Select this option to specify an address, including memory space, atwhich to set the watchpoint. Use the text box to specify the address oraddress range on which to set the watchpoint. If a debugging sessionis not active, the text/list box is empty, but you can still type an addressor address range.
Units Enter the number of addressable units that the watchpoint monitors.
Write Select this option to enable the watchpoint to monitor write activity onthe specified memory space and address range. Clear this option if youdo not want the watchpoint to monitor write activity.
Table continues on the next page...
Working with DebuggerWorking with Watchpoints
CodeWarrior for ARMv7 Targeting Manual, Rev. 10.0.8, 01/201692 Freescale Semiconductor, Inc.

Table 45: Add Watchpoint dialog options (continued)
Option Description
Read Select this option to enable the watchpoint to monitor read activity onthe specified memory space and address range. Clear this option if youdo not want the watchpoint to monitor read activity.
5.8.2 Removing WatchpointsThis section explains how to remove a watchpoint.
The steps are as follows:
1. Open the Breakpoints view if it is not already open by selecting Window > Show View > Breakpoints.
The Breakpoints view appears, displaying a list of watchpoints.
2. Right-click the watchpoint you wish to remove and select Remove from the menu that appears.
The selected watchpoint is removed, and it disappears from the list in the Breakpoints view.
5.9 Working with RegistersUse the Registers view to display and modify the contents of the registers of the processor on your targetboard.
To display the Registers view, select Window > Show View > Other > Debug > Registers. The Registers viewappears (shown in the figure below). The default state of the Registers view provides details on the processor'sregisters.
The Registers view displays categories of registers in a tree format. To display the contents of a particularcategory of registers, expand the tree element of the register category of interest. The figure below shows theRegisters view with the General Purpose Registers tree element expanded.
You can also view and update registers by issuing the reg, change, and displaycommands in the Debugger Shell view.
TIP
Figure 40: Registers view
In this section:
• Changing bit value of register on page 94
Working with DebuggerWorking with Registers
CodeWarrior for ARMv7 Targeting Manual, Rev. 10.0.8, 01/2016Freescale Semiconductor, Inc. 93

• Viewing Register details on page 94
• Registers view context menu on page 98
• Working with Register Groups on page 99
5.9.1 Changing bit value of registerThis section explains how to change a bit value in a register.
The steps are as follows:
1. Switch the IDE to the Debug perspective and start a debug session.
2. Open the Registers view by selecting Window > Show View > Other > Debug > Registers.
3. In the Registers view, expand the register group that contains the register with the bit value that you wantto change.
4. Click the register's current bit value in the view's Value column.
The value becomes editable.
5. Type in the new value.
6. Press the Enter key.
The debugger updates the bit value. The bit value in the Value column changes to reflect your modification.
5.9.2 Viewing Register detailsYou can view the registers and their descriptions using the Registers view.
The steps are as follows:
1. Start a debug session.
2. In the Debug perspective, click the Registers view tab.
The Registers view appears.
3. Click the View Menu button (the inverted triangle) on the Registers view toolbar.
4. Select Layout > Vertical or Layout > Horizontal to show register details.
Selecting Layout > Registers View Only hides the register details.
NOTE
The details of the register, selected by default in the Registers view, are displayed, as shown in the figurebelow.
Working with DebuggerWorking with Registers
CodeWarrior for ARMv7 Targeting Manual, Rev. 10.0.8, 01/201694 Freescale Semiconductor, Inc.

Figure 41: Registers view - Register details
5. Expand a register group to see individual registers.
6. Select a specific register by clicking it.
The details of the selected register get displayed.
Use the Format list box to change the format of data displayed for the selected register.
NOTE
7. Examine register details. For example,
• Use the Bit Fields on page 96 group to see a graphical representation of the selected register's bitfields. You can use this graphical representation to select specific bits or bit fields.
• Use the Actions on page 97 group to perform operations, such as update bit field values and format thedisplayed register data.
• Use the Description on page 98 group to see an explanation of the selected register, bit field, or bitvalue.
To enlarge the Registers view, click Maximize on the view's toolbar. After you finishlooking at the register details, click Restore on the view's toolbar to return the view toits previous size. Alternatively, right-click the Registers tab and select Detached. TheRegisters view becomes a floating window that you can resize. After you finish lookingat the register details, right-click the Registers tab of the floating window and selectDetached again. You can rearrange the re-attached view by dragging its tab to adifferent collection of view tabs.
TIP
This section contains the following subsections:
• Bit Fields on page 96
• Actions on page 97
• Description on page 98
Working with DebuggerWorking with Registers
CodeWarrior for ARMv7 Targeting Manual, Rev. 10.0.8, 01/2016Freescale Semiconductor, Inc. 95

5.9.2.1 Bit FieldsThe Bit Fields group of the Registers view shows a graphical representation of the selected register's bitvalues.
This graphical representation (shown in the figure below) shows how the register organizes bits. You can usethis representation to select and change the register's bit values. Hover the cursor over each part of the graphicalrepresentation in order to see additional information.
Figure 42: Register Details - Bit Fields group
You can also view register details by issuing the reg command in the Debugger Shellview.
TIP
A bit field is either a single bit or a collection of bits within a register. Each bit field has a mnemonic name thatidentifies it. You can use the Field list box to view and select a particular bit field of the selected register. Thelist box shows the mnemonic name and bit-value range of each bit field. In the Bit Fields graphical representation,a box surrounds each bit field. A red box surrounds the bit field shown in the Field list box.
After you use the Field list box to select a particular bit field, you see its current value in the = text box. If youchange the value shown in the text box, the Registers view shows the new bit field value.
To change a bit field in a register, you must first start a debugging session, and then open the Registers view.
To change a bit field, perform these steps:
1. In the Registers view, view register details.
2. Expand the register group that contains the bit field you want to change.
Register details appear in the Registers view (shown in the figure below).
Working with DebuggerWorking with Registers
CodeWarrior for ARMv7 Targeting Manual, Rev. 10.0.8, 01/201696 Freescale Semiconductor, Inc.

Figure 43: Registers view - Register Details
3. From the expanded register group above the register details, select the name of the register that containsthe bit field that you want to change.
The Bit Fields group displays a graphical representation of the selected bit field. The Description groupdisplays explanatory information about the selected bit field and parent register.
4. In the Bit Fields group, click the bit field that you want to change. Alternatively, use the Field list box tospecify the bit field that you want to change.
5. In the = text box, type the new value that you want to assign to the bit field.
6. In the Action group, click Write.
The debugger updates the bit field value. The bit values in the Value column and the Bit Fields group changeto reflect your modification.
Click Revert to discard your changes and restore the original bit field value.
NOTE
5.9.2.2 ActionsUse the Actions group of the Registers view to perform various operations on the selected register's bit fieldvalues.
The figure below shows the Actions group.
Figure 44: Register view - Actions Group
The table below lists each item in the Actions group and explains the purpose of each.
Working with DebuggerWorking with Registers
CodeWarrior for ARMv7 Targeting Manual, Rev. 10.0.8, 01/2016Freescale Semiconductor, Inc. 97

Table 46: Actions Group Items
Item Description
Revert Discard your changes to the current bit field value and restore the originalvalue. The debugger disables this button if you have not made anychanges to the bit field value.
Write Save your changes to the current bit field value and write those changesinto the register's bit field. The debugger disables this button after writingthe new bit field value, or if you have not made any changes to that value.
Reset Change each bit of the bit field value to its register-reset value. The registertakes on this value after a target-device reset occurs. To confirm the bitfield change, click Write. To cancel the change, click Revert.
Summary Display Description group content in a pop-up window. Press the Esc keyto close the pop-up window.
Format Specify the data format of the displayed bit field values.
5.9.2.3 DescriptionThe Description group of the Registers view shows explanatory information for the selected register.
The figure below shows the Description group.
Figure 45: Register view - Description group
The register information covers:
• Current value
• Description
• Bit field explanations and values
Some registers have multiple modes (meaning that the register's bits can have multiple meanings, dependingon the current mode). If the register you examine has multiple modes, you must select the appropriate mode.
5.9.3 Registers view context menuThe registers view context menu provides you various options for working with registers.
To display the registers view context menu, right-click a register in the Registers view.
The table below lists the options of the registers view context menu.
Working with DebuggerWorking with Registers
CodeWarrior for ARMv7 Targeting Manual, Rev. 10.0.8, 01/201698 Freescale Semiconductor, Inc.

Table 47: Registers view context menu options
Option Description
Select All Selects the entire contents of the current register.
Copy Registers Copies to the system clipboard the contents of the selected register.
Enable Allows the debugger to access the selected register.
Disable Prevents the debugger from accessing the selected register.
View Memory Displays the corresponding memory for the selected register.
Cast to Type Opens a dialog that you can use to cast the selected register value to adifferent data type.
Restore Original Type Reverts the selected register value to its default data type.
Find Opens a dialog that you can use to select a particular register.
Change Value Opens a dialog that you can use to change the current register value.
Add Register Group Opens a dialog that you can use to create a new collection of registers todisplay in the Registers view.
Restore Default RegisterGroups
Resets the custom groups of registers created using the Add RegisterGroup option, and restores the default groups provided by the debugger asthey were when CodeWarrior was installed. Note that if you select thisoption, all custom groupings of registers done by you are lost.
5.9.4 Working with Register GroupsThis section describes different operations that can be performed on register groups.
You can perform the following operations on the register groups:
• Adding Register Group on page 99
• Editing Register Group on page 100
• Removing Register Group on page 101
5.9.4.1 Adding Register GroupThe default display of the Registers view groups related registers into a tree structure. You can add a customgroup of registers to the default tree structure.
To add a new register group, perform these steps:
1. Right-click in the Registers view.
A context menu appears.
2. Select Add Register Group from the context menu.
The Register Group dialog appears, as shown in the figure below.
Working with DebuggerWorking with Registers
CodeWarrior for ARMv7 Targeting Manual, Rev. 10.0.8, 01/2016Freescale Semiconductor, Inc. 99

Figure 46: Register Group dialog
3. Enter in the Group Name text box a descriptive name for the new group.
4. Select the checkbox next to each register you want to appear in the new group.
Click Select All to check all of the checkboxes. Click Deselect All to clear all of thecheckboxes.
TIP
5. Click OK.
The Register Group dialog closes. The new group name appears in the Registers view.
5.9.4.2 Editing Register GroupIn the Registers view, you can edit both the default register groups and the groups that you add.
To do so, use the following steps:
1. In the Registers view, right-click the name of the register group you want to edit.
A context menu appears.
2. Select Edit Register Group from the context menu.
The Register Group dialog appears.
3. If you wish, enter in the Group Name text box a new name for the group.
Working with DebuggerWorking with Registers
CodeWarrior for ARMv7 Targeting Manual, Rev. 10.0.8, 01/2016100 Freescale Semiconductor, Inc.

4. Select the checkbox next to each register you want to appear in the group.
Click Select All to check all of the checkboxes. Click Deselect All to clear all of thecheckboxes.
TIP
5. Click OK.
The Register Group dialog closes. The new group name appears in the Registers view.
5.9.4.3 Removing Register GroupIn the Registers view, you can remove register groups.
To remove a register group, follow these steps:
1. In the Registers view, right-click the name of register group that you wish to remove.
A context menu appears.
2. Select Remove Register Group from the context menu.
The selected register group disappears from the Registers view.
5.10 Viewing MemoryThis section explains how to view memory of a target processor.
The debugger allocates multiple memory spaces in the IDE for flexible control over the memory access. Thenumber of supported memory spaces and their properties depends upon the debugged processor.
You can display and access the supported memory spaces for a target in the Memory and Memory Browserviews, in the Import/Export/Fill Memory Action Task View or in the Debugger Shell view using the designatedmemory space prefix. Use the mem -ms command to list the supported memory spaces for a processor.
To display the Memory view, select Window > Show View > Other > Debug > Memory. The figure below showsa Memory view displaying physical memory address space.
Working with DebuggerViewing Memory
CodeWarrior for ARMv7 Targeting Manual, Rev. 10.0.8, 01/2016Freescale Semiconductor, Inc. 101

Figure 47: Memory view
The Memory view seamlessly displays 32-bit, 36-bit, 40-bit, and 64-bit addressesdepending upon the selected memory space and the target processor currently underdebug process.
NOTE
This section contains the following subsection:
• Adding Memory Monitor on page 102
5.10.1 Adding Memory MonitorThe Memory view provides you option to display the supported memory spaces for a target.
Perform these steps:
1. In the Memory view, click the Add Memory Monitor icon.
The Monitor Memory dialog appears.
2. Specify the address in the Enter address or expression to monitor drop-down list.
3. Select one of the supported memory spaces from the Memory space drop-down list.
• Virtual Secure (x)
Indicates that the specified address space is same as the address space in which the processor executesin Secure mode.
• Virtual Non Secure (nx)
Indicates that the specified address space is same as the address space in which the processor executesin Non Secure mode.
• Physical (p)
Working with DebuggerViewing Memory
CodeWarrior for ARMv7 Targeting Manual, Rev. 10.0.8, 01/2016102 Freescale Semiconductor, Inc.

Indicates that the specified address is interpreted as a physical address and the access disregards thecache and accesses whatever is in the memory.
• Physical Cache-coherent (c)
Indicates that the specified address is interpreted as a physical address. If the data is in cache, the debuggergets it from there, otherwise the access goes to the memory.
5.11 Changing Program Counter ValueThis section explains how to change the program counter value in CodeWarrior IDE to make the debuggerexecute a specific line of code.
To change the program-counter value, follow these steps:
1. Start a debugging session.
2. In the Editor view, place the cursor on the line that you want the debugger to execute next.
3. Right-click in the Editor view.
A context menu appears.
4. From the context menu, select Move To Line.
The CodeWarrior IDE modifies the program counter to the specified location. The Editor view shows the newlocation.
5.12 Hard ResettingUse the reset hard command in the Debugger Shell view to send a hard reset signal to the target processor.
The Hard Reset command is enabled only if the debug hardware you are using supportsit.
NOTE
You can also perform a hard reset by clicking Reset ( ) on the Debug perspectivetoolbar.
TIP
5.13 Setting Stack DepthThis section describes how to control the depth of the call stack displayed by the debugger.
Select Window > Preferences > C/C++ > Debug > Maximum stack crawl depth option to set the depth of thestack to read and display. Showing all levels of calls when you are examining function calls several levels deepcan sometimes make stepping through code more time consuming. Therefore, you can use this menu option toreduce the depth of calls that the debugger displays.
Working with DebuggerChanging Program Counter Value
CodeWarrior for ARMv7 Targeting Manual, Rev. 10.0.8, 01/2016Freescale Semiconductor, Inc. 103

5.14 Importing CodeWarrior Executable file WizardThe Import a CodeWarrior Executable file wizard helps you to import a CodeWarrior executable file andcreate a new project.
To use the Import a CodeWarrior Executable file wizard, perform these steps:
1. From the CodeWarrior IDE menu bar, select File > Import.
The Import wizard launches and the Select page appears, as shown in the figure below.
Figure 48: Import Wizard - Selecting CodeWarrior Executable Importer
2. Expand the CodeWarrior group.
3. Select the CodeWarrior Executable Importer to import a .elf file.
4. Click Next.
The wizard name changes to Import a CodeWarrior Executable file.
The following sections describe the various pages that the wizard displays as it assists you in importing anexecutable (.elf) file:
• Import a CodeWarrior Executable file page on page 105
• Import C/C++/Assembler Executable Files page on page 105
• Processor page on page 105
• Linux Application Launch Configurations page on page 106
• Debug Target Settings page on page 107
Working with DebuggerImporting CodeWarrior Executable file Wizard
CodeWarrior for ARMv7 Targeting Manual, Rev. 10.0.8, 01/2016104 Freescale Semiconductor, Inc.

• Configurations page on page 107
5.14.1 Import a CodeWarrior Executable file pageThe Import a CodeWarrior Executable file page allows you to specify the name and location for your project.
The table below describes the options available on this page.
Table 48: Import a CodeWarrior Executable file page settings
Option Description
Project name Specify the name of the project. The specified name identifies the projectcreated for debugging (but not building) the executable file.
Use default location If you select this option, the project files required to build the program arestored in the current workspace directory of the workbench. If you clear thisoption, the project files are stored in the directory that you specify in theLocation option.
Location Specifies the directory that contains the project files. Use the Browsebutton to navigate to the desired directory. This option is only availablewhen the Use default location option is cleared.
5.14.2 Import C/C++/Assembler Executable Files pageUse the Import C/C++/Assembler Executable Files page to select an executable file or a folder to search forC/C++/assembler executable files.
The table below explains the options available on the page.
Table 49: Import C/C++/Assembler Executable Files Page Settings
Option Description
File to import Specifies the C/C++/assembler executable file. ClickBrowse to choose an executable file.
Copy the selected file to current project folder Select this option to copy the executable file in theproject folder.
5.14.3 Processor pageUse the Processor page to specify the processor family for the imported executable file and also specify thetoolchain to be used.
The table below describes the options available on the page.
Working with DebuggerImporting CodeWarrior Executable file Wizard
CodeWarrior for ARMv7 Targeting Manual, Rev. 10.0.8, 01/2016Freescale Semiconductor, Inc. 105

Table 50: Processor page settings
Option Description
Processor Expand the processor family and select the appropriate target processorfor the execution of the specified executable file. The toolchain uses thischoice to generate code that makes use of processor-specific features,such as multiple cores.
You can also type the processor name in the textbox.
TIP
Toolchain Chooses the compiler, linker, and libraries used to build the program. Eachtoolchain generates code targeted for a specific platform. These are:
• Bareboard Application: Targets a hardware board without an operatingsystem.
• Linux Application: Targets a board running the Linux operating system.
Target OS Select if the board runs no operation system or imports a Linux kernelproject to be executed on the board. The option is applicable only forbareboard application projects.
5.14.4 Linux Application Launch Configurations pageUse the Linux Application Launch Configurations page to specify how the debugger communicates with thehost Linux system and controls your Linux application.
The Linux Application page appears, only when select the Linux Application toolchainoption on the Processor page in the Import a CodeWarrior Executable file wizard.
NOTE
When debugging a Linux application, you must use the CodeWarrior TRK to managethe communications interface between the debugger and Linux system.
NOTE
The table below lists the options available on the page.
Table 51: Linux Application Launch Configurations page setting
Option Description
CodeWarrior TRK Select to use the CodeWarrior Target Resident Kernel (TRK) protocol, todownload and control application on the Linux host system.
TAP Address Specifies the IP address of the Linux host system, the project executes on.
Port Specifies the port number that the debugger will use to communicate to theLinux host.
Remote Download Path Specifies the host directory into which the debugger downloads theapplication.
Working with DebuggerImporting CodeWarrior Executable file Wizard
CodeWarrior for ARMv7 Targeting Manual, Rev. 10.0.8, 01/2016106 Freescale Semiconductor, Inc.
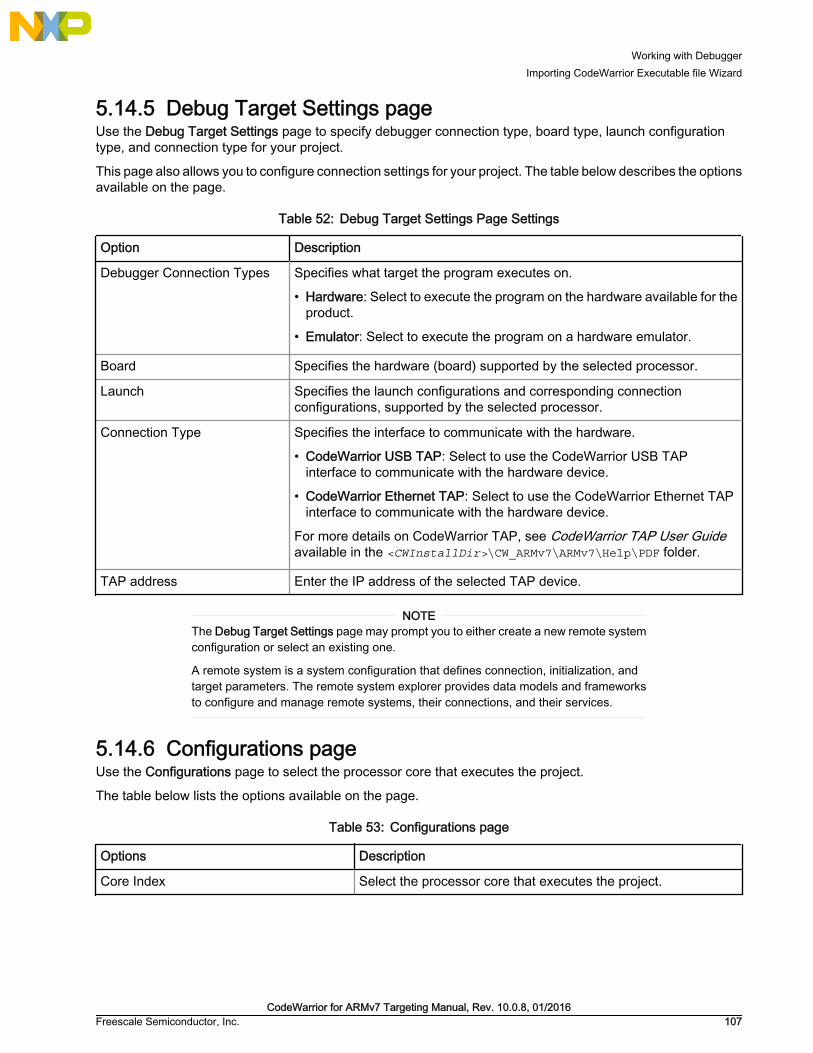
5.14.5 Debug Target Settings pageUse the Debug Target Settings page to specify debugger connection type, board type, launch configurationtype, and connection type for your project.
This page also allows you to configure connection settings for your project. The table below describes the optionsavailable on the page.
Table 52: Debug Target Settings Page Settings
Option Description
Debugger Connection Types Specifies what target the program executes on.
• Hardware: Select to execute the program on the hardware available for theproduct.
• Emulator: Select to execute the program on a hardware emulator.
Board Specifies the hardware (board) supported by the selected processor.
Launch Specifies the launch configurations and corresponding connectionconfigurations, supported by the selected processor.
Connection Type Specifies the interface to communicate with the hardware.
• CodeWarrior USB TAP: Select to use the CodeWarrior USB TAPinterface to communicate with the hardware device.
• CodeWarrior Ethernet TAP: Select to use the CodeWarrior Ethernet TAPinterface to communicate with the hardware device.
For more details on CodeWarrior TAP, see CodeWarrior TAP User Guideavailable in the <CWInstallDir>\CW_ARMv7\ARMv7\Help\PDF folder.
TAP address Enter the IP address of the selected TAP device.
The Debug Target Settings page may prompt you to either create a new remote systemconfiguration or select an existing one.
A remote system is a system configuration that defines connection, initialization, andtarget parameters. The remote system explorer provides data models and frameworksto configure and manage remote systems, their connections, and their services.
NOTE
5.14.6 Configurations pageUse the Configurations page to select the processor core that executes the project.
The table below lists the options available on the page.
Table 53: Configurations page
Options Description
Core Index Select the processor core that executes the project.
Working with DebuggerImporting CodeWarrior Executable file Wizard
CodeWarrior for ARMv7 Targeting Manual, Rev. 10.0.8, 01/2016Freescale Semiconductor, Inc. 107

5.15 Debugging Externally Built Executable FilesYou can use the Import a CodeWarrior Executable file wizard to debug an executable (.elf) file that has noassociated CodeWarrior project.
For example, you can debug a .elf file that was generated using a different IDE. The process of debugging anexternally built executable file can be divided into the following tasks:
• Import Executable File on page 108
• Edit Launch Configuration on page 110
• Specify Source Lookup Path on page 110
• Debug Executable File on page 112
5.15.1 Import Executable FileFirst of all, you need to import the executable file that you want the CodeWarrior IDE to debug.
The IDE imports the executable file into a new project. To import an externally built executable file, follow thesesteps:
1. From the CodeWarrior IDE menu bar, select File > Import.
The Import wizard appears.
2. Expand the CodeWarrior group.
3. Select CodeWarrior Executable Importer to import a .elf file.
4. Click Next.
The wizard name changes to Import a CodeWarrior Executable file and the Import a CodeWarrior Executablefile page appears.
5. In the Project name text box, enter the name of the project. This name identifies the project that the IDEcreates for debugging (but not building) the executable file.
6. Clear the Use default location checkbox and click Browse to specify a different location for the new project.By default, the Use default location checkbox is selected.
7. Click Next.
The Import C/C++/Assembler Executable Files page appears.
8. Click Browse.
The Select file dialog appears. Use the dialog to navigate to the executable file that you want to debug.
9. Select the required file and click Open.
The Select file dialog closes. The path to the executable file appears in the File to import text box.
You can also drag and drop a .elf file in the CodeWarrior Eclipse IDE. When you dropthe .elf file in the IDE, the Import a CodeWarrior Executable file wizard appears withthe .elf file already specified in the Project Name and File to Import text box.
TIP
10.Select the Copy the selected file to current project folder checkbox to copy the executable file in thecurrent workspace.
11.Click Next.
Working with DebuggerDebugging Externally Built Executable Files
CodeWarrior for ARMv7 Targeting Manual, Rev. 10.0.8, 01/2016108 Freescale Semiconductor, Inc.

The Processor page appears.
12.Select the processor family for the executable file.
13.Select a toolchain from the Toolchain group.
Selected toolchain sets up the default compiler, linker, and libraries used to build the new project. Eachtoolchain generates code targeted for a specific platform.
14.Select if the board runs no operation system or imports a Linux kernel project to be executed on the board.The Target OS options are applicable only for bareboard application projects.
15.Click Next.
The Debug Target Settings page appears.
16.Select a supported connection type, from the Debugger Connection Types group. Your selectiondetermines the launch configurations that you can include in your project.
17.Select the hardware or simulator, you plan to use, from the Board drop-down list.
Hardware or Simulators that supports the target processor selected on the Processorspage are only available for selection.
NOTE
18.Select the launch configurations that you want to include in your project and the corresponding connection.
19.Select the interface to communicate with the hardware, from the Connection Type drop-down list.
20.Enter the IP address of the TAP device in the TAP address text box. This option is disabled and cannot beedited, if you select USB TAP from the Connection Type drop-down list.
21.Click Next.
The Configurations page appears.
22.Select the processor core that executes the project, from the Core index list.
23.Click Finish.
The Import a CodeWarrior Executable file wizard ends. The project for the imported .elf file appears in theCodeWarrior Projects view. You can now open the Debug Configurations dialog by selecting Run > DebugConfigurations. The Debug Configurations dialog shows the current settings for the launch configuration thatyou just created. A remote system is created with details of all the connection, initialization, and targetparameters you had set while importing the .elf file.
Working with DebuggerDebugging Externally Built Executable Files
CodeWarrior for ARMv7 Targeting Manual, Rev. 10.0.8, 01/2016Freescale Semiconductor, Inc. 109

Figure 49: Debug Configurations dialog - Launch Configuration for Executable File
5.15.2 Edit Launch ConfigurationUsing the tabs of the Debug Configurations dialog box, you can change the launch configuration settings thatyou specified while importing the .elf file.
To edit the launch configuration for your executable file, follow these steps:
1. On the Main tab, click Edit in the Connection panel.
The corresponding Connection page appears.
2. Use the Connection type list box to modify the current connection type.
3. Configure the various connection options as appropriate for your executable file by using the various tabsavailable on the Connection page.
For example, specify the appropriate target processor, any initialization files, and connection protocol.
4. Click OK to close the Connection page.
5.15.3 Specify Source Lookup PathSource lookup path is specified in terms of the compilation path and the local file system path.
The CodeWarrior debugger uses both these paths to debug the executable file. The compilation path is the pathto the original project that built the executable file. If the original project is from an IDE on a different computer,you need to specify the compilation path in terms of the file system on that computer.
The local file system path is the path to the project that the CodeWarrior IDE creates to debug the executablefile.
Working with DebuggerDebugging Externally Built Executable Files
CodeWarrior for ARMv7 Targeting Manual, Rev. 10.0.8, 01/2016110 Freescale Semiconductor, Inc.

To specify a source lookup path for your executable file, perform the following steps:
1. Click the Source tab of the Debug Configurations dialog.
The corresponding page appears.
2. Click Add.
The Add Source dialog appears.
3. Select Path Mapping from the available list of sources.Figure 50: Add Source dialog
4. Click OK.
The Add Source dialog closes. The Path Mappings dialog appears.
5. In the Name text box, enter the name of the new path mapping.
6. Click Add.
The cursor blinks in the Compilation path column.
7. In the Compilation path column, enter the path to the parent project of the executable file, relative to thecomputer that generated the file.
Suppose the computer on which you debug the executable file is not the same computer that generated thatexecutable file. On the computer that generated the executable file, the path to the parent project is D:\workspace\originalproject. Enter this path in the Compilation path text box.
Working with DebuggerDebugging Externally Built Executable Files
CodeWarrior for ARMv7 Targeting Manual, Rev. 10.0.8, 01/2016Freescale Semiconductor, Inc. 111

You can use the IDE to discover the path to the parent project of the executable file,relative to the computer that generated the file. In the C/C++ Projects view of the C/C++ perspective, expand the project that contains the executable file that you want todebug. Next, expand the group that has the name of the executable file itself. A list ofpaths appears, relative to the computer that generated the file. Search this list for thenames of source files used to build the executable file. The path to the parent project ofone of these source files is the path you should enter in the Compilation path column.
TIP
8. In the Local file system path text box, enter the path to the parent project of the executable file, relative toyour computer. Click the ellipsis button to specify the parent project.
Suppose the computer on which you debug the executable file is not the same computer that generated thatexecutable file. On your current computer, the path to the parent project of the executable file is C:\projects\thisproject. Enter this path in the Local file system path text box.
9. Click OK.
The Path Mapping dialog closes. The mapping information now appears under the path mapping shown inthe Source Lookup Path list of the Source page.
10.If needed, change the order in which the IDE searches the paths.
The IDE searches the paths in the order shown in the Source Lookup Path list, stopping at the first match.To change this order, select a path, then click Up or Down to change its position in the list.
11.Click Apply.
The IDE saves your changes.
5.15.4 Debug Executable FileYou can use the CodeWarrior debugger to debug the externally built executable file.
To debug the executable file:
1. Select the project in the CodeWarrior Projects view.
2. Click the Debug button from the IDE toolbar.
The IDE switches to Debug perspective listing the debugging output.
Working with DebuggerDebugging Externally Built Executable Files
CodeWarrior for ARMv7 Targeting Manual, Rev. 10.0.8, 01/2016112 Freescale Semiconductor, Inc.

Chapter 6Multicore DebuggingThis chapter explains how to use the multicore debugging capability of the CodeWarrior debugger.
In this chapter:
• Debugging Multicore projects on page 113
• Multicore debugging commands on page 119
6.1 Debugging Multicore projectsThis section explains how to set launch configurations and how to debug multiple cores in a multi-coreproject.
The CodeWarrior debugger provides the facility to debug multiple ARMv7 processors using a single debugenvironment. The run control operations can be operated independently or synchronously. A common debugkernel facilitates multicore, run control debug operations for examining and debugging the interaction of thesoftware running on the different cores on the system.
To debug a multicore project, perform the steps given in the following sections:
• Setting launch configurations on page 113
• Debugging multiple cores on page 116
6.1.1 Setting launch configurationsSetting a launch configuration allows you to specify all core-specific initializations.
To set up the launch configurations, follow these steps:
1. Open the CodeWarrior project you want to debug.
2. Switch to the Debug perspective.
3. Select Run > Debug Configurations.
The Debug Configurations dialog appears (shown in the figure below) with a list of debug configurations thatapply to the current application.
4. Expand the CodeWarrior tree control.
5. From the expanded list, select the debug configuration for which you want to modify the debugger settings.For example, FirstProject-Test-core0_RAM_LS1021AQDS_Download
Multicore DebuggingDebugging Multicore projects
CodeWarrior for ARMv7 Targeting Manual, Rev. 10.0.8, 01/2016Freescale Semiconductor, Inc. 113

Figure 51: Debug Configurations dialog
6. On the Main tab, select a connection from the Connection drop-down list.
7. Select a core from the Target list.
8. Click Edit next to the Connection drop-down list.
The Properties for <connection> dialog appears.
Multicore DebuggingDebugging Multicore projects
CodeWarrior for ARMv7 Targeting Manual, Rev. 10.0.8, 01/2016114 Freescale Semiconductor, Inc.

Figure 52: Properties for <connection> dialog
9. Select a target from the Target drop-down list.
10.Select the required TAP connection from the Connection type drop-down list. For example, CodeWarriorTAP.
11.On the Connection tab, specify the hostname/IP of the target board in the Hostname/IP text box.
12.Enter the JTAG clock speed in the JTAG clock speed text box.
13.Specify the port number of the CCS server in the Server port number text box.
14.Click OK.
15.Click the Debugger tab in the Debug Configurations dialog.
The Debugger page appears.
16.Ensure that the Stop on startup at checkbox is selected and main is specified in the User specified textbox.
17.Click Apply to save the changes.
You have successfully configured a debug configuration.
18.Similarly, configure remaining debug configurations.
Multicore DebuggingDebugging Multicore projects
CodeWarrior for ARMv7 Targeting Manual, Rev. 10.0.8, 01/2016Freescale Semiconductor, Inc. 115
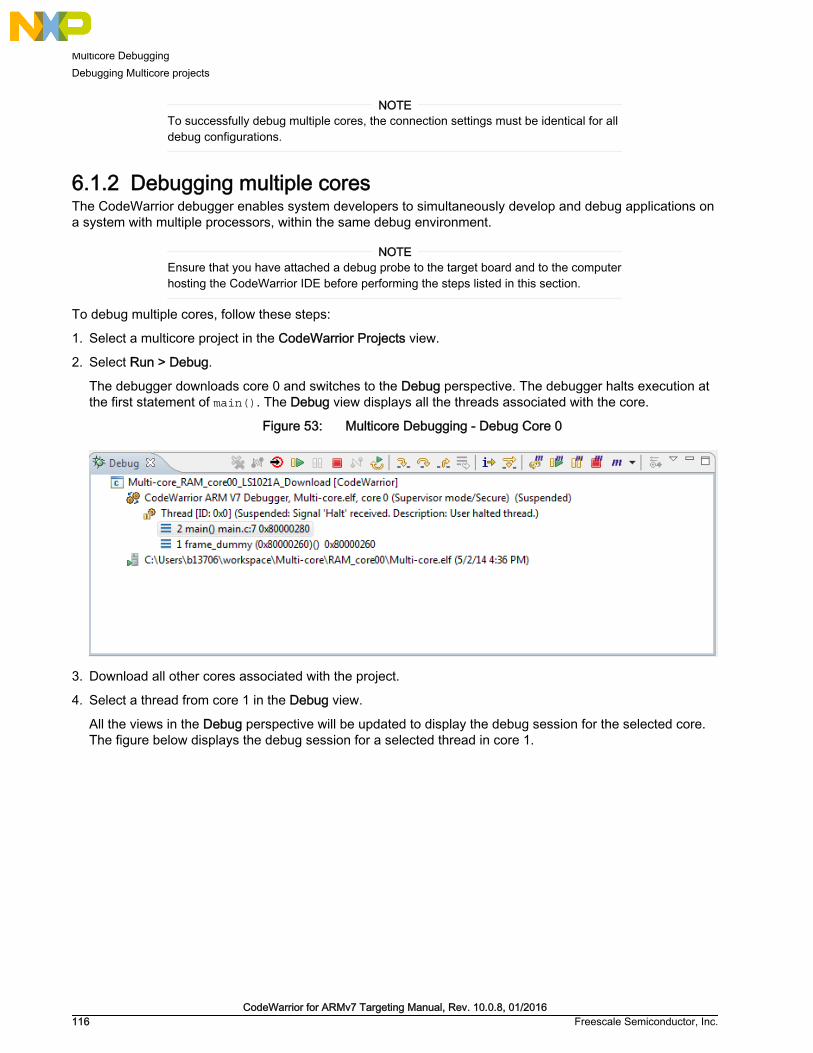
To successfully debug multiple cores, the connection settings must be identical for alldebug configurations.
NOTE
6.1.2 Debugging multiple coresThe CodeWarrior debugger enables system developers to simultaneously develop and debug applications ona system with multiple processors, within the same debug environment.
Ensure that you have attached a debug probe to the target board and to the computerhosting the CodeWarrior IDE before performing the steps listed in this section.
NOTE
To debug multiple cores, follow these steps:
1. Select a multicore project in the CodeWarrior Projects view.
2. Select Run > Debug.
The debugger downloads core 0 and switches to the Debug perspective. The debugger halts execution atthe first statement of main(). The Debug view displays all the threads associated with the core.
Figure 53: Multicore Debugging - Debug Core 0
3. Download all other cores associated with the project.
4. Select a thread from core 1 in the Debug view.
All the views in the Debug perspective will be updated to display the debug session for the selected core.The figure below displays the debug session for a selected thread in core 1.
Multicore DebuggingDebugging Multicore projects
CodeWarrior for ARMv7 Targeting Manual, Rev. 10.0.8, 01/2016116 Freescale Semiconductor, Inc.

Figure 54: Viewing Debug Information for Core 1
5. Select and expand the Core Registers group.
6. Select Run > Step Over.
The following actions occur:
• Debugger executes the current statement and halts at the next statement.
• The program counter (PC) indicator moves to the next executable source line in the Source view.
• In the Debug view, the status of the program changes to (Suspended).
• Modified register values are highlighted in yellow.
7. Select a thread from core 1 in the Debug view.
All the views in the Debug perspective will be updated to display the debug session for the selected core.
8. Select and expand the Core Registers group.
9. Select Run > Step Over.
The following actions occur:
• Debugger executes the current statement and halts at the next statement.
• The program counter (PC) indicator moves to the next executable source line in the Source view.
Multicore DebuggingDebugging Multicore projects
CodeWarrior for ARMv7 Targeting Manual, Rev. 10.0.8, 01/2016Freescale Semiconductor, Inc. 117

10.Issue several more Step Over commands and watch the register values change.
11.Select main() thread from core 0 again.
Notice that the register values remain unchanged. This is because the CodeWarrior debugger controls eachcore's execution individually.
12.With core 0 still selected, click the Step Over. button several times until you reach the printf()statement.
Debugger executes the current statement, the following statements, and halts at the printf() statement.
13.Switch to the other debug window.
14.Select the main() thread for core 1 by clicking it. Notice that the program counter icon in the Source viewdid not move. The debugger controls the execution of each core individually.
15.In the Debug view, click the Resume button.
Core 1 enters an infinite loop. The status of the program changes to (Running).
16.In the Debug view, click the main() thread for core 0 and click the Resume button.
Core 0 enters an infinite loop and core 1 continues to execute in its loop.
17.Select main() thread from core 1 and click the Suspend button.
The debugger halts core 1 at the current statement and the status of the program changes to (Halted). Core0 continues to execute.
18.Select Run > Multicore Terminate.
The debugger terminates the active debug session. The threads associated with each core in the Debug viewdisappear.
Similary, you can collect muticore trace data. In the Debug view, click Multicore Resume; the execution beginsand data measurement starts. Wait for some time. When output starts displaying for all the cores, click MulticoreTerminate. Trace viewer will show trace of all the cores as shown below.
Multicore DebuggingDebugging Multicore projects
CodeWarrior for ARMv7 Targeting Manual, Rev. 10.0.8, 01/2016118 Freescale Semiconductor, Inc.

Figure 55: Multicore Tracing
6.2 Multicore debugging commandsThis section describes the multi-core commands available in the Run menu of CodeWarrior IDE and in theDebugger Shell.
If you are debugging a multicore project, you can use single and multicore debugging commands to debug partsof each core project.
This section contains the following subsections:
• Multicore commands in CodeWarrior IDE on page 119
• Multicore commands in Debugger Shell on page 120
6.2.1 Multicore commands in CodeWarrior IDEWhen you start a multicore debug session, multicore commands are enabled on the CodeWarrior IDE Runmenu. These commands, when issued, affect all cores simultaneously.
The table below describes each menu choice.
Multicore DebuggingMulticore debugging commands
CodeWarrior for ARMv7 Targeting Manual, Rev. 10.0.8, 01/2016Freescale Semiconductor, Inc. 119

Table 54: Multi-core debugging commands
Command Icon Description
Multicore Resume Starts all cores of a multicore system running simultaneously.
Multicore Suspend Stops execution of all cores of a multicore systemsimultaneously.
Multicore Restart Restarts all the debug sessions for all cores of a multicoresystem simultaneously.
Multicore Terminate Kills all the debug sessions for all cores of a multicore systemsimultaneously.
Multicore Groups Use All Cores: If the selected debug context is a multicore system,then all cores are used for multicore operations.
Disable Halt Groups: Disables breakpoint halt groups.
Limit new breakpoints to current group: If selected, all newbreakpoints set during a debug session are reproduced only oncores belonging to the group of the core on which the breakpointis set.
Edit Target Types: Opens Target Types dialog that lets you addand remove system types.
Edit Multicore Groups: Opens the Multicore Groups dialog tocreate multicore groups. You can also use this option to modifythe existing multicore groups.
To use the multi-core commands from the Debug perspective, follow these steps:
1. Start a debugging session by selecting the appropriately configured launch configuration.
2. If necessary, expand the desired core's list of active threads by clicking on the tree control in the Debugview.
3. Click the thread you want to use with multicore operations.
4. From the Run menu, specify the multicore operation to perform on the thread.
The keyboard shortcut for the Multicore Resume operation is Alt+Shift+F8.
NOTE
6.2.2 Multicore commands in Debugger ShellIn addition to the multicore-specific toolbar buttons and menu commands available in the Debug view, theDebugger Shell has multicore specific commands that can control the operation of one or more processorcores at the same time.
Similar to the menu commands, the multicore debugger shell commands allow you to select, start, and stop aspecific core. You can also restart or kill sessions executing on a particular core. The table below lists and definesthe affect of each multicore debugging command.
Multicore DebuggingMulticore debugging commands
CodeWarrior for ARMv7 Targeting Manual, Rev. 10.0.8, 01/2016120 Freescale Semiconductor, Inc.

Table 55: Multi-Core debugging commands
Command Shortcut Description
mc::config mc::c List or edit multicore group options.
Syntax
mc::config
mc::go mc::g Resume multiple cores
Syntax
mc::go
Examples
mc::go
Resumes the selected cores associated with the current threadcontext.
mc::group mc::gr Display or edit multicore groups
Syntax
group group new <type-name> [<name>] group rename<name>|<group-index> <new-name>group remove <name>|<group-index> ... group removeall group enable|disable <index> ...|all
Examples
mc::group
Shows the defined groups, including indices for use in themc::group rename|enable|remove set of commands.
mc::group new 8572
Creates a new group for system type 8572. The group name willbe based on the system name and will be unique. The enablementof the group elements will be all non-cores enabled, all coresdisabled.
mc::group rename 0 "My Group Name"
Renames the group at index 0 to "My Group Name".
mc::group enable 0 0.0
Enables the group at index 0 and the element at index 0.0 of themc::group command.
mc::group remove "My Group Name"
Removes the group named "My Group Name".
mc::group removeall
Removes all groups.
Table continues on the next page...
Multicore DebuggingMulticore debugging commands
CodeWarrior for ARMv7 Targeting Manual, Rev. 10.0.8, 01/2016Freescale Semiconductor, Inc. 121

Table 55: Multi-Core debugging commands (continued)
Command Shortcut Description
mc::kill mc::kill Terminates the debug session for selected cores associated withthe current thread context.
Syntax
mc::kill
Examples
mc::kill
Terminates multiple cores.
mc::reset mc::reset Resets multiple cores.
Syntax
mc::reset
mc::restart mc::restart Restarts the debug session for selected cores associated with thecurrent thread context.
Syntax
mc::restart
Examples
mc::restart
Restarts multiple cores.
mc::stop mc::stop Stops the selected cores associated with the current threadcontext.
Syntax
mc::stop
Examples
mc::stop
Suspends multiple cores.
Table continues on the next page...
Multicore DebuggingMulticore debugging commands
CodeWarrior for ARMv7 Targeting Manual, Rev. 10.0.8, 01/2016122 Freescale Semiconductor, Inc.

Table 55: Multi-Core debugging commands (continued)
Command Shortcut Description
mc::type mc::t Shows the system types available for multicore debugging as wellas type indices for use by the mc::type remove and mc::groupnew commands.
Syntax
type type import <filename> type remove <filename>|<type-index> ... type removeall
Examples
mc::type
Display or edit system types.
mc::type import 8572_jtag.txt
Creates a new type from the JTAG configuration file.
mc::type remove 8572_jtag.txt
Removes the type imported from the specified file.
mc::type removeall
Removes all imported types.
Multicore DebuggingMulticore debugging commands
CodeWarrior for ARMv7 Targeting Manual, Rev. 10.0.8, 01/2016Freescale Semiconductor, Inc. 123

Multicore DebuggingMulticore debugging commands
CodeWarrior for ARMv7 Targeting Manual, Rev. 10.0.8, 01/2016124 Freescale Semiconductor, Inc.

Chapter 7Debugging Embedded Linux SoftwareThis chapter explains how to use the CodeWarrior Development Studio tools to debug embedded Linux®software for ARMv7 processors.
This chapter includes the following sections:
• Debugging Linux application on page 125
• Viewing multiple processes and threads on page 134
• Debugging applications that use fork() and exec() System Calls on page 135
• Debugging shared library on page 145
• Debugging Linux Kernel on page 153
• Debugging loadable kernel modules on page 165
7.1 Debugging Linux applicationThis section describes CodeWarrior Target-Resident Kernel (TRK) and provides information related to using itwith CodeWarrior projects.
For embedded Linux development, CodeWarrior TRK is a user-level application that resides on target embeddedLinux systems and accepts connections from the CodeWarrior debugger. You use the CodeWarrior remoteconnections feature to download and debug applications built with CodeWarrior projects. The CodeWarriordebugger connects to CodeWarrior TRK on the remote target system through a serial or ethernet connection.
On embedded Linux systems, CodeWarrior TRK is packaged as a regular Linux application, named apptrk.This application runs on the remote target system along side the program you are debugging to provideapplication-level debug services to the CodeWarrior debugger.
To debug a Linux application using CodeWarrior TRK:
• Install CodeWarrior TRK on target system on page 125
• Start CodeWarrior TRK on target system on page 126
• Create CodeWarrior download launch configuration for Linux application on page 128
• Specify Console I/O redirections for Linux application on page 131
• Configure Linux Process Signal Policy on page 132
• Debug Linux application on page 134
7.1.1 Install CodeWarrior TRK on target systemThis section explains how to install CodeWarrior TRK on target system.
To connect the CodeWarrior debugger to CodeWarrior TRK, the CodeWarrior TRK binary executable file mustbe installed and running on the remote target system. Once CodeWarrior TRK is running on the target system,the debugger can upload your application and debug the application on the target system.
Debugging Embedded Linux SoftwareDebugging Linux application
CodeWarrior for ARMv7 Targeting Manual, Rev. 10.0.8, 01/2016Freescale Semiconductor, Inc. 125

If CodeWarrior TRK is not present on a given target system, you need to use a filetransfer facility, such as Secure Copy (SCP) or File Transfer Protocol (FTP) to downloadthe CodeWarrior TRK binary executable file, AppTRK.elf, to a suitable location on thefile system of the target system. You also need to place the unstripped versions of theld.so, libpthread.so, and libthread_db.so files in the /lib directory of thetarget system to debug shared library code or multi-threaded code with CodeWarriorTRK.
NOTE
7.1.2 Start CodeWarrior TRK on target systemThis section explains how to start CodeWarrior TRK on target system.
How you start CodeWarrior TRK on the target hardware depends on the type of connection between the hostcomputer and that target hardware:
• Transmission Control Protocol/Internet Protocol (TCP/IP): The host computer communicates with the targethardware over a TCP/IP connection
• Serial cable: A serial cable connecting the host computer to the target hardware
CodeWarrior TRK can be started as either a root user or a normal user; however, if the application to bedebugged requires root permission, then you need to start CodeWarrior TRK as a root user. In other words,CodeWarrior TRK must have all the privileges required by the application that it will debug. You also need toensure that the download directory specified in the Remote tab of the launch configuration matches the userprivileges of the CodeWarrior TRK running on the target system.
This section contains the following subsections:
• TCP/IP connections on page 126
• Serial connections on page 127
7.1.2.1 TCP/IP connectionsThis section explains how to start CodeWarrior TRK through a TCP/IP connection.
The steps are as follows:
1. Connect to the remote target system.
a. On the host computer, open a new terminal window.
b. At the command prompt in the terminal window, enter the following command, where IPAddressrepresents the target system's IP address:
telnet IPAddress
The telnet client connects to the telnet daemon on the target system.
2. Navigate to the directory that contains the AppTRK.elf binary executable file.
The system changes the current working directory.
3. Type the following command (where Port is the listening port number optionally specified in theConnections panel of Debug window- typically 1000):
./AppTRK.elf :Port
CodeWarrior TRK starts on the target system, and listens to the specified TCP/IP port for connections fromthe CodeWarrior IDE.
Debugging Embedded Linux SoftwareDebugging Linux application
CodeWarrior for ARMv7 Targeting Manual, Rev. 10.0.8, 01/2016126 Freescale Semiconductor, Inc.

To continue use of the terminal session after launching CodeWarrior TRK, startCodeWarrior TRK as a background process by appending the ampersand symbol (&)to the launch command. For example, to start CodeWarrior TRK as a backgroundprocess listening to TCP/IP port number 6969, you would enter the following command:
./AppTRK.elf :6969 &
TIP
7.1.2.2 Serial connectionsThis section explains how to launch CodeWarrior TRK through a serial connection.
The steps are as follows:
To improve your debugging experience, we recommend the host computer running theIDE have two serial ports. In an ideal scenario, you would connect one serial port of thehost computer to the first serial port of the target board to monitor startup and consolelog messages. You would then connect another serial port of the host computer to thesecond serial port of the target board; the debugger would use this connection tocommunicate with CodeWarrior TRK on the target system.
TIP
1. Connect a serial cable between the host computer's serial port and the second serial port of the targetsystem.
2. On the host computer, start a terminal emulation program (such as minicom).
3. Configure the terminal emulation program with baud rate, stop bit, parity, and handshake settingsappropriate for the target system.
4. Connect the terminal emulator to the target system.
A command prompt appears in the terminal emulation program.
5. Boot the system. Log in as the root user.
6. Use the cd command at the command prompt to navigate to the directory where the CodeWarrior TRKbinary executable file, AppTRK.elf, resides on the target system.
The system changes the current working directory.
7. Configure the serial port on which CodeWarrior TRK is going to connect.
a. Enter this command: stty -F /dev/ttyS1 raw
This command configures the serial port for raw mode of operation. If you do not use raw mode, specialcharacters sent as part of packets may be interpreted (dropped), causing the connection to break.
b. Enter this command: stty -F /dev/ttyS1 ispeed 115200
The serial input speed is set to 115200 baud.
c. Enter this command: stty -F /dev/ttyS1 ospeed 115200
The serial output speed is set to 115200 baud.
d. Enter this command: stty -F /dev/ttyS1 crtscts
The terminal emulation program enables handshake mode
e. Enter this command: stty -a -F /dev/ttyS1
The system displays the current device settings.
Debugging Embedded Linux SoftwareDebugging Linux application
CodeWarrior for ARMv7 Targeting Manual, Rev. 10.0.8, 01/2016Freescale Semiconductor, Inc. 127

8. Enter the command: ./AppTRK.elf /dev/ttyS1
CodeWarrior TRK launches on the remote target system.
7.1.3 Create CodeWarrior download launch configuration for Linuxapplication
This section explains how to create a CodeWarrior download launch configuration for debugging a Linuxapplication on target system.
Follow these steps to create a CodeWarrior download launch configuration:
1. In the CodeWarrior Projects view of the C/C++ perspective, select the name of the project that builds theLinux application.
2. Select Run > Debug Configurations.
The Debug Configurations dialog appears.
3. Select CodeWarrior on the left-hand side of the Debug Configurations dialog.
4. Click the New launch configuration toolbar button of the Debug Configurations dialog.
The IDE creates a new launch configuration under the CodeWarrior group. The settings pages for this newlaunch configuration appear on the right-hand side of the Debug Configurations dialog.
5. In the Main tab of the Debug Configuration dialog:
a. Select Download from the Debug session type group.
b. Click New next to the Connection drop-down list.
The New Connection wizard appears.
6. Expand the CodeWarrior Application Debugging group and select Linux AppTRK, as shown in the figurebelow.
Debugging Embedded Linux SoftwareDebugging Linux application
CodeWarrior for ARMv7 Targeting Manual, Rev. 10.0.8, 01/2016128 Freescale Semiconductor, Inc.

Figure 56: Remote System - new connection wizard
7. Click Next.
The Linux AppTRK page appears.
8. Specify the connection name, description, template and connection type on this page.
9. When you select the connection type, the corresponding Connection tab appears (shown in the figurebelow).
Debugging Embedded Linux SoftwareDebugging Linux application
CodeWarrior for ARMv7 Targeting Manual, Rev. 10.0.8, 01/2016Freescale Semiconductor, Inc. 129

Figure 57: Remote Linux AppTRK System connection Page
10.Specify the settings as appropriate for the connection between the host computer and the target hardwareon this page.
11.Click Finish.
The new remote system that you just created appears in the Connection drop-down list.
12.Click the Debugger tab.
The Debugger options panel appears with the respective tabs.
13.On the Debug tab, if required, specify a function or address in the application where you want the programcontrol to stop first in the debug session:
a. Select the Stop on startup at checkbox.
The IDE enables the corresponding text box.
b. Enter in the text box an address or a function inside the application.
14.Click the Remote tab.
The corresponding sub-page comes forward.
15.Enter in the Remote download path text box the path of a target-computer directory to which the Linuxapplication, running on the target hardware, can read and write files.
The specified directory must exist on the target system.
NOTE
Debugging Embedded Linux SoftwareDebugging Linux application
CodeWarrior for ARMv7 Targeting Manual, Rev. 10.0.8, 01/2016130 Freescale Semiconductor, Inc.

16.If required, specify information about other executable files to debug in addition to the Linux application:
a. Click the Other Executables tab.
The corresponding sub-page appears.
b. Use the sub-page settings to specify information about each executable file.
17.Click Apply.
The IDE saves the pending changes you made to the launch configuration.
You just finished creating a CodeWarrior download launch configuration that you can use to debug the Linuxapplication.
7.1.4 Specify Console I/O redirections for Linux applicationCodeWarrior TRK allows you to specify I/O redirections as arguments for applications to be debugged.
This feature allows users to use a file on the target or even the target console for file descriptors, including stdin,stdout, and stderr. By default, the CodeWarrior TRK running on the target forwards the output of theapplication to the host CodeWarrior. The host CodeWarrior will be able to print the received output only if theAllocate Console (necessary for input) checkbox is selected in the Common tab of the Debug Configurationsdialog.
The CodeWarrior console, allocated for the debugged application, can only be used toview the output of the application running on the target; forwarding the input from aCodeWarrior console to the debugged application is not supported currently for Linuxapplications.
NOTE
The listing below displays the syntax to specify I/O redirections for the stdin, stdout, and stderr filedescriptors.
Figure 58: Specifying I/O redirections
- '< <filename>' - stdin redirection from <filename> - '> <filename>' - stdout redirection to <filename> - '2> <filename>' - stderr redirection to <filename>
To specify I/O redirections for a Linux application:
1. In the CodeWarrior Projects view of the C/C++ perspective, select the name of the project that builds theLinux application.
2. Select Run > Debug Configurations.
The Debug Configurations dialog appears.
3. Expand CodeWarrior group and select the launch configuration associated with the project.
The settings pages for the selected launch configuration appears on the right-hand side of the DebugConfigurations dialog.
4. Click the Arguments tab.
5. Specify the I/O redirections in the Program arguments text box.
6. Click Apply to save the changes.
The listing below displays an example of redirections, added to the list of arguments, to forward the output tothe console where CodeWarrior TRK was started.
Debugging Embedded Linux SoftwareDebugging Linux application
CodeWarrior for ARMv7 Targeting Manual, Rev. 10.0.8, 01/2016Freescale Semiconductor, Inc. 131

Figure 59: Sample I/O redirections
- '< /proc/self/fd/0' -> use target console for stdin (this way, stdin is functional and can be used - using a CW console it isn't) - '> /proc/self/fd/1' -> use target console for stdout - '2> /proc/self/fd/2' -> use target console for stderr
7.1.5 Configure Linux Process Signal PolicyThis section explains how to control applications being debugged using signals and how to manage signals,using CodeWarrior IDE.
AppTRK and CodeWarrior can be configured to stop the application being debugged, whenever the applicationreceives a signal. A user can send signals to the application directly from CodeWarrior, when the applicationresumes execution. To send a signal to an application, right-click the signal name in the Signals view and selectResume With Signal from the context menu that appears.
This section contains the following subsections:
• Signal inheritance on page 132
• Default Signal Policy on page 132
• Modifying Signal Policy on page 132
7.1.5.1 Signal inheritanceWhen a new process is forked, it inherits the signal settings from the parent process.
For example, if a process has a setting that if the SIGUSR1 signal is received, the application being debuggedwill be stopped, then a child process forked by this process will also inherit this setting. It will stop the applicationbeing debugged if the SIGUSR1 signal is received.
All the threads created by a process share the signal settings of that process. Signal settings cannot beconfigured at thread level.
7.1.5.2 Default Signal PolicyBy default, the SIGINT, SIGILL, SIGTRAP, SIGSTOP, and SIGSEGV signals are caught by the debugger.
The debugger stops the application being debugged if any of these signals is received.
7.1.5.3 Modifying Signal PolicyCodeWarrior IDE provides a view, Signals, which can be used to view signals and change the debugger'spolicy for a signal.
To open the Signals view, perform the following steps:
1. Select Window > Show View > Other in the CodeWarrior IDE.
The Show View dialog appears.
2. Select Debug > Signals.
The Signals view appears, as shown in the figure below.
Debugging Embedded Linux SoftwareDebugging Linux application
CodeWarrior for ARMv7 Targeting Manual, Rev. 10.0.8, 01/2016132 Freescale Semiconductor, Inc.

Figure 60: Signals view
To send a signal to a stopped process or thread, right-click the signal in the Signals view and select ResumeWith Signal, as shown in the figure below.
Figure 61: Sending Signal to Process or Thread
To catch a signal, perform the following steps:
1. Right-click the signal in the Signals view and select Signal Properties.
The Properties for window appears (shown in the figure below).
2. Select the Suspend the program when this signal happens checkbox, as shown in the figure below.Figure 62: Catching Signal
The figure below shows a child process stopped on receiving the SIGUSR1 signal.
Figure 63: Stopped Child Process
Some signals cannot be caught, but they can be passed to the debugged application. These signals have read-only properties. One such signal is SIGKILL.
Debugging Embedded Linux SoftwareDebugging Linux application
CodeWarrior for ARMv7 Targeting Manual, Rev. 10.0.8, 01/2016Freescale Semiconductor, Inc. 133

7.1.6 Debug Linux applicationYou can use the CodeWarrior download launch configuration created earlier to debug the Linux application onthe target system.
You can use that launch configuration to start a debug session that can be used to debug a Linux application.
The steps are as follows:
1. On the left-hand side of the Debug Configurations dialog, ensure to select the CodeWarrior downloadlaunch configuration that you created to debug the Linux application.
2. Click Debug in the Debug Configurations dialog.
The IDE uses the selected CodeWarrior download launch configuration to start a debugging session andopens the Debug view, as shown in the figure below.
Figure 64: Debug view - Sample Linux application
You just finished using the CodeWarrior download launch configuration to debug a Linux application.
7.2 Viewing multiple processes and threadsThis section explains how to view all processes and threads on a target.
When you debug an application, the CodeWarrior debugger opens the Debug view. In this view, you can seeonly processes and threads/tasks on which debugger is attached, as shown in the figure below.
Debugging Embedded Linux SoftwareViewing multiple processes and threads
CodeWarrior for ARMv7 Targeting Manual, Rev. 10.0.8, 01/2016134 Freescale Semiconductor, Inc.

Figure 65: Debug view - processes and threads
For Linux debugging, you can view all processes on target in the System Browser view.
To view processes and threads in System Browser view:
1. Open a Linux application in the CodeWarrior IDE.
2. Select Run > Debug.
The Debug perspective appears.
3. While the application is running, select Window > Show View > Other.
The Show View dialog appears.
4. From the Debug group, select System Browser.
5. Click OK.
The System Browser window appears with the process and thread information (shown in the figure below).Keeping this view open increases the time required to suspend a core.
Figure 66: System Browser window
7.3 Debugging applications that use fork() and exec() SystemCalls
This section shows you how to use the CodeWarrior debugger to debug programs that contain fork() andexec() system calls.
The table below describes the fork() and exec() system calls.
Debugging Embedded Linux SoftwareDebugging applications that use fork() and exec() System Calls
CodeWarrior for ARMv7 Targeting Manual, Rev. 10.0.8, 01/2016Freescale Semiconductor, Inc. 135

Table 56: fork() and exec() description
System Call Description
fork() This generic Linux system call creates a new process that is the exact replicaof the process that creates it. This call returns 0 to the child process andreturns the PID (Process ID) of the newly-created child process to the parentprocess.
exec() This Linux system call launches a new executable in an already runningprocess. The debugger destroys the instance of the previous executableloaded into that address space and a new instance is created.
You can also pick up sample Linux applications from the following folder:
<CWInstallDir>\CW_ARMv7\ARMv7\ARM_Linux\AppDebug\Examples
NOTE
For CodeWarrior debugging purposes, when applications call the fork() system call, the debugger instead callsthe clone() system call with the flag CLONE_PTRACE. This causes:
• The operating system to attach CodeWarrior TRK to the child process
• The child process to stop with a SIGTRAP on return from the clone() system call
To make this happen, you must add a static library to your CodeWarrior project. The source code for buildingthe static library is described later in this section.
Before you start the tutorial, ensure that you have:
• Installed the BSP on Linux
• Created a TCP/IP connection between the host computer and the remote target
• Launched CodeWarrior TRK on the target system
These steps demonstrate how to use the CodeWarrior IDE to debug programs that contain fork() and exec()system calls:
1. Create a CodeWarrior project with the settings listed in the table below.
Table 57: Static Library Project Settings
Option Name Value
Project name Fork
Location <workspace-dir>\Fork
Project type Linux application
Language C
The IDE creates a project with a debug launch configuration.
2. Create a new build configuration. Right-click the project folder and select Build Configurations > Manage.
The Fork: Manage Configurations dialog appears.
3. Rename the default debug configuration to Fork.
4. Click New to create a new build configuration.
The Create New Configuration dialog appears.
Debugging Embedded Linux SoftwareDebugging applications that use fork() and exec() System Calls
CodeWarrior for ARMv7 Targeting Manual, Rev. 10.0.8, 01/2016136 Freescale Semiconductor, Inc.

5. In the Name field, enter the configuration name, Fork2Clone.
6. From the Copy settings from options, select Existing configuration.
7. Click OK. The Fork: Manage Configurations dialog appears (shown in the figure below).Figure 67: Fork: Manage Configurations dialog
8. Activate the Fork2Clone build configuration.
9. Build the Fork2Clone build configuration by right-clicking it in the CodeWarrior Projects view and selectingBuild Project from the context menu. The CodeWarrior IDE builds the project and stores the supportlibrary, libfork2clone.a, in the Output directory within the project directory.
Remember to build the Fork2Clone build configuration before the Fork buildconfiguration to avoid getting a library file missing error as the libfork2clone.a isused in the Fork project.
NOTE
10.To specify the linker settings and add the support library to the project.
a. Right-click the Fork build configuration in the CodeWarrior Projects view.
b. Select Properties from the context menu. The Properties window for the shared library project appears.
c. From the C/C++ Build group, select Settings.
d. On the Tool Settings page, from the ARM Sourcery Windows GCC Linker container, select Libraries.
e.In the Libraries (-l) panel, click Add ( ). The Enter Value dialog appears.
f. Enter the library file name in the Libraries field.
g.In the Libraries search path (-L) panel, click Add ( ). The Add directory path dialog appears.
h. Enter the library path in the Directory field, as shown in the figure below.
These settings enable the CodeWarrior IDE linker to locate the shared librarylibfork2clone.a. For detailed information on other linker command line arguments,refer to GNU linker manuals. You can find GNU documentation here: http://www.gnu.org.
NOTE
Debugging Embedded Linux SoftwareDebugging applications that use fork() and exec() System Calls
CodeWarrior for ARMv7 Targeting Manual, Rev. 10.0.8, 01/2016Freescale Semiconductor, Inc. 137

Figure 68: Libraries Linker Settings - Fork project
11.Remove the default main.c file from the project.
12.Add a new db_fork.c file to the project.
13.Enter the below code in the editor window of db_fork.c file.Figure 69: Source code for db_fork.c
/* --------------------------
User Include files
--------------------------
*/
#include "db_fork.h"
/*
-------------------------
Main Program
-------------------------
*/
Debugging Embedded Linux SoftwareDebugging applications that use fork() and exec() System Calls
CodeWarrior for ARMv7 Targeting Manual, Rev. 10.0.8, 01/2016138 Freescale Semiconductor, Inc.

int __libc_fork(void)
{
return( __db_fork() );
}
extern __typeof (__libc_fork) __fork __attribute__ ((weak, alias ("__libc_fork")));
extern __typeof (__libc_fork) fork __attribute__ ((weak, alias ("__libc_fork")));
14.Create a header file db_fork.h in your project directory and add the below code in the header file.Figure 70: Source code for db_fork.h
#include <asm/unistd.h>#include <sys/syscall.h>#include <errno.h>#include <signal.h>#include <sched.h>#define __NR___db_clone__NR_clone#define __db_fork() syscall(__NR___db_clone, SIGCHLD | CLONE_PTRACE, 0);
15.Enter the below code in the editor window of fork.c file.Figure 71: Source code for fork.c
/*/*
* fork.c
*
*/
/*------------------------------------------------------------------*
System Include files
*-----------------------------------------------------------------*/
#include <stdio.h>
#include <unistd.h>
#include <stdlib.h>
#include <sys/ptrace.h>
#include <sys/errno.h>
Debugging Embedded Linux SoftwareDebugging applications that use fork() and exec() System Calls
CodeWarrior for ARMv7 Targeting Manual, Rev. 10.0.8, 01/2016Freescale Semiconductor, Inc. 139

#include <sys/types.h>
#include <signal.h>
#include <sched.h>
#include <fcntl.h>
#include <dlfcn.h>
/*-------------------------------------------------------------------*
Function Prototypes
* -----------------------------------------------------------------*/
int fn1(int j);
int fn2(int i);
/*------------------------------------------------------------------*
Global Variables
*------------------------------------------------------------------*/
int gint;
/*------------------------------------------------------------------*
Main Program
*-----------------------------------------------------------------*/
int main(void)
{
int pid,x;
int shared_local;
printf( "Fork Testing!\r\n" );
fflush( stdout );
gint = 5;
shared_local =5;
pid = fork();
if(pid == 0)
{
x=0;
gint = 10;
Debugging Embedded Linux SoftwareDebugging applications that use fork() and exec() System Calls
CodeWarrior for ARMv7 Targeting Manual, Rev. 10.0.8, 01/2016140 Freescale Semiconductor, Inc.

shared_local = fn1(9);
printf("\nForked : Child");
printf("\nChild:Global=%d,Shared_Local=%d",gint,shared_local);
printf("\nChild pid = %d, parent pid =%d \n", getpid(),getppid());
fflush( stdout );
}
else
{
x=0;
gint = 12;
shared_local = fn2(11);
printf("\nForked : Parent");
printf("\nParent:Global=%d,Shared_Local=%d",gint,shared_local);
printf("\nParent pid = %d, Parent's parent pid =%d \n", getpid(),getppid());
fflush( stdout );
}
return 0;
}
int fn1(int j)
{
j++;
return j;
}
int fn2(int i)
{
i++;
return i;
Debugging Embedded Linux SoftwareDebugging applications that use fork() and exec() System Calls
CodeWarrior for ARMv7 Targeting Manual, Rev. 10.0.8, 01/2016Freescale Semiconductor, Inc. 141

}
The code of the parent process creates a forked process (child process) when the __db_fork functionexecutes. The debugger opens a separate thread window for the child process. When the child processfinishes executing, the debugger closes the thread window. To debug the code of the child process, you needto set a breakpoint in the child process code. You can debug the code of the child process the same way youdebug code of any other process.
16.Create another project, Exec, and create two new build configurations with the following settings:
Table 58: Exec example project settings
Option Name Value
Project name Exec
Location <workspace-dir>\Exec
Project type Linux application
Language C
Build configurations • Exec
• Exec-1
17.Add the source files exec.c and exec-1.c to the Exec project.
• exec.c: The code demonstrating exec() functionality
• exec-1.c: Generates the executable file exec-1.elf
As you step through the code of the exec.elf file, the exec() function call executes and a separate debuggerwindow for the exec-1.elf appears. You can perform normal debug operations in this window. The debuggerdestroys the instance of the previous file (exec.elf) and creates a new instance for the exec-1.elf file.
18.Enter the below code in the editor window of Exec.c file.Figure 72: Source code for Exec.c
/** Exec.c * * Demonstrates Exec system call functionality */ /*------------------------------------------------------------------------------* System Include files *------------------------------------------------------------------------------*/#include <stdio.h>#include <unistd.h>/*------------------------------------------------------------------------------* Constant Defintions *------------------------------------------------------------------------------*/#define EXEC_1 "/tmp/Exec-1.elf"
/*------------------------------------------------------------------------------* Main Program *------------------------------------------------------------------------------*/int main(void){
Debugging Embedded Linux SoftwareDebugging applications that use fork() and exec() System Calls
CodeWarrior for ARMv7 Targeting Manual, Rev. 10.0.8, 01/2016142 Freescale Semiconductor, Inc.

char *argv[2]; printf("Exec Testing!\r\n" ); printf("Before exec my ID is %d\n",getpid()); printf("My parent process's ID is %d\n",getppid()); fflush( stdout ); /*Calling another program exec-1.elf*/ argv[0] = EXEC_1; argv[1] = NULL; printf("exec starts\n"); execv(argv[0],argv); printf("This will not print\n"); fflush( stdout ); return 0;}
19.Enter the below code in the editor window of Exec-1.c file.Figure 73: Source code for Exec-1.c
/** Exec-1.c *Demonstrates Exec system call functionality *//*-------------------------------------------------------------------* System Include files*-------------------------------------------------------------------*/#include <stdio.h>#include <unistd.h>/*-------------------------------------------------------------------* Main Program*-------------------------------------------------------------------*/int main(void){ printf("After exec my process ID is %d\n",getpid()); printf("My parent process's ID is %d\n",getppid()); printf("exec ends\n"); fflush( stdout ); return 0;}
20.Create the build configurations for building Exec.elf and Exec-1.elf (similar to creating the buildconfigurations for the Fork project).
21.Build Exec project.
a. Select the Exec build configuration, if not selected.
b. Select Project > Build Project.
The CodeWarrior IDE generates the exec.elf, and exec-1.elf executable files and places them in theproject folder.
22.Specify the remote download path of the executable files to be launched by the exec() system call.
a. Select Run > Debug Configurations to open the Debug Configurations dialog.
b. In the left panel from the CodeWarrior group, select the Exec launch configuration.
c. On the Debugger page, click the Remote tab.
d. Type /tmp in the Remote Download Path field, as shown in the figure below. This specifies that the finalexecutable file will be downloaded to this location on the target platform for debugging.
Debugging Embedded Linux SoftwareDebugging applications that use fork() and exec() System Calls
CodeWarrior for ARMv7 Targeting Manual, Rev. 10.0.8, 01/2016Freescale Semiconductor, Inc. 143

For this tutorial, the remote download path is specified as /tmp. If you wish, you mayspecify an alternate remote download path for the executable file.
NOTE
Figure 74: Remote download path - shared library project
23.Specify the host-side location of the executable files to be launched by the exec() system call.
a. Click the Other Executables tab.
b. Click Add. The Debug Other Executable dialog appears.
c. Click File System. The Open dialog appears.
d. Navigate to the location of the exec-1.elf file in your project directory.
e. Select the exec-1.elf file name.
f. Click Open. The host-side location of exec-1.elf appears in the Additional Executable File text box.
g. Select the Load Symbols checkbox.
h. Select the Download to Device checkbox. The Specify the remote download path field is activated.
If you do not want to download the selected file on the target platform, do not select theDownload to Device checkbox.
NOTE
i. Type /tmp in the Remote download path text box. The shared library will be downloaded to this locationwhen you debug or run the executable file.
j. Click OK. The settings are saved.
24.Click Apply to save the settings made to the launch configuration.
25.Set breakpoints in the child and parent processes.
a. Double-click the fork.c file name in the CodeWarrior Projects view.
b. Set a breakpoint in the code of the child process at this line: x=0;
c. Set a breakpoint in the code of the parent process.
d. Close the fork.c file.
26.Select Run > Debug.
The debugger window appears and the Fork project starts debugging. As a result, the Fork.elf andlibfork2clone.a files are downloaded on the target system.
27.Step over the code until you reach the line of code that calls the fork() system call: pid = fork ();
When the fork() system call is called, the child process debugger window appears. You can now performnormal debugging operations in this window.
Debugging Embedded Linux SoftwareDebugging applications that use fork() and exec() System Calls
CodeWarrior for ARMv7 Targeting Manual, Rev. 10.0.8, 01/2016144 Freescale Semiconductor, Inc.

28.Step over the code in the child process debugger window a couple of times.
29.Next, step over the code in the parent process debugger window a couple of times.
The console window of the parent process is shared by the child process.
NOTE
30.Terminate the debug session.
31.Clear previously set breakpoints.
32.Select Run > Debug for Exec project.
33.Set a breakpoint in the Exec.c file on the line containing the execv() function call.
34.Click Resume. The target stops at the line where you set the breakpoint.
35.Click Resume. The exec() call is executed and the debugger stops in the main() function of theExec-1.elf file.
36.Execute some steps in Exec-1.c file.
37.Terminate the debug session and remove all breakpoints.
7.4 Debugging shared libraryThis section demonstrates how to debug a shared library that is implicitly linked to an application.
CodeWarrior allows you to do source-level debugging of shared libraries. When you debug an executable fileusing a shared library, you can step into the shared library code.
This tutorial demonstrates how to debug a shared library that is implicitly linked to an application. In this tutorial:
• Create an example project on page 145
• Configure shared library build configuration on page 148
• Configure executable build configuration on page 148
• Build shared library on page 149
• Build executable on page 149
• Configure launch configuration on page 149
• Debug shared library on page 151
7.4.1 Create an example projectFirst of all, you need to create an example Linux project that uses a shared library.
To create an example Linux project, perform the following steps:
1. In the CodeWarrior IDE, use File > New > CodeWarrior Linux Project Wizard to create a new Linux projectwith the settings given in the table below.
Instead of creating a new Linux project, you can import an example Linux project,SharedLibrary, available in the <CWInstallDir>\CW_ARMv7\ARMv7\ARM_Linux\AppDebug\Examples folder as a reference. Theexample project can be imported as a CodeWarrior Example Project using the File >Import menu bar option.
NOTE
Debugging Embedded Linux SoftwareDebugging shared library
CodeWarrior for ARMv7 Targeting Manual, Rev. 10.0.8, 01/2016Freescale Semiconductor, Inc. 145

Table 59: Example Project Settings
Option Name Value
Project name SharedLibraryExample
Location <workspace-dir>\SharedLibraryExample
Project type Linux application
Language C
Build configurations • LibExample (generates the dynamic library needed by the launchconfigurations)
• SharedLib_IM (used to demonstrate implicit linking with the librarygenerated by LibExample build configuration)
Launch configurations SharedLib_IM (launches the application that demonstrates implicit linkingwith a shared library)
In this tutorial, we only mention implicit library linking; however, in the example projectshipped with CodeWarrior, SharedLibrary, we have also demonstrated explicitlibrary loading. For explicit library loading, we have used another build/launchconfiguration, SharedLib_EX.
NOTE
2. Remove the default main.c file and add the source files (SharedLib_IM.c and LibExample.c) to yourproject.
3. In the CodeWarrior IDE, create a header file, LibExample.h, as depicted in the listing below.Figure 75: Source Code for LibExample.h
/* LibExample.h */int add_example(int x,int y);int add_example_local(int x,int y);
4. Save the LibExample.h file in the project directory.
5. Enter the below code into the editor window of the SharedLib_IM.c file.Figure 76: Source Code for SharedLib_IM.c
/* Sharedlib_IM.c
Demonstrates implicit linking.
*/
// User Include files
#include "LibExample.h"
// function prototype declaration
int temp (int, int);
Debugging Embedded Linux SoftwareDebugging shared library
CodeWarrior for ARMv7 Targeting Manual, Rev. 10.0.8, 01/2016146 Freescale Semiconductor, Inc.

// main program
int main ()
{
int ret;
int a, b;
a = 10;
b = 20;
ret = temp (a, b);
ret = add_example (a, b); // step in here
return ret;
}
int temp(int i, int j)
{
return i + j;
}
6. Enter the below code into the editor window of the LibExample.c file.Figure 77: Source Code for LibExample.c
/* LibExample.c
*/
// user include files#include "LibExample.h"// functions definitions
int add_example( int x, int y)
{
int p,q;
p=100;
q=p+200;
add_example_local (2, 3); // step in here
return x+y+q;
}
int add_example_local (int x, int y)
Debugging Embedded Linux SoftwareDebugging shared library
CodeWarrior for ARMv7 Targeting Manual, Rev. 10.0.8, 01/2016Freescale Semiconductor, Inc. 147

{
int p,q;
p = 100;
q = p + 200;
return x + y + q;
}
7.4.2 Configure shared library build configurationThe next action is to configure the LibExample build configuration, which generates libexample.so.
The steps are given below:
1. Select the SharedLibraryExample project in the CodeWarrior Projects view.
2. Select the LibExample build configuration by selecting Project > Build Configurations > Set Active > <BuildConfiguration Name>.
3. Check LibExample.c and LibExample.h in the Build column.
Use the CodeWarrior example project, SharedLibrary, as a reference to set up thebuild configuration settings of the LibExample build configuration.
TIP
7.4.3 Configure executable build configurationNow, you need to set up the SharedLib_IM build configuration.
For this, perform the following steps:
1. Select the SharedLibraryExample project in the CodeWarrior Projects view.
2. Select the SharedLib_IM build configuration by selecting Project > Build Configurations > Set Active ><Build Configuration Name>.
3. Specify the linker settings.
a. Select the SharedLib_IM build configuration in the CodeWarrior Projects view.
b. Select Project > Properties. The Properties window for the shared library project appears.
c. In the Tool settings page, from the ARM Sourcery Windows GCC C Linker container, select Libraries.
d.In the Libraries (-l) panel, click Add ( ). The Enter Value dialog appears.
e. Enter the library file name, example, in the Libraries field.
f.In the Library search path (-L) panel, click Add ( ). The Add directory path dialog appears.
g. Enter the library path in the Directory field. The library path is the path of the Output directory that isused by LibExample build configuration.
Debugging Embedded Linux SoftwareDebugging shared library
CodeWarrior for ARMv7 Targeting Manual, Rev. 10.0.8, 01/2016148 Freescale Semiconductor, Inc.

These settings enable the CodeWarrior IDE linker to locate the shared library,libexample.so. For detailed information on other linker command line arguments,see GNU linker manuals. You can find GNU documentation here: http://www.gnu.org.
NOTE
7.4.4 Build shared libraryThe next action is to build the shared library.
To build the shared library, perform the following steps:
1. Select the SharedLibraryExample project in the CodeWarrior Projects view.
2. Select the LibExample build configuration by selecting Project > Build Configurations > Set Active > <BuildConfiguration Name>.
3. Select Project > Build Project. The CodeWarrior IDE builds the project and stores the output filelibexample.so in the Output directory within the project directory.
7.4.5 Build executableNow, you need to build the executable that uses the shared library.
To build the executable that uses the shared library, perform the following steps:
1. Select the SharedLibraryExample project in the CodeWarrior Projects view.
2. Select the SharedLib_IM build configuration by selecting Project > Build Configurations > Set Active ><Build Configuration Name>.
You can also select a build configuration from the drop-down list that appears when youclick the down arrow next to the project name in the CodeWarrior Projects view.
TIP
3. Select Project > Build Project. The CodeWarrior IDE builds the project and stores the output fileSharedLib_IM.elf in the Output directory within the project directory.
7.4.6 Configure launch configurationThe next action is to configure the SharedLib_IM launch configuration.
Configuring the SharedLib_IM launch configuration involves:
• Specifying the remote download path of the final executable file
• Specifying the host-side location of the executable file to be used for debugging the shared library
• Specifying the environment variable that enables the shared object loader to locate the shared library on theremote target at run time
The steps are as follows:
1. Activate the SharedLib_IM launch configuration in the project.
2. Specify the remote download path of the final executable file.
a. Select Run > Debug Configurations to open the Debug Configurations dialog.
b. In the left pane from the CodeWarrior group, select the SharedLib_IM launch configuration.
c. On the Debugger page, click the Remote tab.
d. Type /tmp in the Remote Download Path field, as shown in the figure below. This specifies that the finalexecutable file will be downloaded to this location on the target platform for debugging.
Debugging Embedded Linux SoftwareDebugging shared library
CodeWarrior for ARMv7 Targeting Manual, Rev. 10.0.8, 01/2016Freescale Semiconductor, Inc. 149

For this tutorial, the remote download path is specified as /tmp. You can replace /tmpwith any other directory for which CodeWarrior TRK has the necessary accesspermissions.
NOTE
Figure 78: Remote download path - shared library project
3. Specify the host-side location of the executable file to be used for debugging the shared library.
a. Click the Other Executables tab in the Debugger page.
b. Click Add. The Debug Other Executable dialog appears.
c. Click Workspace. The Open dialog appears.
d. Navigate to the location where you have stored the libexample.so file in your project directory.
e. Select the libexample.so file name.
f. Click Open. The host-side location of the shared library appears in the Specify the location of the otherexecutable field.
g. Select the Load Symbols checkbox, so that the debugger has visibility of symbols within the library.
h. Select the Download to Device checkbox. The Specify the remote download path field is activated.
i. Type /tmp in the Remote download path text box. The shared library will be downloaded to this locationwhen you debug or run the executable file.
The default location of shared libraries on the embedded Linux operating system is /usr/lib. For thistutorial, the remote download location of libexample.so is /tmp.
j. Click OK. The settings (shown in the figure below) are saved.Figure 79: Debug Other Executable dialog
Debugging Embedded Linux SoftwareDebugging shared library
CodeWarrior for ARMv7 Targeting Manual, Rev. 10.0.8, 01/2016150 Freescale Semiconductor, Inc.

4. Specify the environment variable that enables the shared object loader to locate the shared library on theremote target at run time.
At run time, the shared object loader first searches for a shared library in the path specified by theLD_LIBRARY_PATH environment variable's value. In this case, the value of this environment variable will be /tmp, which is the remote download path for the shared library you specified in the Debug Other Executabledialog. If you have not specified the environment variable or have assigned an incorrect value, the sharedobject loader searches for the shared library in the default location /usr/lib.
a. In the Debug window, click Environment to open the Environment page.
b. Click New to open the New Environment Variable dialog.
c. In the Name field, type LD_LIBRARY_PATH.
d. In the Value field, type /tmp.
Ensure that you type the same remote download path in the Value field that you specifiedin the Debug Other Executable dialog.
NOTE
e. Click OK. The environment variable is added to the launch configuration.
f. Add another environment variable with name, AVOID_SYSTEM_PATH and value YES.
The AVOID_SYSTEM_PATH variable sets the launch configuration to use the library pathsettings you specify. By specifying the value YES you avoid the launch configurationfrom picking up any other system path.
NOTE
g. Click Apply to save the launch configuration settings. The target settings are saved (shown in the figurebelow).
Figure 80: Environment variables - shared library project
h. Click OK to close the Debug view.
7.4.7 Debug shared libraryFinally, you need to debug the shared library.
In the steps that follow, you will launch the debugger. Next, you will step through the code of the executable fileSharedLib_IM.elf until you reach the code that makes a call to the add_example function implemented in theshared library. At this point, you will step into the code of the add_example function to debug it.
1. Activate the SharedLib_IM launch configuration in the project.
2. Select Run > Debug.
Debugging Embedded Linux SoftwareDebugging shared library
CodeWarrior for ARMv7 Targeting Manual, Rev. 10.0.8, 01/2016Freescale Semiconductor, Inc. 151

The debugger starts and downloads the SharedLib_IM.elf and libexample.so files to the specifiedlocation on the remote target, one after another. The Debug perspective appears.
3. Click Step Over in the debugger window until you reach the following line of code (shown in the figurebelow):
ret=add_example(a,b)
Before you set breakpoints in the code of an imported shared library to step into thecode, you can use the Executables view to navigate and check the source files of thelibrary. For more information on the Executables view, open CodeWarrior Eclipse Helpby selecting Help > Help Contents in the CodeWarrior IDE, and then select Third PartyReferences > C/C++ Development User Guide > Reference > C/C++ Views and Editors> Executables view in the Contents pane.
TIP
Figure 81: SharedLib_IM.c - step in location
4. In the Debug view, click Step Into to step into the code of the add_example function.
The debugger steps into the source code of the add_example function in the LibExample.c file (shown inthe figure below).
Figure 82: LibExample.c - add_example function
5. After stepping in, you can step through the rest of the code.
Debugging Embedded Linux SoftwareDebugging shared library
CodeWarrior for ARMv7 Targeting Manual, Rev. 10.0.8, 01/2016152 Freescale Semiconductor, Inc.

The Debug view shows the function calls to the add_example function (shown in the figure below).
Figure 83: Debug view - shared library project
6. View the output of the program.
The rest of the code is executed and the output appears in the Variables view (shown in the figure below).
Figure 84: Variables view - shared library project
7.5 Debugging Linux KernelThis section shows you how to use the CodeWarrior debugger to debug the Linux kernel.
The Linux operating system (OS) works in two modes - kernel mode and user mode. The Linux kernel operatesin kernel mode and resides at the top level of the OS memory space, or kernel space. The kernel performs thefunction of a mediator among all the currently running programs and between the programs and the hardware.The kernel manages the memory for all the programs (processes) currently running and ensures that theprocesses share the available memory such that each process has enough memory to function adequately. Inaddition, the kernel allows application programs to manipulate various hardware architectures via a commonsoftware interface.
User mode uses the memory in the lowest level of the OS memory space, called the user space or the applicationlevel. At the application level, a program accesses memory or other hardware through system calls to the kernelas it does not have permission to directly access these resources.
Debugging the Linux kernel involves the following major actions:
1. Setting up target hardware on page 154
2. Installing Board Support Package (BSP) on page 155
Debugging Embedded Linux SoftwareDebugging Linux Kernel
CodeWarrior for ARMv7 Targeting Manual, Rev. 10.0.8, 01/2016Freescale Semiconductor, Inc. 153

3. Configuring build tool on page 156
4. Configuring Linux kernel on page 156
5. Creating a CodeWarrior Project using Linux kernel image on page 158
6. Configuring kernel project for debugging on page 160
7. Debugging kernel by attaching to a running U-Boot on page 163
7.5.1 Setting up target hardwareBefore you use the CodeWarrior IDE to debug the Linux kernel, you need to set up the target hardware.
One requirement of the setup is to have a debug probe connected between the CodeWarrior debug host andtarget board.
The figure below illustrates the setup required to use the IDE to debug the Linux kernel running on a ARMv7target board.
Figure 85: Setup for kernel debugging using CodeWarrior IDE
Connect the hardware debug probe between the target board and the CodeWarrior debug host. Kerneldebugging is possible using a Linux-hosted or Windows-hosted CodeWarrior installation. There are a variety ofdebug probes. The kernel debugging tutorial uses the USB Tap. Connection information for other debug probescan be determined from documentation provided with the probes.
This section contains the following subsection:
• Establishing console connection on page 154
7.5.1.1 Establishing console connectionThis section explains how to establish a console connection to the target hardware.
You need to establish a console connection to the target hardware to:
• View target generated log and debug messages
• Confirm successful installation of the bootloader (U-Boot)
Debugging Embedded Linux SoftwareDebugging Linux Kernel
CodeWarrior for ARMv7 Targeting Manual, Rev. 10.0.8, 01/2016154 Freescale Semiconductor, Inc.

• Use the bootloader to boot the Linux OS
• Halt the booting of the Linux OS
The bootloader receives keyboard input through a serial port that has default settings 115,200-8-N-1.
Follow these steps to establish a console connection to the target hardware.
1. Connect a serial cable from a serial port of the CodeWarrior debug host to a serial port of the target board.
2. On the CodeWarrior debug host computer, open a terminal-emulator program of your choice (for example,minicom for a Linux host).
3. From the terminal-emulator program, open a console connection to the target hardware.
Use the connection settings given in the table below.
Table 60: Terminal connection settings
Name Setting
Baud rate 115, 200 bits per second
Data bits 8
Parity None
Stop bits 1
Flow control Hardware
Refer to the board specific README file inside the stationery wizard project to find outmore details on the serial connection settings, changing the serial port on the board,and the type of serial cable to use.
NOTE
4. Test the connection by turning on the test board with the power switch and viewing the boot messages inthe console connection.
7.5.2 Installing Board Support Package (BSP)This section describes how to install a BSP on a Linux computer.
The BSP versions keep changing frequently. For different BSP versions, you mightencounter build environments based on ltib, bitbake, or other tools. The subsequentsections will describe necessary procedures and use specific examples from real NXPBSPs for illustration. The examples in these sections will need to be adapted based onthe BSP versions or build tools you are currently using.
NOTE
1. On the Linux computer, download the Board Support Package (BSP) for your target hardware to installkernel files and Linux compiler toolchains on your system.
Board Support Package image files for target boards are located at Linux Board Support Packages.
2. Download the BSP image file for your target board.
You will need to log in or register to download the BSP image file.
NOTE
The downloaded image file has an .iso extension.
Debugging Embedded Linux SoftwareDebugging Linux Kernel
CodeWarrior for ARMv7 Targeting Manual, Rev. 10.0.8, 01/2016Freescale Semiconductor, Inc. 155

For example,
LS1021A-SDK-<yyyymmdd>-yocto.iso
3. Mount the image file to the CDROM as root, or using "sudo":
<sudo> mount -o loop LS1021A-SDK-<yyyymmdd>-yocto.iso /mnt/cdrom
sudo is a Linux utility that allows users to run applications as root. You need to besetup to run sudo commands by your system administrator to mount the BSP imagefiles.
NOTE
4. Execute the BSP install file to install the build tool files to a directory of your choice, where you haveprivileges to write files:
/mnt/cdrom/install
The BSP must be installed as a non-root user, otherwise the install will exit.
NOTE
5. Answer the questions from the installation program until the file copy process begins.
You will be prompted to input the required build tool install path. Ensure you have the correct permissions forthe install path.
6. Upon successful installation, you will be prompted to install the ISO for the core(s) you want to build.
For example, if you want to build the SDK for ARMv7, that is a Cortex-A7 core, then you have to install theISO images for Cortex-A7 core:
You can refer to the SDK User Manual for instructions about how to build the BSPimages and run different scenarios from the iso/help/documents/pdf location.
NOTE
7.5.3 Configuring build toolAfter installing the BSP, you need to configure the build tool and build the Linux kernel and U-boot images forCodeWarrior debug.
For more information on configuring the build tool, refer to the SDK User Manual from iso/help/documents/pdf.
7.5.4 Configuring Linux kernelAfter you complete the BSP configuration, configure the Linux kernel to enable CodeWarrior support.
Follow these steps:
1. Launch a terminal window and navigate to the <yocto_installtion_path>/build_<board>_releasefolder.
2. Execute the following command to get a new and clean kernel tree:
bitbake -c configure -f virtual/kernel
Debugging Embedded Linux SoftwareDebugging Linux Kernel
CodeWarrior for ARMv7 Targeting Manual, Rev. 10.0.8, 01/2016156 Freescale Semiconductor, Inc.

3. Configure the Linux kernel using the various configuration options available in the kernel configuration userinterface. For example, run the following command to display the kernel configuration user interface:
bitbake -c menuconfig virtual/kernel
The kernel configuration user interface appears.
4. CodeWarrior supports both SMP and non-SMP debug. To change the default settings, you can makechanges by selecting the Processor support options.
5. To run a monolithic kernel, you do not need to enable loadable module support. However, during thedebug phase of drivers, it is easier to debug them as loadable modules to avoid rebuilding the Linux kernelon every debug iteration. If you intend to use loadable modules, select the Loadable module support menuitem.
6. Select the Enable loadable module support option.
7. Select the Module unloading option.
If you want to use the rmmod -f <mod_name> command for kernel modules underdevelopment, select the Forced module unloading option.
NOTE
8. Select Exit to return to the main configuration menu.
9. Select Kernel hacking.
10.Select Compile-time checks and compiler options.
11.Select Compile the kernel with debug info by pressing Y. Enabling this option allows the CodeWarriordebugger to debug the target.
12.Select other desired configuration options for Linux kernel debug.
13.Select Exit to return to the main configuration menu.
14.Select the General Setup option.
15.Select Configure standard kernel features (expert users) and ensure that the Sysctl syscall support optionis selected.
16.If you are using the Open Source Device Tree debugging method, under the General Setup > Configurestandard kernel features (expert users) option, then select:
• Load all symbols for debugging/ksymoops.
• Include all symbols in kallsyms.
These settings are optional. They aid the debugging process by providing the vmlinuxsymbols in /proc/kallsyms.
NOTE
17.Select Exit to exit the configuration screen.
18.Select Yes when asked if you want to save your configuration.
19.Execute the following command to rebuild the Linux kernel:
bitbake virtual/kernel
The uncompressed Linux kernel image with debug symbols, vmlinux, is created.
Debugging Embedded Linux SoftwareDebugging Linux Kernel
CodeWarrior for ARMv7 Targeting Manual, Rev. 10.0.8, 01/2016Freescale Semiconductor, Inc. 157

The location of the images directory might differ based on the BSP version being used.For the correct location of where the Linux kernel images are stored, refer to the SDKUser Manual from iso/help/documents/pdf.
NOTE
You just created a Linux kernel image that contains symbolic debugging information.
Now, you can use this image and create a CodeWarrior project for debugging the Linux kernel. The various usecases for the Linux kernel debug scenario are:
• CodeWarrior allows you to download this Linux kernel image (vmlinux.elf), ramdisk, and dtb files to thetarget
• You can start the Linux kernel and ramdisk manually from U-Boot. The U-Boot, the kernel, ramdisk, and dtbimages are written into flash memory.
• You can perform an early kernel debug before the mmu is enabled or debug after the Linux kernel bootsand the login prompt is shown.
The Linux kernel debug scenarios are explained in the following sections:
• Creating a CodeWarrior Project using Linux kernel image on page 158
• Configuring kernel project for debugging on page 160
7.5.5 Creating a CodeWarrior Project using Linux kernel imageAfter creating a Linux kernel image with symbolic debugging information, you need to create a CodeWarriorproject using the kernel image.
To create a CodeWarrior project, follow these steps:
1. Start the CodeWarrior IDE from the Windows system.
2. Select File > Import. The Import wizard appears.
3. Expand the CodeWarrior group and select CodeWarrior Executable Importer.
4. Click Next.
The Import a CodeWarrior executable file page appears.
5. Specify a name for the project, to be imported, in the Project name text box.
6. If you do not want to create your project in the default workspace:
a. Clear the Use default location checkbox.
b. Click Browse and select the desired location from the Browse For Folder dialog.
c. In the Location text box, append the location with the name of the directory in which you want to createyour project.
An existing directory cannot be specified for the project location.
NOTE
7. Click Next.
The Import C/C++/Assembler Executable Files page appears.
8. Click Browse next to the Executable field.
9. Select the vmlinux file obtained.
10.Click Open.
11.From the Processor list, expand the processor family and select the required processor.
Debugging Embedded Linux SoftwareDebugging Linux Kernel
CodeWarrior for ARMv7 Targeting Manual, Rev. 10.0.8, 01/2016158 Freescale Semiconductor, Inc.

12.Select the Bareboard Application toolchain from the Toolchain group.
Selected toolchain sets up the default compiler, linker, and libraries used to build the new project. Eachtoolchain generates code targeted for a specific platform.
13.Select the Linux Kernel option from the Target OS list.
Selecting Linux Kernel will automatically configure the initialization file for kerneldownload, the default translation settings (these settings need to be adjusted accordingto the actual Linux kernel configuration) in the OS Awareness tab, and the startup stopfunction to start_kernel.
NOTE
14.Click Next.
The Debug Target Settings page appears.
15.From the Debugger Connection Types list, select the required connection type.
16.Specify the settings, such as board configuration, launch configuration, connection type, and TAP addressif you are using CodeWarrior Ethernet or USB TAP.
17.Click Next.
The Configurations page appears.
18.From the Core index list, select the required core.
19.Click Finish.
The wizard creates a project according to your specifications.
You can access the project from the CodeWarrior Projects view on the workbench.
This section contains the following subsection:
• Updating Linux kernel image on page 159
7.5.5.1 Updating Linux kernel imageBy modifying the Linux kernel image, you can update the project you just created.
There are two use cases for this scenario:
• Cache symbolics between sessions is enabled on page 159
• Cache symbolics between sessions is disabled on page 160
7.5.5.1.1 Cache symbolics between sessions is enabledThis section provides steps to replace the current vmlinux.elf file with the new vmlinux.elf file when thecache symbolics between sessions is enabled.
Follow these steps:
1. Terminate the current debug session.
2. Right-click in the Debug window.
3. From the context menu, select Purge Symbolics Cache. The old vmlinux.elf file is being used by thedebugger, but after you select this option, the debugger stops using this file in the disk.
4. Copy the new vmlinux.elf file over the old file.
Now, when you re-initiate a debug session, the updated vmlinux.elf file is used for the current debugsession.
Debugging Embedded Linux SoftwareDebugging Linux Kernel
CodeWarrior for ARMv7 Targeting Manual, Rev. 10.0.8, 01/2016Freescale Semiconductor, Inc. 159

7.5.5.1.2 Cache symbolics between sessions is disabledThis section provides steps to replace the current vmlinux.elf file with the new vmlinux.elf file when thecache symbolics between sessions is disabled.
Follow these steps:
1. Terminate the current debug session.
2. Copy the new vmlinux.elf file over the old file.
Now, when you re-initiate a debug session, the updated vmlinux.elf file is used for the current debugsession.
7.5.6 Configuring kernel project for debuggingAfter you have created a CodeWarrior project using the Linux kernel image, the next action is to configure thisproject for debugging.
This section contains the following subsection:
• Configuring attach kernel debug scenario on page 160
7.5.6.1 Configuring attach kernel debug scenarioThis section describes how to configure an attach debug scenario.
For the attach scenario, CodeWarrior does not download any file on the target. The kernel is started directlyfrom U-Boot. You need to burn the U-Boot image to the flash memory of the hardware.
After the boot process, the U-Boot console is available and the Linux kernel can be started manually from U-Boot. For this, the following files can be either written into flash memory or can be copied from U-Boot usingTFTP.
• Binary kernel image file, uImage
• Ramdisk to be started from U-Boot, for example,
<target version>.rootfs.ext2.gz.u-boot
• dtb file, for example, uImage-<target version>.dtb
After the Linux boot process, the Linux login appears and you can connect to debug the kernel using theCodeWarrior Attach launch configuration. As all the files are manually loaded from U-Boot, these files must notbe specified in the launch configuration.
The table below describes the settings you need to provide in the launch configuration.
To specify the launch configuration settings in CodeWarrior:
1. Select Run > Debug Configurations.
2. Enter the launch configuration settings, given in the table below, in the Debug Configurations dialog.
Debugging Embedded Linux SoftwareDebugging Linux Kernel
CodeWarrior for ARMv7 Targeting Manual, Rev. 10.0.8, 01/2016160 Freescale Semiconductor, Inc.

Table 61: Kernel Project Attach Launch Configuration Settings
Debug Window Component Settings
Main Tab Select an appropriate system (if existing) from the Connectiondrop-down list or define a new system.
• To define a new system, click New.
• Select Hardware or Simulator Connection from the CodeWarriorBareboard Debugging list. Click Next.
• Specify a name and a description for the connection.
• Select an appropriate target (if existing) from the Target drop-down list or define a new target.
• To define a new target, click New on the Hardware or SimulatorConnection dialog.
• Select Hardware or Simulator Target from the CodeWarriorBareboard Debugging list. Click Next.
• Specify a name and a description for the target.
• Select a target from the Target type drop-down list. On theInitialization tab, ensure there are no initialization files selected.
• Click Finish to create the target and close the Hardware orSimulator Target dialog.
• Select the type of connection you will use from the Connectiontype drop-down list.
• Click Finish.
• Select all the cores on which Linux is running (for example, core0 for single-core or cores 0-7 for 8-core SMP).
Debugger Tab > Debugger options >Symbolics Tab
Select the Cache Symbolics between sessions checkbox. Thesymbolics are loaded from the elf file to the debugger for the firstsession only. This shows a speed improvement for vmlinux.elfas the size is bigger than around 100 MB.
Debugger Tab > Debugger options > OSAwareness Tab
Select Linux from the Target OS drop-down list.
Debugger Tab > Debugger options > OSAwareness Tab > Boot Parameters
Disable all settings on the Boot Parameters tab.
Table continues on the next page...
Debugging Embedded Linux SoftwareDebugging Linux Kernel
CodeWarrior for ARMv7 Targeting Manual, Rev. 10.0.8, 01/2016Freescale Semiconductor, Inc. 161

Table 61: Kernel Project Attach Launch Configuration Settings (continued)
Debug Window Component Settings
Debugger Tab > Debugger options > OSAwareness Tab > Debug Tab
Debug tab
• Select the Enable Memory Translation checkbox
Physical Base Address is set to valueCONFIG_KERNEL_START (0x80000000)
Virtual Base Address is set to value CONFIG_KERNEL_START(0x80000000 for 32-bits)
• Memory Size is the kernel space translation size.
The values shown above should beset as configured in the Linuxconfiguration file (.config). You canread the MMU registers to verify whatyou have configured and do acorrection, if required.
NOTE
• Select Enable Threaded Debugging Support checkbox
• Select Enable Delayed Software Breakpoint Support
• If required, also select Update Background Threads on Stop.When enabled, the debugger reads the entire thread list whenthe target is suspended. This decreases the speed. If the optionis disabled, the speed is increased but the Debug window mightshow non-existent threads, as the list is not refreshed.
3. Click the Source page to specify path mappings. Path mappings are not required if the debug host issimilar to the compilation host. If the two hosts are separate, the .elf file contains the paths for thecompilation host. Specifying the path mappings helps establish paths from compilation host to where thesources are available to be accessed by the debugger on the debugger host. If no path mapping isspecified, when you perform a debug on the specified target, a source file missing message appears(shown in the figure below).
Debugging Embedded Linux SoftwareDebugging Linux Kernel
CodeWarrior for ARMv7 Targeting Manual, Rev. 10.0.8, 01/2016162 Freescale Semiconductor, Inc.

Figure 86: Debug view when no path mapping is specified
You can specify the path mappings, either by adding a new path mapping on the Source tab or by clickingthe appropriate buttons (Locate File, Edit Source Lookup Path) that appear when a source path mapping isnot found.
4. Click Apply to save the settings.
5. Click Close.
7.5.7 Debugging kernel by attaching to a running U-BootThis section explains how to debug the Linux kernel by attaching it to a running U-Boot.
To debug the kernel, perform these steps:
1. Create a project for the Linux kernel image. For more details, See Creating a CodeWarrior Project usingLinux kernel image on page 158 topic.
2. Configure the launch configuration for Linux kernel debug. For more details, see Configuring attach kerneldebug scenario on page 160 topic.
3. Select Run > Debug Configurations. The Debug Configurations dialog appears.
4. From the left pane, expand the CodeWarrior Attach tree and select the appropriate launch configuration.
5. From the Debugger tab, select the PIC tab.
6. Clear the Alternate Load Address checkbox.
7. Click Apply.
8. Click Debug to start the debug session. The Debug perspective appears.
9. While the U-Boot is running, attach the target.
The debugger displays a warning, in the console, as the kernel is not being executed on the target.
Debugging Embedded Linux SoftwareDebugging Linux Kernel
CodeWarrior for ARMv7 Targeting Manual, Rev. 10.0.8, 01/2016Freescale Semiconductor, Inc. 163

For multi-core processors, only core0 is targeted in the Debug view. This is normal asthe secondary cores are initialized in the Linux kernel after MMU initialization.CodeWarrior will automatically add other cores, in the Debug view, after the kernelinitializes the secondary cores.
NOTE
10.Set software or hardware breakpoints for any stage (before or after MMU initialization).
Set a HW breakpoint at address 0x80008000. Issue the following command in the Debugger Shell view.
bp –hw 0x80008000
11.Using the U-boot console, load the Linux Kernel, DTB file and ramdisk/rootfs from flash or from TFTP.
12.Debug the kernel.
The debugger halts execution of the program at whatever breakpoints have been set in the project. Typicalstages involved in debugging the kernel are discussed below:
a. Debugging the kernel at the entry point
The CodeWarrior debugger will stop at the kernel entry point, if any software or hardware breakpoint hasbeen set for entry point.
For the debugger to stop at the kernel entry point, set a breakpoint before loading thekernel from the U-boot console.
NOTE
At the entry point, the MMU is not initialized and therefore debugging before MMU initialization also appliesin this stage.
b. Debugging the Kernel before the MMU is enabled
Being in early debug stage, the user should set the correct PIC value, in order to see the sourcecorrespondence, in the Debugger Shell view.
Before setting a breakpoint for the stage after MMU initialization (for example, breakpoint atstart_kernel) the correct PIC should be set, in the Debugger Shell view. This is required to ensure thatthe new breakpoint is set with the correct PIC for the stage after MMU initialization.
The user can set breakpoints and run/step to navigate, before MMU initialization. The correct PIC shouldbe set in the Debugger Shell view, before the debuggers enters the next stage.
c. Debugging the Kernel after the MMU is enabled
After the MMU is initialized, the PIC value must be reset in the Debugger Shell view. During the LinuxKernel booting, you can debug this stage directly, if no breakpoint has been set for the stage before MMUinitialization. Alternatively, you can also debug this stage after run or step from the stage beforeinitialization.
In case of SMP, all the secondary cores are targeted and displayed in the Debug view.
NOTE
13.When finished, you can either:
a. Kill the process by selecting Run > Terminate.
b. Leave the kernel running on the hardware.
Debugging Embedded Linux SoftwareDebugging Linux Kernel
CodeWarrior for ARMv7 Targeting Manual, Rev. 10.0.8, 01/2016164 Freescale Semiconductor, Inc.

7.6 Debugging loadable kernel modulesThis section explains how to use the CodeWarrior debugger to debug a loadable kernel module.
This section contains the following subsections:
• Loadable Kernel Modules - An Introduction on page 165
• Creating CodeWarrior project for Linux Kernel image on page 165
• Configuring Modules' Symbolics Mapping on page 168
7.6.1 Loadable Kernel Modules - An IntroductionThe Linux kernel is a monolithic kernel, that is, it is a single, large program in which all the functionalcomponents of the kernel have access to all of its internal data structures and routines.
Alternatively, you may have a micro kernel structure where the functional components of the kernel are brokeninto pieces with a set communication mechanism between them. This makes adding new components to thekernel using the configuration process very difficult and time consuming. A more reliable and robust way toextend the kernel is to dynamically load and unload the components of the operating system using Linux loadablekernel modules.
A loadable kernel module is a binary file that you can dynamically link to the Linux kernel. You can also unlinkand remove a loadable kernel module from the kernel when you no longer need it. Loadable kernel modules areused for device drivers or pseudo-device drivers, such as network drivers and file systems.
When a kernel module is loaded, it becomes a part of the kernel and has the same rights and responsibilitiesas regular kernel code.
Debugging a loadable kernel module consists of several general actions, performed in the following order:
1. Create a CodeWarrior Linux kernel project for the loadable kernel module to be debugged. See CreatingCodeWarrior project for Linux Kernel image on page 165 topic.
2. Add the modules and configure their symbolics mapping. See Configuring Modules' Symbolics Mapping onpage 168 topic.
7.6.2 Creating CodeWarrior project for Linux Kernel imageThe steps in this section show you how to create a CodeWarrior project from a Linux kernel image thatcontains symbolic debugging information.
The following procedure assumes that you have made an archive of the Linux kernelimage and transferred it to the Windows machine. For kernel modules debugging,ensure that you build the kernel with loadable module support and also make an archivefor the rootfs directory, which contains the modules for transferring to Windows.
NOTE
The steps are as follows:
1. Launch CodeWarrior IDE.
2. Select File > Import. The Import wizard appears.
3. Expand the CodeWarrior group and select CodeWarrior Executable Importer.
4. Click Next.
The Import a CodeWarrior Executable file page appears.
5. Specify a name for the project, to be imported, in the Project name text box.
Debugging Embedded Linux SoftwareDebugging loadable kernel modules
CodeWarrior for ARMv7 Targeting Manual, Rev. 10.0.8, 01/2016Freescale Semiconductor, Inc. 165

6. If you do not want to create your project in the default workspace:
a. Clear the Use default location checkbox.
b. Click Browse and select the desired location from the Browse For Folder dialog.
c. In the Location text box, append the location with the name of the directory in which you want to createyour project.
An existing directory cannot be specified for the project location.
NOTE
7. Click Next.
The Import C/C++/Assembler Executable Files page appears.
8. Click Browse next to the Executable field.
9. Select the vmlinux.elf file.
10.Click Open.
11.From the Processor list, expand the processor family and select the required processor.
12.Select Bareboard Application from the Toolchain group.
13.Select Linux Kernel from the Target OS list.
14.Click Next.
The Debug Target Settings page appears.
15.From the Debugger Connection Types list, select the required connection type.
16.Specify the settings, such as board, launch configuration, connection type, and TAP address if you areusing Ethernet or USB TAP.
17.Click Next.
The Configuration page appears.
18.From the Core index list, select the required core.
19.Click Finish.
The wizard creates a project according to your specifications. You can access the project from theCodeWarrior Projects view on the Workbench.
20.Configure the launch configuration for Linux kernel debug.
a. Select Run > Debug Configurations.
The Debug Configurations dialog appears.
21.Enter the launch configuration settings in the Debug Configurations dialog. The table below lists the launchconfiguration settings.
Debugging Embedded Linux SoftwareDebugging loadable kernel modules
CodeWarrior for ARMv7 Targeting Manual, Rev. 10.0.8, 01/2016166 Freescale Semiconductor, Inc.

Table 62: Kernel Project Attach Launch Configuration Settings
Debug Window Component Settings
Main tab Select an appropriate system (if existing) from the Connectiondrop-down list or define a new system.
• To define a new system, click New.
• Select Hardware or Simulator Connection from the CodeWarriorBareboard Debugging list. Click Next.
• Specify a name and a description for the connection.
• Select an appropriate target (if existing) from the Target drop-down list or define a new target.
• To define a new target, click New on the Hardware or SimulatorConnection dialog.
• Select Hardware or Simulator Target from the CodeWarriorBareboard Debugging list. Click Next.
• Specify a name and a description for the target.
• Select a processor from the Target type drop-down list. On theInitialization tab, ensure that there are no initialization filesselected.
• Click Finish to create the target and close the Hardware orSimulator Target dialog.
• Select the type of connection you will use from the Connectiontype drop-down list.
• Click Finish.
• Select all the cores on which Linux is running (for example, core0 for single-core or cores 0-7 for 8-core SMP).
Debugger tab > Debugger options >Symbolics tab
Select the Cache Symbolics between sessions checkbox. Thesymbolics are loaded from the elf file to the debugger for the firstsession only. This shows a speed improvement for vmlinux.elfas the size is bigger than around 100 MB.
Debugger tab > Debugger options > OSAwareness tab
Select Linux from the Target OS drop-down list.
Debugger tab > Debugger options > OSAwareness tab > Boot Parameters tab
All options should be cleared.
Table continues on the next page...
Debugging Embedded Linux SoftwareDebugging loadable kernel modules
CodeWarrior for ARMv7 Targeting Manual, Rev. 10.0.8, 01/2016Freescale Semiconductor, Inc. 167

Table 62: Kernel Project Attach Launch Configuration Settings (continued)
Debug Window Component Settings
Debugger tab > Debugger options > OSAwareness tab > Debug tab
• Select the Enable Memory Translation checkbox
Physical Base Address is set to valueCONFIG_KERNEL_START (0x80000000)
Virtual Base Address is set to value CONFIG_KERNEL_START(0x80000000 for 32-bits).
• Memory Size is the kernel space translation size.
The values shown above should beset as configured in the Linuxconfiguration file (.config).
NOTE
Select the Enable Threaded Debugging Support checkbox
Select the Enable Delayed Software Breakpoint Supportcheckbox
Debugger tab > Debugger options > OSAwareness tab > Modules tab
• Select the Detect module loading checkbox
• Click Add to insert the kernel module file. See ConfiguringModules' Symbolics Mapping on page 168 topic
• Select the Prompt for symbolics path if not found checkbox
22.Click the Source page to add source mappings for rootfs and linux-<version>.
23.Click Apply to save the settings.
7.6.3 Configuring Modules' Symbolics MappingYou can use the Modules tab in the Debug Configurations dialog to add modules to the Linux kernel projectand configure the module's symbolics mapping.
The figure below shows the Detect module loading group of the Modules page.
Debugging Embedded Linux SoftwareDebugging loadable kernel modules
CodeWarrior for ARMv7 Targeting Manual, Rev. 10.0.8, 01/2016168 Freescale Semiconductor, Inc.

Figure 87: Kernel Module Debug - Modules tab
The table below describes the various options available on the Modules tab.
Table 63: Kernel Module Project Launch Configuration - Modules tab settings
Option Description
Detect module loading Enables the debugger to detect module load events and insert aneventpoint in the kernel. Disabling this setting delays the moduleloading. This is useful in scenarios where multiple modules areloaded to the kernel and not all of them need to be debugged. Youcan enable this setting again in the Modules dialog. The dialog isavailable during the Debug session from the System BrowserView toolbar > Module tab.
Add Adds a module name along with the corresponding symbolic pathThis option displays a dialog box in the following scenarios:
• The file that you have selected is not a valid compiled kernelmodule
• If the selected module already exists in the list with the samepath
Scan Automatically searches for module files and populates the kernelmodule list.
Remove Removes the selected items. This button will be enabled only if arow is selected.
Remove All Removes all items. This button will be enabled only if the kernellist contains any entries.
Table continues on the next page...
Debugging Embedded Linux SoftwareDebugging loadable kernel modules
CodeWarrior for ARMv7 Targeting Manual, Rev. 10.0.8, 01/2016Freescale Semiconductor, Inc. 169

Table 63: Kernel Module Project Launch Configuration - Modules tab settings (continued)
Option Description
Prompt for symbolics path if not found Prompts to locate the symbolics file if a mapping for it is notavailable in the settings A Browse dialog appears that allows youto browse for a module file containing symbolics. The debuggerwill add the specified symbolics to the modules' symbolicsmapping.
Keep target suspended Keeps the target suspended after the debugger loads thesymbolics file for a module. This option is useful if you want todebug the module's initialization code. It allows you to setbreakpoints in the module's initialization code before running it.
This option is automatically enabledwhen activating the Prompt forsymbolics path if not found option.
NOTE
Breakpoints are resolved each time a symbolics file is loaded and the debugger usesthe modules unload events for symbolics disposal and breakpoints cleanup.
NOTE
Debugging Embedded Linux SoftwareDebugging loadable kernel modules
CodeWarrior for ARMv7 Targeting Manual, Rev. 10.0.8, 01/2016170 Freescale Semiconductor, Inc.

Chapter 8JTAG Configuration FilesThis chapter explains about JTAG configuration files that pass specific configuration settings to the debuggerand support chaining of multiple devices.
A JTAG configuration file is a text file, specific to the CodeWarrior debugger, which describes a custom JTAGscan chain. You can specify the file in the remote system settings.
This chapter explains:
• JTAG configuration file syntax on page 171
• Using a JTAG configuration file to override RCW on page 172
• Using JTAG configuration file to specify multiple linked devices on a JTAG chain on page 173
• Setting up a remote system to use a JTAG configuration file on page 174
8.1 JTAG configuration file syntaxThis section describes the syntax of a JTAG configuration file.
You can create a JTAG configuration file that specifies the type, chain order, and various settings for the devicesyou want to debug. To create the JTAG configuration file, list each device on a separate line, starting with thedevice that is directly connected to the transmit data out (TDO) signal (Pin 1) of the 16-pin COP/JTAG debugconnector on the hardware target, and conclude with a blank line.
The listing below shows the complete syntax for a JTAG configuration file.
Figure 88: JTAG configuration file syntax
cfgfile: '\n'
'#' 'any other characters until end of line'
line
cfgfile line
line:
target
target filter_list_or_params
target:
target_name
target_name = target_id
'Generic' number number number
filter_list_or_params:
filter_list_entity
JTAG Configuration FilesJTAG configuration file syntax
CodeWarrior for ARMv7 Targeting Manual, Rev. 10.0.8, 01/2016Freescale Semiconductor, Inc. 171

filter_list_or_params filter_list_entity
filter_list_entity:
'(' number number ')'
filter_name
%
8.2 Using a JTAG configuration file to override RCWYou can use a JTAG configuration file to override reset configuration word (RCW) for a processor, such asLS1021A, revision 2.0.
In the following scenarios, the JTAG configuration files are used for overriding RCW:
• Programming RCW in a target board that does not have RCW programmed already
• New board bring-up
• Recovering a target board having a blank or corrupted flash: This feature is only available for LS1021Aprocessor revision 2.0 and LS2085A. Board recovery scenarios involving a blank/corrupted flash require anexternal CodeWarrior TAP probe connection for overriding RCW; RCW override is not supported with aCMSIS-DAP connection.
For more information on RCW, see the reference manual for your processor.
NOTE
The CodeWarrior software includes example JTAG configuration files that can be used to override the RCW(see the listing below). The JTAG Configuration files are available at the following location:
<CWInstallDir>\CW_ARMv7\ARMv7\ARM_Support\Configuration_Files\jtag_chains
Figure 89: Sample JTAG configuration file for overriding RCW
# Example file to allow overriding a portion of the RCW# # Syntax: # LS102xA (0 RCW_source) (0x1000 RCW_option) (RCWn value) ... # # where: # x = Processor version (LS1020/1/2A); default is LS1021A# RCW_source = The RCW source that you want to override (for example, 0x9b for hard-coded mode)# RCW_option = 0 [RCW override disabled] # 1 [RCW override enabled] # # RCWn = 4096+n (n = 0 .. 15; index of RCW value) # # value = 32-bit value
As specified in the listing above, the JTAG configuration files can be used to override a portion of the RCW forLS1021A, by specifying (index, value) pairs for some of the 16 x (32-bit words) of the RCW. For some targets
JTAG Configuration FilesUsing a JTAG configuration file to override RCW
CodeWarrior for ARMv7 Targeting Manual, Rev. 10.0.8, 01/2016172 Freescale Semiconductor, Inc.

(for example, LS2085A), you do not need to specify RCW_source; therefore, you can remove (0 RCW_source)from the JTAG configuration file.
You can use the pre-boot loader (PBL) tool to configure the various settings of the RCWand output the RCW in multiple formats, including CodeWarrior JTAG configuration files.For more information on the PBL tool, see QCVS PBL Tool User Guide.
NOTE
8.3 Using JTAG configuration file to specify multiple linkeddevices on a JTAG chain
This section explains how to connect multiple processors through a single JTAG chain and how to describesuch a JTAG chain in a JTAG configuration file.
The listing and figure below show a sample JTAG initialization file with a single core.
Figure 90: Sample JTAG initialization file for LS1021A processor
# A single device in the chainLS1021A
Figure 91: A single device in a JTAG chain
The listing below show a sample JTAG initialization file with two devices in a JTAG chain.
Figure 92: Sample JTAG initialization file for LS1020A and LS1021A processors
# Two devices in a JTAG chainLS1020A
LS1021A
The devices are enumerated in the direction starting from TDO output to TDI input.
NOTE
The listing below show two devices connected in a JTAG chain.
Figure 93: Sample JTAG initialization file for LS1020A and LS1021A processors
# Two devices in a JTAG chainLS1020A (0x80000000 1)
LS1021A (2 1) (210005 0x90404000)
JTAG Configuration FilesUsing JTAG configuration file to specify multiple linked devices on a JTAG chain
CodeWarrior for ARMv7 Targeting Manual, Rev. 10.0.8, 01/2016Freescale Semiconductor, Inc. 173

The listing below show two devices connected in a JTAG chain with a filter applied for the second device.
Figure 94: Sample JTAG initialization file for two devices with filter for second device
# Two devices in a JTAG chain8306 (1 1) (2 0x44050006) (3 0x00600000)
8309 log
In the above example, the entry for the 8306 also includes the Hard Reset Control Word (HRCW) data that willoverwrite the HRCW fetched by the 8306 upon power up or Hard Reset. The Hard Reset Control Wordparameters are optional.
The CodeWarrior debugger not only supports NXP devices but also supports non-NXP devices in a JTAG scanchain. Each non-NXP device used in a scan chain is declared as "Generic" and it takes the following threeparameters:
• JTAG Instruction Length
• Bypass Command
• Bypass Length
The values for these three parameters are available in the device's data sheet or can be obtained from themanufacturer of the device.
The listing below show an NXP device, 8560, connected with a non-NXP device, PLA, in a JTAG scan chain.From the PLA's data sheet, the JTAG Instruction Length = 5, the Bypass Command = 1, and the Bypass Length= 0x1F.
Figure 95: Sample JTAG initialization file including non-NXP devices
8560Generic 5 1 0x1F
8.4 Setting up a remote system to use a JTAG configuration fileThis section explains how to configure a remote system to use a JTAG configuration file.
To connect to a JTAG chain, specify these settings in the launch configurations:
1. Create a JTAG initialization file that describes the items on the JTAG chain. For more information on howto create a JTAG initialization file, see JTAG configuration file syntax on page 171 and Using JTAGconfiguration file to specify multiple linked devices on a JTAG chain on page 173.
2. Open the CodeWarrior project you want to debug.
3. Select Run > Debug Configurations.
The Debug Configurations dialog appears with a list of debug configurations that apply to the currentapplication.
4. Expand the CodeWarrior tree control.
5. From the expanded list, select the debug configuration for which you want to modify the debugger settings.
The Debug view shows the settings for the selected configuration.
6. Select a remote system from the Connection drop-down list.
7. Select a core from the Target list.
JTAG Configuration FilesSetting up a remote system to use a JTAG configuration file
CodeWarrior for ARMv7 Targeting Manual, Rev. 10.0.8, 01/2016174 Freescale Semiconductor, Inc.

8. In the Connection group, click Edit.
The Properties for <project>window appears.
9. Click Edit next to the Target list.
The Properties for <remote system> window appears.
10.Click Edit next to the Target type drop-down list.
The Target Types dialog appears.
11.Click Import.
12.The Import Target Type dialog appears.
13.Select the JTAG initialization file that describes the items on the JTAG chain from this location:
<CWInstallDir>\CW_ARMv7\ARMv7\ARM_Support\Configuration_Files\jtag_chains
14.Click OK.
The items on the JTAG chain described in the file appear in the Target Types dialog.
15.Click OK.
The selected JTAG configuration file appears on the Advanced tab.
16.Click OK.
17.Click the Debugger tab.
The Debugger page appears.
18.Ensure that the Stop on startup at checkbox is selected and main is specified in the User specified textbox.
19.Click Apply to save the changes.
You have successfully configured a debug configuration.
JTAG Configuration FilesSetting up a remote system to use a JTAG configuration file
CodeWarrior for ARMv7 Targeting Manual, Rev. 10.0.8, 01/2016Freescale Semiconductor, Inc. 175

JTAG Configuration FilesSetting up a remote system to use a JTAG configuration file
CodeWarrior for ARMv7 Targeting Manual, Rev. 10.0.8, 01/2016176 Freescale Semiconductor, Inc.

Chapter 9Target Initialization FilesA target initialization file is a file that contains commands that initialize registers, memory locations, and othercomponents on a target board.
The most common use case is to have the CodeWarrior debugger execute a target initialization file immediatelybefore the debugger downloads a bareboard binary to a target board. The commands in a target initializationfile put a board in the state required to debug a bareboard program.
The target board can be initialized either by the debugger (by using an initialization file),or by an external bootloader or OS (U-Boot, Linux). In both cases, the extra use of aninitialization file is necessary for debugger-specific settings (for example, siliconworkarounds needed for the debug features).
NOTE
This chapter includes the following section:
• Using target initialization files on page 177
9.1 Using target initialization filesThis section describes how to configure the CodeWarrior debugger to use a specific target initialization file.
A target initialization file is a command file that the CodeWarrior debugger executes each time the launchconfiguration to which the initialization file is assigned is debugged. You can use the target initialization file forall launch configuration types (Attach, Connect and Download). The target initialization file is executed after theconnection to the target is established, but before the download operation takes place.
The debugger executes the commands in the target initialization file using the target connection protocol, suchas a JTAG run-control device.
You do not need to use an initialization file if you debug using the CodeWarrior TRKdebug protocol.
NOTE
To instruct the CodeWarrior debugger to use a target initialization file:
1. Start the CodeWarrior IDE.
2. Open a bareboard project.
3. Select one of this project's build targets.
4. Select Run > Debug Configurations.
The Debug Configurations dialog appears.
5. Select the appropriate launch configuration from the left panel.
6. In the Main tab, from the Connection panel, click Edit next to the Connection drop-down list.
The Properties for <Launch Configuration Name> window appears.
7. Click Edit next to the Target drop-down list.
The Properties for <remote system> window appears.
8. In the Initialization tab, select the appropriate cores checkboxes from the Initialize target column, as shownin the figure below.
Target Initialization FilesUsing target initialization files
CodeWarrior for ARMv7 Targeting Manual, Rev. 10.0.8, 01/2016Freescale Semiconductor, Inc. 177

Figure 96: Initialization tab
9. In the Initialize target script column, click the ellipsis button, as shown in the figure above.
Click in the specified cell of the Initialize target script column for the ellipsis button toappear.
TIP
The Target Initialization File dialog appears, as shown in the figure below.
Figure 97: Target initialization file dialog
Target Initialization FilesUsing target initialization files
CodeWarrior for ARMv7 Targeting Manual, Rev. 10.0.8, 01/2016178 Freescale Semiconductor, Inc.

10.Select the target initialization file by using the buttons provided in the dialog and click OK.
The target initialization files are available at the following path:
<CWInstallDir>\CW_ARMv7\ARMv7\ARM_Support\Initialization_Files\
You can also write your own target initialization files.
Target Initialization FilesUsing target initialization files
CodeWarrior for ARMv7 Targeting Manual, Rev. 10.0.8, 01/2016Freescale Semiconductor, Inc. 179

Target Initialization FilesUsing target initialization files
CodeWarrior for ARMv7 Targeting Manual, Rev. 10.0.8, 01/2016180 Freescale Semiconductor, Inc.

Chapter 10Memory Configuration FilesA memory configuration file contains commands that define the rules the debugger follows when accessing atarget board's memory.
Memory configuration files do not define the memory map for the target. Instead, theydefine how the debugger should treat the memory map the target has alreadyestablished. The actual memory map is initialized either by a target resident boot loaderor by a target initialization file. For more information, see Target Initialization Files onpage 177 chapter of this manual.
NOTE
If necessary, you can have the CodeWarrior debugger execute a memory configuration file immediately beforethe debugger downloads a bareboard binary to a target board. The memory configuration file defines the memoryaccess rules (restrictions, translations) used each time the debugger needs to access memory on the targetboard.
Assign a memory configuration file to bareboard build targets only. The memory of aboard that boots embedded Linux® is already set up properly. A memory configurationfile defines memory access rules for the debugger; the file has nothing to do with theOS running on a board. If needed, a memory configuration file should be in place at alltimes. The Linux Kernel Aware Plugin performs memory translations automatically,relieving the user from specifying them in the memory configuration file. In addition, forcertain processors, the debugger can automatically read the translations from the targetin a bareboard scenario, relieving the user from specifying them in the memoryconfiguration file.
NOTE
This chapter includes the following section:
• Using memory configuration files on page 181
10.1 Using memory configuration filesThis section describes how to configure the CodeWarrior debugger to use a specific memory configurationfile.
A memory configuration file is a command file that contains memory access rules that the CodeWarrior debuggeruses each time the build target to which the configuration file is assigned is debugged.
You specify a memory configuration file in the Memory tab of the remote system configuration (shown in thefigure below).
Memory Configuration FilesUsing memory configuration files
CodeWarrior for ARMv7 Targeting Manual, Rev. 10.0.8, 01/2016Freescale Semiconductor, Inc. 181

Figure 98: Specifying memory configuration file
You can also write your own memory configuration files.
Memory Configuration FilesUsing memory configuration files
CodeWarrior for ARMv7 Targeting Manual, Rev. 10.0.8, 01/2016182 Freescale Semiconductor, Inc.

Chapter 11Working with Hardware ToolsThis chapter explains how to use the CodeWarrior hardware tools. You can use these tools for board bring-up,test, and analysis.
The following tools are described in this chapter:
• Flash programmer on page 183
• Hardware diagnostics on page 195
11.1 Flash programmerFlash programmer is a CodeWarrior plug-in that lets you program the flash memory of the supported targetboards from within the IDE.
The flash programmer can program the flash memory of the target board with code from a CodeWarrior IDEproject or a file.
The flash programmer runs as a target task in the Eclipse IDE. To program the flash memory on a target board,you need to create, configure, and execute a flash programmer target task. You can click the Save button orpress Ctrl+S to save task settings.
The following subsections describe how to work with flash programmer:
• Create flash programmer target task on page 183
• Configure flash programmer target task on page 185
• Execute flash programmer target task on page 190
• SD/eMMC flash programmer on page 192
• Flash File to Target on page 193
11.1.1 Create flash programmer target taskYou can create a flash programmer task using the Create New Target Task wizard.
Follow these steps:
1. Choose Window > Show View > Other from the CodeWarrior IDE menu bar.
The Show View dialog appears.
Working with Hardware ToolsFlash programmer
CodeWarrior for ARMv7 Targeting Manual, Rev. 10.0.8, 01/2016Freescale Semiconductor, Inc. 183

Figure 99: Show View dialog
2. Expand the Debug group and select Target Tasks.
3. Click OK.
The Target Tasks view appears.
Figure 100: Target Tasks view
Working with Hardware ToolsFlash programmer
CodeWarrior for ARMv7 Targeting Manual, Rev. 10.0.8, 01/2016184 Freescale Semiconductor, Inc.

4. Click the Create New Target Task button in the Target Tasks view toolbar.
The Create New Target Task wizard appears.
Figure 101: Create New Target Task window
5. In the Task Name text box, enter a name for the new flash programming target task.
6. Choose a launch configuration from the Run Configuration pop-up menu.
• Choose Active Debug Context when flash programmer is used over an active debug session.
• Choose a project-specific debug context when flash programmer is used without an active debugsession.
7. Choose Flash Programmer for ARM from the Task Type pop-up menu.
8. Click OK.
The target task is created in the Target Tasks view. Click Edit Task Configuration button and the ARM FlashProgrammer Task editor window appears. You use this window to configure the flash programmer target task.
• Flash Devices - Lists the devices added in the current task.
• Target RAM - Lets you specify the settings for Target RAM.
• Flash Program Actions - Displays the programmer actions to be performed on the flash devices.
11.1.2 Configure flash programmer target taskYou can add flash devices, specify Target RAM settings, and add flash program actions to a flashprogrammer task to configure it.
This section contains the following subsections:
• Add flash device on page 186
• Specify target RAM settings on page 186
• Add flash programmer actions on page 186
Working with Hardware ToolsFlash programmer
CodeWarrior for ARMv7 Targeting Manual, Rev. 10.0.8, 01/2016Freescale Semiconductor, Inc. 185

11.1.2.1 Add flash deviceThis section explains how to add a flash device to the Flash Devices table.
In the ARM Flash Programmer Task editor window, to add a flash device to the Flash Devices table:
1. Click the Add Device button.
The Add Device dialog appears.
2. Select a flash device from the device list.
3. Click the Add Devicebutton.
The flash device is added to the Flash Devices table in the ARM Flash Programmer Task editor window.
You can select multiple flash devices to add to the Flash Devices table. To selectmultiple devices, hold down the Control key while selecting the devices.
NOTE
4. Click Done.
The Add Device dialog closes and the flash device appears in the Flash Devices table in the ARM FlashProgrammer Task editor window.
For NOR and QSPI flashes, the base address indicates the location where the flash ismapped in the memory. For NAND flashes, the base address is usually 0x0.
NOTE
11.1.2.2 Specify target RAM settingsThe Target RAM is used by Flash programmer to download its algorithms.
The Target RAM memory area is not restored by flash programmer. If you are usingflash programmer with Active Debug Context, it will impact your debug session.
NOTE
The Target RAM (Add flash device on page 186) group contains fields to specify settings for the Target RAM.
• Address text box: Specify the address from the target memory. The Address text box should contain the firstaddress from target memory used by the flash algorithm running on a target board.
• Size text box: Specify the size of the target memory. The flash programmer does not modify any memorylocation other than the target memory buffer and the flash memory.
• Verify Target Memory Writes checkbox: Select this checkbox to verify all write operations to the hardwareRAM during flash programming.
11.1.2.3 Add flash programmer actionsThe Flash Programmer Actions group in the ARM Flash Programmer Task editor window allows you to addflash programmer actions.
The Flash Programmer Actions group contains the following UI controls to work with flash programmer actions:
• Add Action pop-up menu:
• Erase / Blank Check: Allows you to add erase or blank check actions for a flash device
• Program / Verify: Allows you to add program or verify flash actions for a flash device
• Checksum: Allows you to add checksum actions for a flash device
• Diagnostics: Allows you to add diagnostics actions for a flash device
Working with Hardware ToolsFlash programmer
CodeWarrior for ARMv7 Targeting Manual, Rev. 10.0.8, 01/2016186 Freescale Semiconductor, Inc.

• Dump Flash: Lets you add a dump flash action
• Protect/Unprotect: Lets you add protect or unprotect action
• Secure/Unsecure: Lets you add secure or unsecure action
• Duplicate Action button: Allows you to duplicate a flash program action in the Flash Programmer Actionstable.
• Remove Action button: Allows you to remove a flash program action from the Flash Programmer Actionstable.
• Move Up button: Allows you to move up the selected flash action in the Flash Programmer Actions table.
• Move Down button: Allows you to move down the selected flash action in the Flash Programmer Actionstable.
Actions can also be enabled or disabled using the Enabled column. The Descriptioncolumn contains the default description for the flash programmer actions. You can alsoedit the default description.
NOTE
This section contains the following subsections:
• Erase/Blank check actions on page 187
• Program/Verify actions on page 188
• Checksum actions on page 188
• Diagnostics actions on page 189
• Dump Flash actions on page 189
• Protect/Unprotect actions on page 190
11.1.2.3.1 Erase/Blank check actionsThe Erase action erases sectors from the flash device.
You can also use the erase action to erase the entire flash memory without selecting sectors. The blank checkaction verifies if the specified areas have been erased from the flash device.
Flash Programmer will not erase a bad sector in the NAND flash. After the erase actiona list of bad sectors is reported (if any).
NOTE
To add an erase/blank check action:
1. Choose Erase/Blank Check Action from the Add Action pop-up menu.
The Add Erase/Blank Check Action dialog appears.
2. Select a sector from the Sectors table and click the Add Erase Action button to add an erase operation onthe selected sector.
Press the Control or the Shift key for selecting multiple sectors from the Sectors table.
NOTE
3. Click the Add Blank Check Action button to add a blank check operation on the selected sector.
4. Select the Mass erase all devices checkbox to erase the entire flash memory.
Working with Hardware ToolsFlash programmer
CodeWarrior for ARMv7 Targeting Manual, Rev. 10.0.8, 01/2016Freescale Semiconductor, Inc. 187

After selecting the Mass erase all devices checkbox, you need to add either erase orblank check action to erase all sectors.
NOTE
5. Click Done.
The Add Erase/Blank Check Action dialog closes and the added erase/blank check actions appear in theFlash Programmer Actions table in the ARM Flash Programmer Task editor window.
11.1.2.3.2 Program/Verify actionsThe program action allows you to program the flash device and the verify action verifies the programmedflash device.
To add a program/verify action:
1. Choose Program/Verify Action from the Add Action pop-up menu.
The Add Program / Verify Action dialog appears.
2. Select the file to be written to the flash device.
3. Select the Use File from Launch Configuration checkbox to use the file from the launch (run) configurationassociated with the task.
4. Specify the file name in the File text box. You can use Workspace, File System, or Variables buttons toselect the desired file.
5. Choose a file type from the File Type pop-up menu. You can select any one of the following file types:
• Auto - Detects the file type automatically.
• Elf - Specifies executable in ELF format.
• Srec - Specifies files in Motorola S-record format.
• Binary - Specifies binary files.
6. Select the Erase sectors before program checkbox to erase sectors before program.
7. [Optional] Select the Verify after program checkbox to verify after the program.
The Verify after program checkbox is available only with the processors supporting it.
NOTE
8. Select the Restricted To Address in this Range checkbox to specify a memory range. The write action ispermitted only in the specified address range. In the Start text box, specify the start address of the memoryrange sector and in the End text box, specify the end address of the memory range.
9. Select the Apply Address Offset checkbox and set the memory address in the Address text box. Value isadded to the start address of the file to be programmed or verified.
10.Click the Add Program Action button to add a program action on the flash device.
11.Click the Add Verify Action button to add a verify action on the flash device.
12.Click Done.
The Add Program / Verify Action dialog closes and the added program/verify actions appear in the FlashProgrammer Actions table in the ARM Flash Programmer Task editor window.
11.1.2.3.3 Checksum actionsThe checksum can be computed over host file, target file, memory range, or entire flash memory.
To add a checksum action:
Working with Hardware ToolsFlash programmer
CodeWarrior for ARMv7 Targeting Manual, Rev. 10.0.8, 01/2016188 Freescale Semiconductor, Inc.

1. Choose Checksum Action from the Add Action pop-up menu.
The Add Checksum Action dialog appears.
2. Select the file for checksum action.
3. Select the Use File from Launch Configuration checkbox to use the file from the launch (run) configurationassociated with the task.
4. Specify the filename in the File text box. You can use the Workspace, File System, or Variables buttons toselect the desired file.
5. Choose the file type from the File Type pop-up menu.
6. Select an option from the Compute Checksum Over options. The checksum can be computed over thehost file, the target file, the memory range, or the entire flash memory.
7. Specify the memory range in the Restrict To Addresses in this Range group. The checksum action ispermitted only in the specified address range. In the Start text box, specify the start address of the memoryrange sector and in the End text box, specify the end address of the memory range.
8. Select the Apply Address Offset checkbox and set the memory address in the Address text box. Value isadded to the start address of the file to be programmed or verified.
9. Click the Add Checksum Action button.
10.Click Done.
The Add Checksum Action dialog closes and the added checksum actions appear in the Flash ProgrammerActions table in the ARM Flash Programmer Task editor window.
11.1.2.3.4 Diagnostics actionsThe diagnostics action generates the diagnostic information for the selected flash device.
Flash Programmer will report bad blocks, if they are present in the NAND flash.
NOTE
To add a diagnostics action:
1. Choose Diagnostics from the Add Action pop-up menu.
The Add Diagnostics Action dialog appears.
2. Select a device to perform the diagnostics action.
3. Click the Add Diagnostics Action button to add diagnostic action on the selected flash device.
Select the Perform Full Diagnostics checkbox to perform full diagnostics on a flashdevice.
NOTE
4. Click Done.
The Add Diagnostics Action dialog closes and the added diagnostics action appears in the Flash ProgrammerActions table in the ARM Flash Programmer Task editor window.
11.1.2.3.5 Dump Flash actionsThe dump flash action allows you to dump selected sectors of a flash device or the entire flash device.
To add a dump flash action:
1. Choose Dump Flash Action from the Add Action pop-up menu.
Working with Hardware ToolsFlash programmer
CodeWarrior for ARMv7 Targeting Manual, Rev. 10.0.8, 01/2016Freescale Semiconductor, Inc. 189

The Add Dump Flash Action dialog appears.
2. Specify the file name in the File text box. The flash is dumped in this selected file.
3. Choose the file type from the File Type pop-up menu. You can choose any one of the following file types:
• Srec: Saves files in Motorola S-record format.
• Binary: Saves files in binary file format.
4. Specify the memory range for which you want to add dump flash action.
• Enter the start address of the range in the Start text box.
• Enter the end address of the range in the End text box.
5. Click the Add Dump Flash Action button to add a dump flash action.
6. Click Done.
The Add Dump Flash Action dialog closes and the added dump flash action appear in the Flash ProgrammerActions table in the ARM Flash Programmer Task editor window.
11.1.2.3.6 Protect/Unprotect actionsThe protect/unprotect actions allow you to change the protection of a sector in the flash device.
To add a protect/unprotect action:
1. Choose the Protect/Unprotect Action from the Add Action pop-up menu.
The Add Protect/Unprotect Action dialog appears.
2. Select a sector from the Sectors table and click the Add Protect Action button to add a protect operation onthe selected sector.
Press the Control or Shift key for selecting multiple sectors from the Sectors table.
NOTE
3. Click the Add Unprotect Action button to add an unprotect action on the selected sector.
4. Select the All Device checkbox to add action on full device.
5. Click Done.
The Add Protect/Unprotect Action dialog closes and the added protect or unprotect actions appear in theFlash Programmer Actions table in the ARM Flash Programmer Task editor window.
11.1.3 Execute flash programmer target taskYou can execute the flash programmer tasks using the Target Tasks view.
To execute the configured flash programmer target task, select a target task and click the Execute button in theTarget Tasks view toolbar. Alternatively, right-click a target task and choose Execute from the shortcut menu.
You can use predefined target tasks for supported boards. To load a predefined target task, click Import buttonin the Target Task view. Select the task, for example, LS102xAQDS_NAND_FLASH.xml from {CW folder}\ARMv7\bin\plugins\Support\Target Task\Flash_Programmer\ARM\ folder. Change the RunConfiguration and then double-click the imported task, the ARM Flash Programmer Task view appears.
Working with Hardware ToolsFlash programmer
CodeWarrior for ARMv7 Targeting Manual, Rev. 10.0.8, 01/2016190 Freescale Semiconductor, Inc.

Figure 102: Execute target task
In the ARM Flash Programmer Task view, click Add Action button to add the Flask Programmer Actions asshown in above figure. Select the checkbox for the operation that you want to execute. Click Execute button inthe Target Task view.
To load a predefined target task, right-click in the Target Tasks view and choose Importfrom the shortcut menu. To save your custom tasks, right-click in the Target Tasks viewand then choose Export from the shortcut menu.
NOTE
You can check the results of flash batch actions in the Console view. The green color indicates the success andthe red color indicates the failure of the task.
Working with Hardware ToolsFlash programmer
CodeWarrior for ARMv7 Targeting Manual, Rev. 10.0.8, 01/2016Freescale Semiconductor, Inc. 191

Figure 103: Console view
11.1.4 SD/eMMC flash programmerThis section explains what is SD/eMMC flash programmer and how to use it to program U-Boot.
The SD/eMMC card uses the notion of blocks, not addresses. One block has 512 bits. The flash programmerUI still uses address at operations; therefore, when you want to write something, for example, from block 4, youneed to compute the address by multiplying the number of the block with 512 and converting the result intohexadecimal (for example, sector 4 x 512 = 2048 = 0x00000800). In case of a program operation, if you selectthe Erase sectors before program checkbox (which is always recommended) in the Add Program / Verify Actiondialog, then the flash programmer will only erase the sectors that are written.
Because the size of a block is small and the size of the card is large, all the available blocks cannot be displayedin the Add Erase/Blank Check Action dialog; therefore, the card has been divided into sectors of 4 MB each. So,when you choose an erase/blank check operation, you will erase/check sectors of 4 MB.
By default, the algorithm is set to run from DDR, because it uses direct memory access (DMA) for data transfer.If the DDR memory is not functional, change in the ARM Flash Programmer Task editor window the runningaddress of the algorithm (Target RAM field) for the target task with the OCRAM address of your processor, whichwill enable the use of the internal buffer of the eSDHC controller. This will reduce the performance as DMA isnot used in this mode.
This section contains the following subsection:
• Programming U-Boot using SD/eMMC flash programmer on page 192
11.1.4.1 Programming U-Boot using SD/eMMC flash programmerThis section explains how to program U-Boot using the SD/eMMC flash programmer.
The example described in this section uses the LS1021AQDS Rev. 2.0 target. The steps given here areapplicable to all targets that support SD/eMMC flash programmer.
The steps to program U-Boot using SD/eMMC flash programmer are as follows:
1. Import the preconfigured target task for the target (in the current example, eMMC flash programmer isused; for the SD flash programmer, the steps are same but only the preconfigured target task is different):ARMv7/bin/plugins/support/TargetTask/Flash_Programmer/ARM/LS102xAQDS_MMC_FLASH.xml.
Working with Hardware ToolsFlash programmer
CodeWarrior for ARMv7 Targeting Manual, Rev. 10.0.8, 01/2016192 Freescale Semiconductor, Inc.

2. Choose Program/Verify Action from the Add Action pop-up menu.
The Add Program / Verify Action dialog appears, as shown in the figure below.
Figure 104: Add Program / Verify Action dialog
3. Select the U-Boot image you want to write by clicking File System.
4. Select the Erase sectors before program checkbox to erase sectors before U-Boot is programmed.
5. Select the Apply Address Offset checkbox and set the start address of the U-Boot image to beprogrammed.
The U-Boot image for the LS1 targets is written from block 8 (the address that you haveto specify in the Address field is computed as described earlier in this section: block 8x 512 = 4096 = 0x00001000).
NOTE
6. Click Add Program Action to add a program action on the flash device.
7. Click Done to close the Add Program / Verify Action dialog.
8. Execute the flash programmer target task.
11.1.5 Flash File to TargetYou can use the Flash File to Target feature to perform flash operations, such as erasing a flash device orprogramming a file.
You do not need any project for using Flash File to Target feature, only a valid Remote System is required.
To open the Flash File to Target dialog, click the Flash Programmer button on the IDE toolbar.
• Connection pop-up menu- Lists all run configurations defined in Eclipse. If a connection to the target hasalready been made the control becomes inactive and contains the text Active Debug Configuration.
• Flash Configuration File pop-up menu - Lists predefined target tasks for the processor selected in theLaunch Configuration and tasks added by user with the Browse button. The items in this pop-up menu areupdated based on the processor selected in the launch configuration.
• Unprotect flash memory before erase checkbox - Select to unprotect flash memory before erasing theflash device. This feature allows you to unprotect the flash memory from Flash File To Target dialog.
• File to Flash group - Allows selecting the file to be programmed on the flash device and the location.
Working with Hardware ToolsFlash programmer
CodeWarrior for ARMv7 Targeting Manual, Rev. 10.0.8, 01/2016Freescale Semiconductor, Inc. 193

• File text box - Used for specifying the filename. You can use the Workspace, File System, or Variablesbuttons to select the desired file.
• Offset:0x text box - Used for specifying offset location for a file. If no offset is specified the default value ofzero is used. The offset is always added to the start address of the file. If the file does not contain addressinformation then zero is considered as start address.
• Save as Target Task - Select to enable Task Name text box.
• Task Name text box - Lets you to save the specified settings as a Flash target task. Use the testbox tospecify the name of the target task.
• Erase Whole Device button - Erases the flash device. In case you have multiple flash blocks on the device,all blocks are erased. If you want to selectively erase or program blocks, use the Flash programmer onpage 183 feature.
• Erase and Program button - Erases the sectors that are occupied with data and then programs the file. Ifthe flash device can not be accessed at sector level then the flash device is completely erased.
This feature helps you perform these basic flash operations:
• Erasing flash device on page 194
• Programming file on page 194
11.1.5.1 Erasing flash deviceThis section explains how to erase a flash device using the Flash File to Target feature.
To erase a flash device, follow these steps:
1. Click the Flash Programmer button on the IDE toolbar.
The Flash File to Target dialog appears.
2. Choose a connection from the Connection pop-up menu.
If a connection is already established with the target, this control is disabled.
NOTE
The Flash Configuration File pop-up menu is updated with the supported configurations for the processorfrom the launch configuration.
3. Choose a flash configuration from the Flash Configuration File pop-up menu.
4. Select the Unprotect flash memory before erase checkbox to unprotect flash memory before erasing theflash device.
5. Click the Erase Whole Device button.
11.1.5.2 Programming fileThis section explains how to program a file using the Flash File to Target feature.
The steps are as follows:
1. Click the Flash Programmer button on the IDE toolbar.
The Flash File to Target dialog appears.
2. Choose a connection from the Connection pop-up menu.
If a connection is already established with the target, this control is disabled.
NOTE
Working with Hardware ToolsFlash programmer
CodeWarrior for ARMv7 Targeting Manual, Rev. 10.0.8, 01/2016194 Freescale Semiconductor, Inc.

The Flash Configuration File pop-up menu is updated with the supported configurations for the processorfrom the launch configuration.
3. Choose a flash configuration from the Flash Configuration File pop-up menu.
4. Select the Unprotect flash memory before erase checkbox to unprotect flash memory before erasing theflash device.
5. Type the file name in the File text box. You can use the Workspace, File System, or Variables buttons toselect the desired file.
6. Type the offset location in the Offset text box.
7. Click the Erase and Program button.
11.2 Hardware diagnosticsThe Hardware Diagnostics utility lets you run a series of diagnostic tests that determine if the basic hardwareis functional.
These tests include:
• Memory read/write: This test only makes a read or write access to the memory in order to read or write abyte, word (2 bytes) and long word (4 bytes) to or from the memory. For this task, the user needs to set theoptions in the Memory Access group.
• Scope loop: This test makes read and write accesses to memory in a loop at the target address. The timebetween accesses is given by the loop speed settings. The loop can only be stopped by the user, whichcancels the test. For this type of test, the user needs to set the memory access settings and the loop speed.
• Memory tests: This test requires the user to set the access size and target address from the access settingsgroup and the settings present in the Memory Tests group.
This section contains the following subsections:
• Creating hardware diagnostics task on page 195
• Working with Hardware Diagnostic Action editor on page 196
11.2.1 Creating hardware diagnostics taskYou can create a hardware diagnostic task using the Create New Target Task wizard.
To create a task for hardware diagnostics:
1. Choose Window > Show View > Other from the IDE menu bar.
The Show View dialog appears.
2. Expand the Debug group and select Target Tasks.
3. Click OK.
4. Click the Create New Target Task button on the Target Tasks view toolbar. Alternatively, right-click in theTarget Tasks view and choose New Task from the shortcut menu.
The Create a Target Task dialog appears.
Working with Hardware ToolsHardware diagnostics
CodeWarrior for ARMv7 Targeting Manual, Rev. 10.0.8, 01/2016Freescale Semiconductor, Inc. 195

Figure 105: Create a Target Task
5. Type name for the new task in the Task Name text box.
6. Choose a launch configuration from the Run Configuration pop-up menu.
If the task does not successfully launch the configuration that you specify, the Executebutton on the Target Tasks view toolbar appears disabled.
NOTE
7. Choose Hardware Diagnostic for ARM from the Task Type pop-up menu.
8. Click Finish.
A new hardware diagnostic task is created in the Target Tasks view.
You can perform various actions on a hardware diagnostic task, such as renaming,deleting, or executing the task, using the shortcut menu that appears on right-clickingthe task in the Target tasks view.
NOTE
11.2.2 Working with Hardware Diagnostic Action editorThe Hardware Diagnostic Action editor is used to configure a hardware diagnostic task.
To open the Hardware Diagnostic Action editor for a particular task, double-click the task in the Target Tasksview.
The following figure shows the Hardware Diagnostics Action editor.
Working with Hardware ToolsHardware diagnostics
CodeWarrior for ARMv7 Targeting Manual, Rev. 10.0.8, 01/2016196 Freescale Semiconductor, Inc.

Figure 106: Hardware Diagnostics Action editor
The Hardware Diagnostics Action editor window includes the following groups:
• Action Type on page 197
• Memory Access on page 197
• Loop Speed on page 198
• Memory Tests on page 198
11.2.2.1 Action TypeYou can choose the action type from the Action Type group in the Hardware Diagnostics Action editorwindow.
You can choose any one of the following actions:
• Memory read/write - Enables the options in the Memory Access group
• Scope loop - Enables the options in the Memory Access and the Loop Speed groups
• Memory test - Enables the access size and target address from the access settings group and the settingspresent in the Memory Tests group
11.2.2.2 Memory AccessThe Memory Access pane configures diagnostic tests for performing memory reads and writes over theremote connection interface.
The table below lists and describes the items in the pane.
Working with Hardware ToolsHardware diagnostics
CodeWarrior for ARMv7 Targeting Manual, Rev. 10.0.8, 01/2016Freescale Semiconductor, Inc. 197

Table 64: Memory Access pane items
Item Description
Read Select to have the hardware diagnostic tools perform read tests.
Write Select to have the hardware diagnostic tools perform write tests.
1 Byte Select to have the hardware diagnostic tools perform byte-size operations.
2 Bytes Select to have the hardware diagnostic tools perform word-size operations.
4 Bytes Select to have the hardware diagnostic tools perform long-word-size operations.
Memory space andaddress
Specify the address of an area in RAM that the hardware diagnostic tools shouldanalyze. The tools must be able to access this starting address through the remoteconnection (after the hardware initializes).
Value Specify the value that the hardware diagnostic tools write during testing. Select theWriteoption to enable this text box.
Verify Memory Writes Select the checkbox to verify success of each data write to the memory.
11.2.2.3 Loop SpeedThe Loop Speed pane configures diagnostic tests for performing repeated memory reads and writes over theremote connection interface.
The tests repeat until you stop them. By performing repeated read and write operations, you can use a scopeanalyzer or logic analyzer to debug the hardware device. After the first 1000 operations, the Status shows theestimated time between operations.
For all values of Speed, the time between operations depends heavily on the processingspeed of the host computer.
NOTE
For Read operations, the Scope Loop test has an additional feature. During the first read operation, the hardwarediagnostic tools store the value read from the hardware. For all successive read operations, the hardwarediagnostic tools compare the read value to the stored value from the first read operation. If the Scope Loop testdetermines that the value read from the hardware is not stable, the diagnostic tools report the number of timesthat the read value differs from the first read value. The following table lists and describes the items in LoopSpeed pane.
Table 65: Loop Speed pane items
Item Description
Specify the speed Enter a numeric value between 0 to 1000 in the text box to adjust the speed.You can also move the slider to adjust the speed at which the hardwarediagnostic tools repeat successive read and write operations. Lower speedsincrease the delay between successive operations. Higher speeds decreasethe delay between successive operations.
11.2.2.4 Memory TestsThe Memory Tests pane lets you perform three hardware tests: Walking Ones, Address, and Bus Noise.
You can specify any combination of tests and number of passes to perform. For each pass, the hardwarediagnostic tools performs the tests in turn, until all passes are complete. The tools compare memory test failures
Working with Hardware ToolsHardware diagnostics
CodeWarrior for ARMv7 Targeting Manual, Rev. 10.0.8, 01/2016198 Freescale Semiconductor, Inc.

and display them in a log window after all passes are complete. Errors resulting from memory test failures donot stop the testing process; however, fatal errors immediately stop the testing process.
The following table explains the items in the Memory Tests pane.
Table 66: Memory Tests pane items
Item Explanation
Walking 1's Select the checkbox to have the hardware diagnostic tools perform the WalkingOnes on page 199 test. Deselect to have the diagnostic tools skip the WalkingOnes on page 199 test.
Address Select to have the hardware diagnostic tools perform the Address on page 200test. Deselect to have the diagnostic tools skip the Address on page 200 test.
Bus Noise Select to have the hardware diagnostic tools perform the Bus Noise on page 200test. Deselect to have the diagnostic tools skip the Bus Noise on page 200 test.
Test Area Size Specify the size of memory to be tested. This setting along with Target Addressdefines the memory range being tested.
Number of Passes Enter the number of times that you want to repeat the specified tests.
This section contains the following subsections:
• Walking Ones on page 199
• Address on page 200
• Bus Noise on page 200
• Memory test use cases on page 200
11.2.2.4.1 Walking OnesThis section describes the Walking Ones test.
This test detects these memory faults:
• Address Line: The board or chip address lines are shorting or stuck at 0 or 1. Either condition could result inerrors when the hardware reads and writes to the memory location. Because this error occurs on anaddress line, the data may end up in the wrong location on a write operation, or the hardware may accessthe wrong data on a read operation.
• Data Line: The board or chip data lines are shorting or stuck at 0 or 1. Either condition could result incorrupted values as the hardware transfers data to or from memory.
• Retention: The contents of a memory location change over time. The effect is that the memory fails to retainits contents over time.
The Walking Ones test includes four sub-tests:
• Walking Ones: This subtest first initializes memory to all zeros. Then the subtest writes, reads, and verifiesbits, with each bit successively set from the least significant bit ( LSB) to the most significant bit ( MSB). Thesubtest configures bits such that by the time it sets the MSB, all bits are set to a value of 1. This patternrepeats for each location within the memory range that you specify. For example, the values for a byte-based Walking Ones subtest occur in this order:
0x01, 0x03, 0x07, 0x0F, 0x1F, 0x3F, 0x7F, 0xFF
Working with Hardware ToolsHardware diagnostics
CodeWarrior for ARMv7 Targeting Manual, Rev. 10.0.8, 01/2016Freescale Semiconductor, Inc. 199

• Ones Retention: This subtest immediately follows the Walking Ones subtest. The Walking Ones subtestshould leave each memory location with all bits set to 1. The Ones Retention subtest verifies that eachlocation has all bits set to 1.
• Walking Zeros: This subtest first initializes memory to all ones. Then the subtest writes, reads, and verifiesbits, with each bit successively set from the LSB to the MSB. The subtest configures bits such that by thetime it sets the MSB, all bits are set to a value of 0. This pattern repeats for each location within the memoryrange that you specify. For example, the values for a byte-based Walking Zeros subtest occur in this order:
0xFE, 0xFC, 0xF8, 0xF0, 0xE0, 0xC0, 0x80, 0x00
• Zeros Retention: This subtest immediately follows the Walking Zeros subtest. The Walking Zeros subtestshould leave each memory location with all bits set to 0. The Zeros Retention subtest verifies that eachlocation has all bits set to 0.
11.2.2.4.2 AddressThis section describes the Address test.
This test detects memory aliasing. Memory aliasing exists when a physical memory block repeats one or moretimes in a logical memory space. Without knowing about this condition, you might conclude that there is muchmore physical memory than what actually exists.
The address test uses a simplistic technique to detect memory aliasing. The test writes sequentially increasingdata values (starting at one and increasing by one) to each successive memory location. The maximum datavalue is a prime number and its specific value depends on the addressing mode so as to not overflow the memorylocation.
The test uses a prime number of elements to avoid coinciding with binary math boundaries:
• For byte mode, the maximum prime number is 28-5 or 251.
• For word mode, the maximum prime number is 216-15 or 65521.
• For long word mode, the maximum prime number is 232-5 or 4294967291.
If the test reaches the maximum value, the value rolls over to 1 and starts incrementing again. This sequentialpattern repeats throughout the memory under test. Then the test reads back the resulting memory and verifiesit against the written patterns. Any deviation from the written order could indicate a memory aliasing condition.
11.2.2.4.3 Bus NoiseThis section describes the Bus Noise test.
This test stresses the memory system by causing many bits to flip from one memory access to the next (bothaddresses and data values). Bus noise occurs when many bits change consecutively from one memory accessto another. This condition can occur on both address and data lines.
11.2.2.4.4 Memory test use casesThis section describes some memory test use cases.
The memory read/write, scope loop tests, and memory tests are host-based tests. The host machine issuesread and write action to the memory through the connection protocol. For example, CodeWarrior connectionserver (CCS). Memory tests are the complex tests that can be executed in two modes: Host based and Targetbased depending upon the selection made for the Use Target CPU checkbox. The Host based tests are slower.The target based tests are not available.
Working with Hardware ToolsHardware diagnostics
CodeWarrior for ARMv7 Targeting Manual, Rev. 10.0.8, 01/2016200 Freescale Semiconductor, Inc.


How To Reach UsHome Page:
freescale.com
Web Support:
freescale.com/support
Information in this document is provided solely to enable systemand software implementers to use Freescale products. There areno express or implied copyright licenses granted hereunder todesign or fabricate any integrated circuits based on the informationin this document. Freescale reserves the right to make changeswithout further notice to any products herein.
Freescale makes no warranty, representation, or guaranteeregarding the suitability of its products for any particular purpose,nor does Freescale assume any liability arising out of theapplication or use of any product or circuit, and specificallydisclaims any and all liability, including without limitationconsequential or incidental damages. “Typical” parameters thatmay be provided in Freescale data sheets and/or specifications canand do vary in different applications, and actual performance mayvary over time. All operating parameters, including “typicals,” mustbe validated for each customer application by customer's technicalexperts. Freescale does not convey any license under its patentrights nor the rights of others. Freescale sells products pursuant tostandard terms and conditions of sale, which can be found at thefollowing address: freescale.com/SalesTermsandConditions.
Freescale, the Freescale logo, CodeWarrior, and QorIQ aretrademarks of Freescale Semiconductor, Inc., Reg. U.S. Pat. & Tm.Off. All other product or service names are the property of theirrespective owners. ARM, Cortex, Cortex-A7, TrustZone aretrademarks of ARM Limited (or its subsidiaries) in the EU and/orelsewhere. All rights reserved.
Ⓒ 2016 Freescale Semiconductor, Inc.
CW_ARMv7_Targeting_ManualRev. 10.0.8
01/2016