coding geographic areas across census years: creating - national
TRANSCRIPT
Coding Geographic Areas across Census Years:Creating Consistent Definitions of Metropolitan Areas
David A. JaegerHunter College and CUNY Graduate School
Susanna LoebUniversity of California at Davis
Sarah E. TurnerUniversity of Virginia
John BoundUniversity of Michigan
September 1998
Acknowledgements: This coding effort benefited substantially from the resources of thePopulation Studies Center at the University of Michigan. In particular, the authors thankLisa Neidert for her extraordinary efforts in helping us to use the Census materials and LisaLee for her research assistance.
2
ABSTRACT
This paper presents suggested matches for the geographical coding (geocoding) ofmetropolitan areas in the 1970, 1980, and 1990 Censuses. The Census Bureau useddifferent definitions and taxonomies to describe the geography of metropolitan areas inthese three Census years. As a result, the geographic areas referred to by the standardCensus Bureau definitions differ among the three Census data sets. The geographicmatching scheme explained in this paper attempts to maximize consistency over time formetropolitan areas in the U.S.
David A. Jaeger Sarah E. TurnerDepartment of Economics School of Education andHunter College Department of Economics695 Park Avenue University of VirginiaNew York, NY 10021-5085 405 Emmet [email protected] Charlottesville, VA 22903
Susanna Loeb John BoundDepartment of Economics Population Studies CenterUniversity of California – Davis University of MichiganDavis, CA 95616 1225 South University [email protected] Ann Arbor, MI 48104
[email protected] NBER

3
I. Introduction
This paper presents suggested matches for the geographical coding (geocoding) of
metropolitan areas for use with the public use microsamples (PUMS) of the 1970, 1980,
and 1990 Censuses. The Census Bureau used different definitions and taxonomies to
describe the geography of metropolitan areas in these three Census years. As a result, the
geographic areas referred to by the standard Census Bureau definitions differ among the
three Census data sets. The geographic matching scheme explained in this paper attempts
to maximize consistency over time for metropolitan areas in the U.S.
These geocodings first appeared in two projects that used metropolitan areas as
proxies for well-defined, independent labor markets. Building on the earlier work of Loeb
described below, Jaeger (1995) constructed geographically consistent definitions of the 50
largest metropolitan areas between the 1980 and 1990 Censuses to examine the
substitutability of immigrants and natives in different skill categories. He also examined
the impact of immigration on the wages of native workers in those 50 metropolitan areas.
Bound and Holzer (1996) examined the effect of labor demand shifts and population
adjustments on economic outcomes of specific demographic groups during the 1980s. For
this analysis, Loeb and Turner extended Jaeger’s geocodings to cover the 132 metropolitan
areas with 1990 populations in excess of 250,000. Prior to these studies, Loeb generated a
1970-80-90 match for an initial inquiry on local labor markets by Bound and Holzer.1
1 Loeb’s work built on an earlier 1970-80 match of 52 metropolitan areas done by Marshall Cummings forwork done by Bound and Holzer (1993) using the 1970 and 1980 Censuses.
4
The geographic coding available in the 1970 Census necessitates more limited, and
less inclusive, definitions of the metropolitan areas. This results in a less-precise mapping
than is possible between 1980 and 1990 alone. In this sense, the geographic coding of the
PUMS data for the three Census years implies that the 1970/1980/1990 matching is cruder
than the 1980/1990 matching. Since there are certainly many additional questions that
might be addressed using these data, the purpose of this note is to provide a guide to how
the metropolitan area mappings were made from which others may benefit.
Section II of the paper briefly summarizes the various terms and resources
important in using data with metropolitan areas as the focal geographic unit. Section III
provides a step-by-step explanation of the matching process between 1980 and 1990, with
a summary of the imperfections in this process. Section IV discusses the matching of
1970, 1980 and 1990 metropolitan areas and explains why the changes in coding during
that time inhibit the process of matching without the introduction of substantial
mismatches across years.
II. Census Micro Data and the Classification of Metropolitan Areas
In 1990, the Census Bureau defines a Metropolitan Area (MA) as:
a large population nucleus, together with adjacent communities that have ahigh degree of economic and social integration with that nucleus...Each MAmust contain either a place with a minimum population of 50,000 or aCensus Bureau-defined urbanized area and a total MA population of at least100,000 (75,000 in New England). An MA comprises one or more centralcounties (cities and towns in New England) that have close economic andsocial relationships with the central county. An outlying county must have a

5
specified level of commuting to the central counties and must meet certainstandards regarding metropolitan character, such as population density,urban population, and population growth.
Using this concept as a starting point, our objective was to construct metropolitan
areas that maximize geographic consistency across Census years. While this is a relatively
straightforward task in principle, changes in federal definitions of metropolitan areas, as
well as a change in the coding scheme to designate sub-areas comprising these
metropolitan areas, complicate this process considerably.
One source of confusion and complication in many analyses discussing
metropolitan areas is the distinction among a veritable “alphabet soup” of metropolitan
designations. Various “types” of MAs, which are not necessarily mutually exclusive, and
the Census years in which the terms applied include:
• MSA (90): relatively freestanding and not closely associated with other MAs, typicallysurrounded by non-metropolitan areas; the title of an MSA contains the name of itslargest city and up to two additional city names.
• CMSA (90): a consolidated metropolitan area is an MA of more than 1 million peoplewhich may included one or more PMSAs (see below); this concept provides anumbrella classification for cities whose economies are closely tied.2
• PMSA (90): a primary metropolitan statistical area defines a large urbanized county orcluster of counties that demonstrate very strong internal economic and social linkswithin a CMSA
• SMSA (80): An SMSA consists of one or more entire counties or county equivalents(in New England, towns and cities are the basic units).
2 For example, in 1980 New York City, Jersey City, and Newark were considered to be separate metropolitanareas. In 1990, all three -- along with a substantial portion of New Jersey, and several counties in New YorkState and Connecticut -- are considered to be part of the New York--New Jersey--Long Island CMSA.
6
Although counties are the primary political units in most states, other designations are
used in states like Louisiana where parishes are the primary geographical division and in
New England areas where cities and towns are often more meaningful designations.
MA designations are managed by the Federal Office of Management and Budget,
following uniform standards. Unfortunately, since the SMSA to PMSA/CMSA/MSA
mappings are not one-to-one, it is not possible to simply map from one scheme to the
other; rather, it is necessary to examine the component parts of these metropolitan
classifications to put the pieces together as consistently as possible.
For the 1990 Census microdata, the building blocks in creating metropolitan areas
are the Public Use Microdata Areas (or PUMAs). PUMAs comprise population groups of
at least 100,000 persons and are designated by five-digit numbers that are unique within
states. While the Census Bureau records data at the more disaggregate levels of the block,
the block area and the tract, the PUMA is the most disaggregate unit of analysis available
to the researcher with the microdata records.3 Depending on the population density of the
specific area and the geographic range of the respective counties, PUMAs may define a
subset (several Census tracts) of a single county (e.g., Westchester County in New York
State comprises PUMAs 04401 through 04405 plus 04500) or, in less densely populated
areas, the PUMA might consist of several counties, all with quite small populations (e.g.,
PUMA 03500 in New York State comprises Cortland, Tioga, and Tompkins Counties).
3 The Census Bureau does release aggregate or average data at more disaggregate units such as the tract.
7
For the 1980 Census microdata, the county group is the primary building block
used in constructing the metropolitan area. While the county group serves the same
functional purpose as the PUMA, the definitions are not entirely coincident with PUMAs.
In general, county groups tend to comprise somewhat larger geographic areas than PUMAs,
though this is not universally true. Thus, our objective is to “add up” county groups in
1980 and PUMAs in 1990 to produce consistent geographical definitions for each
metropolitan area.
III. The Mechanics of the 1990 to 1980 match
The primary tools for matching 1980 and 1990 data are the geographical
equivalency files for each year.4 For matching 1990 and 1980 data, we focus on CMSA
definitions where applicable, because CMSAs are likely to be better approximations of
local labor markets than PMSAs. In total, we matched county groups and PUMAs for 132
MSAs, representing all metropolitan areas with populations larger than 250,000.
The steps to the matching process include:
1. Match PUMAs to MSAs/CMSAs in the 1990 Census using the GeographicalEquivalency file.
4 The geographic equivalency file for the 5 percent PUMS can be found atftp://ftp.psc.lsa.umich.edu/pub/census/pums/1980/5pct/equiv/ and
8
As a first step, we are able to eliminate those PUMAs composed of entirely non-
metropolitan areas. Next, when PUMAs reflect a geographical area entirely within a
CMSA/MSA the PUMA is allocated to the MSA. Cases in which the PUMA is split
between (possibly multiple) metropolitan areas and/or non-metropolitan areas present more
difficulty. In cases where the PUMA encompasses multiple metropolitan areas, it is
assigned to a single metropolitan area based on geography and the relative populations of
the different metropolitan areas within the PUMA. In other words, the PUMA is assigned
to the MSA with a greatest share of the PUMA’s population. For PUMAs including both a
metropolitan and non-metropolitan areas, we assigned the entire PUMA to the
metropolitan area. Thus, our definition of CMSAs and MSAs is slightly different from
those defined by the Bureau of the Census and includes some non-metropolitan areas.
2. Match 1980 County Groups to 1990 MSA/CMSA Definitions.
Having redefined the CMSAs/MSAs based on information available in the 1990
PUMS file, we then match the 1980 county groups to those definitions. In most cases, we
were able to match the geographies exactly or nearly exactly.
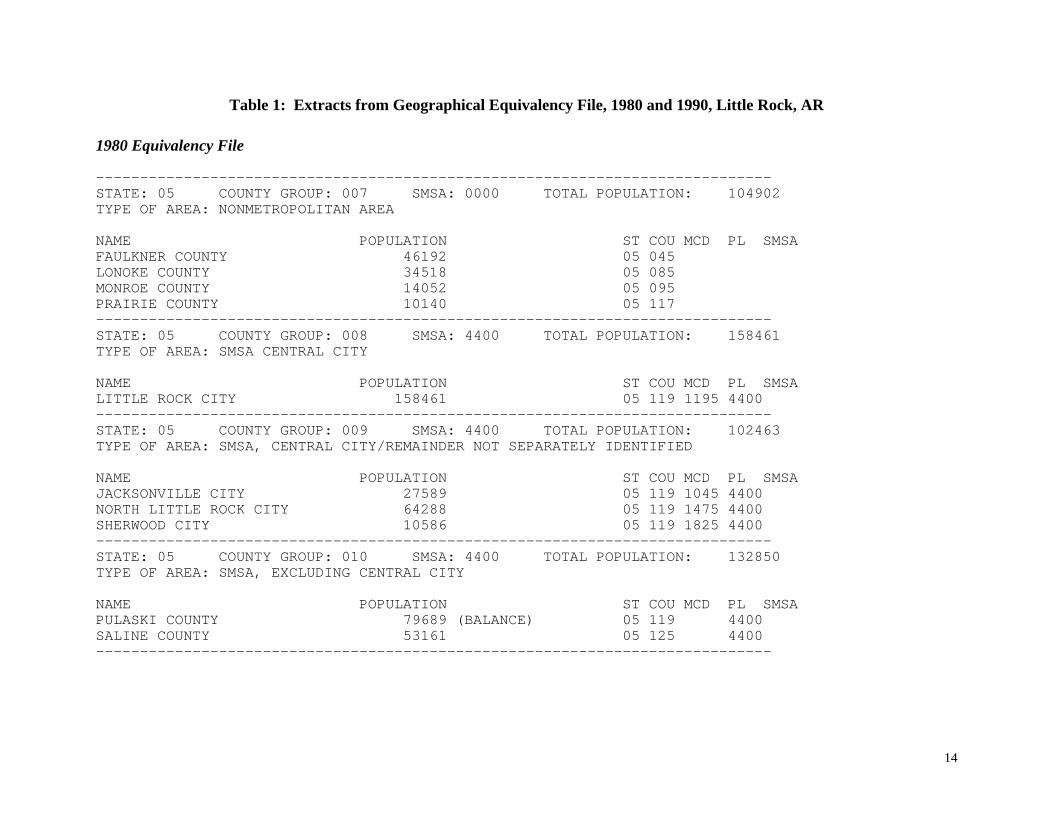
Table 1, which gives extracts from the 1980 and 1990 geographic equivalency files
for the area around Little Rock, Arkansas, helps to illustrate this process more clearly.
Looking at the 1990 equivalency extract, we see that Little Rock (CMSA 4400) appears in
PUMA 1500 and PUMA 1600. All of PUMA 1500 is in Little Rock so this is immediately
ftp://ftp.psc.lsa.umich.edu/pub/census/pums/1990/5pct/equiv/, for 1980 and 1990,

9
included in our definition of Little Rock. Only part of PUMA 1600 is in the CMSA
definition of Little Rock. However, since the remainder of PUMA 1600 is not in any other
metropolitan area, this PUMA is also included in our definition. We see from the extract
that, while the Census definition included only Pulaski (119), Saline (125), Faulkner (045),
and Lonoke (085) counties. Ours includes Monroe (095) and Prairie (117) counties as
well.
Next look at the 1980 geographic equivalency file extract. We would like to select
the county groups so as to match the counties in Little Rock between 1980 and 1990.
County group 007 includes counties 045, 085, 095, and 117, all of which are in our
definition of Little Rock. We therefore include county group 007 in our 1980 sample.
Similarly county groups 008 and 009 include parts of county 119 so they are included as
well. Finally, county group 010 has both county 125 and the balance of Pulaski County
and so also is included in our 1980 definition. In this case we have a perfect match
between the two years.
Table 2 presents the results of this matching process for the 132 MSAs with 1990
populations greater than 250,000. The first column gives the name of the metropolitan area
and the second, the state number. Columns two and three give the 1980 county group
numbers and the 1990 PUMA numbers that comprise our definition of the MA.
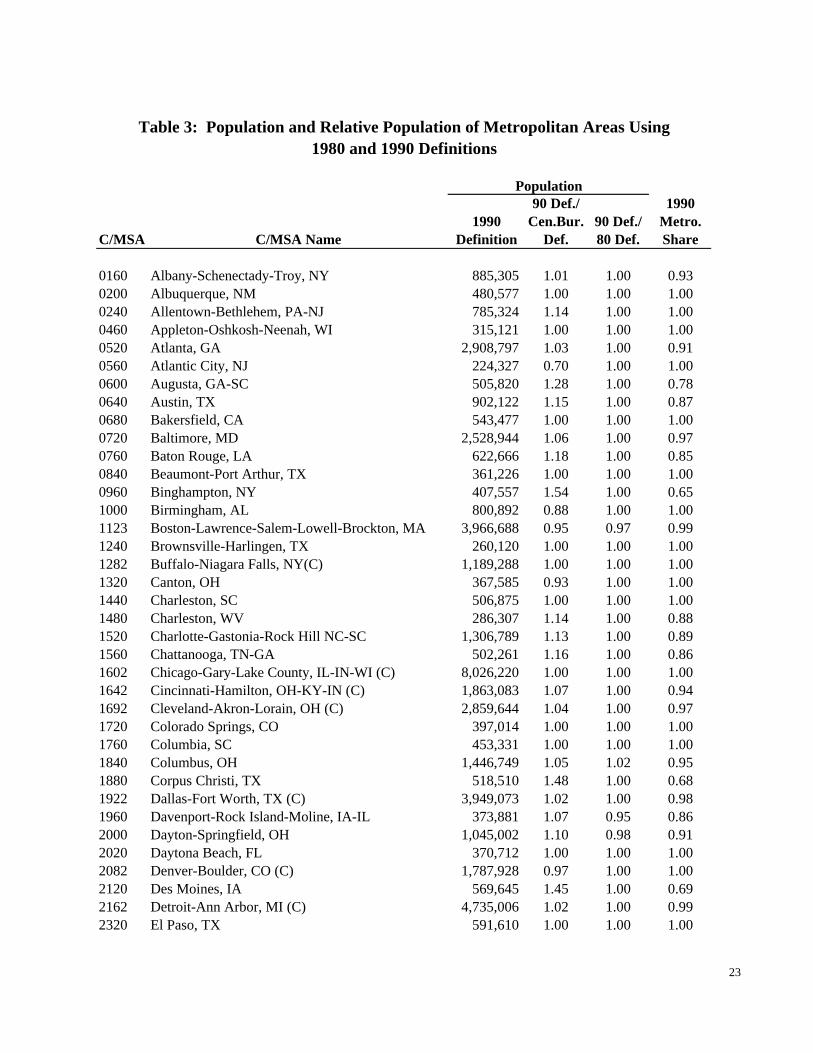
Table 3 describes each C/MSA match by its 1990 population based on the
geographic areas included in our 1990 definition, the ratio of our definition to the Census
Bureau definition (as a measure of the similarity of the Census Bureau definition and our
respectively.
10
definition), the ratio of the 1990 population based on our definition to the 1990 population
based on the county group definition (as a measure of how well the 1980 and 1990
definitions match), and the percent of the C/MSA that is considered a metropolitan area in
our 1990 definition. The matches are generally quite close, if not exact. Our definition
contains somewhat larger populations than the Census Bureau’s for some metropolitan
areas.
SAS code which implements these matches is available at
http://www.nber.org/census-geocodes.
III. Matching 1970, 1980, and 1990
The process for matching 1970, 1980 and 1990 metropolitan areas was similar to
the one described above for the later two years. However, the geographic (county group)
codes available in the 1970 Census allow for far less precision than in the later years. In
most cases, the metropolitan area, as defined in 1970, is composed of one county group.
Trying to expand this definition to include surrounding areas often entails including most
of the remainder of the state. Moreover, the 1970 definitions of the metropolitan areas tend
to be substantially smaller than in 1980 or 1990. The choice then becomes between too
small a definition, which may leave out a substantial part of the area labor market, or too
large a definition, which may defeat the purpose of using metropolitan areas instead of
states as the unit of analysis. The situation is not so dark for all areas.
11
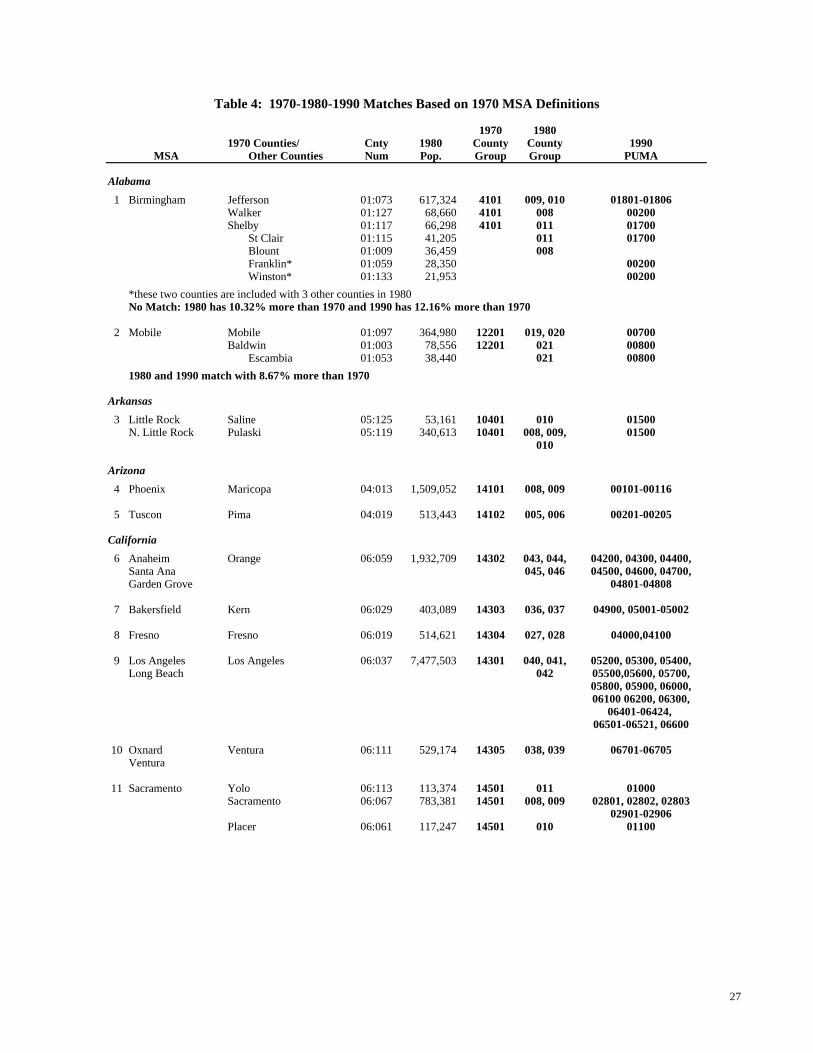
Table 4 presents the 1970-80-90 matches for 125 metropolitan areas that are
identifiable in the 1970 PUMS data. The third column of this table gives the names of the
counties included in the 1970 definition of each metropolitan area. The fourth column
gives the names of other counties that were included in either our 1980 or 1990 definition.
It is important to note that the 1980 and 1990 definitions presented here are not the same as
those for the 1980-90 match since they are based closely on the 1970 Census definition, not
the 1990 Census definition. Columns five and six give the county numbers and 1980
county populations. The three remaining columns give the 1970 county group numbers,
the 1980 county group numbers, and the 1990 PUMA numbers to be included in the match.
In most cases all these numbers are in bold text and should be included in the new
definitions. In a few cases, plain text numbers are included. We do not include these in
our match. However, the matches including and not including these plain text county
groups or PUMAs were close enough that we provide them in the table so that the reader
may decide his/her own preference for including or excluding these areas. The final line in
the table for each metropolitan area describes the precision of the fit.
To see how this matching was accomplished, again consider Little Rock, Arkansas.
In 1970, this metropolitan area was defined as Saline and Pulaski Counties alone. For the
1980 these counties correspond precisely to county groups 008, 009 and 010, while in 1990
they are both included in PUMA 1500. As is the case for the 1980-90 mapping, this is a
perfect match. However, it also is a substantially more limited definition of Little Rock.
As a second example, consider Miami, Florida. The 1970 definition includes only Dade
County. In 1990 we can match Dade County exactly with PUMAs 03601, 03602, 03700,
12
03800, and 03901-03909. In 1980, on the other hand, in order to get all of Dade County
we have to use county group 053, which includes Monroe County as well. Based on the
1980 population figures, we then have a perfect match between 1970 and 1990 but have
3.89% more people in our 1980 definition. From the plain text PUMAs we can also see
that in order to match 1980 and 1990 more precisely we would have to include PUMA
02400 which would give us Collier County, as well, taking us further from the 1970
definition. We chose not to do this for our match. Overall, 63 of the 125 metropolitan
areas are perfectly matched across the three years. The precision of the other matches
varies considerably. The table indicates for which areas the match is not precise; those
areas without notes match exactly.
IV. Conclusion
Matching the geographies of metropolitan areas is complicated by a lack of
consistent definitions in the underlying data. Using the constituent geographic units –
county groups in 1970 and 1980, and PUMAs in 1990, we propose two matches for use
with PUMS data from the 1970, 1980, and 1990 Censuses. In the first, we provide a match
between the 1980 and 1990 geographies, while in the second, we provide a less-precise
match between the geographies in all three Census years. In this match we have attempted
to maximize the geographic consistency of our definitions across years to facilitate the
analysis of economic and social outcomes with the Census.
13
References
Bound, John and Harry Holzer (1993) “Industrial Shifts, Skill Levels, and the LaborMarket for White and Black Males,” Review of Economics and Statistics, 75(August), 387-396.
Bound, John and Harry Holzer (1996) “Demand Shifts, Population Adjustments, andLabor Market Outcomes During the 1980s,” NBER Working Paper 5685, July.
Census of Population and Housing (1992) “1990: Public Use Microdata Sample U.S.Technical Documentation” prepared by the Bureau of the Census, Washington,D.C.
Census of Population and Housing (1983) “1980: Public Use Microdata Sample U.S.Technical Documentation” prepared by the Bureau of the Census, Washington,D.C.
Jaeger, David A. (1995) Essays in Empirical Labor Economics, Ph.D. Dissertation,University of Michigan Department of Economics.
14
Table 1: Extracts from Geographical Equivalency File, 1980 and 1990, Little Rock, AR
1980 Equivalency File
-----------------------------------------------------------------------------STATE: 05 COUNTY GROUP: 007 SMSA: 0000 TOTAL POPULATION: 104902TYPE OF AREA: NONMETROPOLITAN AREA
NAME POPULATION ST COU MCD PL SMSAFAULKNER COUNTY 46192 05 045LONOKE COUNTY 34518 05 085MONROE COUNTY 14052 05 095PRAIRIE COUNTY 10140 05 117-----------------------------------------------------------------------------STATE: 05 COUNTY GROUP: 008 SMSA: 4400 TOTAL POPULATION: 158461TYPE OF AREA: SMSA CENTRAL CITY
NAME POPULATION ST COU MCD PL SMSALITTLE ROCK CITY 158461 05 119 1195 4400-----------------------------------------------------------------------------STATE: 05 COUNTY GROUP: 009 SMSA: 4400 TOTAL POPULATION: 102463TYPE OF AREA: SMSA, CENTRAL CITY/REMAINDER NOT SEPARATELY IDENTIFIED
NAME POPULATION ST COU MCD PL SMSAJACKSONVILLE CITY 27589 05 119 1045 4400NORTH LITTLE ROCK CITY 64288 05 119 1475 4400SHERWOOD CITY 10586 05 119 1825 4400-----------------------------------------------------------------------------STATE: 05 COUNTY GROUP: 010 SMSA: 4400 TOTAL POPULATION: 132850TYPE OF AREA: SMSA, EXCLUDING CENTRAL CITY
NAME POPULATION ST COU MCD PL SMSAPULASKI COUNTY 79689 (BALANCE) 05 119 4400SALINE COUNTY 53161 05 125 4400-----------------------------------------------------------------------------

15
Table 1, continued
1990 Equivalency File
----------------------------------------------------------------------------- STATE: 05 PUMA: 01500 MSA/PMSA: 4400 TYPE OF AREA: COUNTIES/INDEPENDENT CITIES (2 OR MORE)
NAME POPULATION ST COU MCD PLACE TRACT MSA/PMSA Pulaski County 349660 05 119 4400 Saline County 64183 05 125 4400
TOTAL POPULATION: 413843----------------------------------------------------------------------------- STATE: 05 PUMA: 01600 MSA/PMSA: 9997 TYPE OF AREA: COUNTIES/INDEPENDENT CITIES (2 OR MORE)
NAME POPULATION ST COU MCD PLACE TRACT MSA/PMSA Faulkner County 60006 05 045 4400 Lonoke County 39268 05 085 4400 Monroe County 11333 05 095 9999 Prairie County 9518 05 117 9999
TOTAL POPULATION: 120125-----------------------------------------------------------------------------

1980State County 1990
MSA C/MSA Name Num. Group PUMA
0160 Albany-Schenectady-Troy, NY 36 5-9 800-120036 33 3800
0200 Albuquerque, NM 35 4-5 201-2040240 Allentown-Bethlehem, PA-NJ 42 51-54 2001-21020460 Appleton-Oshkosh-Neenah, WI 55 5-6 400-5000520 Atlanta, GA 13 4-10 800
13 12 1500-210313 27 230013 3000
0560 Atlantic City, NJ 34 38 100-2000600 Augusta, GA-SC 13 25-26 500
13 220045 16 1800
0640 Austin, TX 48 44-45 4901-520048 66
0680 Bakersfield, CA 6 36-37 4900-50020720 Baltimore, MD 24 4-8 201-306
24 12 500-60024 1000-110024 1501-1504
0760 Baton Rouge, LA 22 14-17 1200-15000840 Beaumont-Port Arthur, TX 48 54-56 5900-61000960 Binghampton, NY 36 17 3500-3602
36 29-301000 Birmingham, AL 1 9-11 1700-18061123 Boston-Lawernce-Salem-Lowell-Brockton, MA 25 11-33 1400-3800
33 3 50133 503
1240 Brownsville-Harlingen, TX 48 38 4201-4202
Table 2: 1980 -1990 Matches Based on
1990 MSA/CMSA Definitions
16
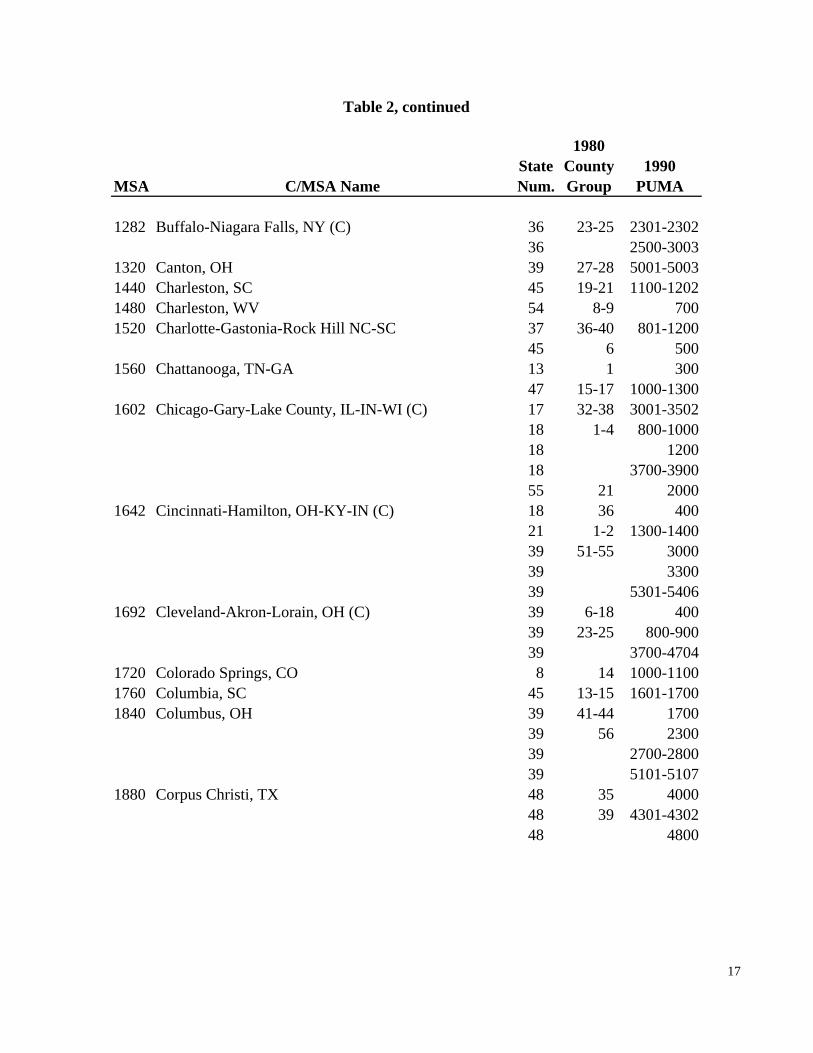
Table 2, continued
1980State County 1990
MSA C/MSA Name Num. Group PUMA
1282 Buffalo-Niagara Falls, NY (C) 36 23-25 2301-2302 36 2500-3003
1320 Canton, OH 39 27-28 5001-50031440 Charleston, SC 45 19-21 1100-12021480 Charleston, WV 54 8-9 7001520 Charlotte-Gastonia-Rock Hill NC-SC 37 36-40 801-1200
45 6 5001560 Chattanooga, TN-GA 13 1 300
47 15-17 1000-13001602 Chicago-Gary-Lake County, IL-IN-WI (C) 17 32-38 3001-3502
18 1-4 800-100018 120018 3700-390055 21 2000
1642 Cincinnati-Hamilton, OH-KY-IN (C) 18 36 40021 1-2 1300-140039 51-55 300039 330039 5301-5406
1692 Cleveland-Akron-Lorain, OH (C) 39 6-18 40039 23-25 800-90039 3700-4704
1720 Colorado Springs, CO 8 14 1000-11001760 Columbia, SC 45 13-15 1601-17001840 Columbus, OH 39 41-44 1700
39 56 230039 2700-280039 5101-5107
1880 Corpus Christi, TX 48 35 400048 39 4301-430248 4800
17
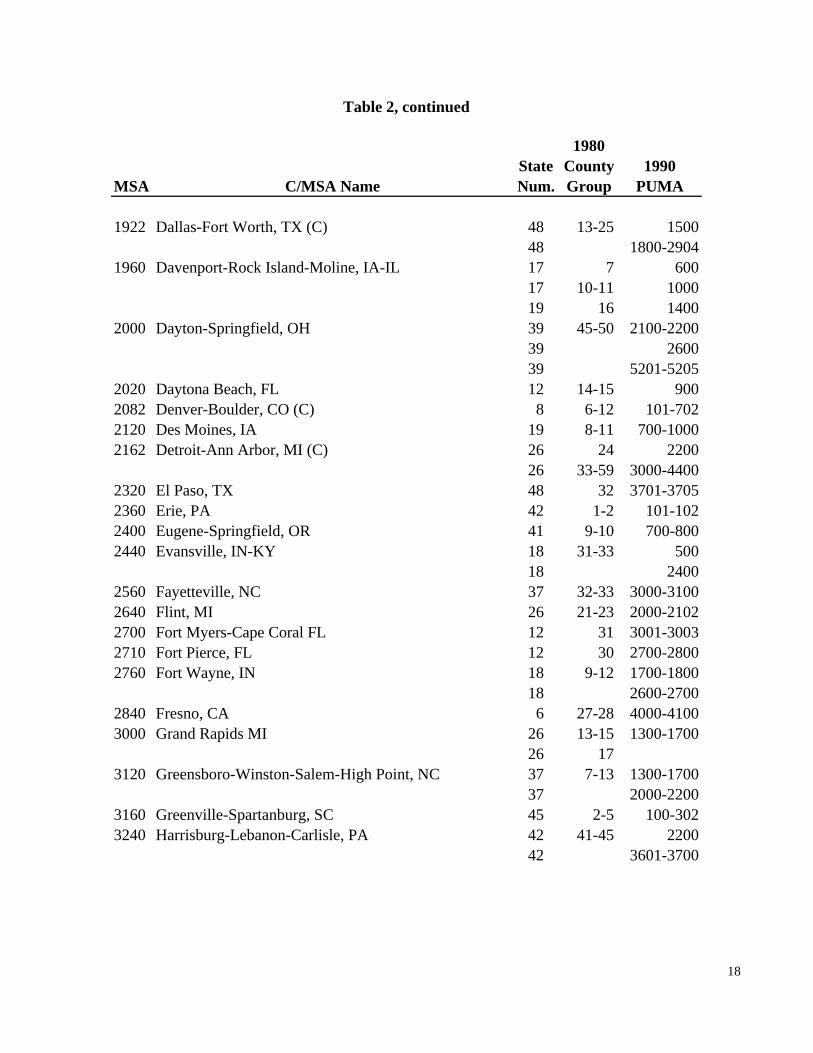
Table 2, continued
1980State County 1990
MSA C/MSA Name Num. Group PUMA
1922 Dallas-Fort Worth, TX (C) 48 13-25 150048 1800-2904
1960 Davenport-Rock Island-Moline, IA-IL 17 7 60017 10-11 100019 16 1400
2000 Dayton-Springfield, OH 39 45-50 2100-220039 260039 5201-5205
2020 Daytona Beach, FL 12 14-15 9002082 Denver-Boulder, CO (C) 8 6-12 101-7022120 Des Moines, IA 19 8-11 700-10002162 Detroit-Ann Arbor, MI (C) 26 24 2200
26 33-59 3000-44002320 El Paso, TX 48 32 3701-37052360 Erie, PA 42 1-2 101-1022400 Eugene-Springfield, OR 41 9-10 700-8002440 Evansville, IN-KY 18 31-33 500
18 24002560 Fayetteville, NC 37 32-33 3000-31002640 Flint, MI 26 21-23 2000-21022700 Fort Myers-Cape Coral FL 12 31 3001-30032710 Fort Pierce, FL 12 30 2700-28002760 Fort Wayne, IN 18 9-12 1700-1800
18 2600-27002840 Fresno, CA 6 27-28 4000-41003000 Grand Rapids MI 26 13-15 1300-1700
26 173120 Greensboro-Winston-Salem-High Point, NC 37 7-13 1300-1700
37 2000-22003160 Greenville-Spartanburg, SC 45 2-5 100-3023240 Harrisburg-Lebanon-Carlisle, PA 42 41-45 2200
42 3601-3700
18
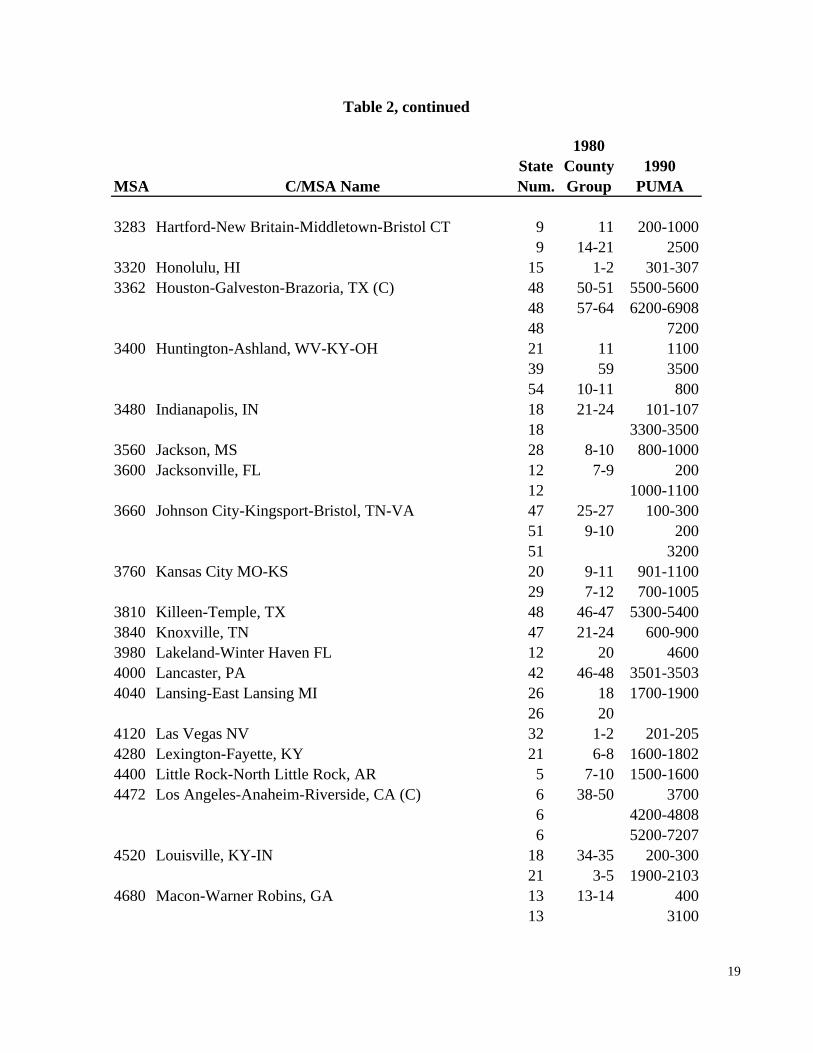
Table 2, continued
1980State County 1990
MSA C/MSA Name Num. Group PUMA
3283 Hartford-New Britain-Middletown-Bristol CT 9 11 200-1000 9 14-21 2500
3320 Honolulu, HI 15 1-2 301-3073362 Houston-Galveston-Brazoria, TX (C) 48 50-51 5500-5600
48 57-64 6200-690848 7200
3400 Huntington-Ashland, WV-KY-OH 21 11 110039 59 350054 10-11 800
3480 Indianapolis, IN 18 21-24 101-10718 3300-3500
3560 Jackson, MS 28 8-10 800-10003600 Jacksonville, FL 12 7-9 200
12 1000-11003660 Johnson City-Kingsport-Bristol, TN-VA 47 25-27 100-300
51 9-10 20051 3200
3760 Kansas City MO-KS 20 9-11 901-110029 7-12 700-1005
3810 Killeen-Temple, TX 48 46-47 5300-54003840 Knoxville, TN 47 21-24 600-9003980 Lakeland-Winter Haven FL 12 20 46004000 Lancaster, PA 42 46-48 3501-35034040 Lansing-East Lansing MI 26 18 1700-1900
26 204120 Las Vegas NV 32 1-2 201-2054280 Lexington-Fayette, KY 21 6-8 1600-18024400 Little Rock-North Little Rock, AR 5 7-10 1500-16004472 Los Angeles-Anaheim-Riverside, CA (C) 6 38-50 3700
6 4200-48086 5200-7207
4520 Louisville, KY-IN 18 34-35 200-30021 3-5 1900-2103
4680 Macon-Warner Robins, GA 13 13-14 40013 3100
19
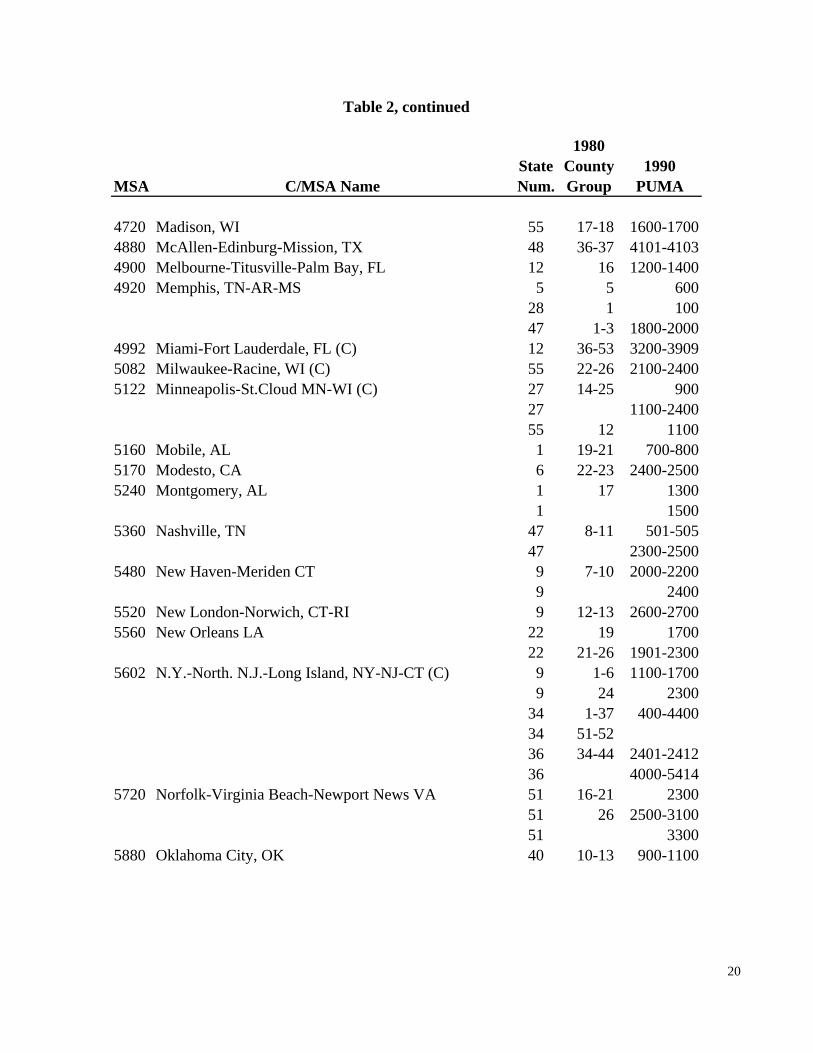
Table 2, continued
1980State County 1990
MSA C/MSA Name Num. Group PUMA
4720 Madison, WI 55 17-18 1600-17004880 McAllen-Edinburg-Mission, TX 48 36-37 4101-41034900 Melbourne-Titusville-Palm Bay, FL 12 16 1200-14004920 Memphis, TN-AR-MS 5 5 600
28 1 10047 1-3 1800-2000
4992 Miami-Fort Lauderdale, FL (C) 12 36-53 3200-39095082 Milwaukee-Racine, WI (C) 55 22-26 2100-24005122 Minneapolis-St.Cloud MN-WI (C) 27 14-25 900
27 1100-240055 12 1100
5160 Mobile, AL 1 19-21 700-8005170 Modesto, CA 6 22-23 2400-25005240 Montgomery, AL 1 17 1300
1 15005360 Nashville, TN 47 8-11 501-505
47 2300-25005480 New Haven-Meriden CT 9 7-10 2000-2200
9 24005520 New London-Norwich, CT-RI 9 12-13 2600-27005560 New Orleans LA 22 19 1700
22 21-26 1901-23005602 N.Y.-North. N.J.-Long Island, NY-NJ-CT (C) 9 1-6 1100-1700
9 24 230034 1-37 400-440034 51-5236 34-44 2401-241236 4000-5414
5720 Norfolk-Virginia Beach-Newport News VA 51 16-21 230051 26 2500-310051 3300
5880 Oklahoma City, OK 40 10-13 900-1100
20
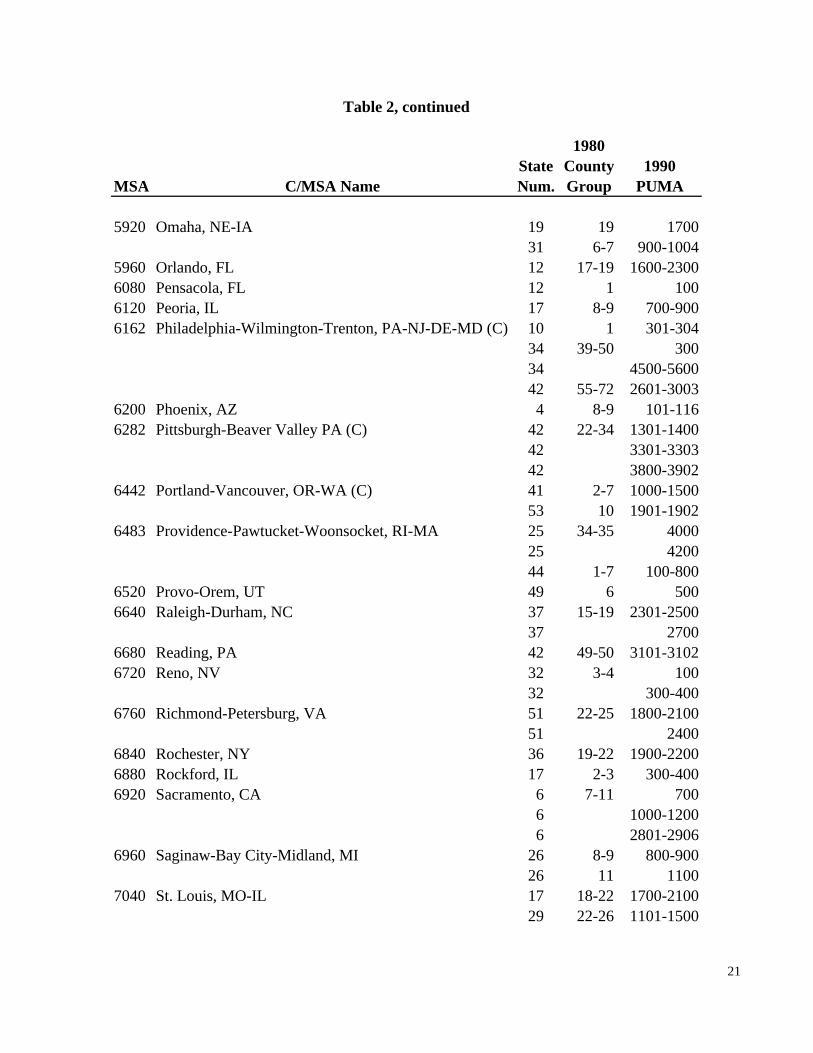
Table 2, continued
1980State County 1990
MSA C/MSA Name Num. Group PUMA
5920 Omaha, NE-IA 19 19 170031 6-7 900-1004
5960 Orlando, FL 12 17-19 1600-23006080 Pensacola, FL 12 1 1006120 Peoria, IL 17 8-9 700-9006162 Philadelphia-Wilmington-Trenton, PA-NJ-DE-MD (C) 10 1 301-304
34 39-50 30034 4500-560042 55-72 2601-3003
6200 Phoenix, AZ 4 8-9 101-1166282 Pittsburgh-Beaver Valley PA (C) 42 22-34 1301-1400
42 3301-330342 3800-3902
6442 Portland-Vancouver, OR-WA (C) 41 2-7 1000-150053 10 1901-1902
6483 Providence-Pawtucket-Woonsocket, RI-MA 25 34-35 400025 420044 1-7 100-800
6520 Provo-Orem, UT 49 6 5006640 Raleigh-Durham, NC 37 15-19 2301-2500
37 27006680 Reading, PA 42 49-50 3101-31026720 Reno, NV 32 3-4 100
32 300-4006760 Richmond-Petersburg, VA 51 22-25 1800-2100
51 24006840 Rochester, NY 36 19-22 1900-22006880 Rockford, IL 17 2-3 300-4006920 Sacramento, CA 6 7-11 700
6 1000-12006 2801-2906
6960 Saginaw-Bay City-Midland, MI 26 8-9 800-90026 11 1100
7040 St. Louis, MO-IL 17 18-22 1700-210029 22-26 1101-1500
21
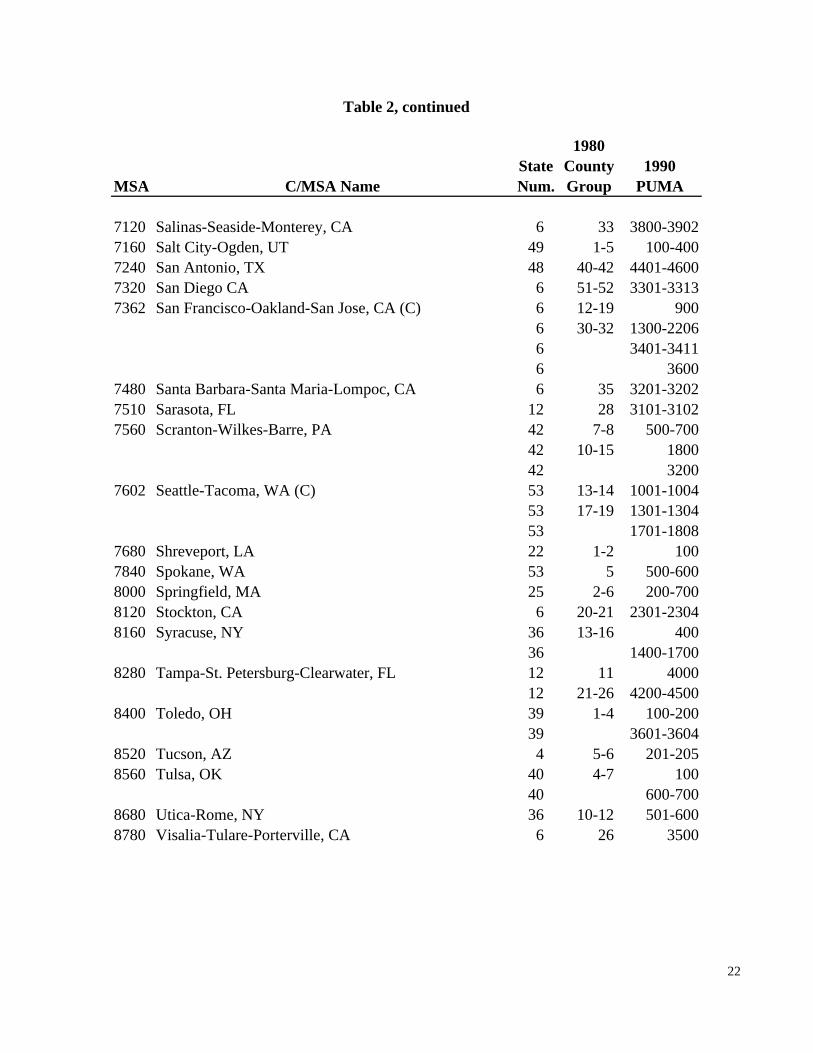
Table 2, continued
1980State County 1990
MSA C/MSA Name Num. Group PUMA
7120 Salinas-Seaside-Monterey, CA 6 33 3800-39027160 Salt City-Ogden, UT 49 1-5 100-4007240 San Antonio, TX 48 40-42 4401-46007320 San Diego CA 6 51-52 3301-33137362 San Francisco-Oakland-San Jose, CA (C) 6 12-19 900
6 30-32 1300-22066 3401-3411
6 36007480 Santa Barbara-Santa Maria-Lompoc, CA 6 35 3201-32027510 Sarasota, FL 12 28 3101-31027560 Scranton-Wilkes-Barre, PA 42 7-8 500-700
42 10-15 1800 42 3200
7602 Seattle-Tacoma, WA (C) 53 13-14 1001-100453 17-19 1301-1304
53 1701-18087680 Shreveport, LA 22 1-2 1007840 Spokane, WA 53 5 500-6008000 Springfield, MA 25 2-6 200-7008120 Stockton, CA 6 20-21 2301-23048160 Syracuse, NY 36 13-16 400
36 1400-17008280 Tampa-St. Petersburg-Clearwater, FL 12 11 4000
12 21-26 4200-45008400 Toledo, OH 39 1-4 100-200
39 3601-36048520 Tucson, AZ 4 5-6 201-2058560 Tulsa, OK 40 4-7 100
40 600-7008680 Utica-Rome, NY 36 10-12 501-6008780 Visalia-Tulare-Porterville, CA 6 26 3500
22
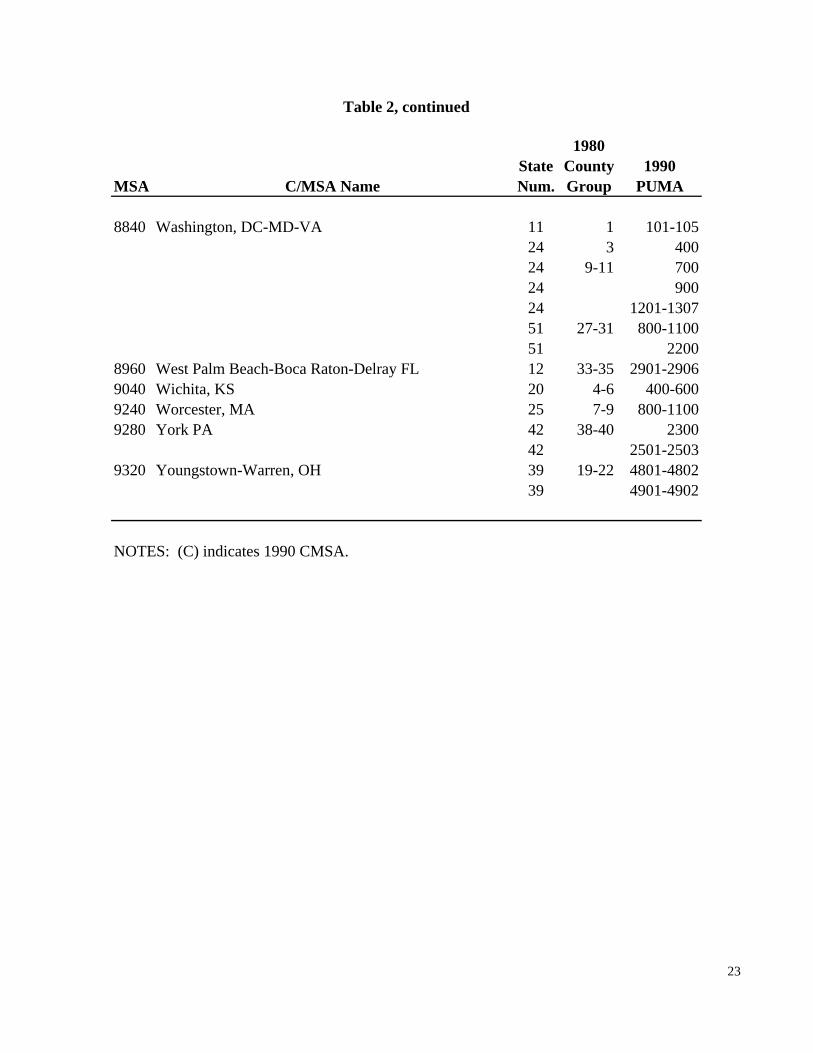
Table 2, continued
1980State County 1990
MSA C/MSA Name Num. Group PUMA
8840 Washington, DC-MD-VA 11 1 101-10524 3 40024 9-11 70024 90024 1201-130751 27-31 800-110051 2200
8960 West Palm Beach-Boca Raton-Delray FL 12 33-35 2901-29069040 Wichita, KS 20 4-6 400-6009240 Worcester, MA 25 7-9 800-11009280 York PA 42 38-40 2300
42 2501-25039320 Youngstown-Warren, OH 39 19-22 4801-4802
39 4901-4902
NOTES: (C) indicates 1990 CMSA.
23
90 Def./ 19901990 Cen.Bur. 90 Def./ Metro.
C/MSA C/MSA Name Definition Def. 80 Def. Share
0160 Albany-Schenectady-Troy, NY 885,305 1.01 1.00 0.930200 Albuquerque, NM 480,577 1.00 1.00 1.000240 Allentown-Bethlehem, PA-NJ 785,324 1.14 1.00 1.000460 Appleton-Oshkosh-Neenah, WI 315,121 1.00 1.00 1.000520 Atlanta, GA 2,908,797 1.03 1.00 0.910560 Atlantic City, NJ 224,327 0.70 1.00 1.000600 Augusta, GA-SC 505,820 1.28 1.00 0.780640 Austin, TX 902,122 1.15 1.00 0.870680 Bakersfield, CA 543,477 1.00 1.00 1.000720 Baltimore, MD 2,528,944 1.06 1.00 0.970760 Baton Rouge, LA 622,666 1.18 1.00 0.850840 Beaumont-Port Arthur, TX 361,226 1.00 1.00 1.000960 Binghampton, NY 407,557 1.54 1.00 0.651000 Birmingham, AL 800,892 0.88 1.00 1.001123 Boston-Lawrence-Salem-Lowell-Brockton, MA 3,966,688 0.95 0.97 0.991240 Brownsville-Harlingen, TX 260,120 1.00 1.00 1.001282 Buffalo-Niagara Falls, NY(C) 1,189,288 1.00 1.00 1.001320 Canton, OH 367,585 0.93 1.00 1.001440 Charleston, SC 506,875 1.00 1.00 1.001480 Charleston, WV 286,307 1.14 1.00 0.881520 Charlotte-Gastonia-Rock Hill NC-SC 1,306,789 1.13 1.00 0.891560 Chattanooga, TN-GA 502,261 1.16 1.00 0.861602 Chicago-Gary-Lake County, IL-IN-WI (C) 8,026,220 1.00 1.00 1.001642 Cincinnati-Hamilton, OH-KY-IN (C) 1,863,083 1.07 1.00 0.941692 Cleveland-Akron-Lorain, OH (C) 2,859,644 1.04 1.00 0.971720 Colorado Springs, CO 397,014 1.00 1.00 1.001760 Columbia, SC 453,331 1.00 1.00 1.001840 Columbus, OH 1,446,749 1.05 1.02 0.951880 Corpus Christi, TX 518,510 1.48 1.00 0.681922 Dallas-Fort Worth, TX (C) 3,949,073 1.02 1.00 0.981960 Davenport-Rock Island-Moline, IA-IL 373,881 1.07 0.95 0.862000 Dayton-Springfield, OH 1,045,002 1.10 0.98 0.912020 Daytona Beach, FL 370,712 1.00 1.00 1.002082 Denver-Boulder, CO (C) 1,787,928 0.97 1.00 1.002120 Des Moines, IA 569,645 1.45 1.00 0.692162 Detroit-Ann Arbor, MI (C) 4,735,006 1.02 1.00 0.992320 El Paso, TX 591,610 1.00 1.00 1.00
Table 3: Population and Relative Population of Metropolitan Areas Using1980 and 1990 Definitions
Population
23
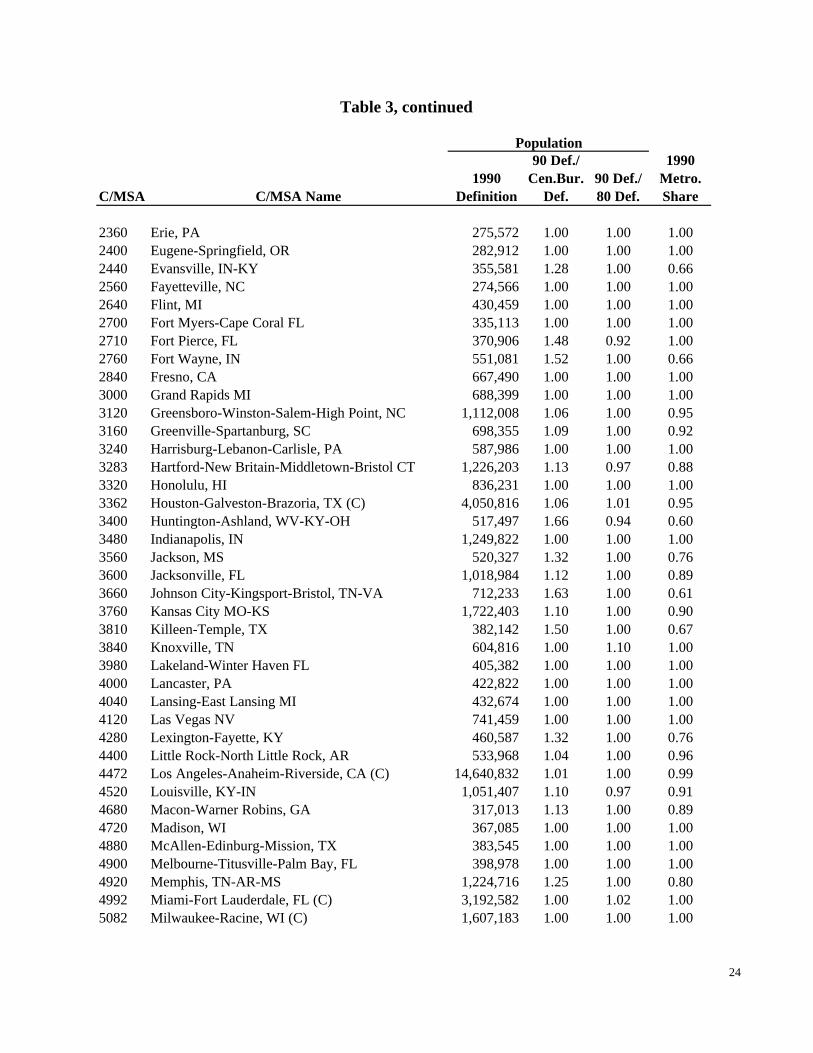
Table 3, continued
90 Def./ 19901990 Cen.Bur. 90 Def./ Metro.
C/MSA C/MSA Name Definition Def. 80 Def. Share
Population
2360 Erie, PA 275,572 1.00 1.00 1.002400 Eugene-Springfield, OR 282,912 1.00 1.00 1.002440 Evansville, IN-KY 355,581 1.28 1.00 0.662560 Fayetteville, NC 274,566 1.00 1.00 1.002640 Flint, MI 430,459 1.00 1.00 1.002700 Fort Myers-Cape Coral FL 335,113 1.00 1.00 1.002710 Fort Pierce, FL 370,906 1.48 0.92 1.002760 Fort Wayne, IN 551,081 1.52 1.00 0.662840 Fresno, CA 667,490 1.00 1.00 1.003000 Grand Rapids MI 688,399 1.00 1.00 1.003120 Greensboro-Winston-Salem-High Point, NC 1,112,008 1.06 1.00 0.953160 Greenville-Spartanburg, SC 698,355 1.09 1.00 0.923240 Harrisburg-Lebanon-Carlisle, PA 587,986 1.00 1.00 1.003283 Hartford-New Britain-Middletown-Bristol CT 1,226,203 1.13 0.97 0.883320 Honolulu, HI 836,231 1.00 1.00 1.003362 Houston-Galveston-Brazoria, TX (C) 4,050,816 1.06 1.01 0.953400 Huntington-Ashland, WV-KY-OH 517,497 1.66 0.94 0.603480 Indianapolis, IN 1,249,822 1.00 1.00 1.003560 Jackson, MS 520,327 1.32 1.00 0.763600 Jacksonville, FL 1,018,984 1.12 1.00 0.893660 Johnson City-Kingsport-Bristol, TN-VA 712,233 1.63 1.00 0.613760 Kansas City MO-KS 1,722,403 1.10 1.00 0.903810 Killeen-Temple, TX 382,142 1.50 1.00 0.673840 Knoxville, TN 604,816 1.00 1.10 1.003980 Lakeland-Winter Haven FL 405,382 1.00 1.00 1.004000 Lancaster, PA 422,822 1.00 1.00 1.004040 Lansing-East Lansing MI 432,674 1.00 1.00 1.004120 Las Vegas NV 741,459 1.00 1.00 1.004280 Lexington-Fayette, KY 460,587 1.32 1.00 0.764400 Little Rock-North Little Rock, AR 533,968 1.04 1.00 0.964472 Los Angeles-Anaheim-Riverside, CA (C) 14,640,832 1.01 1.00 0.994520 Louisville, KY-IN 1,051,407 1.10 0.97 0.914680 Macon-Warner Robins, GA 317,013 1.13 1.00 0.894720 Madison, WI 367,085 1.00 1.00 1.004880 McAllen-Edinburg-Mission, TX 383,545 1.00 1.00 1.004900 Melbourne-Titusville-Palm Bay, FL 398,978 1.00 1.00 1.004920 Memphis, TN-AR-MS 1,224,716 1.25 1.00 0.804992 Miami-Fort Lauderdale, FL (C) 3,192,582 1.00 1.02 1.005082 Milwaukee-Racine, WI (C) 1,607,183 1.00 1.00 1.00
24
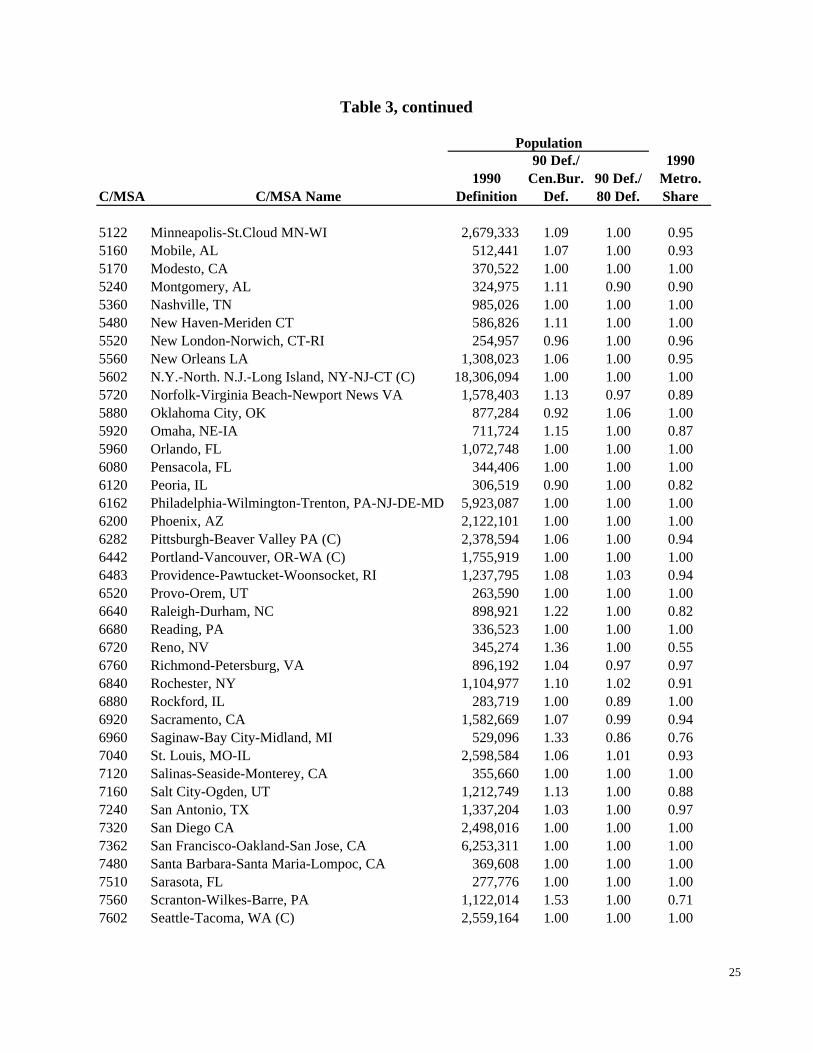
Table 3, continued
90 Def./ 19901990 Cen.Bur. 90 Def./ Metro.
C/MSA C/MSA Name Definition Def. 80 Def. Share
Population
5122 Minneapolis-St.Cloud MN-WI 2,679,333 1.09 1.00 0.955160 Mobile, AL 512,441 1.07 1.00 0.935170 Modesto, CA 370,522 1.00 1.00 1.005240 Montgomery, AL 324,975 1.11 0.90 0.905360 Nashville, TN 985,026 1.00 1.00 1.005480 New Haven-Meriden CT 586,826 1.11 1.00 1.005520 New London-Norwich, CT-RI 254,957 0.96 1.00 0.965560 New Orleans LA 1,308,023 1.06 1.00 0.955602 N.Y.-North. N.J.-Long Island, NY-NJ-CT (C) 18,306,094 1.00 1.00 1.005720 Norfolk-Virginia Beach-Newport News VA 1,578,403 1.13 0.97 0.895880 Oklahoma City, OK 877,284 0.92 1.06 1.005920 Omaha, NE-IA 711,724 1.15 1.00 0.875960 Orlando, FL 1,072,748 1.00 1.00 1.006080 Pensacola, FL 344,406 1.00 1.00 1.006120 Peoria, IL 306,519 0.90 1.00 0.826162 Philadelphia-Wilmington-Trenton, PA-NJ-DE-MD 5,923,087 1.00 1.00 1.006200 Phoenix, AZ 2,122,101 1.00 1.00 1.006282 Pittsburgh-Beaver Valley PA (C) 2,378,594 1.06 1.00 0.946442 Portland-Vancouver, OR-WA (C) 1,755,919 1.00 1.00 1.006483 Providence-Pawtucket-Woonsocket, RI 1,237,795 1.08 1.03 0.946520 Provo-Orem, UT 263,590 1.00 1.00 1.006640 Raleigh-Durham, NC 898,921 1.22 1.00 0.826680 Reading, PA 336,523 1.00 1.00 1.006720 Reno, NV 345,274 1.36 1.00 0.556760 Richmond-Petersburg, VA 896,192 1.04 0.97 0.976840 Rochester, NY 1,104,977 1.10 1.02 0.916880 Rockford, IL 283,719 1.00 0.89 1.006920 Sacramento, CA 1,582,669 1.07 0.99 0.946960 Saginaw-Bay City-Midland, MI 529,096 1.33 0.86 0.767040 St. Louis, MO-IL 2,598,584 1.06 1.01 0.937120 Salinas-Seaside-Monterey, CA 355,660 1.00 1.00 1.007160 Salt City-Ogden, UT 1,212,749 1.13 1.00 0.887240 San Antonio, TX 1,337,204 1.03 1.00 0.977320 San Diego CA 2,498,016 1.00 1.00 1.007362 San Francisco-Oakland-San Jose, CA 6,253,311 1.00 1.00 1.007480 Santa Barbara-Santa Maria-Lompoc, CA 369,608 1.00 1.00 1.007510 Sarasota, FL 277,776 1.00 1.00 1.007560 Scranton-Wilkes-Barre, PA 1,122,014 1.53 1.00 0.717602 Seattle-Tacoma, WA (C) 2,559,164 1.00 1.00 1.00
25

Table 3, continued
90 Def./ 19901990 Cen.Bur. 90 Def./ Metro.
C/MSA C/MSA Name Definition Def. 80 Def. Share
Population
7680 Shreveport, LA 334,341 1.00 1.00 1.007840 Spokane, WA 361,364 1.00 1.00 1.008000 Springfield, MA 672,970 1.27 1.00 0.798120 Stockton, CA 480,628 1.00 1.00 1.008160 Syracuse, NY 711,632 1.08 1.00 0.938280 Tampa-St. Petersburg-Clearwater, FL 2,218,974 1.07 1.00 0.938400 Toledo, OH 680,192 1.11 1.09 0.908520 Tucson, AZ 666,874 1.00 1.00 1.008560 Tulsa, OK 811,126 1.14 1.04 0.808680 Utica-Rome, NY 370,824 1.17 1.00 0.858780 Visalia-Tulare-Porterville, CA 311,921 1.00 1.00 1.008840 Washington, DC-MD-VA 4,108,722 1.05 1.00 0.968960 West Palm Beach-Boca Raton-Delray FL 863,518 1.00 1.00 1.009040 Wichita, KS 684,188 1.41 1.00 0.719240 Worcester, MA 482,436 1.10 1.00 0.929280 York, PA 538,930 1.29 1.00 0.789320 Youngstown-Warren, OH 492,619 1.00 1.00 1.00
NOTES: See text for description of column headings.
26
1970 19801970 Counties/ Cnty 1980 County County 1990
Other Counties Num Pop. Group Group PUMA
Alabama
1 Birmingham Jefferson 01:073 617,324 4101 009, 010 01801-01806Walker 01:127 68,660 4101 008 00200Shelby 01:117 66,298 4101 011 01700
St Clair 01:115 41,205 011 01700Blount 01:009 36,459 008Franklin* 01:059 28,350 00200Winston* 01:133 21,953 00200
*these two counties are included with 3 other counties in 1980No Match: 1980 has 10.32% more than 1970 and 1990 has 12.16% more than 1970
2 Mobile Mobile 01:097 364,980 12201 019, 020 00700Baldwin 01:003 78,556 12201 021 00800
Escambia 01:053 38,440 021 00800
1980 and 1990 match with 8.67% more than 1970
Arkansas
3 Little Rock Saline 05:125 53,161 10401 010 01500N. Little Rock Pulaski 05:119 340,613 10401 008, 009, 01500
010
Arizona
4 Phoenix Maricopa 04:013 1,509,052 14101 008, 009 00101-00116
5 Tuscon Pima 04:019 513,443 14102 005, 006 00201-00205
California
6 Anaheim Orange 06:059 1,932,709 14302 043, 044, 04200, 04300, 04400,Santa Ana 045, 046 04500, 04600, 04700,Garden Grove 04801-04808
7 Bakersfield Kern 06:029 403,089 14303 036, 037 04900, 05001-05002
8 Fresno Fresno 06:019 514,621 14304 027, 028 04000,04100
9 Los Angeles Los Angeles 06:037 7,477,503 14301 040, 041, 05200, 05300, 05400,Long Beach 042 05500,05600, 05700,
05800, 05900, 06000,06100 06200, 06300,
06401-06424, 06501-06521, 06600
10 Oxnard Ventura 06:111 529,174 14305 038, 039 06701-06705Ventura
11 Sacramento Yolo 06:113 113,374 14501 011 01000Sacramento 06:067 783,381 14501 008, 009 02801, 02802, 02803
02901-02906Placer 06:061 117,247 14501 010 01100
Table 4: 1970-1980-1990 Matches Based on 1970 MSA Definitions
MSA
27
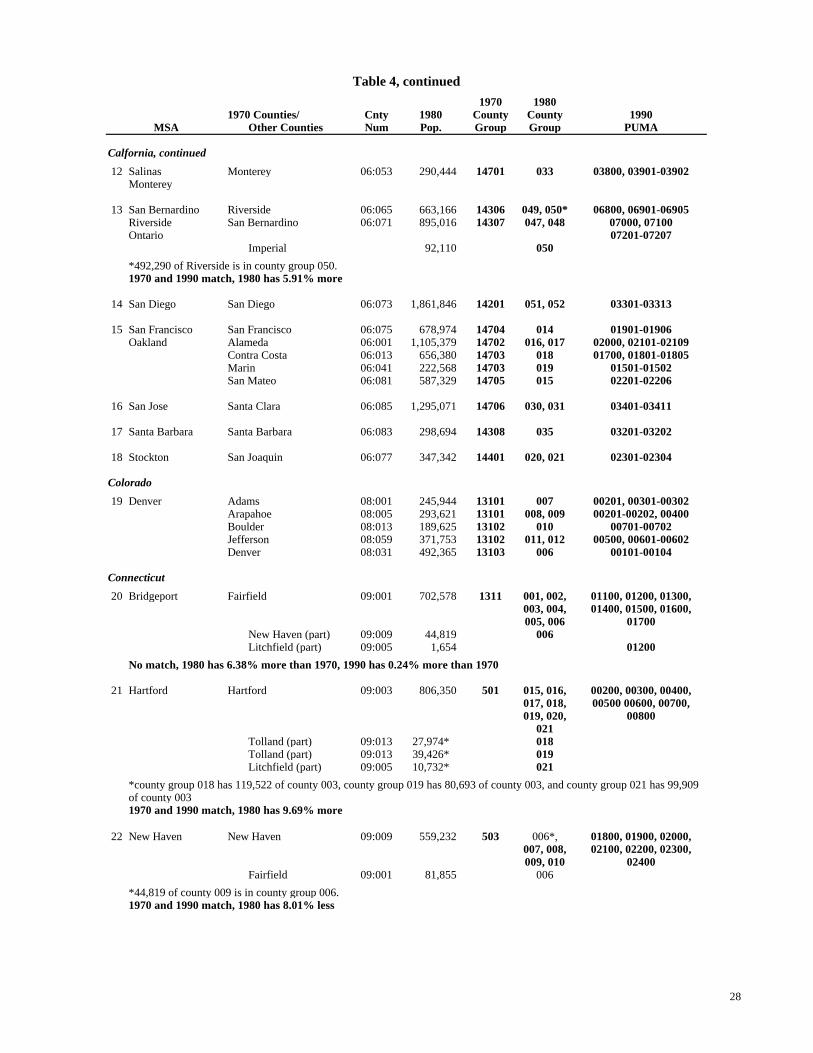
Table 4, continued
1970 19801970 Counties/ Cnty 1980 County County 1990
Other Counties Num Pop. Group Group PUMAMSA
Calfornia, continued
12 Salinas Monterey 06:053 290,444 14701 033 03800, 03901-03902Monterey
13 San Bernardino Riverside 06:065 663,166 14306 049, 050* 06800, 06901-06905Riverside San Bernardino 06:071 895,016 14307 047, 048 07000, 07100Ontario 07201-07207
Imperial 92,110 050
*492,290 of Riverside is in county group 050.1970 and 1990 match, 1980 has 5.91% more
14 San Diego San Diego 06:073 1,861,846 14201 051, 052 03301-03313
15 San Francisco San Francisco 06:075 678,974 14704 014 01901-01906Oakland Alameda 06:001 1,105,379 14702 016, 017 02000, 02101-02109
Contra Costa 06:013 656,380 14703 018 01700, 01801-01805Marin 06:041 222,568 14703 019 01501-01502San Mateo 06:081 587,329 14705 015 02201-02206
16 San Jose Santa Clara 06:085 1,295,071 14706 030, 031 03401-03411
17 Santa Barbara Santa Barbara 06:083 298,694 14308 035 03201-03202
18 Stockton San Joaquin 06:077 347,342 14401 020, 021 02301-02304
Colorado
19 Denver Adams 08:001 245,944 13101 007 00201, 00301-00302Arapahoe 08:005 293,621 13101 008, 009 00201-00202, 00400Boulder 08:013 189,625 13102 010 00701-00702Jefferson 08:059 371,753 13102 011, 012 00500, 00601-00602Denver 08:031 492,365 13103 006 00101-00104
Connecticut
20 Bridgeport Fairfield 09:001 702,578 1311 001, 002, 01100, 01200, 01300,003, 004, 01400, 01500, 01600,005, 006 01700
New Haven (part) 09:009 44,819 006Litchfield (part) 09:005 1,654 01200
No match, 1980 has 6.38% more than 1970, 1990 has 0.24% more than 1970
21 Hartford Hartford 09:003 806,350 501 015, 016, 00200, 00300, 00400,017, 018, 00500 00600, 00700,019, 020, 00800
021Tolland (part) 09:013 27,974* 018Tolland (part) 09:013 39,426* 019Litchfield (part) 09:005 10,732* 021
*county group 018 has 119,522 of county 003, county group 019 has 80,693 of county 003, and county group 021 has 99,909of county 0031970 and 1990 match, 1980 has 9.69% more
22 New Haven New Haven 09:009 559,232 503 006*, 01800, 01900, 02000,007, 008, 02100, 02200, 02300,009, 010 02400
Fairfield 09:001 81,855 006
*44,819 of county 009 is in county group 006.1970 and 1990 match, 1980 has 8.01% less
28

Table 4, continued
1970 19801970 Counties/ Cnty 1980 County County 1990
Other Counties Num Pop. Group Group PUMAMSA
Delaware
23 Wilmington Cecil, MD 24:015 60,430 1411 24:012 24:00500New Castle, DE 10:003 398,115 1411 10:001 10:00301-00304Salem, NJ 34:033 64,676 1411 34:039 34:00300
Caroline, MD 24:011 23,143 24:012 24:00500Kent 24:029 16,695 24:012 24:00500Queen Anne's 24:035 25,508 24:012 24:00500Talbot 24:041 25,604 24:012 24:00500Cape May, NJ 34:009 82,266 34:039 34:00300
1980 and 1990 match with 23.91% less than 1970
District of Columbia
24 Washington, DC DC 11:001 638,333 1604 11:001 00101-00105Montgomery, MD 24:031 579,053 1605 24:009 01201-01206Prince George,s, MD 24:033 665,071 1606 24:010 01301-01307Alexandia City, VA 51:510 103,217 1607 51:030 01000Arlington, VA 51:013 152,599 1607 51:029 00800Fairfax City, VA 51:600 19,390 1608 51:031 01100Falls Church City, VA 51:610 9,515 1608 51:031 01100Fairfax, VA 51:059 596,901 1608 51:031 01100Laudon, VA 51:107 57,427 1608 51:028 00900Prince William, VA 51:153 144,703 1608 51:028 00900
Manassas City, VA 51:683 15,438 * 51:028 00900Manasses Park City,VA 51:685 6,524 * 51:028 00900
*these two counties may be included in the 1970 county groups here. they do not appear individually on the 1970 map.
Florida
25 Fort Lauderdale Broward 12:011 1,018,200 3301 036, 037, 03200, 03300, 03400Hollywood 038, 039, 03501-03506
040, 041,042
26 Jacksonville Duval 12:031 571,003 3101 007 01000
27 Miami Dade 12:025 1,625,802 3302 043, 044, 03601-03602,045, 046, 370003800047, 048,049, 050, 03901-03909051, 052,
053*Monroe 12:087 63,188 053* 02400Collier 12:021 85,971 02400
*county group 053 contains 149,677 of county 025.1970 and 1990 match. 1980 has 3.89% more
28 Orlando Seminole 12:117 179,752 3201 019 02200, 02300Orange 12:095 471,016 3201 017, 018 01600, 01700, 01800
01900, 02000Osceola 12:097 49,287 3202 019 02100Brevard 12:009 272,959 3202
1970 and 1990 match. 1980 has 7.57% more
29 Tampa Hillsborough 12:057 646,960 3303 022, 023 04500St. Petersburg Pinellas 12:103 728,531 3304 024, 025, 04400
026
30 West Palm Beach Palm Beach 12:099 576,863 3305 033, 034, 02901-02906035
29
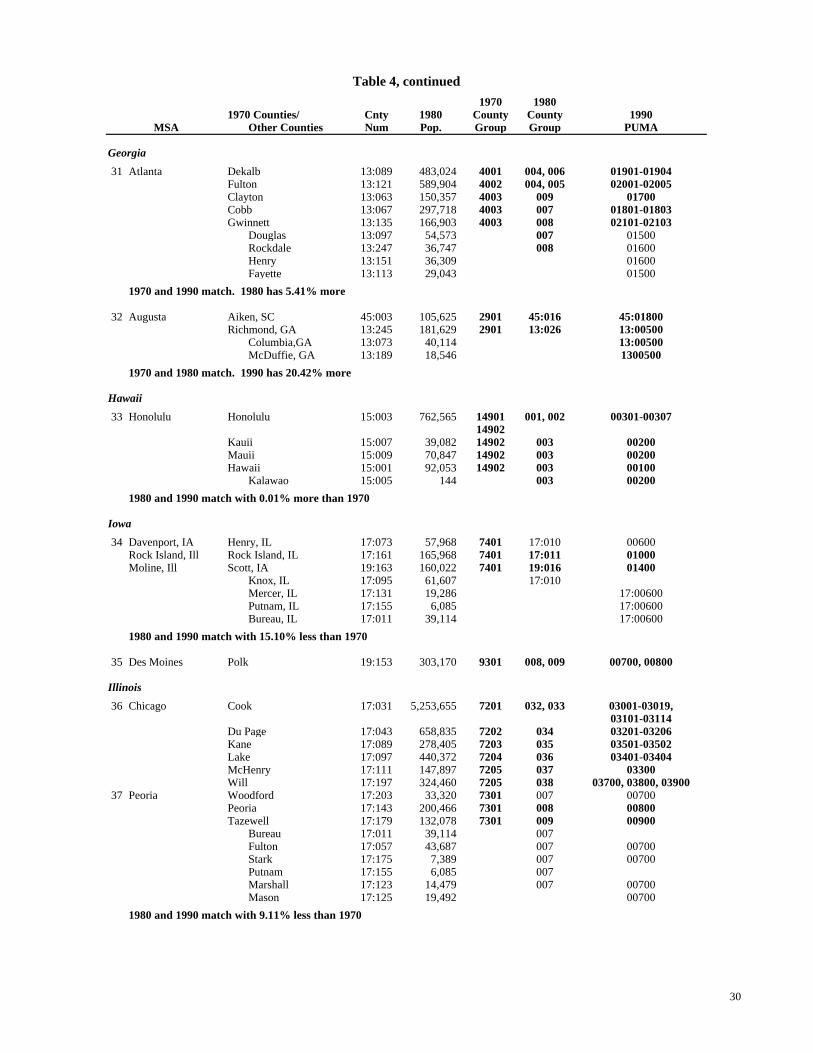
Table 4, continued
1970 19801970 Counties/ Cnty 1980 County County 1990
Other Counties Num Pop. Group Group PUMAMSA
Georgia
31 Atlanta Dekalb 13:089 483,024 4001 004, 006 01901-01904Fulton 13:121 589,904 4002 004, 005 02001-02005Clayton 13:063 150,357 4003 009 01700Cobb 13:067 297,718 4003 007 01801-01803Gwinnett 13:135 166,903 4003 008 02101-02103
Douglas 13:097 54,573 007 01500Rockdale 13:247 36,747 008 01600Henry 13:151 36,309 01600Fayette 13:113 29,043 01500
1970 and 1990 match. 1980 has 5.41% more
32 Augusta Aiken, SC 45:003 105,625 2901 45:016 45:01800Richmond, GA 13:245 181,629 2901 13:026 13:00500
Columbia,GA 13:073 40,114 13:00500McDuffie, GA 13:189 18,546 1300500
1970 and 1980 match. 1990 has 20.42% more
Hawaii
33 Honolulu Honolulu 15:003 762,565 14901 001, 002 00301-0030714902
Kauii 15:007 39,082 14902 003 00200Mauii 15:009 70,847 14902 003 00200Hawaii 15:001 92,053 14902 003 00100
Kalawao 15:005 144 003 00200
1980 and 1990 match with 0.01% more than 1970
Iowa
34 Davenport, IA Henry, IL 17:073 57,968 7401 17:010 00600Rock Island, Ill Rock Island, IL 17:161 165,968 7401 17:011 01000Moline, Ill Scott, IA 19:163 160,022 7401 19:016 01400
Knox, IL 17:095 61,607 17:010Mercer, IL 17:131 19,286 17:00600Putnam, IL 17:155 6,085 17:00600Bureau, IL 17:011 39,114 17:00600
1980 and 1990 match with 15.10% less than 1970
35 Des Moines Polk 19:153 303,170 9301 008, 009 00700, 00800
Illinois
36 Chicago Cook 17:031 5,253,655 7201 032, 033 03001-03019,03101-03114
Du Page 17:043 658,835 7202 034 03201-03206Kane 17:089 278,405 7203 035 03501-03502Lake 17:097 440,372 7204 036 03401-03404McHenry 17:111 147,897 7205 037 03300Will 17:197 324,460 7205 038 03700, 03800, 03900
37 Peoria Woodford 17:203 33,320 7301 007 00700Peoria 17:143 200,466 7301 008 00800Tazewell 17:179 132,078 7301 009 00900
Bureau 17:011 39,114 007Fulton 17:057 43,687 007 00700Stark 17:175 7,389 007 00700Putnam 17:155 6,085 007Marshall 17:123 14,479 007 00700Mason 17:125 19,492 00700
1980 and 1990 match with 9.11% less than 1970
30
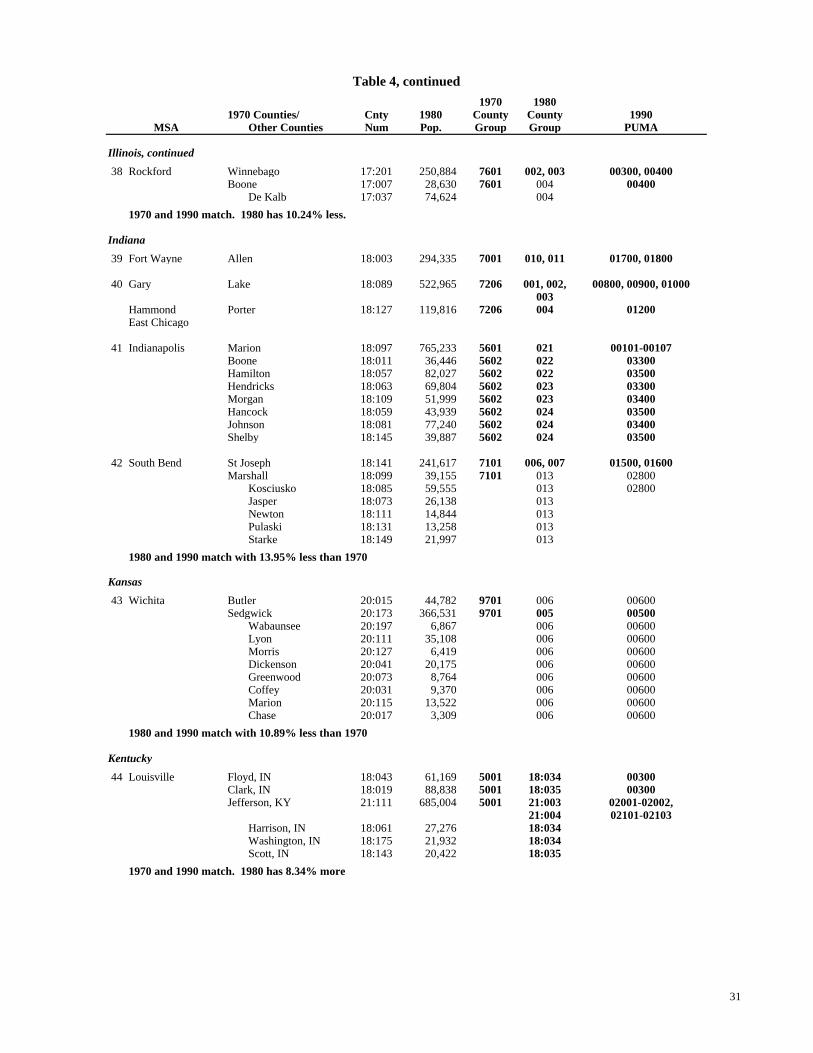
Table 4, continued
1970 19801970 Counties/ Cnty 1980 County County 1990
Other Counties Num Pop. Group Group PUMAMSA
Illinois, continued
38 Rockford Winnebago 17:201 250,884 7601 002, 003 00300, 00400Boone 17:007 28,630 7601 004 00400
De Kalb 17:037 74,624 004
1970 and 1990 match. 1980 has 10.24% less.
Indiana
39 Fort Wayne Allen 18:003 294,335 7001 010, 011 01700, 01800
40 Gary Lake 18:089 522,965 7206 001, 002, 00800, 00900, 01000003
Hammond Porter 18:127 119,816 7206 004 01200East Chicago
41 Indianapolis Marion 18:097 765,233 5601 021 00101-00107Boone 18:011 36,446 5602 022 03300Hamilton 18:057 82,027 5602 022 03500Hendricks 18:063 69,804 5602 023 03300Morgan 18:109 51,999 5602 023 03400Hancock 18:059 43,939 5602 024 03500Johnson 18:081 77,240 5602 024 03400Shelby 18:145 39,887 5602 024 03500
42 South Bend St Joseph 18:141 241,617 7101 006, 007 01500, 01600Marshall 18:099 39,155 7101 013 02800
Kosciusko 18:085 59,555 013 02800Jasper 18:073 26,138 013Newton 18:111 14,844 013Pulaski 18:131 13,258 013Starke 18:149 21,997 013
1980 and 1990 match with 13.95% less than 1970
Kansas
43 Wichita Butler 20:015 44,782 9701 006 00600Sedgwick 20:173 366,531 9701 005 00500
Wabaunsee 20:197 6,867 006 00600Lyon 20:111 35,108 006 00600Morris 20:127 6,419 006 00600Dickenson 20:041 20,175 006 00600Greenwood 20:073 8,764 006 00600Coffey 20:031 9,370 006 00600Marion 20:115 13,522 006 00600Chase 20:017 3,309 006 00600
1980 and 1990 match with 10.89% less than 1970
Kentucky
44 Louisville Floyd, IN 18:043 61,169 5001 18:034 00300Clark, IN 18:019 88,838 5001 18:035 00300Jefferson, KY 21:111 685,004 5001 21:003 02001-02002,
21:004 02101-02103Harrison, IN 18:061 27,276 18:034Washington, IN 18:175 21,932 18:034Scott, IN 18:143 20,422 18:035
1970 and 1990 match. 1980 has 8.34% more
31
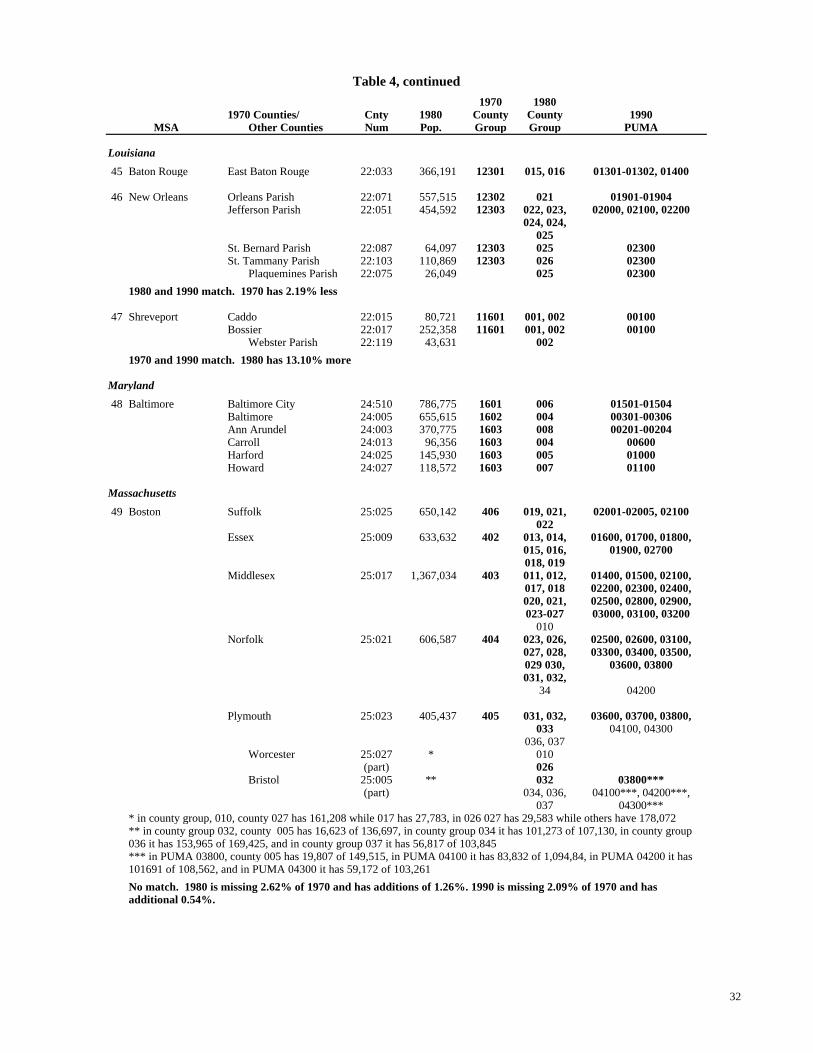
Table 4, continued
1970 19801970 Counties/ Cnty 1980 County County 1990
Other Counties Num Pop. Group Group PUMAMSA
Louisiana
45 Baton Rouge East Baton Rouge 22:033 366,191 12301 015, 016 01301-01302, 01400
46 New Orleans Orleans Parish 22:071 557,515 12302 021 01901-01904Jefferson Parish 22:051 454,592 12303 022, 023, 02000, 02100, 02200
024, 024,025
St. Bernard Parish 22:087 64,097 12303 025 02300St. Tammany Parish 22:103 110,869 12303 026 02300
Plaquemines Parish 22:075 26,049 025 02300
1980 and 1990 match. 1970 has 2.19% less
47 Shreveport Caddo 22:015 80,721 11601 001, 002 00100Bossier 22:017 252,358 11601 001, 002 00100
Webster Parish 22:119 43,631 002
1970 and 1990 match. 1980 has 13.10% more
Maryland
48 Baltimore Baltimore City 24:510 786,775 1601 006 01501-01504Baltimore 24:005 655,615 1602 004 00301-00306Ann Arundel 24:003 370,775 1603 008 00201-00204Carroll 24:013 96,356 1603 004 00600Harford 24:025 145,930 1603 005 01000Howard 24:027 118,572 1603 007 01100
Massachusetts
49 Boston Suffolk 25:025 650,142 406 019, 021, 02001-02005, 02100022
Essex 25:009 633,632 402 013, 014, 01600, 01700, 01800,015, 016, 01900, 02700018, 019
Middlesex 25:017 1,367,034 403 011, 012, 01400, 01500, 02100,017, 018 02200, 02300, 02400,020, 021, 02500, 02800, 02900,023-027 03000, 03100, 03200
010Norfolk 25:021 606,587 404 023, 026, 02500, 02600, 03100,
027, 028, 03300, 03400, 03500,029 030, 03600, 03800031, 032,
34 04200
Plymouth 25:023 405,437 405 031, 032, 03600, 03700, 03800,033 04100, 04300
036, 037Worcester 25:027 * 010
(part) 026Bristol 25:005 ** 032 03800***
(part) 034, 036, 04100***, 04200***,037 04300***
* in county group, 010, county 027 has 161,208 while 017 has 27,783, in 026 027 has 29,583 while others have 178,072** in county group 032, county 005 has 16,623 of 136,697, in county group 034 it has 101,273 of 107,130, in county group036 it has 153,965 of 169,425, and in county group 037 it has 56,817 of 103,845*** in PUMA 03800, county 005 has 19,807 of 149,515, in PUMA 04100 it has 83,832 of 1,094,84, in PUMA 04200 it has101691 of 108,562, and in PUMA 04300 it has 59,172 of 103,261
No match. 1980 is missing 2.62% of 1970 and has additions of 1.26%. 1990 is missing 2.09% of 1970 and hasadditional 0.54%.
32
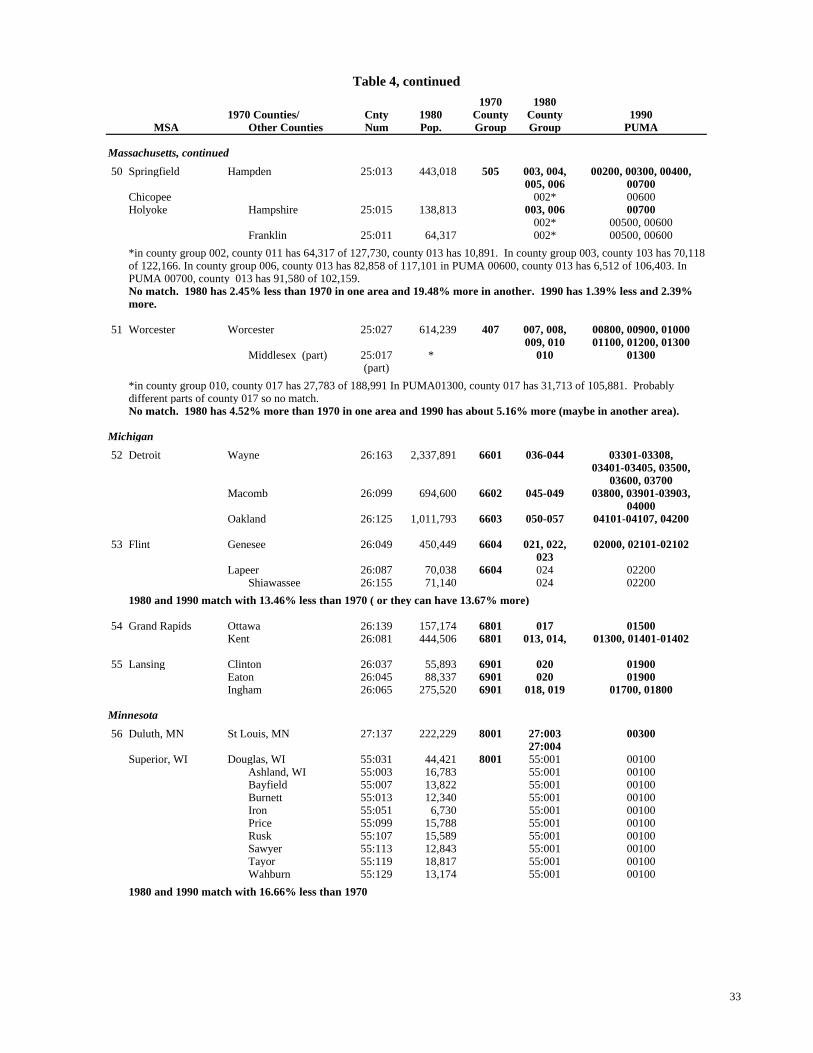
Table 4, continued
1970 19801970 Counties/ Cnty 1980 County County 1990
Other Counties Num Pop. Group Group PUMAMSA
Massachusetts, continued
50 Springfield Hampden 25:013 443,018 505 003, 004, 00200, 00300, 00400,005, 006 00700
Chicopee 002* 00600Holyoke Hampshire 25:015 138,813 003, 006 00700
002* 00500, 00600Franklin 25:011 64,317 002* 00500, 00600
*in county group 002, county 011 has 64,317 of 127,730, county 013 has 10,891. In county group 003, county 103 has 70,118of 122,166. In county group 006, county 013 has 82,858 of 117,101 in PUMA 00600, county 013 has 6,512 of 106,403. In PUMA 00700, county 013 has 91,580 of 102,159.No match. 1980 has 2.45% less than 1970 in one area and 19.48% more in another. 1990 has 1.39% less and 2.39%more.
51 Worcester Worcester 25:027 614,239 407 007, 008, 00800, 00900, 01000009, 010 01100, 01200, 01300
Middlesex (part) 25:017 * 010 01300(part)
*in county group 010, county 017 has 27,783 of 188,991 In PUMA01300, county 017 has 31,713 of 105,881. Probablydifferent parts of county 017 so no match.No match. 1980 has 4.52% more than 1970 in one area and 1990 has about 5.16% more (maybe in another area).
Michigan
52 Detroit Wayne 26:163 2,337,891 6601 036-044 03301-03308,03401-03405, 03500,
03600, 03700Macomb 26:099 694,600 6602 045-049 03800, 03901-03903,
04000Oakland 26:125 1,011,793 6603 050-057 04101-04107, 04200
53 Flint Genesee 26:049 450,449 6604 021, 022, 02000, 02101-02102023
Lapeer 26:087 70,038 6604 024 02200Shiawassee 26:155 71,140 024 02200
1980 and 1990 match with 13.46% less than 1970 ( or they can have 13.67% more)
54 Grand Rapids Ottawa 26:139 157,174 6801 017 01500Kent 26:081 444,506 6801 013, 014, 01300, 01401-01402
55 Lansing Clinton 26:037 55,893 6901 020 01900Eaton 26:045 88,337 6901 020 01900Ingham 26:065 275,520 6901 018, 019 01700, 01800
Minnesota
56 Duluth, MN St Louis, MN 27:137 222,229 8001 27:003 0030027:004
Superior, WI Douglas, WI 55:031 44,421 8001 55:001 00100Ashland, WI 55:003 16,783 55:001 00100Bayfield 55:007 13,822 55:001 00100Burnett 55:013 12,340 55:001 00100Iron 55:051 6,730 55:001 00100Price 55:099 15,788 55:001 00100Rusk 55:107 15,589 55:001 00100Sawyer 55:113 12,843 55:001 00100Tayor 55:119 18,817 55:001 00100Wahburn 55:129 13,174 55:001 00100
1980 and 1990 match with 16.66% less than 1970
33
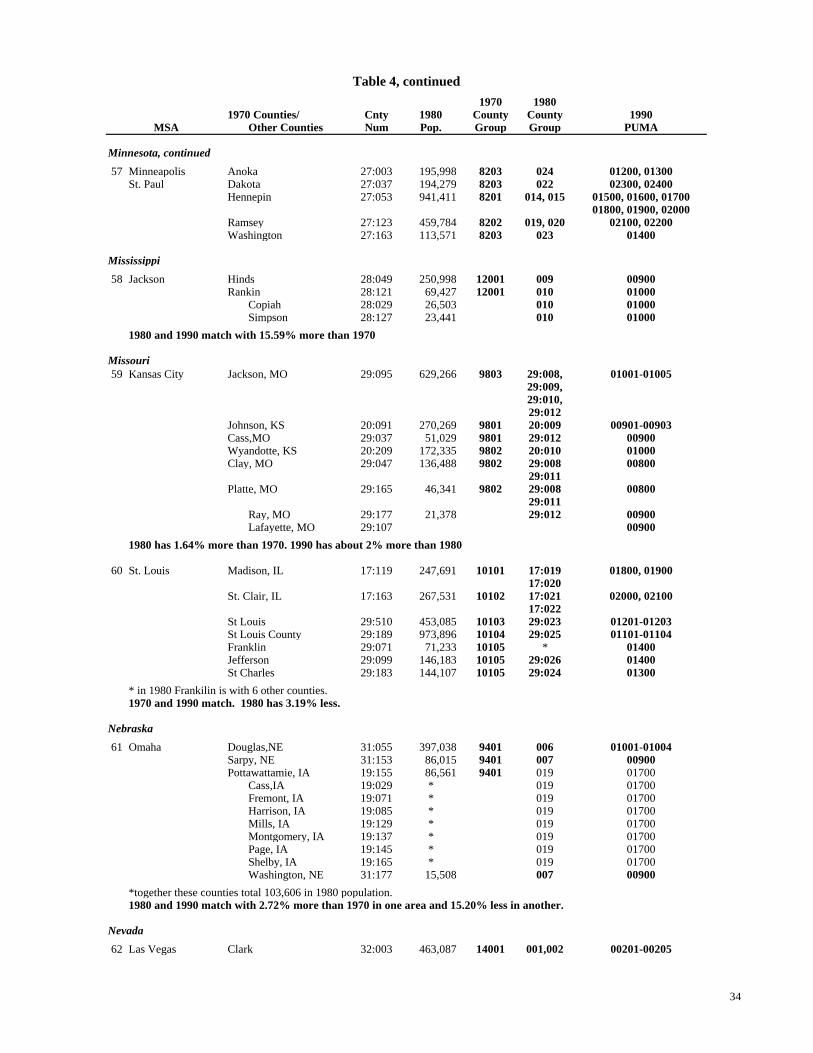
Table 4, continued
1970 19801970 Counties/ Cnty 1980 County County 1990
Other Counties Num Pop. Group Group PUMAMSA
Minnesota, continued
57 Minneapolis Anoka 27:003 195,998 8203 024 01200, 01300St. Paul Dakota 27:037 194,279 8203 022 02300, 02400
Hennepin 27:053 941,411 8201 014, 015 01500, 01600, 0170001800, 01900, 02000
Ramsey 27:123 459,784 8202 019, 020 02100, 02200Washington 27:163 113,571 8203 023 01400
Mississippi
58 Jackson Hinds 28:049 250,998 12001 009 00900Rankin 28:121 69,427 12001 010 01000
Copiah 28:029 26,503 010 01000Simpson 28:127 23,441 010 01000
1980 and 1990 match with 15.59% more than 1970
Missouri59 Kansas City Jackson, MO 29:095 629,266 9803 29:008, 01001-01005
29:009,29:010,29:012
Johnson, KS 20:091 270,269 9801 20:009 00901-00903Cass,MO 29:037 51,029 9801 29:012 00900Wyandotte, KS 20:209 172,335 9802 20:010 01000Clay, MO 29:047 136,488 9802 29:008 00800
29:011Platte, MO 29:165 46,341 9802 29:008 00800
29:011Ray, MO 29:177 21,378 29:012 00900Lafayette, MO 29:107 00900
1980 has 1.64% more than 1970. 1990 has about 2% more than 1980
60 St. Louis Madison, IL 17:119 247,691 10101 17:019 01800, 0190017:020
St. Clair, IL 17:163 267,531 10102 17:021 02000, 0210017:022
St Louis 29:510 453,085 10103 29:023 01201-01203St Louis County 29:189 973,896 10104 29:025 01101-01104Franklin 29:071 71,233 10105 * 01400Jefferson 29:099 146,183 10105 29:026 01400St Charles 29:183 144,107 10105 29:024 01300
* in 1980 Frankilin is with 6 other counties.1970 and 1990 match. 1980 has 3.19% less.
Nebraska
61 Omaha Douglas,NE 31:055 397,038 9401 006 01001-01004Sarpy, NE 31:153 86,015 9401 007 00900Pottawattamie, IA 19:155 86,561 9401 019 01700
Cass,IA 19:029 * 019 01700Fremont, IA 19:071 * 019 01700Harrison, IA 19:085 * 019 01700Mills, IA 19:129 * 019 01700Montgomery, IA 19:137 * 019 01700Page, IA 19:145 * 019 01700Shelby, IA 19:165 * 019 01700Washington, NE 31:177 15,508 007 00900
*together these counties total 103,606 in 1980 population.1980 and 1990 match with 2.72% more than 1970 in one area and 15.20% less in another.
Nevada
62 Las Vegas Clark 32:003 463,087 14001 001,002 00201-00205
34
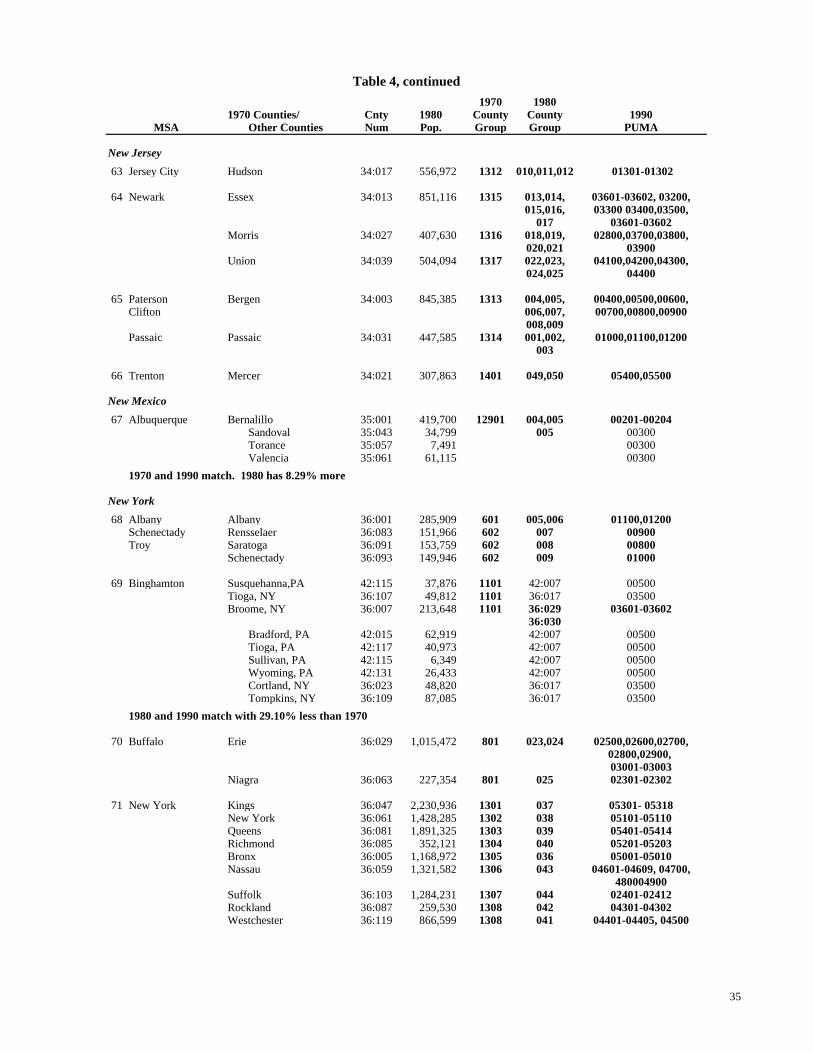
Table 4, continued
1970 19801970 Counties/ Cnty 1980 County County 1990
Other Counties Num Pop. Group Group PUMAMSA
New Jersey
63 Jersey City Hudson 34:017 556,972 1312 010,011,012 01301-01302
64 Newark Essex 34:013 851,116 1315 013,014, 03601-03602, 03200,015,016, 03300 03400,03500,
017 03601-03602Morris 34:027 407,630 1316 018,019, 02800,03700,03800,
020,021 03900Union 34:039 504,094 1317 022,023, 04100,04200,04300,
024,025 04400
65 Paterson Bergen 34:003 845,385 1313 004,005, 00400,00500,00600,Clifton 006,007, 00700,00800,00900
008,009Passaic Passaic 34:031 447,585 1314 001,002, 01000,01100,01200
003
66 Trenton Mercer 34:021 307,863 1401 049,050 05400,05500
New Mexico
67 Albuquerque Bernalillo 35:001 419,700 12901 004,005 00201-00204Sandoval 35:043 34,799 005 00300Torance 35:057 7,491 00300Valencia 35:061 61,115 00300
1970 and 1990 match. 1980 has 8.29% more
New York
68 Albany Albany 36:001 285,909 601 005,006 01100,01200Schenectady Rensselaer 36:083 151,966 602 007 00900Troy Saratoga 36:091 153,759 602 008 00800
Schenectady 36:093 149,946 602 009 01000
69 Binghamton Susquehanna,PA 42:115 37,876 1101 42:007 00500Tioga, NY 36:107 49,812 1101 36:017 03500Broome, NY 36:007 213,648 1101 36:029 03601-03602
36:030Bradford, PA 42:015 62,919 42:007 00500Tioga, PA 42:117 40,973 42:007 00500Sullivan, PA 42:115 6,349 42:007 00500Wyoming, PA 42:131 26,433 42:007 00500Cortland, NY 36:023 48,820 36:017 03500Tompkins, NY 36:109 87,085 36:017 03500
1980 and 1990 match with 29.10% less than 1970
70 Buffalo Erie 36:029 1,015,472 801 023,024 02500,02600,02700,02800,02900, 03001-03003
Niagra 36:063 227,354 801 025 02301-02302
71 New York Kings 36:047 2,230,936 1301 037 05301- 05318New York 36:061 1,428,285 1302 038 05101-05110Queens 36:081 1,891,325 1303 039 05401-05414Richmond 36:085 352,121 1304 040 05201-05203Bronx 36:005 1,168,972 1305 036 05001-05010Nassau 36:059 1,321,582 1306 043 04601-04609, 04700,
480004900Suffolk 36:103 1,284,231 1307 044 02401-02412Rockland 36:087 259,530 1308 042 04301-04302Westchester 36:119 866,599 1308 041 04401-04405, 04500
35
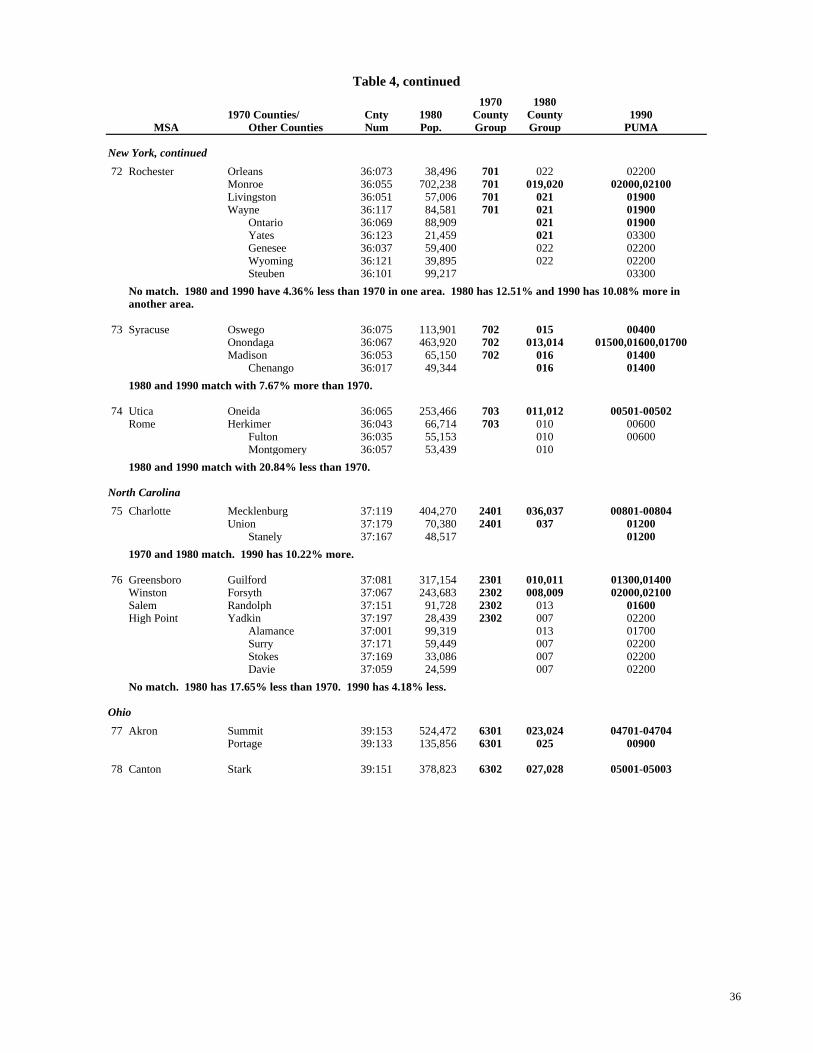
Table 4, continued
1970 19801970 Counties/ Cnty 1980 County County 1990
Other Counties Num Pop. Group Group PUMAMSA
New York, continued
72 Rochester Orleans 36:073 38,496 701 022 02200Monroe 36:055 702,238 701 019,020 02000,02100Livingston 36:051 57,006 701 021 01900Wayne 36:117 84,581 701 021 01900
Ontario 36:069 88,909 021 01900Yates 36:123 21,459 021 03300Genesee 36:037 59,400 022 02200Wyoming 36:121 39,895 022 02200Steuben 36:101 99,217 03300
No match. 1980 and 1990 have 4.36% less than 1970 in one area. 1980 has 12.51% and 1990 has 10.08% more inanother area.
73 Syracuse Oswego 36:075 113,901 702 015 00400Onondaga 36:067 463,920 702 013,014 01500,01600,01700Madison 36:053 65,150 702 016 01400
Chenango 36:017 49,344 016 01400
1980 and 1990 match with 7.67% more than 1970.
74 Utica Oneida 36:065 253,466 703 011,012 00501-00502Rome Herkimer 36:043 66,714 703 010 00600
Fulton 36:035 55,153 010 00600Montgomery 36:057 53,439 010
1980 and 1990 match with 20.84% less than 1970.
North Carolina
75 Charlotte Mecklenburg 37:119 404,270 2401 036,037 00801-00804Union 37:179 70,380 2401 037 01200
Stanely 37:167 48,517 01200
1970 and 1980 match. 1990 has 10.22% more.
76 Greensboro Guilford 37:081 317,154 2301 010,011 01300,01400Winston Forsyth 37:067 243,683 2302 008,009 02000,02100Salem Randolph 37:151 91,728 2302 013 01600High Point Yadkin 37:197 28,439 2302 007 02200
Alamance 37:001 99,319 013 01700Surry 37:171 59,449 007 02200Stokes 37:169 33,086 007 02200Davie 37:059 24,599 007 02200
No match. 1980 has 17.65% less than 1970. 1990 has 4.18% less.
Ohio
77 Akron Summit 39:153 524,472 6301 023,024 04701-04704Portage 39:133 135,856 6301 025 00900
78 Canton Stark 39:151 378,823 6302 027,028 05001-05003
36
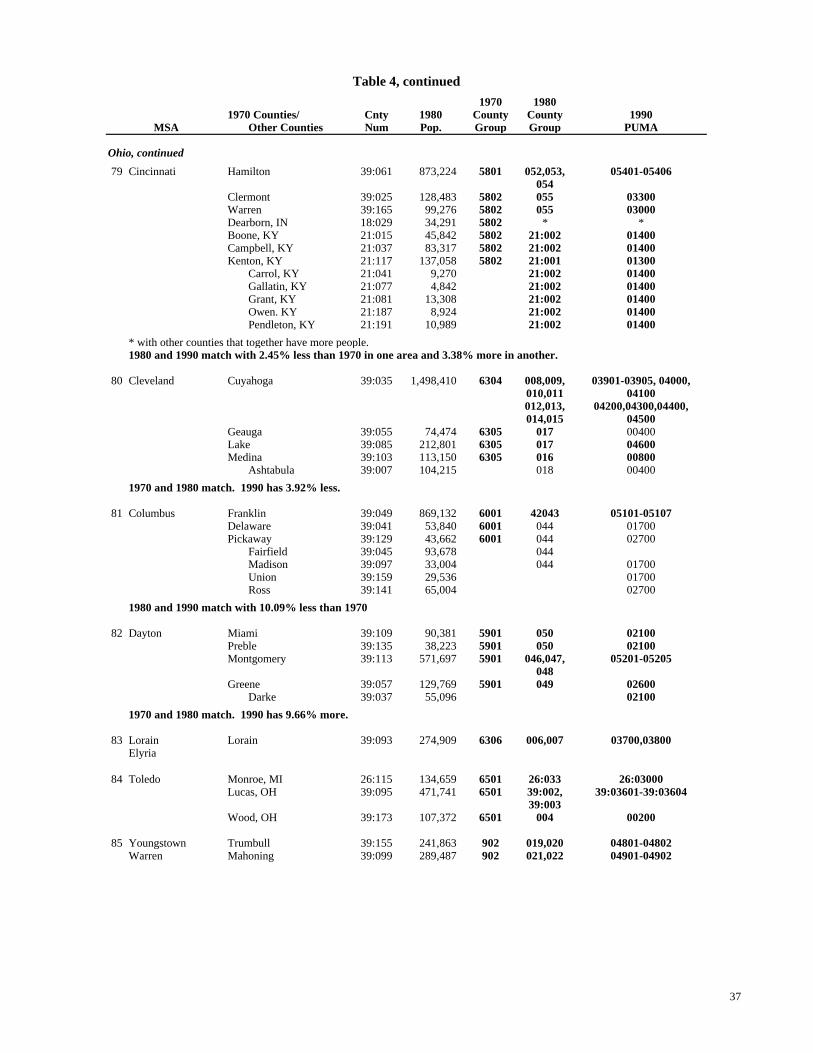
Table 4, continued
1970 19801970 Counties/ Cnty 1980 County County 1990
Other Counties Num Pop. Group Group PUMAMSA
Ohio, continued
79 Cincinnati Hamilton 39:061 873,224 5801 052,053, 05401-05406054
Clermont 39:025 128,483 5802 055 03300Warren 39:165 99,276 5802 055 03000Dearborn, IN 18:029 34,291 5802 * *Boone, KY 21:015 45,842 5802 21:002 01400Campbell, KY 21:037 83,317 5802 21:002 01400Kenton, KY 21:117 137,058 5802 21:001 01300
Carrol, KY 21:041 9,270 21:002 01400Gallatin, KY 21:077 4,842 21:002 01400Grant, KY 21:081 13,308 21:002 01400Owen. KY 21:187 8,924 21:002 01400Pendleton, KY 21:191 10,989 21:002 01400
* with other counties that together have more people.1980 and 1990 match with 2.45% less than 1970 in one area and 3.38% more in another.
80 Cleveland Cuyahoga 39:035 1,498,410 6304 008,009, 03901-03905, 04000,010,011 04100012,013, 04200,04300,04400,014,015 04500
Geauga 39:055 74,474 6305 017 00400Lake 39:085 212,801 6305 017 04600Medina 39:103 113,150 6305 016 00800
Ashtabula 39:007 104,215 018 00400
1970 and 1980 match. 1990 has 3.92% less.
81 Columbus Franklin 39:049 869,132 6001 42043 05101-05107Delaware 39:041 53,840 6001 044 01700Pickaway 39:129 43,662 6001 044 02700
Fairfield 39:045 93,678 044Madison 39:097 33,004 044 01700Union 39:159 29,536 01700Ross 39:141 65,004 02700
1980 and 1990 match with 10.09% less than 1970
82 Dayton Miami 39:109 90,381 5901 050 02100Preble 39:135 38,223 5901 050 02100Montgomery 39:113 571,697 5901 046,047, 05201-05205
048Greene 39:057 129,769 5901 049 02600
Darke 39:037 55,096 02100
1970 and 1980 match. 1990 has 9.66% more.
83 Lorain Lorain 39:093 274,909 6306 006,007 03700,03800Elyria
84 Toledo Monroe, MI 26:115 134,659 6501 26:033 26:03000Lucas, OH 39:095 471,741 6501 39:002, 39:03601-39:03604
39:003Wood, OH 39:173 107,372 6501 004 00200
85 Youngstown Trumbull 39:155 241,863 902 019,020 04801-04802Warren Mahoning 39:099 289,487 902 021,022 04901-04902
37
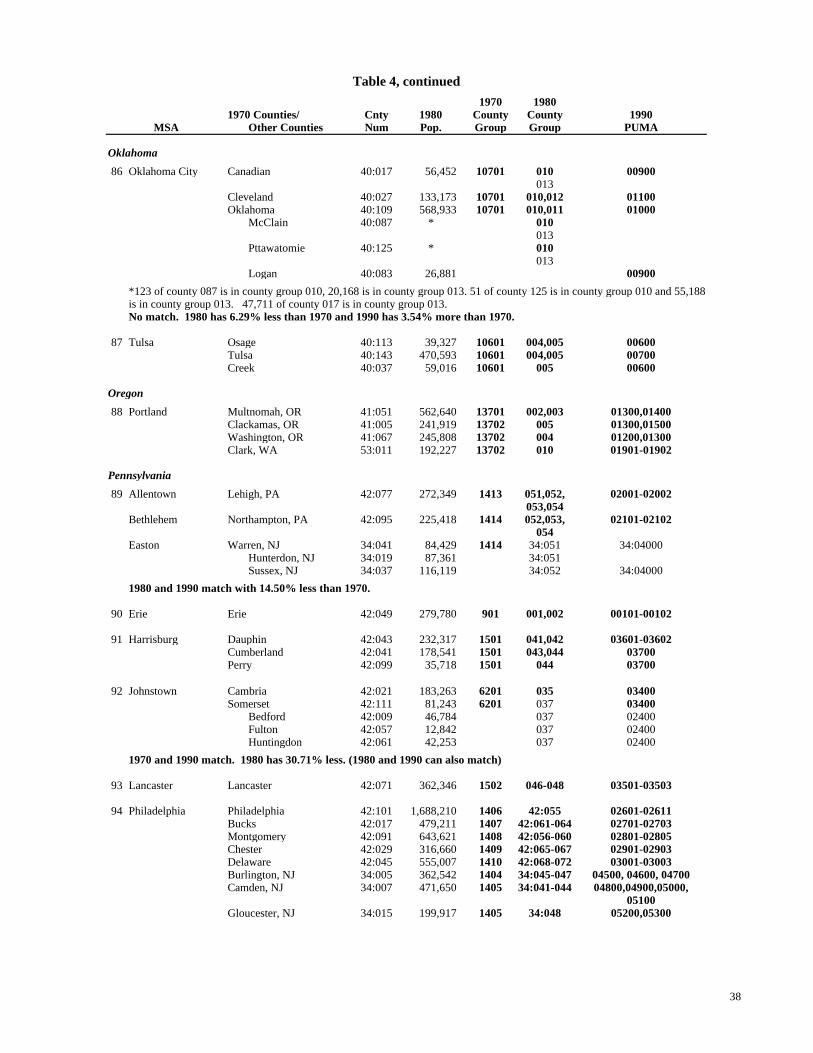
Table 4, continued
1970 19801970 Counties/ Cnty 1980 County County 1990
Other Counties Num Pop. Group Group PUMAMSA
Oklahoma
86 Oklahoma City Canadian 40:017 56,452 10701 010 00900013
Cleveland 40:027 133,173 10701 010,012 01100Oklahoma 40:109 568,933 10701 010,011 01000
McClain 40:087 * 010013
Pttawatomie 40:125 * 010013
Logan 40:083 26,881 00900
*123 of county 087 is in county group 010, 20,168 is in county group 013. 51 of county 125 is in county group 010 and 55,188is in county group 013. 47,711 of county 017 is in county group 013.No match. 1980 has 6.29% less than 1970 and 1990 has 3.54% more than 1970.
87 Tulsa Osage 40:113 39,327 10601 004,005 00600Tulsa 40:143 470,593 10601 004,005 00700Creek 40:037 59,016 10601 005 00600
Oregon
88 Portland Multnomah, OR 41:051 562,640 13701 002,003 01300,01400Clackamas, OR 41:005 241,919 13702 005 01300,01500Washington, OR 41:067 245,808 13702 004 01200,01300Clark, WA 53:011 192,227 13702 010 01901-01902
Pennsylvania
89 Allentown Lehigh, PA 42:077 272,349 1413 051,052, 02001-02002053,054
Bethlehem Northampton, PA 42:095 225,418 1414 052,053, 02101-02102054
Easton Warren, NJ 34:041 84,429 1414 34:051 34:04000Hunterdon, NJ 34:019 87,361 34:051Sussex, NJ 34:037 116,119 34:052 34:04000
1980 and 1990 match with 14.50% less than 1970.
90 Erie Erie 42:049 279,780 901 001,002 00101-00102
91 Harrisburg Dauphin 42:043 232,317 1501 041,042 03601-03602Cumberland 42:041 178,541 1501 043,044 03700Perry 42:099 35,718 1501 044 03700
92 Johnstown Cambria 42:021 183,263 6201 035 03400Somerset 42:111 81,243 6201 037 03400
Bedford 42:009 46,784 037 02400Fulton 42:057 12,842 037 02400Huntingdon 42:061 42,253 037 02400
1970 and 1990 match. 1980 has 30.71% less. (1980 and 1990 can also match)
93 Lancaster Lancaster 42:071 362,346 1502 046-048 03501-03503
94 Philadelphia Philadelphia 42:101 1,688,210 1406 42:055 02601-02611Bucks 42:017 479,211 1407 42:061-064 02701-02703Montgomery 42:091 643,621 1408 42:056-060 02801-02805Chester 42:029 316,660 1409 42:065-067 02901-02903Delaware 42:045 555,007 1410 42:068-072 03001-03003Burlington, NJ 34:005 362,542 1404 34:045-047 04500, 04600, 04700Camden, NJ 34:007 471,650 1405 34:041-044 04800,04900,05000,
05100Gloucester, NJ 34:015 199,917 1405 34:048 05200,05300
38

Table 4, continued
1970 19801970 Counties/ Cnty 1980 County County 1990
Other Counties Num Pop. Group Group PUMAMSA
Pennsylvania, continued
95 Pittsburgh Allegheny 42:003 1,450,085 6202 025-031 01301-01312Westmoreland 42:129 392,294 6203 032,033 03301-03303Beaver 42:007 204,441 6204 023 03800Washington 42:125 217,074 6204 024 03901-03902
Lawrence* 42:073 107,150 022 03800
* in 1970 Lawrence is with 5 other counties in county group 9003.1970 and 1980 match. 1990 has 4.7% more. (1980 and 1990 can also match)
96 Reading Berks 42:011 312,509 1412 049,050 03101-03102
97 Wilkes Barre Luzerne 42:079 343,079 1201 012,013, 00700Hazelton 014
98 York Adams 42:001 68,292 1503 040 02300York 42:133 312,963 1503 039,040 02501-02503
Franklin 42:055 113,629 038 02300
1970 and 1980 match. 1990 has 29.80% more. (1980 and 1990 can also match)
Rhode Island
99 Providence Bristol 44:001 46,942 409 004 00500(this is the whole Kent 44:003 154,163 409 003, 005* 00400state of Rhode Providence 44:007 571,349 409 001, 002, 00100,00200,00300Island) 003, 004**, 00700,00800
006Newport 44:005 81,383 410 004 00500Washington 44:009 93,317 410 005* 00600
*29,803 of county 003 is in county group 005 with county 009.**46,942 of county 001 and 50,980 of county 007 are with county 005 in county group 004.Can match all if use whole state. (not MSA as defined in 1970)
South Carolina
100 Charleston Charleston 45:019 276,974 2902 019,020 01201-01202Berkeley 45:015 94,727 2902 021 01100
Dorchester 45:035 58,761 021 01100
1980 and 1990 match with 15.81% more than 1970.
101 Columbia Richland 45:079 269,735 2701 013,014 01601-01602Lexington 45:063 140,353 2701 015 01700
102 Greenville Pickens 45:077 79,292 2601 002 00100Greenville 45:045 287,913 2601 003,004 00201-00202
Oconee 45:073 48,611 002 00100
1980 and 1990 match with 13.24% more than 1970.
Tennesse103 Chattanooga Hamilton, TN 47:065 287,740 4401 47:015, 01200,01300
47:016Walker, GA 13:295 56,470 4401 13:001 00300
Catoosa, GA 13:047 36,991 13:001 13:00300Dade, GA 13:083 12,318 13:001 13:00300
1980 and 1990 match with 14.33% more than 1970.
39
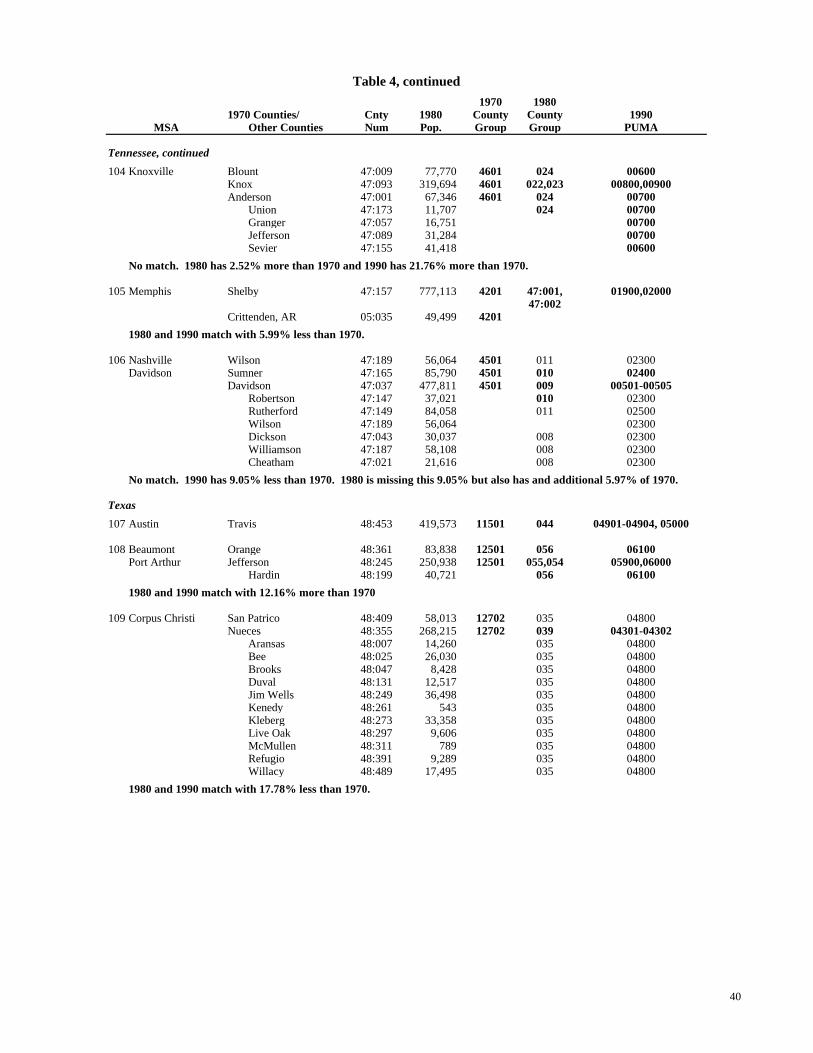
Table 4, continued
1970 19801970 Counties/ Cnty 1980 County County 1990
Other Counties Num Pop. Group Group PUMAMSA
Tennessee, continued
104 Knoxville Blount 47:009 77,770 4601 024 00600Knox 47:093 319,694 4601 022,023 00800,00900Anderson 47:001 67,346 4601 024 00700
Union 47:173 11,707 024 00700Granger 47:057 16,751 00700Jefferson 47:089 31,284 00700Sevier 47:155 41,418 00600
No match. 1980 has 2.52% more than 1970 and 1990 has 21.76% more than 1970.
105 Memphis Shelby 47:157 777,113 4201 47:001, 01900,0200047:002
Crittenden, AR 05:035 49,499 4201
1980 and 1990 match with 5.99% less than 1970.
106 Nashville Wilson 47:189 56,064 4501 011 02300Davidson Sumner 47:165 85,790 4501 010 02400
Davidson 47:037 477,811 4501 009 00501-00505Robertson 47:147 37,021 010 02300Rutherford 47:149 84,058 011 02500Wilson 47:189 56,064 02300Dickson 47:043 30,037 008 02300Williamson 47:187 58,108 008 02300Cheatham 47:021 21,616 008 02300
No match. 1990 has 9.05% less than 1970. 1980 is missing this 9.05% but also has and additional 5.97% of 1970.
Texas
107 Austin Travis 48:453 419,573 11501 044 04901-04904, 05000
108 Beaumont Orange 48:361 83,838 12501 056 06100Port Arthur Jefferson 48:245 250,938 12501 055,054 05900,06000
Hardin 48:199 40,721 056 06100
1980 and 1990 match with 12.16% more than 1970
109 Corpus Christi San Patrico 48:409 58,013 12702 035 04800Nueces 48:355 268,215 12702 039 04301-04302
Aransas 48:007 14,260 035 04800Bee 48:025 26,030 035 04800Brooks 48:047 8,428 035 04800Duval 48:131 12,517 035 04800Jim Wells 48:249 36,498 035 04800Kenedy 48:261 543 035 04800Kleberg 48:273 33,358 035 04800Live Oak 48:297 9,606 035 04800McMullen 48:311 789 035 04800Refugio 48:391 9,289 035 04800Willacy 48:489 17,495 035 04800
1980 and 1990 match with 17.78% less than 1970.
40
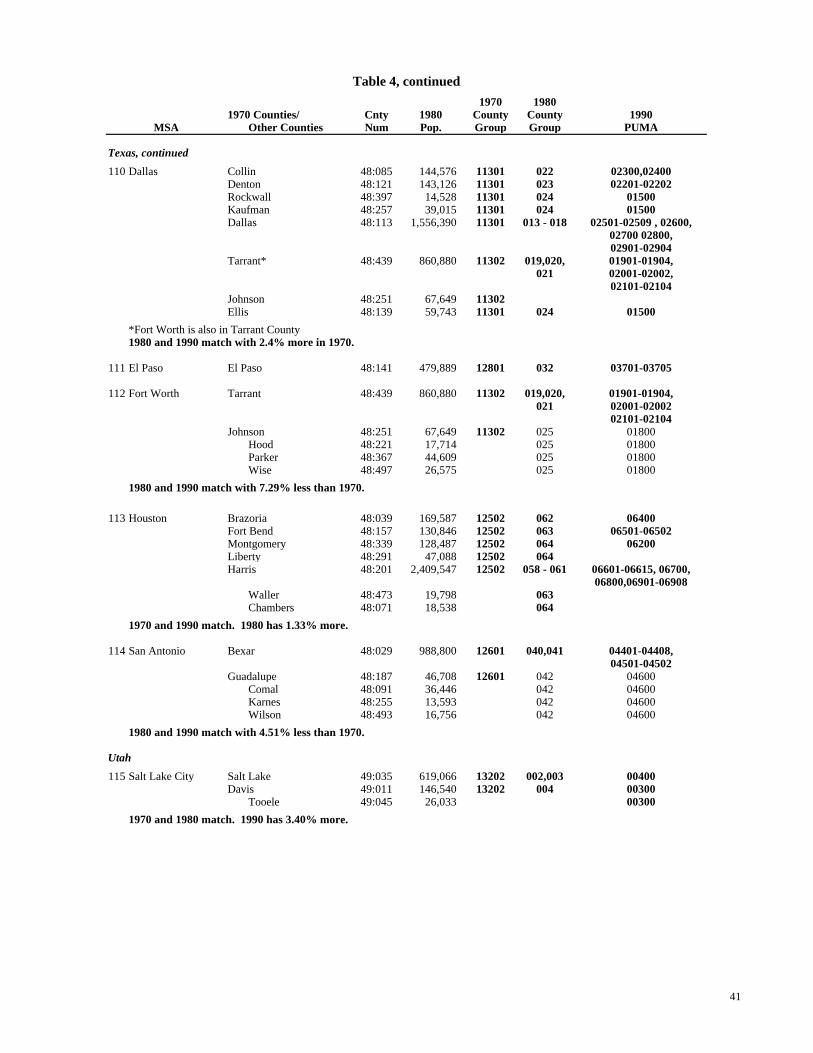
Table 4, continued
1970 19801970 Counties/ Cnty 1980 County County 1990
Other Counties Num Pop. Group Group PUMAMSA
Texas, continued
110 Dallas Collin 48:085 144,576 11301 022 02300,02400Denton 48:121 143,126 11301 023 02201-02202Rockwall 48:397 14,528 11301 024 01500Kaufman 48:257 39,015 11301 024 01500Dallas 48:113 1,556,390 11301 013 - 018 02501-02509 , 02600,
02700 02800,02901-02904
Tarrant* 48:439 860,880 11302 019,020, 01901-01904,021 02001-02002,
02101-02104Johnson 48:251 67,649 11302Ellis 48:139 59,743 11301 024 01500
*Fort Worth is also in Tarrant County1980 and 1990 match with 2.4% more in 1970.
111 El Paso El Paso 48:141 479,889 12801 032 03701-03705
112 Fort Worth Tarrant 48:439 860,880 11302 019,020, 01901-01904,021 02001-02002
02101-02104Johnson 48:251 67,649 11302 025 01800
Hood 48:221 17,714 025 01800Parker 48:367 44,609 025 01800Wise 48:497 26,575 025 01800
1980 and 1990 match with 7.29% less than 1970.
113 Houston Brazoria 48:039 169,587 12502 062 06400Fort Bend 48:157 130,846 12502 063 06501-06502Montgomery 48:339 128,487 12502 064 06200Liberty 48:291 47,088 12502 064Harris 48:201 2,409,547 12502 058 - 061 06601-06615, 06700,
06800,06901-06908Waller 48:473 19,798 063Chambers 48:071 18,538 064
1970 and 1990 match. 1980 has 1.33% more.
114 San Antonio Bexar 48:029 988,800 12601 040,041 04401-04408,04501-04502
Guadalupe 48:187 46,708 12601 042 04600Comal 48:091 36,446 042 04600Karnes 48:255 13,593 042 04600Wilson 48:493 16,756 042 04600
1980 and 1990 match with 4.51% less than 1970.
Utah
115 Salt Lake City Salt Lake 49:035 619,066 13202 002,003 00400Davis 49:011 146,540 13202 004 00300
Tooele 49:045 26,033 00300
1970 and 1980 match. 1990 has 3.40% more.
41

Table 4, continued
1970 19801970 Counties/ Cnty 1980 County County 1990
Other Counties Num Pop. Group Group PUMAMSA
Virginia
116 Newport News York 51:199 35,463 2001 021Hampton Hampton 51:650 122,617 2001 020 03000
Newport News 51:700 144,903 2001 021 03100Gloucester 51:073 20,107 021James City 51:095 22,763 021Poquoson 51:735 8,726 021Williamsburg 51:830 9,870 021York 51:199 35,463
No match. 1980 has 31.99% more than 1970 and 1990 has 11.70% less than 1970.
117 Norfolk Portsmouth 51:740 104,577 2003 016 02600Portsmouth Virginia Beach 51:810 262,199 2003 019 02900
Chesapeake 51:550 114,486 2003 017 02500Norfolk 51:710 266,979 2002 018 02700
Suffolk 51:800 47,621 016
1970 and 1990 match. 1980 has 6.36% more.
118 Richmond Hanover 51:085 50,398 1901 025 02000Henrico 51:087 180,735 1901 025 01900Richmond 51:760 219,214 1901 023 02100Chesterfield 51:041 141,372 1901 024 01800
Charles City 51:036 6,692 025 02000Goochland 51:075 11,761 025 02000New Kent 51:127 8,781 025 02000Powhatan 51:145 13,062 025 02000
1980 and 1990 match with 6.81% more than 1970.
Washington
119 Seattle King County 53:033 1,269,749 13501 017,018 01701-01703Everett 01801-01808
Snohomish 53:061 337,720 13502 019 01001-01004
120 Spokane Spokane 53:063 341,835 13401 005,006 00500,00600
121 Tacoma Pierce 53:053 485,643 13403 013,014 01301-01304
West Virginia
122 Huntington Lawrence, OH 39:087 63,849 4801 39:059 03500Asland Cabel, WV 54:011 106,835 4801 54:010 00800
Wayne, WV 54:099 46,021 4801 54:011 00800Boyd, KY 21:019 55,513 4801 21:011 01100
Gallia, OH 39:053 30,098 39:059 03500Vinton, OH 39:163 11,584 39:059Jackson,OH 39:079 30,592 03500Carter, KY 21:043 25,060 21:011 01100Elliot,KY 21:063 6,908 21:011 01100Greenup,KY 21:089 39,132 21:011 01100Lawrence, KY 21:127 14,121 21:011 01100Lincoln,WV 54:043 23,675 54:011 00800Logan,WV 54:045 50,679 54:011 00800Mason,WV 54:053 27,045 54:011 00800Mingo, WV 54:059 37,336 54:011 00800
No Match. 1980 has 15.31% more than 1970 in one area and 37.3% less in another area. 1990 has 73.26% more than1970 in one area and 20.39% less in another.
42
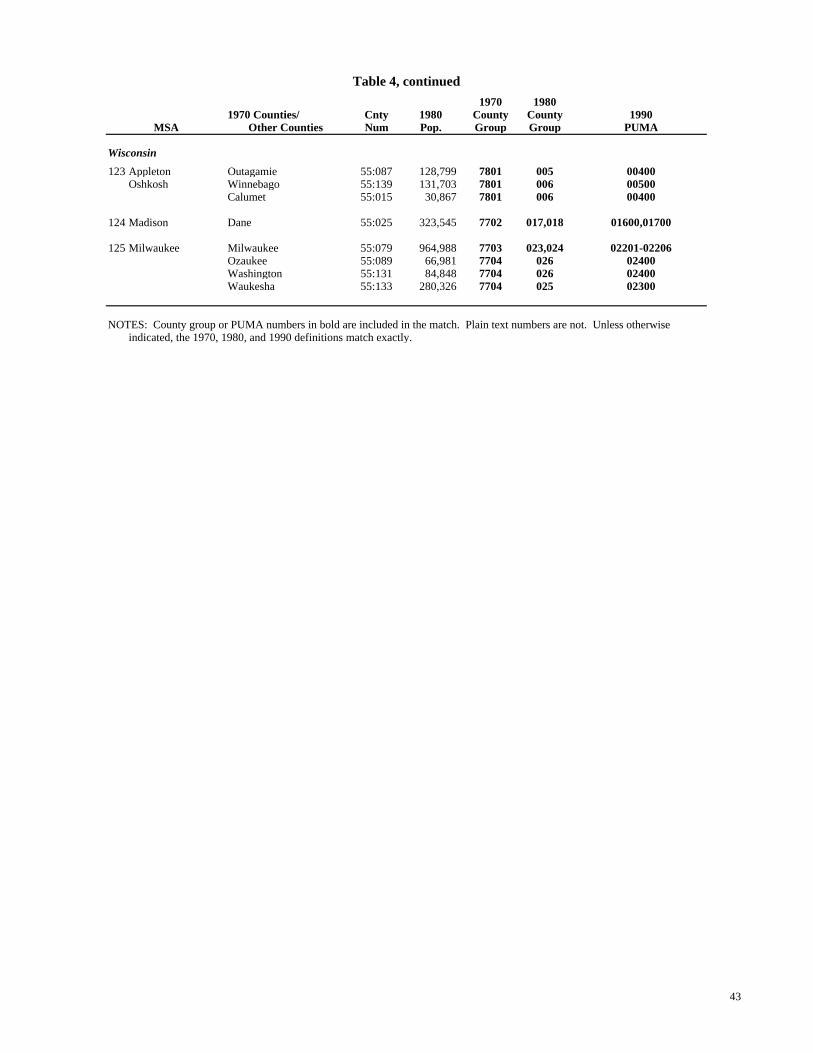
Table 4, continued
1970 19801970 Counties/ Cnty 1980 County County 1990
Other Counties Num Pop. Group Group PUMAMSA
Wisconsin
123 Appleton Outagamie 55:087 128,799 7801 005 00400Oshkosh Winnebago 55:139 131,703 7801 006 00500
Calumet 55:015 30,867 7801 006 00400
124 Madison Dane 55:025 323,545 7702 017,018 01600,01700
125 Milwaukee Milwaukee 55:079 964,988 7703 023,024 02201-02206Ozaukee 55:089 66,981 7704 026 02400Washington 55:131 84,848 7704 026 02400Waukesha 55:133 280,326 7704 025 02300
NOTES: County group or PUMA numbers in bold are included in the match. Plain text numbers are not. Unless otherwiseindicated, the 1970, 1980, and 1990 definitions match exactly.
43