coexistence curves at liquid-liquid critical points: ising exponents and extended scaling
TRANSCRIPT

PHYSICAL REVIE% A VOLUME 14, NUMBER 5 NOVEMBER 1976
Coexistence curves at liquid-liquid critical points: Ising exponents and extended scahng
Sandra C. GreerInstltQt8 fof 8Qslc StQndQ1'ds, XQtlottQl 8BPGQQ Of StQPtdQfds, 8 Qshlogtotl, D. C. 20234-
(Received I June 1976)
New measurements have been made of coexisting mass densities of isobutyric acid + water with a precision
of 20 ppm and within 3.S'C of the critical temperature. The measurements were made using a single sample
of composition very close to critical. It is found that the coexistence curve is more symmetric in terms of the
difference in volume fraction (A$) of coexisting phases than in terms of the difference in mass density. The
difference h$ is well fitted for e = (T, —T)jT, & 0.006 by the expression A$ = 8m~, where 8 = 1.071 ~ 0.023
and @=0.328~0.004. (Uncertainties are given as 3 times the standard deviation. ) A new analysis has been made of
the recent data of Gopal et Ql. on the difference in volume fraction of coexisting densities of carbon disulfide
+ nitromethane. For this system, A$ can be fitted for c & 0.2 by an extended scaling expression suggested by
%egner*s work, hp = 8&"+ 8,&+ 2+ 8,&
' 2' The exponent 6, is fixed at O. S; the fit gives I8 = 0.316+ 0.008, 8=-1.63 + 0.09, 8,=0.77 ~ 0.31, and 8, =- —2.43 + 0.40. This work suggests that liquid-liquid critical
phenomena are consistent with the functional forms obtained from renorrnalization-group calculations and
with asymptotic exponents which are like those presently calculated for the Ising model. The range ofasymptotic behavior seems to be larger for a liquid-liquid critical point than for a liquid-gas critical point.
I. INTRODUCTION
Many binary-liquid mixtures are only partiallymiscible, and at constant pressure their regions ofimmiscibility have coexistence curves with criticalpoints which are analogous to all other criticalpoints. '-"We can begin to answer some questionscurrently important in the field of critical pheno-mena by examining the coexistence curves of suchbinary-liquid mixtures. These questions are thefollowing: (I) What is the proper order parameterfor a, binary-liquid mixture'? (2) What is the as-ymptotic critical exponent 8 for a binary liquidmixture'? Is it the same as that for pure fluids' ?
Is it the same as that for the Ising model? (3) Isa simple asymptotic scaling expression adequate todescribe the data'? If. not, are current predictionsfor extensions to scaling consistent with the data' ?In what temperature range is the asymptotic re-gime reached? (4) Does the diameter of the coex-istence curve show the a.noma. ly predicted by cur-rent theories '?
I will. present here some progress toward answer-ing these questions based on the analysis of new
data on the coexistence curve of isobutyric acid+water and the analysis of data by Gopal ctrl. ' oncarbon disulf ide+ nitromethane.
The first question, thai of theproper order pa-rarneter for a binary mixture, has been consideredby Scott, ' Stein and Allen, ' and others. ' ' Pn Isingrepresentation" of. a, binary-liquid mixture wouldhave ar1 exact symmetry about the critical point inthe proper order paran1eter. Therefore, we seekto find the order parameter in terms of which thecoexistence curve is most symmetric. Possiblecl1olces are the mole fr'actlorl of one component
(x~) the volume fraction of one component (P, )
and the mass density (p). Experimental results' 'so far indicate that the volume fraction is a moresymmetric representation than is the mole frac-tion. The results of the present work for isobuty-ric a.cid+ water will show that the volume fractionis also to be preferred to the mass density. Wecan see why this might be. Since the order param-eter in the lattice-gas representation of a purefluid is the number density, we might expect thatthe best order parameter for a mixture will be theone closest to the number density of one component(p'„). I et us see how p and P, are related to p„'.If V', and V", are the molar volumes of the purecomponents, V" is the ideal molar volume of themixtu. e,, V is the excess volume of mixing, p',
and p', are the mass densities of the pure compo-nents, Q, = V', j(V",„+Vs), and T is the tempera-ture, then it can be shown that
y, (r) = V;(T)p'„(T)
while
p(T) = Vl(T) [pl(T)- p!(T)b~(T)+ p'(T).
We can see from Eqs, (I) and (2) that P, is moredirectly related to p„' than is p and thus (t), w llprobably be the better order parameter.
We also seek a determination of the critical ex-ponent P, which characterizes the approach tozero of the difference in order parameter (p) be-tween coexisting phases:
when e approaches zero [He.'re e=(T, T)/T, —where T, is the critical temperature. ] Thus P isdefined in the asymptotic regin1e as T —T, and
14

COEXISTENCE CURVES AT LIQUID-LIQUID CRITICAL . .
attempts to determine P must include a considera-tion of whether the asymptotic regime has beenattained in the experiment. Fits to the simplescaling" form [Eq. (3)] outside the asymptotic re-gime may give an "apparent" p the value of whichhas been altered by higher-order contributions.
The value of P for the Ising model is found byseries expansion to be 0.31+0.01,'0 but more re-cent calculations by renormalization-group tech-niques give somewhat higher values: 0.3367 " and0.320+0.015." Past evaluations of p for purefluids" "have shown an apparent P of 0.355~ 0.007in the range 10 4&& &10 '. Measurements on purefluids have since been made much closer to T, bynew techniques. "'0 Very recent accurate work'gives P for pure Quids as 0.321-0.329 in the range5&10 '&& & 5~10 ', consistent with the values of
P for the Ising model. Coexistence curves of bi-nary mixtures were surveyed in 1974 by Stein andAllen, ' who found an apparent P of 0.34 + 0.01 fornine mixtures in the range 2X10 '&& &1.4 &&10 '.Since that study, there has been only one exten-sive study of P for a binary liquid using the volumefraction as the order parameter, namely, the workof Gopal et al. 3 on carbon disulfide+ nitromethane.That work will be considered in detail below. " Thegeneral conclusion on P for binary liquids to datehas been that the apparent I3 for simple scaling islower {0.33-0.34) than it is for pure fluids (0.34-0.35). The present analysis will show that theasymptotic range for coexistence curves at someliquid-liquid critical points is larger («10 ) thanit is at liquid-gas critical points" (e &10 ') andthat the P obtained in the asymptotic range forthese binaries is consistent with that given for theIsing model and with that obta, ined in the asymptot-ic range for pure fluids. " Thus both binary mix-tures and pure fluids" seem to belong in the sameuniversality class" as the Ising model.
Since P is defined only in the asymptotic limitnear T„ the proper description of a coexistencecurve beyond the asymptotic range should includeterms of higher order than the simple scalingterm of Eq. (3). The validity of simple scalinghas been tested for pure fluids by looking for anydependence of p on the range of &."" The olderdata on pure Quids in the range 10 &q &10 'showed no such range dependence, ""but newer,more precise data"" on pure fluids have shownsome range dependence. These recent range var-iation tests suggest that corrections to simplescaling are needed for pure fluids in the range10 ' & c & 10 '. Little range variation has been donepreviously for binary mixtures. Balzarini" found norange dependence for aniline + cyclohexane to e = 0.01.
Applying the techniques of renormalization-grouptheory to the Ising model, %egner" has calculated
the corrections to simple scaling. According to hisresults,
n=On =0 n =0 n =01 2 3
n~n1{h-1)+ n2b, + n363
g~ g g ~ g+A2 g ~ /+262 g /+362, ~,~ (4b)
There has been no published work on applying theWegner expansion to the coexistence curves of bi-nary mixtures. Such corrections have been con-sidered for the pure fluid Xe" and found not to beuseful. However, in this analysis of the coexis-tence curve of Xe, it was assumed that 42= 0.64and that the Ising P = 0.3125; these are not the bestcurrent estimates for these exponents and a dif-ferent choice might change the conclusionsreached. The analysis to be given here of thedata' for carbon disulfide+ nitromethane over abroad range (10 ' & e & 2 x 10 ') will show these bi-nary-mixture data to be consistent with a %egnerexpansion.
Theories have predicted" "that the lack of Isingparticle-hole symmetry in real fluids will lead toan anomaly in the diameter of the coexistencecurve. That is, if p, and p, are the values of theorder pa.rameter in the coexisting phases,
—,'(p, +p, ) = P, + C,z' + C,c+ (5)
This anomaly is difficult to observe because theexponent (1—o. =0.88) is so close to unity. Therehave been only two observations of the anomalyreported —one in a pure fluid" {SF,) and one in a.
binary liquid' (carbon disulfide+ nitromethane).The new measurements reported here on isobuty-ric acid+ water show no deviation from a rectilin-ear diameter. This indicates that the coefficientof the anomaly is small and that perhaps it is nec-essary to have data over a much larger range andcloser to T, in order to find the anomaly.
In summary, I report here new measurementson the coexistence curve of isobutyric a,cid+waierand a new analysis of coexistence curve data, oncarbon disulfide+niiromethane. ' The results indi-cate that the volume fraction is the preferred or-der parameter for binary-liquid mixtures, thatthe coexistence curves of such mixtures have Isingasymptotic behavior, and that the behavior furtherfrom the critical point is consistent with the cor-
(4a)Here ~= I35, 5 is the critical exponent for thechange in chemical potential with composition',and 42 is a correction exponent which has beencalculated to be 0.50." Terms with exponentswhich are nearly the same can be collected to give
1772 SANDRA C. GREER 14
rections to asymptotic behavior predicted by therenormalization-group theory. While both purefluids" and binary-liquid mixtures seem to fallinto the same universality class as the Ising mod-el,"the liquid-liquid coexistence curves have alarger range of asymptotic Ising behavior than doliquid-gas coexistence curves.
B. Density measurement
Densities were determined using a magneticdensimeter, '" which measures density by using asolenoid to levitate a small buoy containing mag-netic material in the fluid of interest. The cur-rent required in the solenoid to support the buoyin the fluid at a given height is a measure of thefluid density:
p= pg+ CI (6)
where p is the fluid density, I is the solenoid cur-
II. ISOBUTYRIC ACID + WATER
A. Sample preparation
The isobutyric acid was provided by GrahamMorrison of the University of California at LosAngeles; Morrison estimated the purity by titra-tion and found the acid to be 99.5% pure, the mainimpurity being water. The isobutyric acid anddistilled water were mixed together in a cylindri-cal Pyrex" cell, the inner diameter of which was13 mm. The mixture was degassed twice by freez-ing it and then pumping off the residual gases,after which the cell was sealed at the vapor pres-sure of the mixture.
The sample consists of 4.918 g water and 3.005g 99.5% isobutyric acid, so that the mole fractionx, of isobutyric acid is 0.110. The sample is 6.6cm high and has 4 cm' of vapor above it. Thetransition temperature of this sample was found
by visual observation two months after the samplepreparation to be 25.988 'C; there is evidence thatthe transition temperature drifted slowly with timeand this problem will be discussed below. Litera-ture values of x, vary from 0.111"to 0.115"andliterature values for T, vary from 26.086" to26.385 'C. '4
For binary-liquid mixtures, the critical tem-perature is known to be very sensitive to impuri-ties and the system isobutyric acid+water isknown to be particularly sensitive to ionic impuri-ties." The water used for this sample was notdeionized and so could have introduced ionic im-purities; also, ionic impurities could have beenleached from the cell wall. However, there isevidence that, although small amounts of impuri-ties affect T, in fluids, they do not affect criticalexponents '"'"'"'"
rent, p~ is the density of the buoy, and C is acalibration constant. In this densimeter, the buoyposition is sensed by a differential transformerand the out-of-balance signal fed to a servo sys-tem which keeps the buoy at a fixed height. Thesolenoid current is determined from the voltageacross a standard resistor in series with thesolenoid. The voltage is measured by a digitalvoltmeter, 100 readings of which are averaged.
The buoy" used in these measurements is aquartz sphere 7 mm in diameter which has pro-jections at the top and bottom, so that the overallheight is 18 mm. The magnetic material, annealedHy-Mu 80 (Carpenter Steel Co. ), was cemented in-to the bottom of the buoy. The buoy was calibrated[Eq. (6)] by measuring the solenoid current re-quired to suspend it in three liquids of known den-sities between 0.981 and 0.990 g/cm' (1 g/cm'= 10' kg/m') at 25 "C. The calibration data were fitby the following equation: p= 0.96502(+0.00042)+0.02843(+0.00057)V', where p is in g/cm' and V
is the voltage across a 1-Q standard resistor inseries with the solenoid. The standard deviationof this fit, which determines the accuracy of thedensity measurements, was 38 ppm of the density.The buoy is sensitive to density changes of about20 ppm. The calibrated buoy was sealed insidethe cell with the sample.
Since the buoy was suspended by the servo sys-tem at a fixed height in the apparatus, "the den-sity in each of the coexisting liquid phases wasmeasured by moving the sample relative to thebuoy.
C. Temperature control and measurement
The temperature of the sample was controlledto +0.001'C by water which flowed from a con-trolled-temperature bath past the sample cell.The region of the cell was checked for tempera-ture gradients and no differences greater than+0.001'C were found. The temperature was mea-sured using a quartz crystal thermometer" whichhad recently been calibrated with respect to aplatinum resistance thermometer on the Interna-tional Practical Temperature Scale of 1968; thetemperature measurement is believed to be accu-rate to +0.002'C.
D. Sources of systematic error
Errors can occur in the density measurement dueto effects of temperature change on the buoy. Thethermal expansion of the buoy affects the densityps in Eq. (6). For this buoy, the correction to themeasured density is about 1 ppm/'C, which isnegligible. The permeability of the Hy-Mu in thebuoy changes with temperature; this permeability

14 COEXISTENCE CURVES AT LIQUID-LIQUID CRITICAL. . 1773
enters into the calibration constant C in Eq. (6).H. Mundy of NBS has measured the temperaturedependence of the permeability of Hy-Mu and findsit to be +0.01%/ C, which corresponds to a negli-gible density error (1 ppm/'C).
It has recently"'" "become clear that systema-tic errors can arise from density gradients due togravity in experiments near consolute points. Themixture isobutyric acid+water was chosen forthis study because it is expected to have negligiblegravity effects, since the densities of the purecomponents are nearly the same. " A search wasmade for such gradients. The sample was heated11'C above the transition temperature, shakenvigorously by hand to insure homogeneity, andplaced in the densimeter. Then the temperaturewas lowered toward the transition temperatureand the sample searched for density gradients attemperatures between 11 'C and a few millidegreesfrom the transition temperature. The sample wassearched for density gradients by measuring thedensity as a function of height. No density gradi-ents were ever observed in the one-phase region,even within millidegrees of the transition tempera-ture. Furthermore, stirring the sample (by oscil-lating the buoy) never had any effect on the mea-sured density. It was not possible to search fordensity gradients in the two-phase region becausethe buoy is too large compared to the heights ofthe separated phases. Jasnow etal. 44 calculatedthat gravity effects in isobutyric acid+ water wouldbe important only within 0.01'C of the criticaltemperature. Since the measurements presentedhere in the separated phases are only as close as0.014 'C to the critical temperature, I will assumethat there were no significant density gradientspresent in the two-phase region either.
While the phenomenon of interest here is thecoexistence curve at constant pressure, the ex-periment was performed at the vapor pressure ofthe mixture. This pressure change results in ashift of T,. For isobutyric acid+water at 1 atm, "dT, /dp= —0.055'C/atm. If the vapor pressure istaken as that of water, then T, is shifted by only-0.1 mK when the temperature is changed by 1 Kand the error so introduced is well within the re-solution of the measurements.
The change of composition of the vapor withtemperature likewise has a negligible effect on theexperiment. A change of vapor composition of100% would change the average liquid density byonly 2x10 ' g/cm'.
E. Determination of T,
It is very helpful in the data analysis to have anindependent determination of the critical tempera-
II
I 1 I II
1 I
26.0
CD0
cr
cL
n n
25.0
n
.990
0 4I I I I I I I I I
.995
DENSITY (g/cm )
1.000
FIG. 1. Coexistence curve of isobutyric acid+ water:coexisting densities (a, 6), diameter of the coexistencecurve ( ), and the density in the one-phase region (0).The coexisting densities are from run 1 (Appendix A)and the density data above T, are from the set given inAppendix B. The (a) data were taken while heating thesample and the (6) data while cooling; the heating datashow slightly more scatter than, but no systematic dif-ferences from, the cooling data.
ture. The words "transition temperature, T„"and "critical temperature, T„"have been usedhere with great care. T, is the temperature atwhich a sample of a particular composition changesfrom one liquid phase to two liquid phases on cool-ing (or vice versa on heating). T, is the maximumvalue of T, if T, is measured as a function of corn-position. Thus T, equals T, only if the sample isat the critical composition. Unfortunately, thissample is not quite at the critical composition, aswill be explained, and, furthermore, it is verydifficult even to obtain T, in this system.
If the sample has precisely the critical composi-tion and if both the diameter of the coexistencecurve and the density in the one-phase region haveno detectable anomalies (which, as we shall see,is the case), then (p, + p, )/2 as a function of e forT & T, and p(e) for T & T, should meet at the criti-cal point. Measurements were made of p(e) forT & T, and some of these data are shown in Fig. 1.We see that for this sample the diameter of thecoexistence curve and the curve of densities inthe one-phase region do not meet (Fig. 1) and weconclude that the sample is not quite at the criticalcomposition. Using the difference in density atthe transition for the two lines (& p = 0.0006 g/cm')and dp/dx, = 0.1 (as calculated for an ideal solutionof isobutyric acid in water), we find that x„„,=x, —0.005, where x is the mole fraction of iso-butyric acid. (This implies that x, = 0.115.) Thus
T, is less than T„and T, can only be obtained in-

SANDRA C. GREER
directly, for instance, as a parameter in the an-alysis of the data.
The upward movement of the liquid-liquid menis-cus as the two-phase mixture was heated was an-other indication that x„m», & x,. In fact, theshrinking of the upper liquid phase as the temper-ature was raised was a limit on how close to T,measurements of the coexisting liquid densitiescould be made. At about T,—T =0.01'C the heightof the upper phase became less than that of thebuoy.
It is very difficult to measure T, for this mix-ture. Inhomogeneities form easily near the liquid-vapor interface. The slow diffusion in this sys-tem means that once an inhomogeneity is formed,it does not go away. Qn cooling, a meniscus canappear before it should and on heating, a meniscuscan remain when it should be gone. Thus, itshould be kept in mind that any measurement of
T, is probably an upper limit.
F. Coexistence curve of isobutyric acid + water
Two sets of data were taken —run 1 and run 2.All the data are listed in Appendix A. Run 1 wasmade within one month of the sample preparationand consists of 34 points taken while cooling thesample (see Fig. 1, open triangles). The samplewas stirred after each temperature change.few measurements were made while heating thesample (Fig. 1, solid triangles)„ these data wereconsistent with the cooling data, but showed morescatter, so they are not included in Appendix A orin the analysis. That the heating and cooling dataagree indicates that the data represent the equili-brium states within the resolution of the measure-ments. Bun 2, 26 points taken nine months afterthe sample preparation, consists of two differentcooling sequences which agree with one anotherwithin error.
Run 1 and run 2 do not have the same T„as de-termined from the statistical analysis below. Iattribute this change of T, to a leaching of impuri-ties from the cell walls. Fits were made to eachrun separately and to the combined set of 60 points(run 1 with run 2, allowing two critical tempera-tures). The fits were all essentially the same forboth runs; so only the fits for the combined dataset will be presented here.
The data analysis was done using a modifiedversion of Bevington's nonlinear least-squaresfitting program CURFIT4' and all computer com-putations were made in double precision. Theweighting of the data for the fits was made by thestandard methods of propagation of errors4' usinga computer program for the numerical differen-tiation of the function being fitted. These same
techniques were used for all the data analysis de-scribed in this paper. Uncertainties will be givenas three times the standard deviation (3o).
The determination of the standard deviations (o)for the density measurements included a correc-tion for the fact that densities near to the buoydensity were measured more precisely than weredensities further from the buoy density. From thecalibration equation given in the earlier discussionof the density measurements,
—= 2c(p- ps)Bp I/2av
cp = 2c( p- ps) ov
where c is a constant and a~=0.0003. These stan-dard deviations were used in the numerical pro-gram to weight the data.
The difference in order parameter of coexistingphases of isobutyric acid+water has been fittedusing two possible order parameters (density andvolume fraction) and two different functional forms(simple scaling with only one term and simplescaling with an additional correction term).
The results of the fits to the difference in den-sity of coexisting phases (4 p= p, —p„, where p„and p, are the densities of the upper and lowercoexisting phases at each temperature) are givenin Table I. The fit to the simple scaling form(function A, Table I) gives an apparent p of 0.309+ 0.004 and leaves systematic residuals. When acorrection term is added (function B, Table I), asignificantly better fit is obtained, but the valueof p (0.332+0.011) is higher than we expect for theIsing model.
We can compare the 4 p fit to the fit of ~x, thedifference in mole fraction of isobutyric acid, ob-tained by Stein and Allen' using the data of Woer-mann and Sarholz31 on isobutyric acid+ water.Stein and Allen find Ex= (0.695+0.10)a'""'o".if we assume an ideal mixture, then Sp/Bx= -0.11for this system. Then function A in Table I gives
0 48~ 0.309
At T, T=0.01'C, E-q. (9) gives Ax=0. 020, where-as the Stein and Allen expression gives 4x= 0.022+O.OOS, so that the two forms agree within error.
We have defined the volume fraction as
where V', is the volume of one pure component and
V,.„ is that of the mixture. Then at a given tem-perature
p= @,(pl p', )+ pl, -where p, and p', a,re the densities of the pure com-

14 COEXISTENCE CURVES AT LIQUID-LIQUID CRITICAL. . I 775
TABLE I. Results of fits to the differences in coexisting densities (~p) and volume fractions(~(It)) for isobutyric acid+water. Uncertainties are given at the 99k confidence level (30.). T,&
refers to the critical temperature for run 1 and &,2 to that for run 2. ~ is the average standarddeviation of &p or of &Q. & is (&, —&)/&~.
25.994~0.003
Tc2
25.969+0.003
0 ~ 053+0.001
Density fits
A. &p=B&80.309
+0.004
B)
3.2 x 10
&v2
2.8
25.999+0 ~ 003
25.999+0.002
25.999+0.003
25.973~0.003
25.974+0.002
25.973*0.003
B. ~p=B~ +B ~ ' 2, ~ =0.501 ~ 2
0.063 0.333 -0.048+0.005 +0.010 +0.023
Volume fraction fits
C. ~Q =B~~1.071 0.328
+0.023 +0.004
D. ay=B~ +B,~ + 2, Z, =0.501.04 0.324 0.17
+0.15 +0.018 +0.76
3.1x 10
5 ~ 5x 10
5 5xl0
1.6
1.4
1.4
ponents at that temperature, p is the density ofthe mixture, and the subscript 1 refers to isobuty-ric acid. It is not possible to convert each mea-sured p value to a ft), value because the p measure-ments are not sufficiently accurate. However, ac-curate values of p', and p', are available and can beused to obtain &@, from 4 p:
(12)
The density of water, po2(T), was taken from thework of Kell" and the density of isobutyric acid,p', (T), was obtained from a fit to unpublished databy Morrison and Knobler. " The values of &Q soobtained are given in the data list in Appendix A.Using Eq. (12), o» was taken to be -18a~, . Onedatum —the last point (22.404 'C) in run 2 —alwaysdeviated significantly from the curves fitted to the&P data and is omitted in the fits reported here.
The results of the fits to the difference in volumefraction are given in Table I, functions (. and D.A simple scaling form (function C) gives a good fitwith P = 0.328+ 0.004. A function including a cor-rection to scaling (function D) shows no improve-ment in the fit and indicates that the second termis not necessary. The value of P for the simplescaling form is quite consistent with theoreticalvalues for the Ising model.
From this analysis, the volume fraction seemsto be a better choice for an order parameter thanthe density because a better fit is obtained withthe simpler one-term function. For the volumefraction as order parameter, the value P= 0.328+0.004 is sufficiently close to that recently ob-tained very near the critical point in pure fluids"and to that obtained theoretically for Ising mod-els" " to conclude that binary-liquid mixtures
probably also have the asymptotic critical expon-ents of the Ising model. It is interesting that a pso like that of the Ising model is obtained in aregion of reduced temperature which is much lar-ger for this binary mixture (e & 6 x10 ') than it isfor pure fluids (&&10 ')."G. Diameter of the coexistence curve of isobutyric acid + water
The diameter of the coexistence curve, (p„+p, )/2, was fitted to a straight line:
( p„+p, )/2 = p, + C,e . (13)
After the removal of five rather randomly distributedpoints (22.404, 25.906, 25.925, 25.937, and 25.961'C) which were outliers, the remaining 55 pointsfit Eq. (13) very well, with quite random residuals.The outliers could result from the fact that someerrors (for example, a temperature gradient)might be partially cancelled in the difference 4p,but not in the sum (p„+p, ). For this fit, p,= 0.993 00 + 0.000 01, C, = 0.066 + 0.005, X '„= 1.97,and o = 1.19 &&10 '. T„, the critical temperature forrun 1, and T~, the critical temperature for run2, were fixed at 25.998 and 25.971, respectively.There is, therefore, no indication of the anomaly inthe diameter which has been predicted. "" Noanalysis was made of the diameter in the variablevolume fraction, (P", + @I)/2, because, as dis-cussed above, the quantities Q", and ft),
' cannot becalculated with sufficient accuracy.
A coefficient C, [Eq. (5)] of the anomalous termof unity would give a contribution at the level ofthe noise in these data at z = 5 @10 '. Thus C1 forisobutyric acid+ water must be less unity, since noevidence of an anomaly was seen in the diameter.

1776 SANDRA C. GREER 14
H. Thermal expansion above T, for isobutyric acid + water
P = P0+A16 +A2& (15)
with X'„=0.74, p0=0.993 57+0.00001, A,= -1.648+0.002, and A, = -0.449+0.065. Thus my data donot require an anomalous term.
New data with a resolution of 0.1 ppm in p haverecently been obtained on this system by Morrisonand Knobler, 49 who will soon publish a completestudy of these three sets of thermal-expansion dataon isobutyric acid + water. No further discussionof these data will be given here.
As the liquid-liquid critical point is approachedalong the critical isochore in the one-phase region,the volume or density is expected to show an anom-aly3& 39/ 50/5 1 ~
(14)
Klein and Woermann52 reported the observation ofsuch an anomaly in isobutyric acid + water. Theirmeasurements had a resolution of 1 ppm of thedensity.
Measurements of p(T) were made three monthsafter the sample preparation from 0.001 to 12'Cabove T, with a precision of about 20 ppm in den-sity. These data are given in Appendix B. Usingthe same weighting procedure described above forthe coexistence curve fits, I can fit p(e') [wherec'= (T T,)/T, ] -above T, (25.988'C) with no syste-matic deviations by a polynomial:
III. ANALYSIS OF THE COEXISTENCE CURVE OF
CARBON DISULFIDE + NITROMETHANE
Gopal and his colleagues' have measured the co-existence curve of carbon disulfide + nitromethanein the range 10 '& & &0.2 by visually observing thetransition temperatures of 70 samples of differentcompositions. They converted the mole fractionsof the samples to volume fractions. In their analy-sis of the data, Gopal etal. find that the data fit asimple scaling relation &Q =BE~, over the entirerange in E, with P=0.315+0.004 and 8 =1.64+0.01.They also observe an anomalous diameter of thecoexistence curve. ""
I also have analyzed these data on the coexistencecurve of carbon disulfide + nitromethane, using0~~ = 0.002 and o~ as one in the least significantplace given in the data list (0.001-0.1 'C). I havebeen unable to duplicate the fits which Gopal et al.report. The fits which I obtain for a simple scal-ing function using the entire data set show largesystematic deviations with P-0.29 and T, = 61.977C, which is less than that observed experimental-
ly (81.983 C).In my further analysis of these data, I have
omitted the data which might be affected by grav-ity" " (T, T &0.02 'C) and two points which wereoutliers. The 50 points which remain were thenfitted to various functions as shown in Table IIand in Figs. 2 and 3. T, was kept fixed at the ex-perimental value. Table II shows that the data
TABLE II. Results of fits to differences in volume fractions of coexisting phases of carbondisulfide+nitromethane. '
& is (T,—T)/T~. T, is fixed at 61.983'C. ' Uncertainties are givenat the 99% confidence level (30). 0, the average standard deviation of DQ, is 1.1 x 10 3.
E range B, B2 B3 2Xfj No. points
6 x 10 —0.002
6 x 10 &—0.02
6x10-" 0.2
6x10 5—0.2
0.316+0.010
0.322+0.004
0.294+0.011
0.352+0.009
A. QQ =B~81 66 ~ ~ ~ ~ ~ ~ ~ ~ ~
+0.131 73 ~ ~ ~ 4 ~ ~ ~ ~ ~
+0.031.53 ~ ~ ~ ~ ~ ~ ~ ~ ~
~0.05
B. AIIt =B&~+B,&8+ &2 = 0.502.14 —1.20 ~ ~ 0 ~ ~ ~
+0.10 +0.19
0.79
0.83
68
6 ' 5
14
24
50
50
6x10 "—02Dy =Be8+B e~++2+B a~+2+2, 6 =0.501 2 2
0.316 1.63 0.77 —2.4 3+0.008 +0.09 +0.31 +0.40
0.89 50
6x10 5 0.2
' Reference 3.
B~8+B ~8+ &2+B ~8+2D2+B ~8+362 ~ 0 50f 2 3 & 2
0306 149 1 59 -4 9 2 7 076+0.014 +0.17 +0.89 +2.5 +2.8

14 COEXISTENCE CURVES AT LIQUID-LIQUID CRITICAL. . 1777
+10-
0 I ~ I
-4 -3~ e ~ g
rQ0
~0I I I I~ k yy I ~
~ g 2 -1~ 0
(a) 5j --- BE P
E &0.2+4
~ k~ ~~ ~ ~
+2 — ~
«3 -2 -1
{a) 6& = BE + 8 Q+Q
~ p
-10-
-20—
~ ~~ r ~
~ ~~ I
~ g
~k
+2-O +1
O kI0 4
kkk
I II
I k ~
I I Ik -2k
kk
kk
(b) ay =- BE.~
E & 0.02b +2-
+1C3 k
0k
CLx -1-UJ
-2-CI
k~ k
k k
kk
kkR
k
kkkk
(b) by = BE +8,6 '+B,E
+1
1 ~4 ~
(c) 5p BEE C 0.002
+2-
+1-J
~ ~-1 -
~
-2-
g ~8
~ ~~ a~ ~
~ +Q
~ ~
~ y~ ~
(c) Dp = BE~+8,E~ +B,E +B,E
LOG E
FIG. 2. Residuals from simple scaling fits over vari-ous ranges in E [E = (T, —T)/T, j for the coexistence curveof carbon disulfide+nitromethane (Ref. 3): (a) «0.2;(b) «0.02; (c) «0.002. See Table II, function A, forthe parameters in these fits. o.; is the estimated stan-dard deviation for each point. Fits (b) and (c) in thisfigure show a slight systematic deviation at & - 10 3 which
may be due to experimental artifacts.
over the entire range 6 &&10 ' & & &0.2 still cannotbe fit by a one-term function (A) or even by twoterms (function B—simple scaling with one cor-rection term). Function C, simple scaling withtwo correction terms (five free parameters plusT, and &2), gives a very good fit to the data. Func-tion C also gives a value of J3 which is consistentwith the Ising value. ""
Function D includes yet another correction term,so that it allows six free parameters (plus T, and
The ii„'is not very much reduced by the addi-tion of this term. Indeed, an I test" indicatesthat the probability of y „' being so changed bychance is greater than 50%. Thus the inclusionof the fourth term is not justified by these data,and function C gives the best fit to the data.
Since the coefficients of such an expansion arehighly correlated, one wonders about the effectsof truncating the series. Since the Wegner expan-sion is an asymptotic expansion, "one wonders
LOG E
FIG„3. Residuals from fits to functions with correc-tion terms for the coexistence curve of carbon disulfide+nitromethane (Ref. 3). E is (T, —T)/T, . o.; is the esti-mated standard deviation for each point. See Table II,functions 8—D, for the parameters in these fits.
whether we may have exceeded its range of valid-ity. These two points can be checked to some ex-tent by comparing the three term fit (C, Table II)to one term fits in reduced ranges of e (A, TableII). When the range is reduced to &&0.02, thesimple scaling form suffices. The X'„ thus ob-tained is not significantly different from that fora fit of the entire data set with function C. Mostimportantly, the values of Js and B for the asymp-totic one-term fits agree quite well with the val-ues obtained for the leading term in the Wegnerexpansion, which gives us more confidence in thevalues for P and B. The asymptotic regime forCS, + nitromethane (e &0.02) is not very differentfrom that obtained above for isobutyric acid +water (e &0.006).
By this analysis, the differences in volume frac-tion of coexisting phases of carbon disulf ide +nitromethane can be fit over the range 6 @10 '&» &0.2, where &(t) at & = 0.2 is measured to 0.1%,by an expansion of simple scaling with two cor-
rection terms" and with an asymptotic P valueclose to that of the Ising model.
IV. CONCLUSIONS
I.et us summarize the main conclusions fromthe above work. (1) The volume fraction is a bet-ter choice than is the mass density for the orderparameter of a binary-liquid mixture. (2) Theasymptotic exponent P for liquid-liquid criticalpoints is close to that obtained in the most recentcalculations for the Ising model"" and close tothat obtained very near liquid-gas critical points. '-o
(3) The asymptotic range for p seems to extend toa larger range of reduced temperat re for t eseliquid-liquid critical points than it does for liquid-gas critical points. "-'-"' The data over an ex-tended range are consistent with %egner's correc-tions to asymptotic scaling. -'
The result that the asymptotic range for liquid-liquid critical points may be larger than for gas-liquid critical points deserves further considera-tion. Bowlinson" has commented that binary mix-tures may be more like the Ising model than are
pure fluids because the occupation of sites by twocomponents is more like the occupation of sites bytwo spin orientations than is the occupation by aparticle and a vacancy; i.e., the two componentshave a more symmetrical relationship than do aparticle and a hole.
The result that binary fluids, like pure fluids, "are asymptotically like the Ising model supportsthe hypothesis that all these systems belong to thesame universality class."
ACKNOW/ LEDGMENTS
I thank G. Morrison and C. M. Knobler for theisobutyric acid and for the use of their measure-ments of the density of isobutyric acid. I thankB. Mundy for his measurement of the permeabilityof Hy-Mu. E. S. B. Gopal and his colleagues weremost gracious in allowing me to examine their dataon carbon disulfide + nitromethane. I have hadespecially valuable discussions with B. Hocken,P. C. Hohenberg, and M. S. Green and have bene-fited greatly from the stimulating environment ofthe Equation of State Section, NBS.
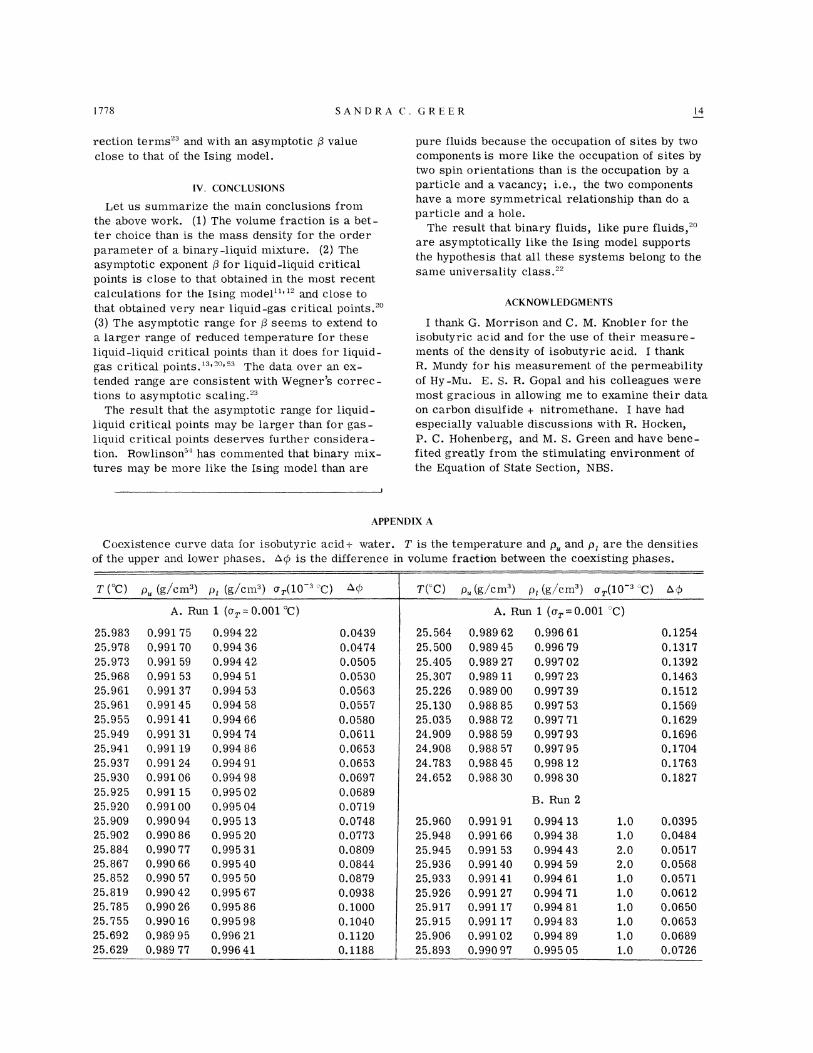
APPENDIX A
Coexistence curve data for isobutyric acid+ water. T is the temperature and p„and p, are the densitiesof the upper and lower phases. ~P is the difference in volume fraction between the coexisting phases.
T ('C) p„(g/cm') p, (g/cm') or(10 ' "C)
A. Bun 1 (o'r = 0.001 'C)
T( C) p„(g/cm') p, (g/cm') or(10 ' C) nP
A. Run 1 (o'r = 0.001 'C)
25.98325.97825.97325.96825.96125.96125.95525.94925.94125.93725.93025.92525.92025.90925.90225.88425.86725.85225.81925.78525.75525.69225 ~ 629
0.991 750.991 700.991 590.991 530.991 370.991450.991410.991 310.991 190.991 240.991060.991 150.991000.990 940.990 860.990 770.990 660.990 570.990 420.990 260.990160.989 950.9S9 77
0.994 220.994 360.994 420.994 510.994 530.994 580.994 660.994 740.994 860.994 910.994 980,995 020.995 040.995 130.995 200.995 310.995 400.995 500.995 670.995 860.995 980.996 210.996 41
0.0439Q Q4740.05050.05300.05630.05570.05800.06110.06530.06530.06970.06890.07190.07480.07730.08090.08440.08790.093S0.10000.10400.11200.11SB
25.56425.50025.40525.30725.22625.13025.03524.90924.90824.78324.652
25.96025.94825.94525.93625.93325.92625.91725 ~ 91525.90625.893
0.989 620.989 45Q.989 270.989 110.989000.988 850.98S 720.988 590.988 570.988 450.988 30
0.991910.991660.991 530.991400.991410.991 270.99117Q.991 170.991020.990 97
0.996 610.996 790.997 020.997 230.997 390.997 530.997 710.997 930.997 950.998 120.998 30
0.994 130.994 380.994 430.994 590.994 610.994 710.994 810.994 830.994 890.995 05
1.01.02.02.01.01.01.01.01.Q1.0
0.12540.13170.13920.14630.15120.15690.16290.16960.17040.17630.1827
0.03950.04840.05170.05680.05710.06120.06500.06530.06890.0726

COEXIS TENCE CURVES A f LIQUID-Lrg UILi CRI TIDAL. . 1779
T('C) p„(g/cm') p, (g/cm') or(10 ' C}
B. Run 2
T ( C) p„(g/cm } pi (g/cm ) or(j0 "C)
B. RUIl 2
25.89225.88525.86625.77025.69925.58325.50925.398
0.990 940.990 890.990 810.990 310.990 020.989 690.989 500.989 29
0.995040.995 160.995 220.995 760.996 110.996 430.996 6V
0.996 93
2.02.01.01.01.02.01.01.0
0.07300.07610.07850.09730.10890.12090.12870, 1372
25.31825.21125. 3.2825.02424.93924.55'7
24. 17722.404
0.989 200.988 980.988 880.988 730.988 620.988 270.987 980.987 21
0.997 140.997 290.997 530.997 660.997 770.998 340.998 781.000 54
2.02.01.02.01.02.01.01.0
0.14300.15000.15630.16180.16600.18440, 12000.2625
APPENDIX 8
Density (p} as a function of temperature (T) in the one-phase region above the transition temperature inisobutyric acid+ mater. The mole fraction of isobutyric acid is 0.110. 0~=0.001 'C.
T(f:)37.79336.85135.74734.63133.514
32.40631.29730.18929.21628.534
28.25227.42326.87026.83926.807
26.75926.71126.662
p (g/cm')
0.986 360.986990.987 730.988 440.989 10
0.989 810.990 500.991170.991 730.992 13
0.992 31.
0.992 770.993 080.993 110.993 12
0.993130.993 170.993 20
T (-'C)
26.61426.567
26.52026.47126.42126.37326.327
26.281.26.21826.16826.12126.071
26.02526.01025 ~ 99325.99125.989
p (g/Lm'")
0.993 270.993 310.993 330.993 360.993 39
0.993 410.993 440.993 470.993 500.993 52
0.993 540.993 560.993 570.993 540.993 52
'H. I . Scott, Her. Bunsenges. Phys. Chem. '6, 296(1972).
H. L. Scott, in Specialist Periodical Reports, ChemicalThermodynamics, edited by M. L. McGlashen (TheChemical Society, London, to be published), Vol. II.
--E. S. H. Gopal, B. Bamachandra, and P. Chandra Sek-har, Pramana l. , 260 (1973); E. S. B. Gopal, B. Bama-chandra, P. Chandra Sekhar, K. Govindarajun, andS. V. Subramanyam, Phys. Bev. Lett. 32, 284 (1974).
A. Stein and G. F. Allen, J. Phys. Chem. Bef. Data 2,443 (1974). This survey includes the very careful workof A. N. KVims, D. McIntyre, and F. Hynne IJ. Chem.Phys. 50, 616 {1969)Jon nitroethane+3-methylpentaneand that of D. B. Thompson and 0. K. Bice fJ. Am.
Chem, Soc. 86, 3,~47 (1964)j on carbon tet, rachloride+ pe rduo rom ethylcyciohoxano „
'-I. H. Hildebrand, J. M. Prausnitz, and B. I. Scott,Regular and Related Solutions (Van Nostrand Reinhold,Ne;v York, 1970), p. 166—1 3,
GJ. B. Qilmour, J. O. Zwicker, J. Katz, and B. L. Scott,J. Phys. Chem. f'1, 3259 (1967).
7M. Simon, A. A. Fannin, and C. M. Knobler, Her. Bun-senges. Phys. Chem. 76, 321 (1972).
~T. D. Lee and C. N. Yang, Phys. Hev. 87, 410 (1952).M. E, Fisher, Hep. Prog. Phys. ~0, 615 {1967).
' C. Domb, in Phase Transitions and Critica/ Phenorn-ena, edited by C. Domb and M. S. Green (Academic,r'~Tew York, 1974), Vol. 3, p. 433; P. Fl. E. Meijer and

SANDRA C. GREE R 14
B. A. Farrell [Phys. Rev. B 12, 243 (1975}]findP= 0.314 by applying Pade approximants to the Isingmodel.
'~L. P. Kadanoff, A. Houghton, and M. C. Yalabik, J.Stat. Phys. 14„171(1976). The numbQI quoted herediffers from that in the paper and is a corrected figureobtained by private communication with L. P. Kadanoff.
'G. A. Baker, Jr. , B. G. Nickel, M. S. Green, and D. I.Meiron, Phys. Bev. Lett. 36, 1351 {1976}.See alsoG. H. Golner and E. H. Riedel, Phys. Lett. {to be pub-lished}.
-"J. M. EI. Levelt Sengers, J. Straub, and M. Vincentini-Mlssonl, , J. Chem. Phys. 34, 5034 (1971).
' J. M. H. Levelt Sengers, Physica 73, 73 (1.974).~'J. M. H. Levelt Sengers, in Experimenta/ Therrno-
dynamics of Non-react&kg 5'/uids (Butterworths, Lon-don, 1975), Vol. II„p. 657.
~~J. M, H. Levelt Sengers, W. L. Greer, and J. V. Sen-gers, J. Phys. Chem. Hef. Data 5, 1 (1976).
' C. W. Garland and J. Thoen, Phys. Hev. A 13, 1601(1976).
"-3L. B. Wilcox and D. Balzarini, J. Chen~. Phys. 48, 753(1968).
' W. T, Estler, B. Hocken, T. Charlton, and L. R. Wil-cox, Phys. Hev. A 12, 2118 (1975).
"OH. Hocken and M. H. Moldover, Phys. Bev. Lett. 37,29 (1976).M. Nakata, N. Kuwahara, and M. Kaneko [J. Chem.Phys. 62, 4278 (1975)] have measured the coexistencecurve for polystyrene+cyclohexane. They find an ap-parent P of 0.348 +0.002, but they point out that themolecular weight distribution of the polystyrene couldcause P to be increased. D. Balzarini [Can. J. Phys.52, 499 (1974}]found P=-0.328&0.007 for the differencein refractive index for aniline +cyclohexane; while hisdata may have been subject to gravity effects, his re-sults foretold the conclusions reached in this work.
isher, Phys. Bev. Lett. 16, 11 (1966); PWatson, J. Phys. C 2, 1883 (1969); 2, 2158 (1969);D. Jasnow and M. Wortis, Phys. Hev. 176, 739 (1968);L. P, Kadanoff, in Critica/ Phenomena, Proceedingsof the International School "Enrico Fern&i, " edited byM. S. Green (Academic, New York, 1971); H. B. Grif-fiths, Phys. Bev. Lett. 24, 1479 (1970); D. Stauffer,M. Ferer, and M. Wortis, Phys. Hev. Lett. 29, 345(1972); K. G. Wilson and J. Kogut, Phys. Hept. 12C,76 (1974).F. J. Wegner, Phys. Bev. B 5, 4529 (1972). I am in-debted to M, Ley-Coo and M. S. Green for providingme with detailed expressions of Wegner's expansionfor fluids.
24B. Widom and J. S. Bowlinson, J. Chem. Phys. 52,1670 (1970).
~5P. C. Hemmer and G. Stell, Phys. Hev. Lett. 24, 1284(1970); J. Chem. Phys. 56, 4274 (1972}.
2~N. D. Mermin, Phys. Hev. Lett. 26, 169 (1971); 26,957 (1971).
~'M. S. Green, M. J. Cooper, and J. M. H. Levelt Sen-gers, Phys. Rev. Lett. 26, 492 (1971).
28N. D. Mermin and J. J. Behr, Phys. Hev. Lett. 26,
1155 (1971}.2 J. Weiner, K. H. Langley, and N. C. Ford, Jr. , Phys.
Bev. Lett. 32, 879 (1974); D. Yu. Ivanov, L. A. Maka-revich, and O. N. Sokolova, Zh. Eksp. Teor. Fiz.Pis'ma Red. 20, 72 (1974) [JE'1P lett. 20, 121(1974)].
' Commercial names are used for completeness and
their use does not indicate an endorsement by theNational. Bureau of Standards.
'D. Woermann and W. Sarholtz, Ber. Bunsenges. Phys.Chem. 69, 319 (1965).
32B. Chu, F. J. Schoenes, and W. P. Kao, J. Am. Chem.Soc. 90, 3042 {1968}.
3~B. Chu, F. J. Schoenes, and M. E. Fi.sher, Phys. Hev.185, 219 (1969).H. Klein and D. Woermann, J. Chem. Phys. 62, 2913(1975).
35P. M. Gammell and C. A. Angell, J. Chem. Phys. 60,584 (1974).
3 C. S. Bak and W. I. Goldburg, Phys. Bev. Lett. 23,1218 (1969).
3~M. E. Fisher and P. E. Scesney, Phys. Rev. A 2, 825(1970).
~8S. C. Greer, M. R. Moldover, and B. Hocken, Bev. Sci.Instrum. 45, 1462 (1974).
3"S. C. Greer and B. Hocken, J. Chem. Phys. 63, 5067(1975).
4 Hewlett-Packard Application Note No. 14, 'TemperatureMeasurements" (unpublished) „
4'A. A. Fannin, Jr. and C. M. Knobler, Chem. Phys.Lett. 25, 92 (1974).
42S. C. Greer, T. E. Block, and C. M. Knobler, Phys.Bev. Lett. 34, 250 (1975).M. Giglio and A. Vendramini, Phys. Hev. Lett. 35, 168(1975).
44D. Jasnow and W. I. Goldburg, and J. S. Semura, Phys.Bev. A 9, 355 (1974).J. Timmermans, J. Chim. Phys. 20, 491 (1923).
4~8. Chu, S. P. Lee, and W. Tscha. rnuter, Phys. Rev.A 7, 353 (1973).
7P. B. Bevington, Data Aednction and Error Ana/ysisfor the Physical Sciences (lVIcGraw-Hill, New York,1969).G. S. Kell, J. Chem. Eng. Data 20, 97 (1975).G. Morrison and C. M. Knobler, unpublished r;.suits.Five measurements of the density of pure isobutyricacid between 26.17 and 27.03'C were fit by the equationp(g/cm ) =- 1.08998 —0.0104T+ 0.0001780T (where T istemperature in 'C} with a standard deviation for the fitof 1&10 '
g/em .A. B. Pippard, Classica/ Thermodynamics {Cambridge,London, 1966), Chap. 9.
5'B. B. Griffiths and J. C. Wheeler, Phys. Hev. A 2, 1047(1970).
'-' H. Klein and D. Woermann, J. Chem. Phys. 62, 2913(1975).
5~Sandra C. Greer and J. M. H. Levelt Sengers, unpub-lished results.
54J. S. Howlinson, private communication.