coface panorama-france+27-11-2015
TRANSCRIPT

enuous but confirmed.These are the terms thatbest describe France’s cur-rent growth - as illustratedby the figures for the thirdquarter, published in early
November. Household consumption hasincreased, even if only modestly, due togains in purchasing power as a result ofalmost zero inflation and despite theever-rising unemployment rate. Corpo-rate investment has also risen, but at aless rapid rate than the majority ofFrance's neighbours and at a slowerpace than has been historically observedduring phases of economic recovery.External support from reduced oil pricesand government measures, such as theTax Credit for Competitiveness and
Employment (CICE) , are also helping torestore company margins.
The change in company insolvenciesshows that they have begun to takeadvantage of the effects of this tentativerecovery. Insolvencies have now fallenfor three consecutive half-years, regard-less of company size. Companies are,however, still faced by cloudy weather insome areas, for example in the Centreand Auvergne regions, where the num-ber of insolvencies are still rising, and inthe Ile-de-France, where they remainstable.
Coface’s sector analysis of France high-lights these persistent risks. While mostof the sectors have a similar risk level to
those of the European average, thetransport and construction sectors aremore risky. Despite the fall in oil prices,France’s transport sector is ranked ashigh-risk, a notch above its Europeancounterparts.
Construction remains the Achilles’ heelof the French economy. Moreover, whilenew housing sales have certainly risen in2015, we remain cautious as prices haveonly been slightly adjusted downwardssince 2008, pointing towards a newdrop in 2016. Lastly, segments are suf-fering from the divestiture of publicplayers and regional disparities remainstrong. The sector’s insolvencies in theIle-de-France and Rhone Alpes regionsremain in the red.
T
November 2015PANORAMA France
2Part 1
Macroeconomicsituation
6Part 2
Company insolvencies
8Part 3
Sector risk
11Part 4
Focus onconstruction
By Coface Group EconomistsCOFACE ECONOMIC PUBLICATIONS
ALL OTHER GROUP PANORAMAS ARE AVAILABLE ONhttp://www.coface.com/News-Publications/Publications

NOVEMBER 2015
FRANCE OVERVIEW THIRD QUARTER 2015
Khalid AIT YAHIAEconomist
Guillaume BAQUÉEconomist
Paul CHOLLETHead of sectors and insolvencies
Guillaume RIPPE-LASCOUTEconomist
MACROECONOMIC SITUATION: very gradual improvement
1
2 PANORAMA
GROUP
Activity picking up
France returned to growth in Q3 2015 (+0.3%). This resultconfirms the positive dynamics recorded in HY1, despite zerogrowth in Q2. This result is due to the dynamism of householdconsumption, at +0.3%, (lower than the 0.5% forecast byCoface - see methodology, page 3) and also due to invest-ment, at +0.1%. Companies seem inclined to invest again. The only downsides are that State and household invest-ments are still penalising the gross fixed capital formation.
Although the euro rose very slightly against the dollar (+1%)between 1 July and 1 October 2015, foreign trade has beenmarked by a sharp fall of 26% in the price per barrel of oil indollars. Net exports fell by 0.1%, as the fall in hydrocarbonprices was followed by bulk purchasing in order to build upstocks at low prices. Moreover, stocks have contributed 0.7 percentage points to growth. These stocks are mainlytransport equipment.
Graph n° 1.1
Quarterly growth in France (quarterly change)
Source: Insee
Q4 -2012
Q1 -2013
Q2 -2013
Q3 -2013
Q4 -2013
Q1 -2014
Q2 -2014
Q3 -2014
Q4 -2014
Q1 -2015
Q2 -2015
Q3 -2015
0.1
0.0
0.0
0.3
0.8
0.7
-0.1 -0.1
0.3
0.10.2
-0.2
Growth buoyed by industry and services
Industry has positively contributed to activity, partly due tothe dynamism of the transport equipment (+0.4%) andenergy (+0.3%) sectors. Services have also boosted growth,in particular market-related services (+0.4%), as well asthose linked to information and communications (+1.1%),transport (+0.6%) and trade (+0.6%).
As a consequence of the liberalisation of milk quotas andstrong pressure on prices, agricultural activity has been negatively affected (-0.4%). Activity in the construction sector is down for the ninth consecutive quarter (-0.8%).However, several signs of improvement could reverse thistrend (see focus on construction, page 11).
Graph n° 1.2
Breakdown of growth by segment of activity
Source: Insee
0.4
-0.4
-0.8
0.2
0.2
0.3
Market-related services
Non-market services
Industry
Construction
Agriculture
Total

3PANORAMA
GROUP
Modest upturn in household consumption
After a net cessation in Q2 2015, linked to the fall in energyexpenditure (-2.1%) and a contraction in clothing sales (-1.9%), growth in consumption picked up again in Q3(+0.3%). Household goods consumption in fact rose by0.7%, boosted by sales of home equipment, which con-tributed 0.3 percentage points.
Nevertheless, according to Coface, growth in consumptioncould slow to 0.2% in Q4. We estimate that food purchaseswill penalise activity (meat consumption notably fell back inQ3). Sales in the automotive sector (see the sector risk sur-vey on page 8)will be the main contributor to growth in con-sumption. As a consequence of buoyant confidence, employ-ment figures have improved somewhat. Although unem-ployment increased during Q3, standing at 10.7% of theworking population in September 2015, the trend nowseems downwards orientated. The number of vacancies atthe end of September 2015 was 235,000 (compared to217,000 on average in 2014). This is the highest level since2012.
Household disposable income is increasing
Gross household disposable income has been on a risingtrend since Q1 2014. The further fall (26%) in oil barrelprices between 1 June ($64) and 30 September ($47) hasimproved the disposable income of French households, byreducing energy bills and by participating towards furtherdownwards pressure on prices. In this context, the amountallocated to consumption expenditure has increased,although the rate of household savings remains high andstable (15.1% of disposable income in Q2). Outstandingconsumer loans sharply increased in Q3 (+4.2% at the endof September) underlining the willingness of householdsto acquire and take advantage of low interest rates (4.3%on average at the end of September 2015 for consumercredit loans).
Graph n° 1.3
Household consumption at the end of October 2015
Graph n° 1.4
Household disposable income, YoY
-0.1
0.9
0.6
0.5 0.4 0.41.5 0.8 0.8 1.3 1.5
1.6 1.6
0.40.3
-0.2
0.2
0.70.80.8 0.9
0.6
1.01.6
2.0
-0.1
0.20.3
0.6
-0.4
0.4 0.4
0.2
0.8
0.3
0.0
3
2.5
2
1.5
1
0.5
0
-0.5
-1
-1.5
-2
-2.5
3
2
1
0
-1
-2
-3
Q4 -2012
Q1 -2013
Q2 -2013
Q3 -2013
Q4 -2013
Q1 -2014
Q2 -2014
Q3 -2014
Q4 -2014
Q1 -2015
Q2 -2015
Q3 -2015
Q4 -2015
Q3 -2012
Q4 -2012
Q1 -2013
Q2 -2013
Q3 -2013
Q4 -2013
Q1 -2014
Q2 -2014
Q3 -2014
Q4 -2014
Q1 -2015
Q2 -2015
Household consumption, QoQ
Household consumption, 3Mo3M
�
�
�
�
� �
�
� �
�
�
�
�
Disposable income
Inflation
Real income
Source: Insee
Sources: Insee, Coface
Methodology
Coface forecasts each component of GDP demand. Quarterly consumption is forecast monthly via two vectorautoregressive models (VAR). Firstly, in addition to the consumption (consm) of the two preceding months,explanatory variables are job vacancies (Emp) and household confidence (Conf) from the previous month.
Secondly, quarterly consumption is then explained from the two previous quarters and estimated consumption(cons3m) from the three months forming the quarter by model 1.
3Consqt= a1 Consq
t–1 + a2 Consqt–2 + a2 Cons3m
t+
3Consmt= a1 Consm
t–1 + a2 Consmt–2 + a3 Emp
t–1 + a4 Conft–1 +

Graph n° 1.6
Comptes des sociétés non financières
Source: Insee
4 PANORAMA
GROUP
Rise in corporate margin rates
Companies have regained margins (31.1%) (1), particularly as aresult of the first effects of the CICE(2) and the fall in oil barrelprices (which has reduced energy bills, particularly for theagricultural, transport and industry sectors). Company profitmargins are two percentage points higher than for Q2 2014.A sign of improved financial health (see company insolvenciessection, page 6) is that the rate of corporate investment beganto grow in Q2. Furthermore, the capacity of companies to self-finance(3) is at its highest since 2006 (85.3% in Q2 2015).
According to the Banque de France quarterly survey on com-panies concerning their access to credit, the demand for newinvestment loans from SMEs (22% requested loans in Q3) fellvery slightly in Q3 compared to Q2 (24%), but is still higherthan for previous quarters. The study shows that 92% of SMEsobtain the financing they request, while financing-related coststend to be lower. The results are almost identical for interme-diate-sized companies.
(1) Operating income to value added ratio.(2) The tax credit is equivalent to 6% of the wage bill of a company excluding wages exceeding 2.5 times the SMIC (minimum wage).(3) Ratio of gross savings to the gross fixed capital formation.
32%
31%
30%
29%
23.5%
23.0%
22.5%
22.0%
Q3 -2012
Q1 -2013
Q3 -2013
Q1 -2014
Q3 -2014
Q1 -2015
Investment rate
Margin rate, RS
Only the corporate investmenthas helped the growth
Investment grew by 0.1% in Q3 2015, driven by a rise infixed capital expenditure by non-financial companies(+0.7%). Domestic property expenditure continues toaffect activity (-0.5%, see focus on construction, page 11),although this is a significantly lower fall than those seenduring the first two quarters (-0.8% and -1.1% respectively).
With industrial production increasing since last August,investment should remain in positive territory in Q4, butfar from pre-crisis levels (+4% average annual ratebetween 2004 and 2007) and far below those of France’smain European partners. Coface forecasts that for 2015,investment in France will fall by 0.5%, whereas it willincrease by 0.7% in Italy, by 1.2% in Germany and by 6% inSpain. Still below its pre-crisis levels (84% in 2007), theutilisation of production capacity is nevertheless increas-ing (77.7% at the end of October 2015, compared to 75%at the end of 2013). This rate reflects a supply capable ofmeeting higher demands. The rate of increase in consump-tion in 2015 (1.6%, according to Coface) is in fact 0.5 per-centage points lower than the 2003-2007 average of 2.1%.The motivation behind industrialists’ investments has moreto do with ageing production equipment than in meetingdemand.
Graph n° 1.5
Formation brute de capital fixe
-0.4 -0.4
101
100
99
98
97
96
Q4 -2012
Q1 -2013
Q2 -2013
Q3 -2013
Q4 -2013
Q1 -2014
Q2 -2014
Q3 -2014
Q4 -2014
Q1 -2015
Q2 -2015
Q3 -2015
Q4 -2015
Source: Insee
0.4
0.1 0.1
-0.7
-0.6
-0.4
-0.2-0.1
0.20.1
Investments, QoQ
Industrial production, index, RS

Graph n° 1.7
Change in the real effective exchange rate of France
Graph n° 1.8
French economy growth forecasts
Sources: Reuters, OECE
Source: Coface
A sudden stop for French export companies
The fall in the euro in 2014 has helped European compa-nies to increase their competitiveness. In Q3 2015, the dis-ruption in emerging economies and the US FederalReserve’s wait-and-see approach with regards to a changeof direction in monetary policy, have both contributed toan improvement in the French real effective exchange rate- to the detriment of exports. Despite the further fall in theprice of oil (-27%) in Q3, which has reduced the price ofimported products, the spike in hydrocarbons has led to a0.1% drop in net exports.
The impact of the CICE on export companies is, in theory,positive, because it lowers the cost of work and restorescompetitiveness. In Q2 2015, the cost of an hour of workin the manufacturing sector (¤37.47) became lower thanin Germany (¤39.53). Nevertheless, the services sector isthe main beneficiary of the CICE whereas industry, whichis more externally focused, has a lower base for benefits.Less than 40% of the salary costs for the pharmaceutical,chemicals and refining sectors are eligible for this credit.
French economy growth forecasts
Coface forecasts growth in the French economy of 1.1% in 2015. Household consumption, at 0.8%, and public consumption, at 0.4%, will be the main contributors.Investment will slightly affect growth, in line with the fallsin public and household investments.
In 2016, Coface expects an acceleration of activity, at+1.4%. Investment will contribute positively to growth forthe first time since 2012 (0.3 percentage points). As in2015, consumption will be the main driver of the increasein activity (+0.7 percentage points). Unemployment willcontinue to gradually decrease, but will remain above 10%.
1.45
1.4
1.35
1.3
1.25
1.2
1.15
1.1
1.05
1
102
100
98
96
94
92
90
88
4%
3%
2%
1%
0%
-1%
-2%
-3%
-4%
Dec. 2013
Feb. 2014
April 2014
June 2014
Aug. 2014
Oct. 2014
Dec. 2014
Feb. 2015
April 2015
June 2015
Aug. 2015
Oct. 2015
France : Real exchange rate
Euro dollars, RS
��
�
�
�
�
��
1.9%2.1%
0.2%
0.7%
0.2%
1.1%1.4%
2010 2011 2012 2013 2014 2015 2016
InvestmentNet exportsInventories
Public consumptionPrivate consumptionGDP
Forecasts
5PANORAMA
GROUP

(4) "Number of companies and establishments on 1 January 2014 – Total field", October 2015, INSEE (excluding the French overseas departments and territories). (5) Weighted reduced annual average, 1% of observations on extremes below or above the distribution are excluded to give a truer picture of average sales.
Volatile data due to industrial action by the com-mercial courts
In 2015, data on bankruptcies has been particularly volatile,due to industrial action by commercial courts in December2014 and in May 2015, which reduced the activity of clerks’offices. The delay in procedures during these two months istherefore followed by increases in data during the followingmonths, as was the case for March and June 2015.
In October 2015, some 5,047 company insolvencies wererecorded, showing an 18.4% fall compared to the sameperiod in 2014. Over the past three months the trend is iden-tical, with a 10.71% reduction year-on-year.
Reduction in the average size of insolvencies
The fall in the number of company insolvencies is accom-panied by a fall in the average size, measured by averagesales (5), which was ¤578,000 at the end of October, downby 3.2% year-on-year. This is equivalent to the level beforethe crisis and shows a return to normality. In addition, the average age of company insolvencies stabilised at 106months in October 2015, after a historic record in August ofthe same year (107 months year-on-year). Over the pastthree months, the largest company insolvencies were thetour operator FRAM (Sales: ¤373 million), the electricalappliances distribution hub LOGITEC (Sales: ¤132 million)and textile manufacturer CENTRAL'VET, better known underits trade name Vet'affaires, (Sales: ¤113 million).
Graph n° 2.2
Monthly change in company insolvencies
Graph n° 2.3
Annual change in company insolvencies and average sales
(in thousands of euros)
6 PANORAMA
GROUP
COMPANY INSOLVENCIES: down for the second year
2
The number of insolvencies continues to fall
Since the high recorded in April 2014, company insolven-cies have continued to fall in France. At the end of October2015, some 61,143 companies in one year were faced withinsolvency procedures. This represents an annual fall of4.8%. The total cost of insolvencies, calculated as the sumof the outstanding amounts of trade payables, reached¤3.6 billion, down 20% year-on-year. The number ofemployees affected also contracted, by 4.8%, to 162,625.Thus, the two main indicators (that are the cost and num-ber of jobs under threat) will fall by the end of 2015. How-ever, with on average 46,000 company insolvenciesbetween 2000 and 2006, the level is still high. Neverthe-less, company creations, excluding auto-entrepreneurs,rose sharply year-on-year, to total 294,156. The total num-ber of companies has therefore increased by 31% since2005 (4). In other words, the ratio between the number ofinsolvencies and the number of companies returned, in2013, to its 2005 level (1.41% compared to 1.42%).
Graph n° 2.1
Change in insolvencies and company creations (In thousands, annual)
Sources: Scores & Décisions, Coface, Insee
Sources: Scores & Décisions, Coface
66
64
62
60
58
7,000
6,000
5,000
4,000
3,000
2,000
1,000
14%
12%
10%
8%
6%
4%
2%
0%
-2%
-4%
-6%
1 000
800
600
400
200
0
-200
-400
300
290
280
270
260
250
2402010 2011 2012 2013 2014 2015
2010 2011 2012 2013 2014 2015
Business creation (RS)
Insolvencies
2012
2013
2014
2015
January
February
March
April
May
June
July
August
September
October
November
December
Sources: Scores & Décisions, Coface
Average turnover (RS)
Number
-4.8

(6) See methodology, "Company bankruptcies in Western Europe: the lull is confirmed in 2015", Coface, September 2015.
The smallest companies are still over-represented
The rise in insolvencies at the end of 2013 was accompa-nied by a sharp increase in company insolvencies withsales of over ¤10 million, with a peak in August 2013 of 296companies. This segment is now on a continued decreas-ing trend and, at 222 companies, is moving closer back tothe levels seen at the start of 2011. While a reduction ininsolvencies has been observed in the entire sales segmentsince 2014, the number of companies with sales of lessthan ¤500,000 (74% of insolvencies for which financialdata are available) still remains 20% higher than the 2011level. We also note a fall in insolvencies of companies withsales of between ¤2.5 and ¤5 million (1.2% of insolvencies),which was 5.0% for the year to the end of October 2015.
Graph n° 2.4
Change in insolvencies by sales segment
(millions of euros, 100 = January 2011)
An improvement in nearly all regions
During the twelve months to the end of October 2015, company insolvencies increased only in the Centre (+1.7%)and Auvergne regions (+1.4%), while they remained stablein the Ile-de-France. Conversely, there were 14 regions whereinsolvencies fell by over 5%, notably in Brittany (-12.7%),Aquitaine (-10.7%) and Languedoc (-10.2%).
The Ile-de-France region accounts for 20.4% of the insolven-cies in mainland France, which is similar to the weighting ofParis companies in France, at 21.4% in 2013. The reason whythe Ile de France region does not follow the national fall ininsolvencies can be explained by the decline in the construc-tion (+5.9%, see focus on construction, page 11) and personalservices sectors (+6.8%). In detail, it is the sub-sector ofmasonry that is the most affected, with a 20.3% rise inOctober 2015 (masonry accounts for 20% of insolvenciesin the construction sector in Ile-de-France).
Graph n° 2.5
Insolvencies in France
(12 rolling months, October 2015)
Forecast for company insolvencies in 2015
According to our forecast model (6), the number of companyinsolvencies will fall by 2.5% in 2015, continuing on from the2.8% fall in 2014. Companies have benefited from a slightimprovement in the economic situation (see part 1, page 2).This less significant fall than that recorded at the end ofOctober is explained by a base effect. In fact, while inDecember 2014 the strikes by commercial courts meant thatthe number of insolvencies was reduced by around 500 to700 during the year, these were instead registered duringthe subsequent months in 2015.
Nevertheless, the trend of declining insolvencies is con-firmed, even if some sectors emerged slightly worse off thanothers. This is particularly the case for textiles, chemicalsand, to a lesser degree, personal services.
Graph n° 2.6
Défaillances d’entreprises sur un an (milliers)
7PANORAMA
GROUP
Sources: Scores & Décisions, Coface
Sources: Scores & Décisions, Coface
Sources: Scores & Décisions, Coface
140
130
120
110
100
90
80
65
64
63
62
61
60
59
58
57
56
55
2011 2012 2013 2014 2015
2009 2010 2011 2012 2013 2014 2015
>0.5 0.5-2.5 2.5-5 5-10 >10
60 500
-2.5%
� + de 5%� De 0 à 5%
� De -0.1 à -5%
� - de -5%
Bretagne
2,558
3,004
Pays-de-laLoire
Basse- Normandie
Haute-Normandie
NordPas-de-Calais
Alsace
Picardie
Île-de-France
Champagne-Ardenne
Lorraine
Franche-Comté
Bourgogne
Rhône-Alpes
Midi-Pyrénées
Aquitaine
Poitou-Charentes
Centre
Limousin
Auvergne
Provence-Alpes-Côte d’AzurLanguedoc-
Roussillon
Corse
3,132
2,588
664
1,649 992
2,318
3,080
3,454
6,385
6,289
1,2221,573
1,354 964
1,440
335
1,066
1,942
1,871
12,263
-3.8%
-5.4%
-10.5%
-9.8%
-10.7%
-5.8%
-2.3%
-12.7%
-3.4%
-5.8%
-6.6%
-6.0%
1.7%
0.0%
-12.5%
-1.0%
-5.8%
-9.5%
1.4%
-6.6%
-1.9%-5.7%
SECTOR RISK3
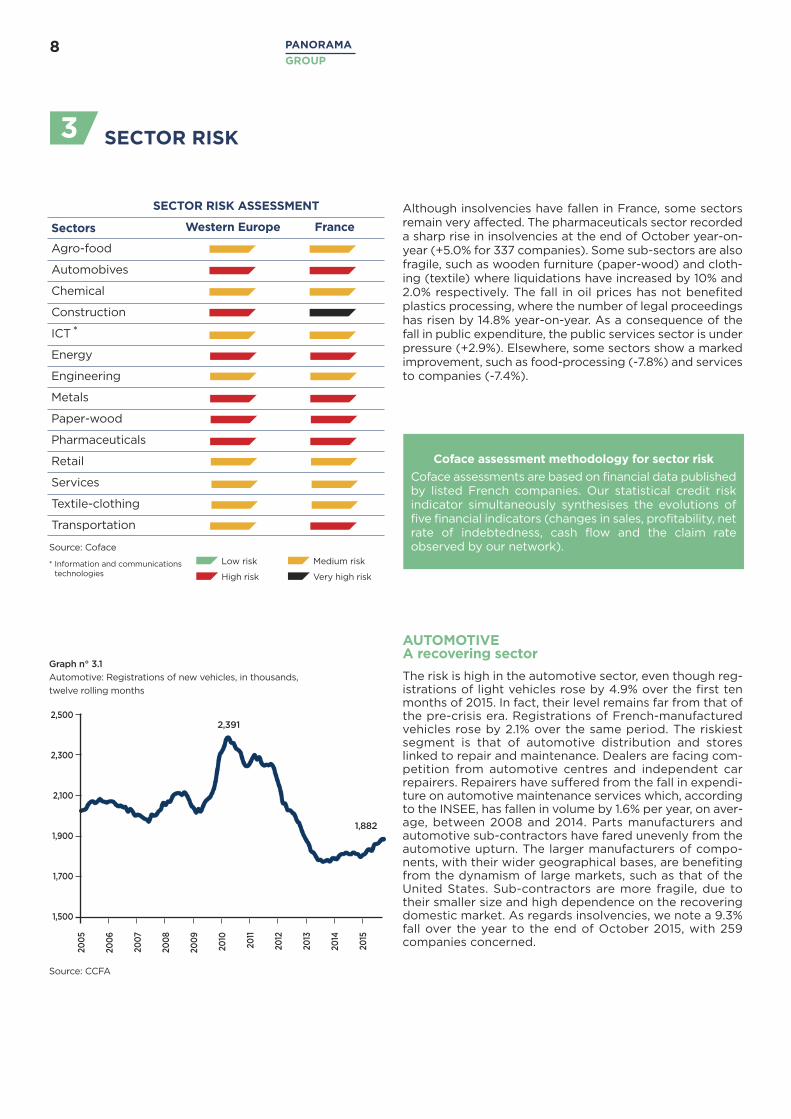
Although insolvencies have fallen in France, some sectorsremain very affected. The pharmaceuticals sector recordeda sharp rise in insolvencies at the end of October year-on-year (+5.0% for 337 companies). Some sub-sectors are alsofragile, such as wooden furniture (paper-wood) and cloth-ing (textile) where liquidations have increased by 10% and2.0% respectively. The fall in oil prices has not benefitedplastics processing, where the number of legal proceedingshas risen by 14.8% year-on-year. As a consequence of thefall in public expenditure, the public services sector is underpressure (+2.9%). Elsewhere, some sectors show a markedimprovement, such as food-processing (-7.8%) and servicesto companies (-7.4%).
AUTOMOTIVE A recovering sector
The risk is high in the automotive sector, even though reg-istrations of light vehicles rose by 4.9% over the first tenmonths of 2015. In fact, their level remains far from that ofthe pre-crisis era. Registrations of French-manufacturedvehicles rose by 2.1% over the same period. The riskiestsegment is that of automotive distribution and storeslinked to repair and maintenance. Dealers are facing com-petition from automotive centres and independent carrepairers. Repairers have suffered from the fall in expendi-ture on automotive maintenance services which, accordingto the INSEE, has fallen in volume by 1.6% per year, on aver-age, between 2008 and 2014. Parts manufacturers andautomotive sub-contractors have fared unevenly from theautomotive upturn. The larger manufacturers of compo-nents, with their wider geographical bases, are benefitingfrom the dynamism of large markets, such as that of theUnited States. Sub-contractors are more fragile, due totheir smaller size and high dependence on the recoveringdomestic market. As regards insolvencies, we note a 9.3%fall over the year to the end of October 2015, with 259companies concerned.
Graph n° 3.1
Automotive: Registrations of new vehicles, in thousands,
twelve rolling months
Coface assessment methodology for sector risk
Coface assessments are based on financial data publishedby listed French companies. Our statistical credit risk indicator simultaneously synthesises the evolutions of five financial indicators (changes in sales, profitability, netrate of indebtedness, cash flow and the claim rateobserved by our network).
Sectors Western Europe France
Agro-food
Automobives
Chemical
Construction
ICT*
Energy
Engineering
Metals
Paper-wood
Pharmaceuticals
Retail
Services
Textile-clothing
Transportation
Source: Coface
Source: CCFA
* Information and communicationstechnologies
Low risk Medium risk
High risk Very high risk
8 PANORAMA
GROUP
2,500
2,300
2,100
1,900
1,700
1,500
2005
2006
2007
2008
2009
2010
2011
2012
2013
2014
2015
2,391
1,882
SECTOR RISK ASSESSMENT

Graph n° 3.2
Price of a barrel of Brent, $/b
9PANORAMA
GROUP
METALS A fragile situation based on very low prices
Base metal prices continue to fall, affecting the financial sit-uation of companies in the sector. As an example, as at theend of October 2015, iron ore has lost 75% of its value since2008. At the same time, China is unloading its steel ontothe rest of the world. The EU has therefore imported 36%more steel over the first eight months of the year, than overthe whole of 2014. In France, the third largest European pro-ducer, the production of steel fell by 2.0% at the end of Sep-tember 2015, year-on-year. The number of insolvencies inthe metals sector reached 1,040 companies, representingan annual fall of 6.7% (1.7% of the total insolvencies inFrance). In detail, the wholesale trade in machinery has seenits insolvencies increase by 2.8% (43% of insolvencies inmetals). Corporate investment recovered in 2014, with anannual growth of 2.0%, but in Q3 2015 decreased to 0.7%.Activity slowly picked up in 2015, with industrial manufac-turing production up by 0.4% at the end of September 2015,year-on-year. Nevertheless, this will not be sufficient toenable the sector to cope with its current difficulties.
Graph n° 3.3
Annual production of steel (millions of tonnes, growth)
France
Italy
Germany
Spain
United Kingdom
160
140
120
100
80
60
40
20
0
50
45
40
35
30
25
20
15
10
0
2005
2006
2007
2008
2009
2010
2011
2012
2013
2014
2015
Source: ICIS Pricing
Source: World Stell Association
2010 2011 2012 2013 2014 2015
-1.1%
-9.9%
-2.0%+3.7%
-7.9%
ENERGY Caution in the short term
As with other Western European countries, France’s energysector represents a high risk as the majority of companiesare affected by the weakness in crude oil prices (around$50 for a barrel of Brent) and structural changes in the con-sumption methods of refined products. Oil-related compa-nies have particularly suffered from the fall in investmentsby exploration-production (E&P) companies. The compa-nies in this segment have seen their order books reducedwhen investment decisions in E&P are cancelled, or delayed,due to falling cash flows resulting from the fall in prices.According to Wood-Mackenzie, the amount of these invest-ment projects is estimated at close to $200 billion in 2015and 2016. The geophysics markets are the most affected,followed by onshore and offshore wells. The distribution of oil products (service stations) is being restructured to the benefit of major distribution brands but to the detri-ment of independent and legacy players. The combinedeffects of low margins and stagnating sales of road fuel(50.1 million m³ in 2014, compared to 51.8 in 2001) areaffecting profitability, while tax disruptions in favour ofpetrol will require additional investments. We counted 67insolvencies in the sector, year-on-year, as at the end ofOctober 2015, compared to the previous period.

(10) Données compilées par le Wall Street Journal et Equifax
10 PANORAMA
GROUP
TRANSPORT France’s sea, air and land transport segments arestill experiencing more difficulties than theirEuropean counterparts
Whereas Coface assesses the sector risk in Western Europeas moderate, the risk linked to the transport of goods sectorin France is high. The maritime transport connectivity index (7) ranks France in 12th place globally, behind Germany,the Netherlands, the United Kingdom, Belgium and Spain.Air transport is suffering from the competition caused bythe evolutions of European carriers and Gulf companies.Finally, road haulage, which represents 85% of the totaltransport of goods (8), is in decline. While the fall in oil pricesis helping companies in this sector, it is not sufficient to off-set the sector’s lack of competitiveness compared to itsneighbours who are benefiting from the same good fortune.The index on domestic goods transport compared to GDP(9) ranked France in 25th place (2013) within the EU, withan index at 69.9 in 2012, compared to an average of 135 forthe countries of Central Europe and Spain, 96.8 for Germanyand 96 (on average) for the EU. French road haulage suffersfrom competition from the countries of Central Europe,which benefit from lower cost structures and a strongerinternational presence. In 2013, only 65% of the transporta-tion of national goods was carried out under the French flag,compared to 78% in 1995 and 73% in 2000. Insolvencies inthis sector fell by 9.9%, year-on-year, as at the end of Octo-ber. However, in the north and in the Ile-de-France, insolven-cies rose by 2.7% and 3.9% respectively. In the Ile de France,the rise is mainly due to chauffeur-driven tourist vehicles.
Graph n° 3.4
National and international road transport, 2013 (in %, on the basis of millions
of tkm, laden journey). Ranked by decreasing order of the total of tkm
(left being the highest)
(7) UNCTAD.(8) Ministry of sustainable development, 2013.(9) Eurostat, growth in domestic transport of goods/growth in GDP.
100%
90%
80%
70%
60%
50%
40%
30%
20%
10%
0%
Germany
PolandSpain
France
United Kingdom
Italy
Netherlands
Czech Republic
Portugal
Hungary
Source: Eurostat
National
International
(10) Companies declared insolvent.
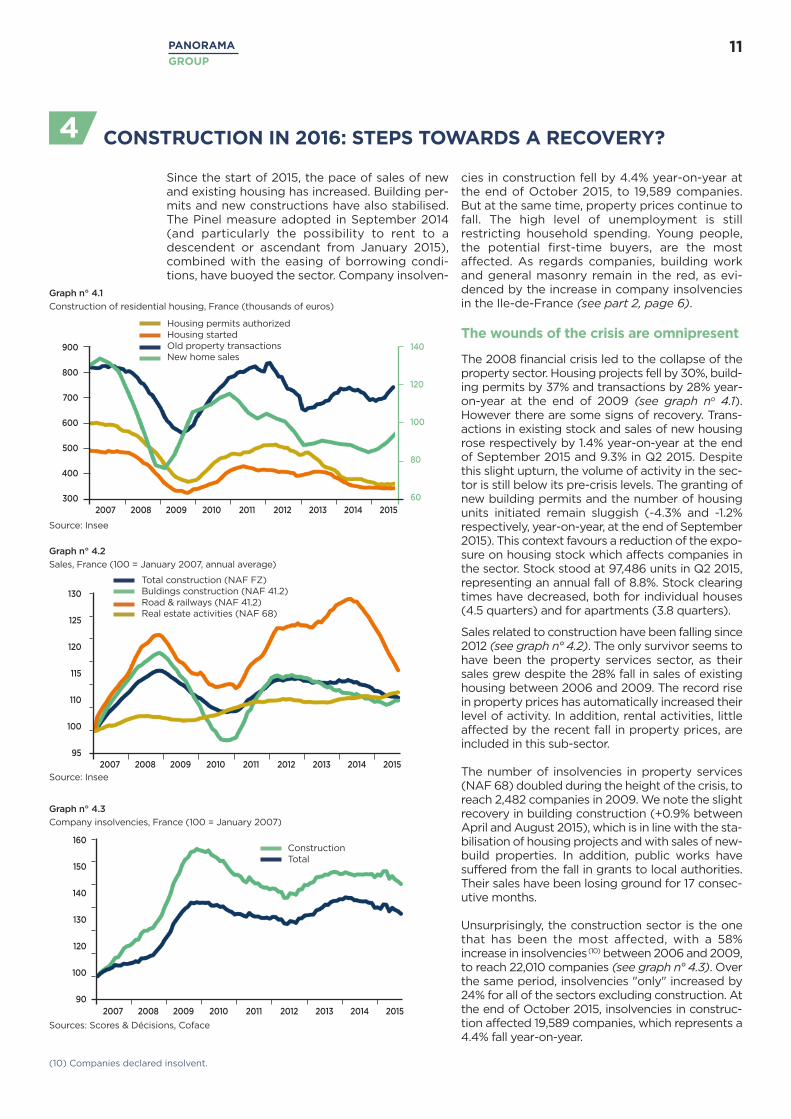
cies in construction fell by 4.4% year-on-year atthe end of October 2015, to 19,589 companies.But at the same time, property prices continue tofall. The high level of unemployment is stillrestricting household spending. Young people,the potential first-time buyers, are the mostaffected. As regards companies, building workand general masonry remain in the red, as evi-denced by the increase in company insolvenciesin the Ile-de-France (see part 2, page 6).
The wounds of the crisis are omnipresent
The 2008 financial crisis led to the collapse of theproperty sector. Housing projects fell by 30%, build-ing permits by 37% and transactions by 28% year-on-year at the end of 2009 (see graph no 4.1).However there are some signs of recovery. Trans-actions in existing stock and sales of new housingrose respectively by 1.4% year-on-year at the endof September 2015 and 9.3% in Q2 2015. Despitethis slight upturn, the volume of activity in the sec-tor is still below its pre-crisis levels. The granting ofnew building permits and the number of housingunits initiated remain sluggish (-4.3% and -1.2%respectively, year-on-year, at the end of September2015). This context favours a reduction of the expo-sure on housing stock which affects companies inthe sector. Stock stood at 97,486 units in Q2 2015,representing an annual fall of 8.8%. Stock clearingtimes have decreased, both for individual houses(4.5 quarters) and for apartments (3.8 quarters).
Sales related to construction have been falling since2012 (see graph n° 4.2). The only survivor seems tohave been the property services sector, as theirsales grew despite the 28% fall in sales of existinghousing between 2006 and 2009. The record risein property prices has automatically increased theirlevel of activity. In addition, rental activities, littleaffected by the recent fall in property prices, areincluded in this sub-sector.
The number of insolvencies in property services(NAF 68) doubled during the height of the crisis, toreach 2,482 companies in 2009. We note the slightrecovery in building construction (+0.9% betweenApril and August 2015), which is in line with the sta-bilisation of housing projects and with sales of new-build properties. In addition, public works havesuffered from the fall in grants to local authorities.Their sales have been losing ground for 17 consec-utive months.
Unsurprisingly, the construction sector is the onethat has been the most affected, with a 58%increase in insolvencies(10) between 2006 and 2009,to reach 22,010 companies (see graph n° 4.3). Overthe same period, insolvencies "only" increased by24% for all of the sectors excluding construction. Atthe end of October 2015, insolvencies in construc-tion affected 19,589 companies, which represents a4.4% fall year-on-year.
Since the start of 2015, the pace of sales of newand existing housing has increased. Building per-mits and new constructions have also stabilised.The Pinel measure adopted in September 2014(and particularly the possibility to rent to adescendent or ascendant from January 2015),combined with the easing of borrowing condi-tions, have buoyed the sector. Company insolven-
CONSTRUCTION IN 2016: STEPS TOWARDS A RECOVERY? 4
11PANORAMA
GROUP
Graph n° 4.1
Construction of residential housing, France (thousands of euros)
Graph n° 4.2
Sales, France (100 = January 2007, annual average)
Graph n° 4.3
Company insolvencies, France (100 = January 2007)
140
120
100
80
60
900
800
700
600
500
400
300
130
125
120
115
110
100
95
Housing permits authorizedHousing startedOld property transactionsNew home sales
Total construction (NAF FZ)Buldings construction (NAF 41.2)Road & railways (NAF 41.2)Real estate activities (NAF 68)
2007 2008 2009 2010 2011 2012 2013 2014 2015
2007 2008 2009 2010 2011 2012 2013 2014 2015
Source: Insee
Source: Insee
Sources: Scores & Décisions, Coface
160
150
140
130
120
100
902007 2008 2009 2010 2011 2012 2013 2014 2015
ConstructionTotal

(11) 1% of observations on extremes below or above the distribution are excluded to give a truer picture of the average sales.
12 PANORAMA
GROUP
(see graph n° 4.4). During this period smallercompanies, often the most vulnerable, were hitby legal proceedings. Between 2011 and 2015,the average sales of failed companies againincreased, as with other sectors. Midsize compa-nies were able to absorb the effects of the 2008crisis, thanks to their reserves, but this secondwave has devastated them. Finally, the recentincrease in average sales since the end of 2014was mainly due to major insolvencies in the public works segment.
A dynamic demography with a sluggishemployment market
Housing demand is primarily driven by the popu-lation size. The ageing population and changingcustoms, which include an increase in the numberof divorces, have resulted in a reduction in thenumber of occupants per residence from 2.7 peo-ple in 1982, to 2.25 in 2012. The number of peopleliving alone per residence has also sharplyincreased, from 5.9 million in 1990 to 9.7 in 2012.Thus, linked with this trend of sole habitation, theFrench population is growing at a slower rate than the number of households, which increasedby 41% between 1982 and 2012 (see graph n° 4.5).This dynamic has significantly increased thedemand for housing. Principal residences increasedby 39% over the same period, although this level isbelow the growth in the number of households.
Besides the increase in the number of households,their social and financial situations also affect thedynamics of the construction sector. To become aproperty owner, financial conditions need to bemet. The growth recorded between 1994 and2000 (2.7% on average) boosted householdincome. The better performance of the employ-ment market substantially increased the number ofemployees, reaching 43.8% of the population inearly 2008.
However, with the crisis, the unemployment rate rose from 7.1% in February 2008 to 10.7% in September 2015. Household investment (see graph n° 4.6) is affected by the perform-ance of the employment market. Despite theslight upturn in the confidence of households,they have increased their precautionary savings.Savings have continued to increase since 2014,to reach 15.1% of disposable income in Q2 2015.While the employment market is essential inboosting housing demand, it also depends onborrowing conditions, which have eased.
The effects of the crisis on the sector have hada greater impact on smaller companies, in con-trast to other sectors where companies wereaffected regardless of size. The average sales of construction companies remained stablebetween 2007 and 2010, at around ¤600,000
Graph n° 4.4
Average sales (weighted annual average, reduced by 1% (11), thousands of euros)
Graph n° 4.5
Population, France (in millions)
Graphn° 4.6
Salaried workforce and household investment, France
Sources: Scores & Décisions, Coface
Source: Insee
Source: Insee
900
850
800
750
700
650
600
550
500
44.0%
43.5%
43.0%
42.5%
42.0%
32
30
28
26
24
22
2007 2008 2009 2010 2011 2012 2013 2014 2015
Average turnover constructionAverage turnover totalAverage turnover total (without construction)
Employment level/total populationGFCF household (billion Euro)
198219902012
+16%
54.6
19.6
27.6
63.6
+41%
Total population Total households
2000
2001
2002
2003
2004
2005
2006
2007
2008
2009
2010
2011
2012
2013
2014
(12) Study on 14 advanced countries since 1870. "No price like home: global house prices, 1870-2012", Federal Reserve Bank of Dallas, October 2014.
13PANORAMA
GROUP
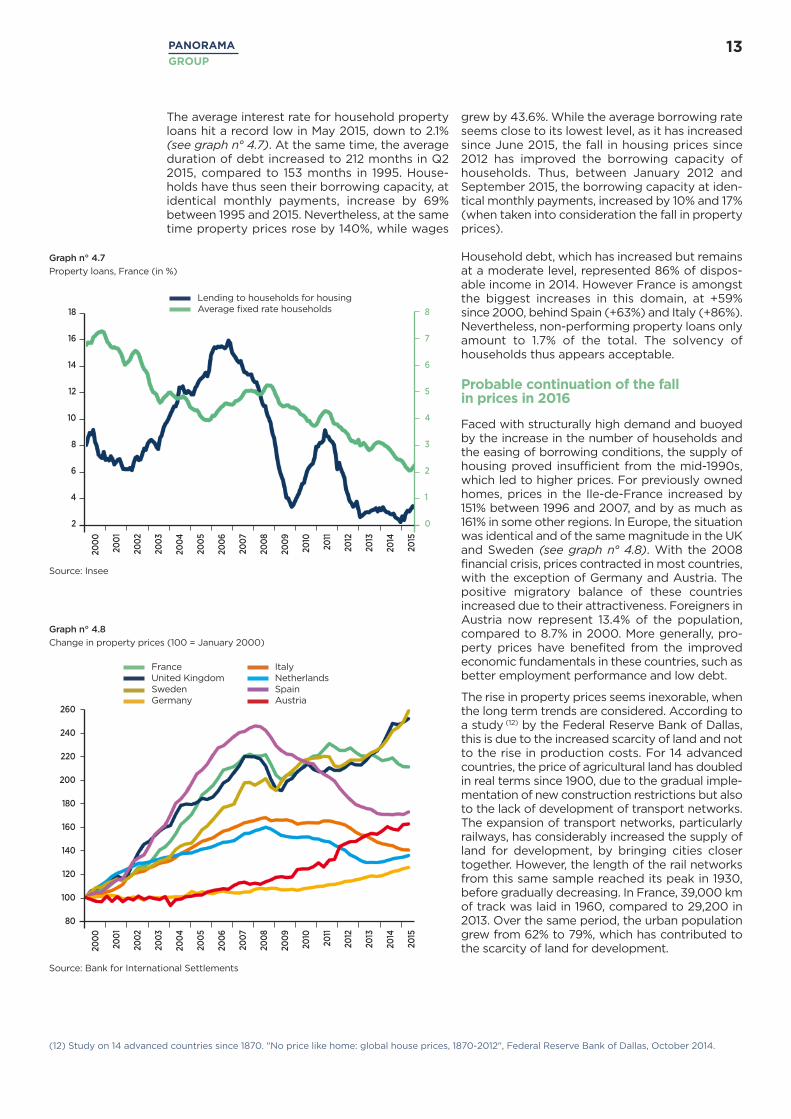
grew by 43.6%. While the average borrowing rateseems close to its lowest level, as it has increasedsince June 2015, the fall in housing prices since2012 has improved the borrowing capacity ofhouseholds. Thus, between January 2012 andSeptember 2015, the borrowing capacity at iden-tical monthly payments, increased by 10% and 17%(when taken into consideration the fall in propertyprices).
Household debt, which has increased but remainsat a moderate level, represented 86% of dispos-able income in 2014. However France is amongstthe biggest increases in this domain, at +59%since 2000, behind Spain (+63%) and Italy (+86%).Nevertheless, non-performing property loans onlyamount to 1.7% of the total. The solvency ofhouseholds thus appears acceptable.
Probable continuation of the fall in prices in 2016
Faced with structurally high demand and buoyedby the increase in the number of households andthe easing of borrowing conditions, the supply ofhousing proved insufficient from the mid-1990s,which led to higher prices. For previously ownedhomes, prices in the Ile-de-France increased by151% between 1996 and 2007, and by as much as161% in some other regions. In Europe, the situationwas identical and of the same magnitude in the UKand Sweden (see graph n° 4.8). With the 2008financial crisis, prices contracted in most countries,with the exception of Germany and Austria. Thepositive migratory balance of these countriesincreased due to their attractiveness. Foreigners inAustria now represent 13.4% of the population,compared to 8.7% in 2000. More generally, pro-perty prices have benefited from the improvedeconomic fundamentals in these countries, such asbetter employment performance and low debt.
The rise in property prices seems inexorable, whenthe long term trends are considered. According toa study (12) by the Federal Reserve Bank of Dallas,this is due to the increased scarcity of land and notto the rise in production costs. For 14 advancedcountries, the price of agricultural land has doubledin real terms since 1900, due to the gradual imple-mentation of new construction restrictions but alsoto the lack of development of transport networks.The expansion of transport networks, particularlyrailways, has considerably increased the supply ofland for development, by bringing cities closertogether. However, the length of the rail networksfrom this same sample reached its peak in 1930,before gradually decreasing. In France, 39,000 kmof track was laid in 1960, compared to 29,200 in2013. Over the same period, the urban populationgrew from 62% to 79%, which has contributed tothe scarcity of land for development.
The average interest rate for household propertyloans hit a record low in May 2015, down to 2.1%(see graph n° 4.7). At the same time, the averageduration of debt increased to 212 months in Q22015, compared to 153 months in 1995. House-holds have thus seen their borrowing capacity, atidentical monthly payments, increase by 69%between 1995 and 2015. Nevertheless, at the sametime property prices rose by 140%, while wages
Graph n° 4.7
Property loans, France (in %)
2000
2001
2002
2003
2004
2005
2006
2007
2008
2009
2010
2011
2012
2013
2014
2015
18
16
14
12
10
8
6
4
2
2000
2001
2002
2003
2004
2005
2006
2007
2008
2009
2010
2011
2012
2013
2014
2015
260
240
220
200
180
160
140
120
100
80
8
7
6
5
4
3
2
1
0
Lending to households for housingAverage fixed rate households
Source: Insee
Source: Bank for International Settlements
FranceUnited KingdomSwedenGermany
ItalyNetherlandsSpainAustria
Graph n° 4.8
Change in property prices (100 = January 2000)
(13) "50 simplification measures for the construction of housing," presented on 29 August 2014..(14) "Property, pillar of growth or sword of Damocles," OFCE, October 2005(15) Estimation of the annual yield calculated in relation to the average price in sq m from renting at the sale price.
14 PANORAMA
GROUP
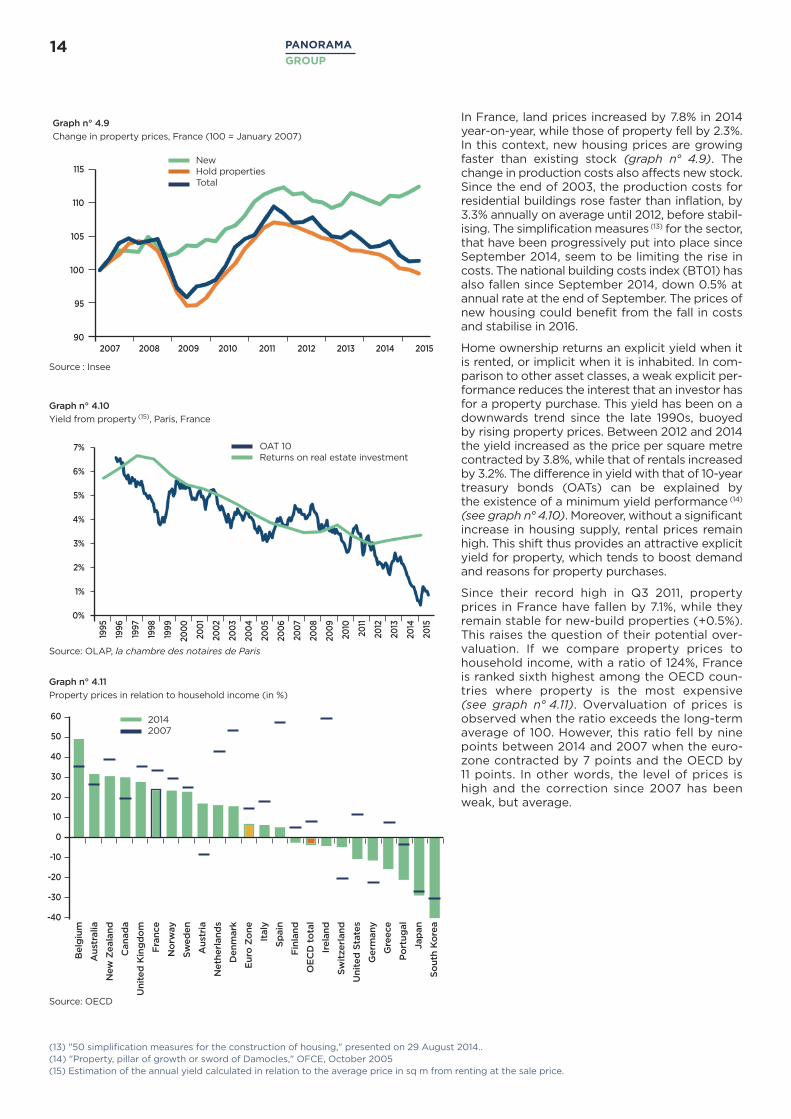
In France, land prices increased by 7.8% in 2014year-on-year, while those of property fell by 2.3%.In this context, new housing prices are growingfaster than existing stock (graph n° 4.9). Thechange in production costs also affects new stock.Since the end of 2003, the production costs forresidential buildings rose faster than inflation, by3.3% annually on average until 2012, before stabil-ising. The simplification measures(13) for the sector,that have been progressively put into place sinceSeptember 2014, seem to be limiting the rise incosts. The national building costs index (BT01) hasalso fallen since September 2014, down 0.5% atannual rate at the end of September. The prices ofnew housing could benefit from the fall in costsand stabilise in 2016.
Home ownership returns an explicit yield when itis rented, or implicit when it is inhabited. In com-parison to other asset classes, a weak explicit per-formance reduces the interest that an investor hasfor a property purchase. This yield has been on adownwards trend since the late 1990s, buoyed by rising property prices. Between 2012 and 2014the yield increased as the price per square metrecontracted by 3.8%, while that of rentals increasedby 3.2%. The difference in yield with that of 10-yeartreasury bonds (OATs) can be explained by the existence of a minimum yield performance (14)
(see graph n° 4.10). Moreover, without a significantincrease in housing supply, rental prices remainhigh. This shift thus provides an attractive explicityield for property, which tends to boost demandand reasons for property purchases.
Since their record high in Q3 2011, propertyprices in France have fallen by 7.1%, while theyremain stable for new-build properties (+0.5%).This raises the question of their potential over-valuation. If we compare property prices tohousehold income, with a ratio of 124%, Franceis ranked sixth highest among the OECD coun-tries where property is the most expensive (see graph n° 4.11). Overvaluation of prices isobserved when the ratio exceeds the long-termaverage of 100. However, this ratio fell by ninepoints between 2014 and 2007 when the euro-zone contracted by 7 points and the OECD by 11 points. In other words, the level of prices ishigh and the correction since 2007 has beenweak, but average.
Graph n° 4.10
Yield from property (15), Paris, France
Graph n° 4.9
Change in property prices, France (100 = January 2007)
Graph n° 4.11
Property prices in relation to household income (in %)
1995
1996
1997
1998
1999
2000
2001
2002
2003
2004
2005
2006
2007
2008
2009
2010
2011
2012
2013
2014
2015
115
110
105
100
95
90
7%
6%
5%
4%
3%
2%
1%
0%
60
50
40
30
20
10
0
-10
-20
-30
-40
2007 2008 2009 2010 2011 2012 2013 2014 2015
Source : Insee
Source: OLAP, la chambre des notaires de Paris
Source: OECD
NewHold propertiesTotal
OAT 10Returns on real estate investment
20142007
Belgium
Australia
New Zealand
Canada
United Kingdom
France
Norway
Sweden
Austria
Netherlands
Denmark
Euro Zone
Italy
Spain
Finland
OECD total
Ireland
Switzerland
United States
Germany
Greece
Portugal
Japan
South Korea
15PANORAMA
GROUP
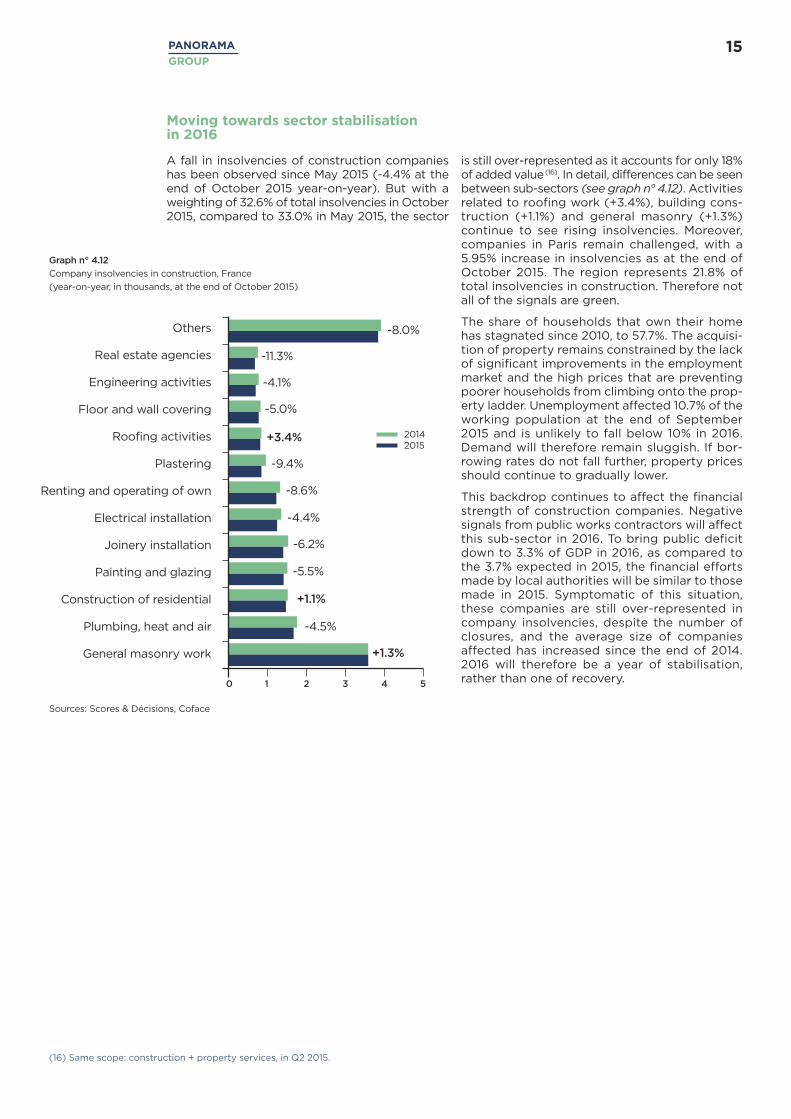
Graph n° 4.12
Company insolvencies in construction, France
(year-on-year, in thousands, at the end of October 2015)
is still over-represented as it accounts for only 18%of added value(16). In detail, differences can be seenbetween sub-sectors (see graph n° 4.12). Activitiesrelated to roofing work (+3.4%), building cons-truction (+1.1%) and general masonry (+1.3%)continue to see rising insolvencies. Moreover,companies in Paris remain challenged, with a5.95% increase in insolvencies as at the end ofOctober 2015. The region represents 21.8% oftotal insolvencies in construction. Therefore notall of the signals are green.
The share of households that own their homehas stagnated since 2010, to 57.7%. The acquisi-tion of property remains constrained by the lackof significant improvements in the employmentmarket and the high prices that are preventingpoorer households from climbing onto the prop-erty ladder. Unemployment affected 10.7% of theworking population at the end of September2015 and is unlikely to fall below 10% in 2016.Demand will therefore remain sluggish. If bor-rowing rates do not fall further, property pricesshould continue to gradually lower.
This backdrop continues to affect the financialstrength of construction companies. Negativesignals from public works contractors will affectthis sub-sector in 2016. To bring public deficitdown to 3.3% of GDP in 2016, as compared tothe 3.7% expected in 2015, the financial effortsmade by local authorities will be similar to thosemade in 2015. Symptomatic of this situation,these companies are still over-represented incompany insolvencies, despite the number ofclosures, and the average size of companiesaffected has increased since the end of 2014.2016 will therefore be a year of stabilisation,rather than one of recovery.
Moving towards sector stabilisation in 2016
A fall in insolvencies of construction companieshas been observed since May 2015 (-4.4% at theend of October 2015 year-on-year). But with aweighting of 32.6% of total insolvencies in October2015, compared to 33.0% in May 2015, the sector
Others
Real estate agencies
Engineering activities
Floor and wall covering
Roofing activities
Plastering
Renting and operating of own
Electrical installation
Joinery installation
Painting and glazing
Construction of residential
Plumbing, heat and air
General masonry work
-8.0%
-11.3%
-4.1%
-5.0%
+3.4%
+1.1%
-4.5%
+1.3%
-9.4%
-8.6%
-4.4%
-6.2%
-5.5%
20142015
0 1 2 3 4 5
Sources: Scores & Décisions, Coface
(16) Same scope: construction + property services, in Q2 2015.

COFACE SA1, place Costes et Bellonte92270 Bois-ColombesFrance
www.coface.com
Photo : © Foltolia - Layout : Les éditions stratégiques
RESERVATION
This document is a summary reflecting the opinions and views of participants as interpreted and noted by Coface on the date it was written and based on available information. It may be modified at any time. The information, analyses and opinions contained
in the document have been compiled on the basis of our understanding and interpretation of the discussions. However Coface does not, under any circumstances, guarantee the accuracy, completeness or reality of the data contained in it. The information,
analyses and opinions are provided for information purposes and are only a supplement to information the reader may find elsewhere. Coface has no results-based obligation, but an obligation of means and assumes no responsibility for any losses incurred by the
reader arising from use of the information, analyses and opinions contained in the document. This document and the analyses and opinions expressed in it are the sole property of Coface. The reader is permitted to view or reproduce them for internal use only, subject
to clearly stating Coface's name and not altering or modifying the data. Any use, extraction, reproduction for public or commercial use is prohibited without Coface's prior agreement.Please refer to the legal notice on Coface's site.