coffee or tea? a prospective cohort study on the ... · pdf filetea (black or green) is...
TRANSCRIPT

MORTALITY
Coffee or Tea? A prospective cohort study on the associations of coffeeand tea intake with overall and cause-specific mortality in menversus women
Piet A. van den Brandt1,2
Received: 28 September 2017 / Accepted: 16 January 2018 / Published online: 27 January 2018� The Author(s) 2018. This article is an open access publication
AbstractCoffee and tea intake have been associated with reduced mortality, but no studies have investigated possible substitution
effects. The relationship of mortality with coffee, tea, and substituting coffee with tea was investigated in the Netherlands
Cohort Study. In 1986, 120,852 men and women aged 55–69 years provided information on dietary and lifestyle habits.
Mortality follow-up until 1996 consisted of linkage to Statistics Netherlands. Multivariate case-cohort analyses were based
on 8665 deaths and 3166 subcohort members with complete data on coffee, tea and confounders. Higher coffee intake was
significantly, nonlinearly related to lower overall and cause-specific mortality in women. In men, coffee was significantly
positively related to cancer and cardiovascular mortality, and inversely to respiratory and other causes of death. Tea intake
was significantly, nonlinearly related to lower overall, cancer and cardiovascular mortality in men, but showed no asso-
ciation with mortality in women. In substitution analyses, increasing the proportion tea (replacing coffee with tea) was
significantly and nonlinearly related to lower overall, cancer and cardiovascular mortality in men, but in women higher tea
proportions were positively associated with overall mortality (and most causes of death). This study suggests that for men,
compared to exclusive coffee drinkers, those drinking 30–50% tea showed the lowest mortality; any tea drinking seemed
better than only coffee. For women, those who drank exclusively coffee or drinking up to 40% tea had the lowest mortality,
but those drinking higher percentages of tea were at increased mortality risk [HR = 1.41 (95% CI 1.01–1.99) for 80–100%
tea compared to exclusive coffee drinkers].
Keywords Coffee � Tea � Mortality � Neoplasms � Cardiovascular diseases � Cohort studies
Introduction
Coffee and tea are among the most widely consumed
beverages in adults worldwide [1, 2]. Coffee consumption
is very popular and still increasing, with the highest per
capita consumption in Scandinavian countries in 2013 [3].
Tea (black or green) is worldwide the most commonly
consumed beverage after water, with high per capita con-
sumption observed in Turkey, Iran, and United Kingdom
[3]. There is a long-standing interest in the health effects of
coffee and tea. Epidemiological studies have been con-
ducted on coffee or tea intake and disease incidence (e.g.
cancer, CVD, diabetes) and mortality. A recent meta-
analysis on coffee and mortality in 31 cohort studies [4]
showed decreased overall and cardiovascular disease
(CVD) mortality for coffee consumption of up to 4
cups/day. Two recent large cohort studies also showed that
coffee consumption was associated with reduced risk of
death (overall and from various causes) in the European
Prospective Investigation into Cancer (EPIC) [5] and
among African Americans, Japanese Americans, Latinos
and whites in the Multiethnic Cohort (MEC) [6]. For tea, a
recent meta-analysis using 18 cohort studies found that
black tea consumption was significantly inversely
Electronic supplementary material The online version of this article(https://doi.org/10.1007/s10654-018-0359-y) contains supplementarymaterial, which is available to authorized users.
& Piet A. van den Brandt
1 Department of Epidemiology, GROW-School for Oncology
and Developmental Biology, Maastricht University Medical
Centre, PO Box 616, 6200 MD Maastricht, The Netherlands
2 Department of Epidemiology, CAPHRI-School for Public
Health and Primary Care, Maastricht University Medical
Centre, PO Box 616, 6200 MD Maastricht, The Netherlands
123
European Journal of Epidemiology (2018) 33:183–200https://doi.org/10.1007/s10654-018-0359-y(0123456789().,-volV)(0123456789().,-volV)

associated with overall and cancer mortality, while green
tea consumption was significantly inversely associated with
overall and CVD mortality [7]. Only in a limited number of
the previous cohort studies on mortality, analyses for cof-
fee and tea intake were mutually adjusted.
While coffee and tea are both drunk in most countries,
usually one predominates because of economic (e.g., trade
and income), marketing, cultural and ethnic reasons [8].
Many people can choose between coffee and tea, and drink
these in varying ratios depending on taste preference,
lifestyle, socio-economic factors, genetics and health, but
in very few mortality studies associations with coffee and
tea have been investigated simultaneously, and no studies
have been conducted on possible effects associated with
substituting one beverage for the other. This study first
evaluated the mutually-adjusted associations between cof-
fee and tea intake with overall and cause-specific mortality
in men and women, and then focused on substituting one
beverage for the other, as well as on the combined effects
of coffee and tea.
Methods
Study design and mortality follow-up
The NLCS started in September 1986 and includes 58,279
men and 62,573 women aged 55–69 years [9]. At baseline
(September 1986), they completed a mailed, self-adminis-
tered 11-page questionnaire on cancer risk factors. The
NLCS study was approved by the Maastricht University
institutional review board. For efficiency, we applied the
nested case-cohort method [10], requiring only data-entry
of questionnaires (which could not be scanned) of cases
and a random subcohort. Following this method [9], cases
were enumerated from the entire NLCS-cohort of 120,852
(numerator information of mortality rates), whereas the
accumulated person-years at risk in the cohort were esti-
mated using a subcohort of 5000 subjects (denominator
information). The case-cohort method implies that the
persontime at risk is estimated through a sample of the the
total cohort, instead of actively following the total cohort.
Data entry of questionnaires is only needed for cases and
subcohort members, instead of the total cohort [9, 10].Im-
mediately after the NLCS-baseline measurement, the sub-
cohort (2411 men, 2589 women) was randomly sampled
from the cohort, and actively followed up since 1986 for
vital status and migration. For this analysis the final follow-
up date was December 31, 1996. Participants who emi-
grated where censored at migration date. Data on mortality
and causes of death in the cohort-at-large were obtained
from linkage with the Dutch Central Bureau of Genealogy
and Statistics Netherlands. Through this linkage, 18,091
deaths were identified between January 1987 and Decem-
ber 1996. The completeness of the mortality follow-up was
99% [11]. Overall mortality follow-up was not available
for the NLCS after this period. Causes of death were coded
according to the International Classification of Disease,
ninth revision (ICD-9) for 1987–1995 and ICD-10 for 1996
[12]. Besides total mortality, the following major primary
causes of death were separately investigated: cancer (ICD-
9: 140–239; ICD-10: C00–D48), cardiovascular (CVD)
(ICD-9: 390–459; ICD-10: I00–I99), respiratory disease
(ICD-9: 460–519; ICD-10: J00–J99), and all other causes
excluding external injuries (ICD-9: all other codes
excluding 780–799; ICD-10: all other excluding R00–
R99).
Exposure assessment
The baseline questionnaire measured dietary intake (150
items), detailed smoking habits and many other lifestyle
factors, and medical conditions [9]. Habitual consumption
of food and beverages during the year preceding baseline
was assessed using a semi-quantitative food-frequency
questionnaire, which was validated against a 9-day diet
record [13]. Of the 150 food-frequency questionnaire
items, 24 addressed beverage consumption. The question-
naire covered almost all beverages consumed regularly,
namely water (tap or bottled), milk (i.e. milk, buttermilk,
cocoa), juice (i.e. tomato, orange, others), soda and
lemonade (i.e. cola, others), alcoholic beverages (i.e. beer,
red wine, white wine, sherry, port, liqueur, spirits), soup,
coffee, and tea. The amount of beverages consumed was
measured in household units (glasses, cups, soup plates,
etc.). The participants could indicate the frequency of
beverage consumption and the portion size. During the
validation study the capacity of the household units was
measured by a dietician who visited the subjects. The
average content that was established by the dietician was
175 ml for a glass, 125 ml for a cup (coffee or tea), 250 ml
for a soup bowl, 200 ml for a beer glass, 105 ml for a wine
glass, 80 ml for a sherry glass, and 45 ml for a liqueur/
liquor glass [13]. Based on questionnaire data, the total
fluid consumption was calculated using information on
frequency and beverage-specific serving size of all the
specific beverages. The Spearman correlation coefficient
between average daily intake of non-alcoholic beverages
assessed by the questionnaire and estimated from the 9-day
diet record was 0.63. For alcoholic beverages, the Spear-
man correlation coefficient was 0.89 [13]. No validity
estimates for intake of specific beverages were available.
Participants were asked whether they drank coffee or tea
and, if so, how many cups of each per day on average
(without response categories). No questions were asked on
decaffeinated coffee, as in the NLCS pilot study this item
184 P. A. van den Brandt
123

was not consumed much [14]. The type of tea was not
specified but this population rarely drank any tea other than
black tea [15]. For coffee, respondents could also indicate
whether they drank ‘‘more, less, or the same amount’’
5 years before baseline, compared to baseline. Stable cof-
fee users were those indicating the same amount. Nutrient
intakes were calculated using the computerized Dutch food
composition table [16].
Population for analysis
From the 18,091 deaths in the cohort, subjects who
reported a history of cancer (excluding skin cancer) or
CVD (myocardial infarction, angina pectoris, stroke) at
baseline were excluded from this mortality analysis to
avoid reverse causation, leaving 12,386 deaths. A similar
exclusion applied to the subcohort yielded 4193 subcohort
members available. (Subcohort members with prevalent
cancer or CVD at baseline had more often reduced their
coffee intake compared to 5 years ago, than those without
CVD or cancer.) Additionally, subjects with incomplete or
inconsistent dietary data were excluded, according to cri-
teria described previously [11, 13], leaving 10,382 deaths
(6701 men, 3681 women) and 3693 subcohort members
(1743 men, 1950 women) available for analysis after these
exclusions. Multivariate case-cohort analyses were based
on 8665 deaths and 3166 subcohort members with com-
plete data on coffee, tea and confounders. Cause-specific
numbers are presented in Supplementary Figure S1.
Statistical analysis
For the intakes of coffee and tea, the median (IQR) values
were calculated in the subcohort. Associations between
coffee and tea intake and various (non)dietary character-
istics were examined by cross-tabulations. The relationship
between intake of coffee and tea and overall mortality and
cause-specific mortality was evaluated using Cox propor-
tional hazards models; deaths due to other causes were
censored at date of death for cause-specific analyses.
Analyses were done for men and women separately to
allow and evaluate possible effect modification by sex. The
proportional hazards assumption was evaluated using
- ln(- ln) survival plots, and by adding interaction terms
between exposure and time to the multivariable adjusted
models, and tested using Wald tests. No violation of the
proportional hazards assumption was found. Standard
errors were estimated using the robust Huber–White
sandwich estimator to account for additional variance
introduced by the subcohort sampling [17].
In age- and multivariable-adjusted survival analyses per
sex, coffee and tea intake were evaluated and tested on
categorical and continuous scales. In multivariable
analyses, hazard ratios (HRs) were corrected for potential
confounders: age at baseline (continuous, years), cigarette
smoking status (coded as never, former, current smoker),
number of cigarettes smoked per day, and years of smoking
(both continuous, centered), history of physician-diagnosed
hypertension (no, yes) and diabetes (no, yes), body height
(continuous, m), BMI (\ 18.5, 18.5–\ 25, 25–\ 30,
C 30 kg/m2), non-occupational physical activity (\ 30,
30–60, 61–90, C 90 min/day), highest level of education
(primary school or lower vocational, secondary or medium
vocational, and higher vocational or university), intake of
alcohol (0, 0.1–\ 5, 5–\ 15, 15–\ 30, 30? g/day), veg-
etables and fruit (both continuous, g/day), nuts (0, 0.1–\ 5,
5–\ 10, 10? g/day), energy (continuous, kcal/day), use of
nutritional supplements (no, yes), and, in women, post-
menopausal hormone replacement therapy (never, ever).
Coffee and tea intake were mutually adjusted for each other
as well. Analyses were repeated after excluding deaths
occurring in the first 2 years of follow-up. Listwise dele-
tion was applied to handle missing data for potential con-
founders. Tests for trends were assessed using Wald tests,
by fitting median values of beverage consumption per
intake category as continuous terms. Tests for non-linearity
in the associations with mortality were conducted using
restricted cubic splines, using three knots (10th, 50th, 90th
percentiles). These survival analyses (for coffee and tea
intake, respectively) were carried out for overall mortality,
followed by cause-specific analyses.
The above analyses estimate associations with increas-
ing coffee intake, while adjusting for tea intake, i.e.
keeping tea intake constant, and vice versa. However,
considering that many people can choose between coffee
and tea as their main beverages, additional analyses were
performed in which associations were estimated when
substituting (replacing) tea with coffee. Standard substitu-
tion analyses assume a linear relationship between the
exposure variables and disease risk/mortality [18], so that
the effect of substituting equal amounts, e.g., replacing one
cup of tea with one cup of coffee, can be estimated. Since
the associations with coffee and tea were significantly
nonlinear (see ‘‘Results’’), the approach used here was by
calculating the percentage tea of the total cups of coffee
and tea consumed per day. This variable was categorized
and used in multivariate analyses, while additionally con-
trolling for total coffee and tea intake. This was modelled
with tea percentage as exposure variable because the nat-
ural reference group of low percentage intake would be
larger than with coffee percentage as exposure. Excluded
from this analysis were (the very few) non-drinkers of both
beverages.
To evaluate potential residual confounding by mortality
risk factors, and interactions, analyses for overall mortality
were also conducted in subgroups of smoking, alcohol,
Coffee, tea and mortality 185
123

BMI, physical activity, and Mediterranean Diet adherence
as measured with the alternate Mediterranean Diet Score
(aMED) [11, 19]. Multiplicative interactions with these
factors were tested using Wald tests and cross-product
terms. In sensitivity analyses, we additionally adjusted for
other fluid intake than coffee and tea.
All analyses were performed using Stata version 12;
presented P values are two-sided.
Results
Almost all participants in the NLCS consumed coffee or
tea. In the subcohort, only 2.9% of men and 3.3% of
women reported no coffee consumption, while for tea the
percentage of nonusers was 15.5% among men and 10.8%
among women. Coffee and tea consumption were the most
commonly consumed beverages and accounted for 61% of
total fluid consumption among men, and 66% among
women. Both in subcohort men and women separately, the
median (interquartile range, IQR) coffee intake among
drinkers was 4 (2) cups/day [or 500 (250) ml/day, where 1
cup equals 125 ml]; for tea intake, the median (IQR) was 3
(2) cups/day, or 375 (250) ml/day among tea drinkers. Men
and women who drank relatively high amounts of coffee
were on average somewhat younger, while the opposite
pattern was seen for tea (Table 1). Higher coffee con-
sumption was also associated with lower fruit intake in
men and women, with higher alcohol intake and BMI, and
with lower nut intake in women, but higher nut intake in
men. Among men and women consuming more coffee,
there were fewer never smokers, Mediterranean diet
adherence was lower, fewer people had university or higher
vocational education, and use of nutritional supplements
was lower. For tea intake, the abovementioned relation-
ships were mostly reversed except for education. Among
women, the percentage of diabetics was higher among high
coffee consumers, and lower among high tea consumers.
With increasing coffee intake, tea intake decreased in both
sexes. The Spearman correlation coefficients between
coffee and tea (cups) were - 0.26 in men and - 0.24 in
women. The intake of other fluids decreased somewhat
with increasing coffee intake in both sexes, and decreased
more clearly with increasing tea intake in men.
Of the 8665 deaths with complete information on coffee
and tea intake and potential confounders, 5636 occurred in
men and 3029 in women. Age- and multivariable-adjusted
analyses of coffee intake and mortality showed significant
heterogeneity between men and women (P = 0.018);
subsequent analyses were therefore done per sex. While
there was a statistically significant positive association
between coffee intake and overall mortality in men in age-
adjusted analyses (Table 2), no clear association was
observed after multivariable adjustment, with a HR (95%
CI) of 1.22 (0.89–1.66) when comparing 6? versus 0–1
cups/day (Ptrend = 0.320). In women, coffee intake was
significantly inversely related to overall mortality after
multivariable adjustment, with a HR (95% CI) of 0.65
(0.47–0.90) when comparing 6? versus 0–1 cups/day
(Ptrend = 0.014). Analyses excluding the first 2 years of
follow-up showed similar results (data not shown).
Restricted cubic splines (Fig. 1) showed deviations from
linearity between coffee and mortality, especially in
women (Table 2, P for nonlinearity = 0.055 in men,
P = 0.001 in women).
In multivariable analyses of major causes of death per
sex (Table 2), coffee intake was borderline significantly
positively associated with death due to cancer in men, with
a HR (95% CI) of 1.49 (1.04–2.13) when comparing 6?
versus 0–1 cups/day (Ptrend = 0.060). However, an inverse
association was seen in women with significantly decreased
HRs in several intake categories, such as a HR (95% CI) of
0.65 (0.44–0.95) when comparing 5–\ 6 versus 0–1
cups/day. There was clear evidence for a nonlinear asso-
ciation in women (P for nonlinearity = 0.008). A compa-
rable pattern was seen for CVD deaths. For death due to
respiratory disease, a significant inverse association with
coffee intake was seen in men (Ptrend = 0.006), while there
was no significant association in women. For deaths due to
other causes, there was evidence for nonlinear inverse
associations with coffee intake in both men and women.
Supplementary Figure S2 shows cause-specific nonpara-
metric regression curves from these analyses, in men and
women. The percentage of stable coffee users in the sub-
cohort was 74% in men and 78% in women. Sensitivity
analyses limited to those with stable coffee intake (with
4182 deaths in men and 2235 in women) showed essen-
tially similar patterns to the whole population (Supple-
mentary Figure S3).
Tea intake showed a nonlinear inverse association with
overall mortality in men P for nonlinearity = 0.004), but
no association in women, after multivariable adjustment
(Table 3; Fig. 2). The lowest significantly decreased HR
(0.72, 95% CI 0.57–0.91) was observed in men drinking
2–3 cups/day, compared to nonconsumers. As in the
analyses for coffee, there was a large effect of multivari-
able adjustment on the risk estimates, compared to age-
adjusted analyses. In cause-specific analyses for tea, deaths
due to cancer and CVD were significantly inversely related
to tea intake in men in a nonlinear fashion (Table 3 and
Supplementary Figure S4), while there was no association
with deaths due to respiratory or other causes. In women,
tea intake did not show clear associations with cause-
specific mortality.
In the substitution analyses addressing the question
‘‘Coffee or Tea?’’, the percentage tea of total coffee and tea
186 P. A. van den Brandt
123

Table1
Bas
elin
ech
arac
teri
stic
s(m
ean
s(S
D),
or
per
cen
t)ac
cord
ing
toco
ffee
and
tea
inta
ke
inm
ale
and
fem
ale
sub
coh
ort
mem
ber
sw
ith
com
ple
ted
ieta
ryan
dco
var
iab
led
ata,
Net
her
lan
ds
Co
ho
rtS
tud
y
Ch
arac
teri
stic
Co
ffee
,cu
ps/
day
Tea
,cu
ps/
day
0–
1.0
cup
s1
.1–\
4cu
ps
4–\
6cu
ps
C6
cup
s0
–\1
cup
s1
–\3
cup
s3
–\5
cup
sC
5cu
ps
Med
ian
(cu
ps)
13
46
02
46
Med
ian
(ml)
12
53
75
50
07
50
02
50
50
07
50
Men N
96
299
668
452
225
623
439
209
Age,
mea
n(S
D)
(yr)
61.6
(4.2
)62.3
(4.2
)61.5
(4.2
)60.3
(4.0
)60.1
(3.9
)60.9
(4.1
)61.9
(4.2
)62.3
(4.3
)
BM
I(k
g/m
2)
24.3
(3.1
)24.9
(2.5
)24.9
(2.4
)24.9
(2.7
)25.1
(2.6
)24.8
(2.6
)25.0
(2.5
)24.6
(2.4
)
Physi
cal
acti
vit
y,
nonocc
upat
ional
(min
/day
)81.4
(77.9
)82.1
(66.1
)79.6
(65.8
)80.3
(71.5
)82
(79.3
)77.1
(62.1
)80.6
(66.6
)86.8
(77.7
)
Alc
ohol
inta
ke
(g/d
ay)
9.5
(17.5
)14.1
(15.4
)15.9
(17.0
)16.0
(18.1
)17.6
(21.0
)16.5
(16.9
)14.0
(15.8
)11.1
(13.3
)
Veg
etab
lein
take
(g/d
ay)
188.8
(87.1
)188.7
(74.2
)182.8
(70.7
)188
(80.3
)183.3
(83)
182.1
(72.5
)189.1
(75)
192.2
(72.3
)
Fru
itin
take
(g/d
ay)
190.5
(176.1
)165.1
(121.9
)152.8
(101.3
)140
(110.7
)135
(114.4
)147
(112.2
)163.5
(108.9
)173.7
(135.3
)
Nut
inta
ke
(g/d
ay)
6.8
(15.3
)7.6
(13.8
)7.8
(12.6
)9
(16)
8.6
(18.1
)9.1
(15.8
)7.5
(11.8
)6.1
(10.3
)
Tea
inta
ke
(cups/
day
)3.7
(2.4
)3.0
(1.9
)2.7
(1.9
)2.0
(1.8
)C
off
ee5.9
(3.1
)4.7
(1.9
)4.3
(1.9
)3.8
(2.4
)
Oth
erfl
uid
sin
take
(ml/
day
)606.4
(436.4
)569.4
(303.6
)548.8
(323.2
)569.2
(363.2
)663.9
(401.1
)569
(332.8
)526
(314.3
)523.8
(323.8
)
Nev
ersm
oker
(%)
40.6
17.7
12.3
10.0
12.4
12.5
17.1
16.3
Low
MD
-adher
ence
(aM
ED
0–3
pts
)(%
)30.2
29.4
31.1
36.1
40.4
31.0
31.0
29.7
Univ
ersi
tyor
hig
her
voca
tional
educa
tion
(%)
20.8
27.4
21.4
17.3
20.4
20.9
22.6
22.0
Dia
bet
es(%
)2.1
4.0
2.5
3.1
4.4
1.9
3.6
2.4
Hyper
tensi
on
(%)
19.8
32.8
20.5
18.4
19.1
25.4
21.0
21.5
Nutr
itio
nal
supple
men
tuse
r(%
)34.4
30.1
21.9
18.8
23.6
22.0
22.8
30.1
Wom
en
N114
490
723
324
163
555
571
328
Age,
mea
n(S
D)
(yea
r)62.1
(4.5
)62.2
(4.2
)61.4
(4.2
)60.7
(4.0
)61.2
(4.4
)60.9
(4.1
)61.9
(4.2
)62.1
(4.1
)
BM
I(k
g/m
2)
24.1
(3.7
)24.6
(3.3
)25.2
(3.5
)25.5
(3.7
)25.4
(4.0
)25.3
(3.6
)25.0
(3.5
)24.4
(3.2
)
Physi
cal
acti
vit
y,
nonocc
upat
ional
(min
/day
)66
(45.2
)65.9
(51.9
)65.4
(52.7
)64.1
(50.5
)62.5
(49.9
)66.5
(53.7
)63
(50.8
)68.9
(50.2
)
Alc
ohol
inta
ke
(g/d
ay)
4.4
(9.5
)6.4
(9.8
)6.6
(10.1
)5.3
(7.7
)6.4
(9.6
)6.3
(10.2
)5.9
(9.1
)6.0
(9.3
)
Veg
etab
lein
take
(g/d
ay)
203.3
(91)
183.4
(66.8
)193.8
(72.8
)196.3
(83.1
)189.9
(86.6
)184.5
(73.1
)197.7
(70.4
)195
(77)
Fru
itin
take
(g/d
ay)
215.3
(117.6
)194.2
(119.1
)197.5
(113.1
)179.1
(128.9
)161.1
(113.4
)191.7
(117.3
)198.2
(115)
209
(128.4
)
Nut
inta
ke
(g/d
ay)
5.2
(13.6
)4.4
(8.7
)4.4
(7.7
)4.4
(8.2
)3.9
(8)
4.3
(8.8
)4.8
(8.7
)4.5
(8.8
)
Tea
inta
ke
(cups/
day
)4.6
(2.7
)3.4
(2.1
)3.0
(1.8
)2.4
(2.0
)C
off
ee5.1
(2.4
)4.2
(1.8
)3.9
(1.7
)3.3
(1.9
)
Oth
erfl
uid
sin
take
(ml/
day
)473.7
(280.2
)479.4
(297.3
)466.1
(274.9
)420.1
(280.2
)477.5
(357.8
)464.6
(276.1
)466.3
(278.1
)439.8
(262)
Nev
ersm
oker
(%)
71.9
65.3
59.3
44.1
44.2
56.2
62.0
65.5
Low
MD
-adher
ence
(aM
ED
0–3
pts
)(%
)26.3
31.2
31.5
35.5
42.9
32.4
28.9
29.9
Univ
ersi
tyor
hig
her
voca
tional
educa
tion
(%)
15.8
15.5
8.0
5.6
12.3
6.8
9.1
16.2
Dia
bet
es(%
)0.9
3.1
2.8
4.3
4.3
3.1
3.0
1.8
Hyper
tensi
on
(%)
24.6
30.2
28.4
21.0
25.2
24.1
32.2
24.4
Nutr
itio
nal
supple
men
tuse
r(%
)54.4
41.4
34.7
33.3
33.1
38.4
38.2
38.1
Ever
use
dhorm
one
repla
cem
ent
ther
apy
(%)
12.3
13.3
14.4
11.4
9.2
12.8
15.1
12.5
Coffee, tea and mortality 187
123

Table2
Ov
eral
lan
dca
use
-sp
ecifi
cm
ort
alit
yac
cord
ing
toco
ffee
inta
ke
inm
ult
ivar
iab
le-a
dju
sted
aan
aly
ses,
NL
CS
Co
ffee
(cu
ps/
day
)(m
edia
n)
Ptr
end
Pn
on
-lin
eari
ty
0–
1.0
cup
s/d
1.1
–\3
cup
s/d
3–\
4cu
ps/
d4
–\5
cup
s/d
5–\
6cu
ps/
d6?
cup
s/d
(1)
(2)
(3)
(4)
(5)
(6)
All
cau
ses
Men No
.o
fd
eath
s2
95
54
16
87
14
13
73
51
96
5
Per
son
-yea
rsin
sub
coh
ort
86
21
32
61
35
33
79
62
37
34
07
7
Ag
e-ad
just
edH
R1
(Ref
)1
.03
1.3
81
.03
0.9
41
.60
\0
.00
1
(95
%C
I)(0
.75
–1
.41
)(1
.01
–1
.90
)(0
.78
–1
.36
)(0
.70
–1
.26
)(1
.22
–2
.11
)
Mu
ltiv
aria
ble
-ad
just
edH
R1
(Ref
)0
.95
1.2
20
.90
0.7
41
.22
0.3
20
0.0
55
(95
%C
I)(0
.67
–1
.33
)(0
.86
–1
.73
)(0
.66
–1
.22
)(0
.53
–1
.03
)(0
.89
–1
.66
)
Wo
men
No
.o
fd
eath
s2
79
45
84
76
87
53
35
60
6
Per
son
-yea
rsin
sub
coh
ort
10
89
21
71
25
35
51
42
20
01
31
69
Ag
e-ad
just
edH
R1
(Ref
)0
.80
0.7
40
.70
0.7
20
.87
0.5
11
(95
%C
I)(0
.61
–1
.06
)(0
.56
–0
.98
)(0
.54
–0
.91
)(0
.54
–0
.96
)(0
.66
–1
.14
)
Mu
ltiv
aria
ble
-ad
just
edH
R1
(Ref
)0
.74
0.7
00
.63
0.5
90
.65
0.0
14
0.0
01
(95
%C
I)(0
.54
–1
.01
)(0
.51
–0
.96
)(0
.47
–0
.84
)(0
.42
–0
.83
)(0
.47
–0
.90
)
Can
cer
Men N
o.
of
dea
ths
10
12
07
28
06
02
33
89
01
Ag
e-ad
just
edH
R1
(Ref
)1
.16
1.6
61
.29
1.2
62
.13
\0
.00
1
(95
%C
I)(0
.81
–1
.68
)(1
.16
–2
.38
)(0
.94
–1
.77
)(0
.90
–1
.76
)(1
.55
–2
.92
)
Mu
ltiv
aria
ble
-ad
just
edH
R1
(Ref
)1
.10
1.4
81
.06
0.9
51
.49
0.0
60
0.4
33
(95
%C
I)(0
.74
–1
.65
)(0
.99
–2
.19
)(0
.75
–1
.52
)(0
.65
–1
.38
)(1
.04
–2
.13
)
Wo
men
No
.o
fd
eath
s1
17
20
82
07
43
11
60
29
7
Ag
e-ad
just
edH
R1
(Ref
)0
.87
0.7
60
.81
0.7
90
.96
0.8
32
(95
%C
I)(0
.63
–1
.21
)(0
.55
–1
.05
)(0
.60
–1
.08
)(0
.57
–1
.11
)(0
.71
–1
.31
)
Mu
ltiv
aria
ble
-ad
just
edH
R1
(Ref
)0
.81
0.7
00
.74
0.6
50
.75
0.2
01
0.0
08
(95
%C
I)(0
.57
–1
.14
)(0
.49
–0
.99
)(0
.53
–1
.03
)(0
.44
–0
.95
)(0
.52
–1
.08
)
Car
dio
vas
cula
rd
isea
se
Men N
o.
of
dea
ths
11
12
07
24
84
79
25
56
95
188 P. A. van den Brandt
123

Table
2(c
on
tin
ued
)
Co
ffee
(cu
ps/
day
)(m
edia
n)
Ptr
end
Pn
on
-lin
eari
ty
0–
1.0
cup
s/d
1.1
–\3
cup
s/d
3–\
4cu
ps/
d4
–\5
cup
s/d
5–\
6cu
ps/
d6?
cup
s/d
(1)
(2)
(3)
(4)
(5)
(6)
Ag
e-ad
just
edH
R1
(Ref
)1
.03
1.3
20
.92
0.8
71
.53
0.0
04
(95
%C
I)(0
.71
–1
.49
)(0
.91
–1
.91
)(0
.66
–1
.28
)(0
.61
–1
.23
)(1
.11
–2
.12
)
Mu
ltiv
aria
ble
-ad
just
edH
R1
(Ref
)0
.86
1.0
80
.80
0.6
91
.22
0.1
55
0.0
73
(95
%C
I)(0
.57
–1
.28
)(0
.71
–1
.63
)(0
.56
–1
.15
)(0
.47
–1
.03
)(0
.84
–1
.76
)
Wo
men
No
.o
fd
eath
s8
71
50
16
12
48
96
19
0
Ag
e-ad
just
edH
R1
(Ref
)0
.84
0.8
10
.66
0.6
90
.93
0.5
62
(95
%C
I)(0
.58
–1
.20
)(0
.56
–1
.16
)(0
.47
–0
.92
)(0
.47
–1
.02
)(0
.65
–1
.32
)
Mu
ltiv
aria
ble
-ad
just
edH
R1
(Ref
)0
.80
0.8
10
.61
0.5
80
.72
0.0
79
0.0
15
(95
%C
I)(0
.52
–1
.23
)(0
.52
–1
.26
)(0
.41
–0
.93
)(0
.36
–0
.95
)(0
.46
–1
.14
)
Res
pir
ato
ryd
isea
se
Men N
o.
of
dea
ths
26
45
69
10
53
71
11
Ag
e-ad
just
edH
R1
(Ref
)0
.91
1.5
20
.84
0.5
31
.07
0.4
19
(95
%C
I)(0
.51
–1
.61
)(0
.88
–2
.62
)(0
.51
–1
.40
)(0
.30
–0
.95
)(0
.65
–1
.77
)
Mu
ltiv
aria
ble
-ad
just
edH
R1
(Ref
)0
.86
1.5
50
.62
0.3
50
.69
0.0
06
0.0
23
(95
%C
I)(0
.45
–1
.65
)(0
.82
–2
.93
)(0
.34
–1
.11
)(0
.18
–0
.69
)(0
.38
–1
.25
)
Wo
men
No
.o
fd
eath
s1
21
61
24
91
93
0
Ag
e-ad
just
edH
R1
(Ref
)0
.65
0.4
30
.93
0.9
71
.04
0.1
34
(95
%C
I)(0
.30
–1
.43
)(0
.19
–1
.01
)(0
.47
–1
.82
)(0
.45
–2
.08
)(0
.51
–2
.11
)
Mu
ltiv
aria
ble
-ad
just
edH
R1
(Ref
)0
.70
0.5
60
.91
0.7
70
.77
0.9
18
0.7
25
(95
%C
I)(0
.25
–1
.94
)(0
.21
–1
.51
)(0
.37
–2
.22
)(0
.29
–2
.07
)(0
.30
–2
.02
)
Oth
erca
use
s
Men N
o.
of
dea
ths
50
71
77
19
79
12
20
Ag
e-ad
just
edH
R1
(Ref
)0
.81
0.9
30
.85
0.6
81
.04
0.5
61
(95
%C
I)(0
.51
–1
.28
)(0
.59
–1
.45
)(0
.58
–1
.26
)(0
.44
–1
.05
)(0
.71
–1
.54
)
Mu
ltiv
aria
ble
-ad
just
edH
R1
(Ref
)0
.85
0.8
90
.90
0.5
90
.92
0.5
41
0.0
22
(95
%C
I)(0
.52
–1
.40
)(0
.54
–1
.47
)(0
.58
–1
.39
)(0
.36
–0
.96
)(0
.59
–1
.43
)
Wo
men
No
.o
fd
eath
s5
67
58
51
22
49
75
Ag
e-ad
just
edH
R1
(Ref
)0
.65
0.6
60
.49
0.5
30
.55
0.0
06
(95
%C
I)(0
.43
–1
.00
)(0
.44
–1
.00
)(0
.33
–0
.73
)(0
.34
–0
.84
)(0
.36
–0
.84
)
Coffee, tea and mortality 189
123

intake showed a significantly inverse association with
overall mortality in men which was nonlinear, and a pos-
itive association in women, after multivariable adjustment
(Table 4, and Fig. 3). In men, hazard ratios were below one
for any nonzero percentage tea drinking, compared to
exclusive coffee drinkers; the lowest hazard ratio was
observed when the percentage tea intake was 30–50%
(Fig. 3). In women, however, the lowest mortality risk was
observed for those drinking less than 40% tea, and the HR
increased with higher tea percentages to significantly ele-
vated levels of 1.41 (1.01–1.99) when comparing 80–100%
tea drinkers to 0–\ 20% tea drinkers. The HR per incre-
ment of 10% tea was 1.04 (1.00–1.07) (there was no evi-
dence for nonlinearity in women). In cause-specific
analyses of percentage tea intake, both deaths due to
cancer and CVD were significantly inversely related to
percentage tea intake in men in a nonlinear fashion
(Table 4 and Supplementary Figure S5), while there was
no significant association with deaths due to respiratory or
other causes of death. In women, percentage tea intake
showed significantly positive associations with deaths due
to CVD and Other causes (Table 4, Figure S5).Table
2(c
on
tin
ued
)
Co
ffee
(cu
ps/
day
)(m
edia
n)
Ptr
end
Pn
on
-lin
eari
ty
0–
1.0
cup
s/d
1.1
–\3
cup
s/d
3–\
4cu
ps/
d4
–\5
cup
s/d
5–\
6cu
ps/
d6?
cup
s/d
(1)
(2)
(3)
(4)
(5)
(6)
Mu
ltiv
aria
ble
-ad
just
edH
R1
(Ref
)0
.50
0.5
30
.33
0.3
90
.30
\0
.00
10
.00
1
(95
%C
I)(0
.31
–0
.81
)(0
.32
–0
.86
)(0
.20
–0
.53
)(0
.23
–0
.67
)(0
.17
–0
.52
)
aM
ult
ivar
iab
lean
aly
ses
wer
ead
just
edfo
r:ag
eat
bas
elin
e(c
on
tin
uo
us,
iny
ears
),ci
gar
ette
smo
kin
gst
atu
s(c
od
edas
nev
er,
form
er,
curr
ent
smo
ker
),n
um
ber
of
cig
aret
tes
smo
ked
per
day
,an
d
yea
rso
fsm
ok
ing
(bo
thco
nti
nu
ou
s,ce
nte
red
)),
his
tory
of
ph
ysi
cian
-dia
gn
ose
dh
yp
erte
nsi
on
(no
,y
es)
and
dia
bet
es(n
o,
yes
),b
od
yh
eig
ht
(co
nti
nuo
us,
m),
BM
I(\
18
.5,
18
.5–\
25
,2
5–\
30
,
C3
0k
g/m
2),
no
n-o
ccu
pat
ion
alp
hy
sica
lac
tiv
ity
(\3
0,
30
–6
0,
61
–9
0,C
90
min
/day
),h
igh
est
lev
elo
fed
uca
tio
n(p
rim
ary
sch
oo
lo
rlo
wer
vo
cati
on
al,
seco
nd
ary
or
med
ium
vo
cati
on
al,
and
hig
her
vo
cati
on
alo
ru
niv
ersi
ty),
inta
ke
of
alco
ho
l(0
,0
.1–\
5,
5–\
15
,1
5–\
30
,3
0?
g/d
ay),
nu
ts(0
,0
.1–\
5,
5–\
10
,1
0?
g/d
ay),
veg
etab
les
and
fru
it(b
oth
con
tin
uo
us,
g/d
ay),
tea
(co
nti
nu
ou
s,cu
ps/
day
),en
erg
y(c
on
tin
uo
us,
kca
l/d
ay),
use
of
nu
trit
ion
alsu
pp
lem
ents
(no
,y
es),
and
,in
wo
men
,p
ost
men
op
ausa
lH
RT
(nev
er,
ever
)0.5
0.6
0.7
0.80.91.0
1.2
1.5
2.0
Haz
ard
Rat
io
0 1 2 3 4 5 6 7 8 9
Coffee intake (cups/day)
MenWomen
Fig. 1 Spline regression curves for the association between coffee
intake and total mortality. Red lines: men. Blue lines: women. Solid
lines represents point estimates and dashed lines represent 95% CI.
Multivariate HRs are calculated by restricted cubic spline regression
(using 3 knots at 10th, 50th, and 90th percentiles) adjusting for: age at
baseline (continuous, in years), cigarette smoking status (coded as
never, former, current smoker), number of cigarettes smoked per day,
and years of smoking (both continuous, centered), history of
physician-diagnosed hypertension (no, yes) and diabetes (no, yes),
body height (continuous, m), BMI (\ 18.5, 18.5–\ 25, 25–\ 30,
C 30 kg/m2), non-occupational physical activity (\ 30, 30–60,
61–90, C 90 min/day), highest level of education (primary school
or lower vocational, secondary or medium vocational, and higher
vocational or university), intake of alcohol (0, 0.1–\ 5, 5–\ 15, 15–
\ 30, 30? g/day), nuts (0, 0.1–\ 5, 5–\ 10, 10? g/day), vegeta-
bles and fruit (both continuous, g/day), tea (continuous, cups/day),
energy (continuous, kcal/day), use of nutritional supplements (no,
yes), and, in women, postmenopausal HRT (never, ever). (Color
figure online)
190 P. A. van den Brandt
123

Table3
Ov
eral
lan
dca
use
-sp
ecifi
cm
ort
alit
yac
cord
ing
tote
ain
tak
ein
mu
ltiv
aria
ble
-ad
just
eda
anal
yse
s,N
LC
S
Tea
(cu
ps/
day
)(m
edia
n)
Ptr
end
Pn
on
-lin
eari
ty
00
.1–\
22
–\3
3–\
44
–\5
5?
(0)
(1)
(2)
(3)
(4)
(6)
All
cau
ses
Men N
o.
of
dea
ths
10
30
81
51
38
47
02
93
17
74
Per
son
-yea
rsin
sub
coh
ort
19
24
22
05
36
31
17
29
23
73
19
25
Ag
e-ad
just
edH
R1
(Ref
)0
.72
0.6
40
.65
0.5
70
.59
\0
.00
1
(95
%C
I)(0
.57
–0
.91
)(0
.52
–0
.78
)(0
.51
–0
.84
)(0
.45
–0
.72
)(0
.46
–0
.75
)
Mu
ltiv
aria
ble
-ad
just
edH
R1
(Ref
)0
.81
0.7
20
.83
0.7
60
.77
0.0
84
0.0
04
(95
%C
I)(0
.63
–1
.04
)(0
.57
–0
.91
)(0
.64
–1
.09
)(0
.58
–0
.98
)(0
.58
–1
.01
)
Wo
men
No
.o
fd
eath
s3
65
30
26
70
42
56
56
61
1
Per
son
-yea
rsin
sub
coh
ort
15
10
18
69
37
18
23
89
33
72
32
49
Ag
e-ad
just
edH
R1
(Ref
)0
.71
0.7
80
.70
0.7
70
.74
0.0
83
(95
%C
I)(0
.54
–0
.94
)(0
.62
–1
.00
)(0
.54
–0
.91
)(0
.60
–0
.98
)(0
.58
–0
.94
)
Mu
ltiv
aria
ble
-ad
just
edH
R1
(Ref
)0
.78
0.9
40
.87
0.9
40
.97
0.6
97
0.9
05
(95
%C
I)(0
.57
–1
.07
)(0
.72
–1
.24
)(0
.64
–1
.17
)(0
.70
–1
.26
)(0
.72
–1
.30
)
Can
cer
Men P
erso
n-y
ears
insu
bco
ho
rt1
92
42
20
53
63
11
72
92
37
31
92
5
No
.o
fd
eath
s4
62
34
45
89
28
94
04
34
1
Ag
e-ad
just
edH
R1
(Ref
)0
.67
0.6
10
.61
0.5
70
.60
\0
.00
1
(95
%C
I)(0
.53
–0
.86
)(0
.49
–0
.76
)(0
.47
–0
.80
)(0
.44
–0
.73
)(0
.46
–0
.77
)
Mu
ltiv
aria
ble
-ad
just
edH
R1
(Ref
)0
.75
0.6
90
.77
0.7
70
.79
0.2
43
0.0
04
(95
%C
I)(0
.57
–0
.98
)(0
.54
–0
.89
)(0
.57
–1
.03
)(0
.58
–1
.01
)(0
.59
–1
.06
)
Wo
men
Per
son
-yea
rsin
sub
coh
ort
15
10
18
69
37
18
23
89
33
72
32
49
No
.o
fd
eath
s1
59
14
43
26
20
33
04
28
4
Ag
e-ad
just
edH
R1
(Ref
)0
.76
0.8
50
.78
0.8
20
.80
0.2
76
(95
%C
I)(0
.55
–1
.04
)(0
.65
–1
.12
)(0
.58
–1
.04
)(0
.63
–1
.08
)(0
.60
–1
.05
)
Mu
ltiv
aria
ble
-ad
just
edH
R1
(Ref
)0
.79
0.9
90
.91
0.9
90
.98
0.5
79
0.6
51
(95
%C
I)(0
.56
–1
.11
)(0
.74
–1
.33
)(0
.66
–1
.26
)(0
.73
–1
.35
)(0
.72
–1
.35
)
Car
dio
vas
cula
rd
isea
se
Men No
.o
fd
eath
s3
63
29
84
72
24
83
34
28
0
Coffee, tea and mortality 191
123

Table
3(c
on
tin
ued
)
Tea
(cu
ps/
day
)(m
edia
n)
Ptr
end
Pn
on
-lin
eari
ty
00
.1–\
22
–\3
3–\
44
–\5
5?
(0)
(1)
(2)
(3)
(4)
(6)
Ag
e-ad
just
edH
R1
(Ref
)0
.75
0.6
10
.65
0.5
60
.59
\0
.00
1
(95
%C
I)(0
.58
–0
.98
)(0
.47
–0
.77
)(0
.49
–0
.86
)(0
.43
–0
.73
)(0
.45
–0
.78
)
Mu
ltiv
aria
ble
-ad
just
edH
R1
(Ref
)0
.83
0.6
60
.81
0.6
90
.72
0.0
40
0.0
03
(95
%C
I)(0
.61
–1
.12
)(0
.51
–0
.87
)(0
.59
–1
.10
)(0
.51
–0
.94
)(0
.52
–0
.98
)
Wo
men
No
.o
fd
eath
s1
23
89
18
71
36
19
72
00
Ag
e-ad
just
edH
R1
(Ref
)0
.65
0.6
70
.67
0.6
80
.71
0.1
95
(95
%C
I)(0
.45
–0
.93
)(0
.49
–0
.92
)(0
.48
–0
.94
)(0
.50
–0
.93
)(0
.52
–0
.98
)
Mu
ltiv
aria
ble
-ad
just
edH
R1
(Ref
)0
.84
0.9
70
.97
0.9
41
.19
0.2
95
0.8
00
(95
%C
I)(0
.54
–1
.32
)(0
.66
–1
.42
)(0
.64
–1
.47
)(0
.62
–1
.42
)(0
.80
–1
.78
)
Res
pir
ato
ryd
isea
se
Men N
o.
of
dea
ths
69
54
11
05
75
94
4
Ag
e-ad
just
edH
R1
(Ref
)0
.74
0.7
10
.74
0.4
80
.45
\0
.00
1
(95
%C
I)(0
.48
–1
.13
)(0
.49
–1
.04
)(0
.48
–1
.14
)(0
.31
–0
.74
)(0
.28
–0
.71
)
Mu
ltiv
aria
ble
-ad
just
edH
R1
(Ref
)0
.67
0.8
41
.09
0.8
10
.61
0.3
08
0.9
20
(95
%C
I)(0
.38
–1
.17
)(0
.53
–1
.32
)(0
.65
–1
.82
)(0
.49
–1
.33
)(0
.35
–1
.07
)
Wo
men
No
.o
fd
eath
s1
81
53
78
32
28
Ag
e-ad
just
edH
R1
(Ref
)0
.73
0.8
90
.27
0.7
50
.68
0.2
27
(95
%C
I)(0
.36
–1
.51
)(0
.49
–1
.62
)(0
.11
–0
.63
)(0
.41
–1
.39
)(0
.36
–1
.27
)
Mu
ltiv
aria
ble
-ad
just
edH
R1
(Ref
)0
.86
1.0
80
.39
1.0
20
.97
0.9
71
0.6
07
(95
%C
I)(0
.38
–1
.95
)(0
.53
–2
.21
)(0
.15
–1
.05
)(0
.47
–2
.22
)(0
.42
–2
.23
)
Oth
erca
use
s
Men N
o.
of
dea
ths
11
91
03
18
49
31
14
93
Ag
e-ad
just
edH
R1
(Ref
)0
.78
0.7
40
.76
0.6
20
.63
0.0
04
(95
%C
I)(0
.56
–1
.09
)(0
.55
–1
.00
)(0
.54
–1
.08
)(0
.44
–0
.86
)(0
.45
–0
.89
)
Mu
ltiv
aria
ble
-ad
just
edH
R1
(Ref
)1
.06
0.9
81
.06
0.9
10
.92
0.4
83
0.3
58
(95
%C
I)(0
.71
–1
.60
)(0
.69
–1
.41
)(0
.70
–1
.59
)(0
.61
–1
.34
)(0
.60
–1
.38
)
Wo
men
No
.o
fd
eath
s5
54
71
08
64
10
68
2
Ag
e-ad
just
edH
R1
(Ref
)0
.75
0.8
50
.70
0.8
20
.65
0.0
80
192 P. A. van den Brandt
123

There was no significant interaction between coffee and
tea drinking in relation to total mortality among men (Pin-
teraction = 0.908) nor women (Pinteraction = 0.422). Supple-
mentary Table 1 shows HRs for combined categories of
coffee and tea intake in men and women, respectively.
Compared to those drinking 5? cups coffee/day and 0–\ 2
cups of tea, HRs in other categories (increasing tea and
decreasing coffee) were decreased in men, and generally
increased in women. The lowest mortality HR [0.74
(0.45–1.22)] in men was observed for those drinking 0–\ 2
cups coffee/day and 2–\ 4 cups of tea. Women drinking 0–
\ 2 cups coffee/day and 2–\ 4 cups of tea had a signifi-
cantly elevated HR of 1.92 (1.06–3.45) compared to women
drinking 5? cups coffee/day and 0–\ 2 cups of tea. The
lowest mortality HRs in women were observed for those
drinking relatively high coffee and low tea quantities.
Cause-specific analyses of interaction between coffee and
tea were not significant (data not shown).
In subgroup analyses of percentage tea intake (catego-
rized as above) and overall mortality within categories of
smoking, alcohol, BMI, physical activity, and MD-adher-
ence, only BMI showed a significant interaction withTable
3(c
on
tin
ued
)
Tea
(cu
ps/
day
)(m
edia
n)
Ptr
end
Pn
on
-lin
eari
ty
00
.1–\
22
–\3
3–\
44
–\5
5?
(0)
(1)
(2)
(3)
(4)
(6)
(95
%C
I)(0
.48
–1
.18
)(0
.58
–1
.26
)(0
.46
–1
.07
)(0
.55
–1
.20
)(0
.44
–0
.97
)
Mu
ltiv
aria
ble
-ad
just
edH
R1
(Ref
)0
.72
0.8
80
.67
0.8
00
.68
0.1
92
0.9
99
(95
%C
I)(0
.43
–1
.23
)(0
.55
–1
.41
)(0
.40
–1
.13
)(0
.49
–1
.30
)(0
.41
–1
.11
)
aM
ult
ivar
iab
lean
aly
ses
wer
ead
just
edfo
r:ag
eat
bas
elin
e(c
on
tin
uo
us,
iny
ears
),ci
gar
ette
smo
kin
gst
atu
s(c
od
edas
nev
er,
form
er,
curr
ent
smo
ker
),n
um
ber
of
cig
aret
tes
smo
ked
per
day
,an
d
yea
rso
fsm
ok
ing
(bo
thco
nti
nu
ou
s,ce
nte
red
)),
his
tory
of
ph
ysi
cian
-dia
gn
ose
dh
yp
erte
nsi
on
(no
,y
es)
and
dia
bet
es(n
o,
yes
),b
od
yh
eig
ht
(co
nti
nuo
us,
m),
BM
I(\
18
.5,
18
.5–\
25
,2
5–\
30
,
C3
0k
g/m
2),
no
n-o
ccu
pat
ion
alp
hy
sica
lac
tiv
ity
(\3
0,
30
–6
0,
61
–9
0,C
90
min
/day
),h
igh
est
lev
elo
fed
uca
tio
n(p
rim
ary
sch
oo
lo
rlo
wer
vo
cati
on
al,
seco
nd
ary
or
med
ium
vo
cati
on
al,
and
hig
her
vo
cati
on
alo
ru
niv
ersi
ty),
inta
ke
of
alco
ho
l(0
,0
.1–\
5,
5–\
15
,1
5–\
30
,3
0?
g/d
ay),
nu
ts(0
,0
.1–\
5,
5–\
10
,1
0?
g/d
ay),
veg
etab
les
and
fru
it(b
oth
con
tin
uo
us,
g/d
ay),
coff
ee
(co
nti
nu
ou
s,cu
ps/
day
),en
erg
y(c
on
tin
uo
us,
kca
l/d
ay),
use
of
nu
trit
ion
alsu
pp
lem
ents
(no
,y
es),
and
,in
wo
men
,p
ost
men
op
ausa
lH
RT
(nev
er,
ever
) 0.5
0.6
0.7
0.80.91.0
1.2
1.5
2.0
Haz
ard
Rat
io
0 1 2 3 4 5 6 7 8 9
Tea intake (cups/day)
MenWomen
Fig. 2 Spline regression curves for the association between tea intake
and total mortality. Red lines: men. Blue lines: women. Multivariate
HRs are calculated by restricted cubic spline regression (using 3 knots
at 10th, 50th, and 90th percentiles) adjusting for: age at baseline
(continuous, in years), cigarette smoking status (coded as never,
former, current smoker), number of cigarettes smoked per day, and
years of smoking (both continuous, centered), history of physician-
diagnosed hypertension (no, yes) and diabetes (no, yes), body height
(continuous, m), BMI (\ 18.5, 18.5–\ 25, 25–\ 30, C 30 kg/m2),
non-occupational physical activity (\ 30, 30–60, 61–90,
C 90 min/day), highest level of education (primary school or lower
vocational, secondary or medium vocational, and higher vocational or
university), intake of alcohol (0, 0.1–\ 5, 5–\ 15, 15–\ 30, 30?
g/day), nuts (0, 0.1–\ 5, 5–\ 10, 10? g/day), vegetables and fruit
(both continuous, g/day), coffee (continuous, cups/day), energy
(continuous, kcal/day), use of nutritional supplements (no, yes),
and, in women, postmenopausal HRT (never, ever). (Color figure
online)
Coffee, tea and mortality 193
123
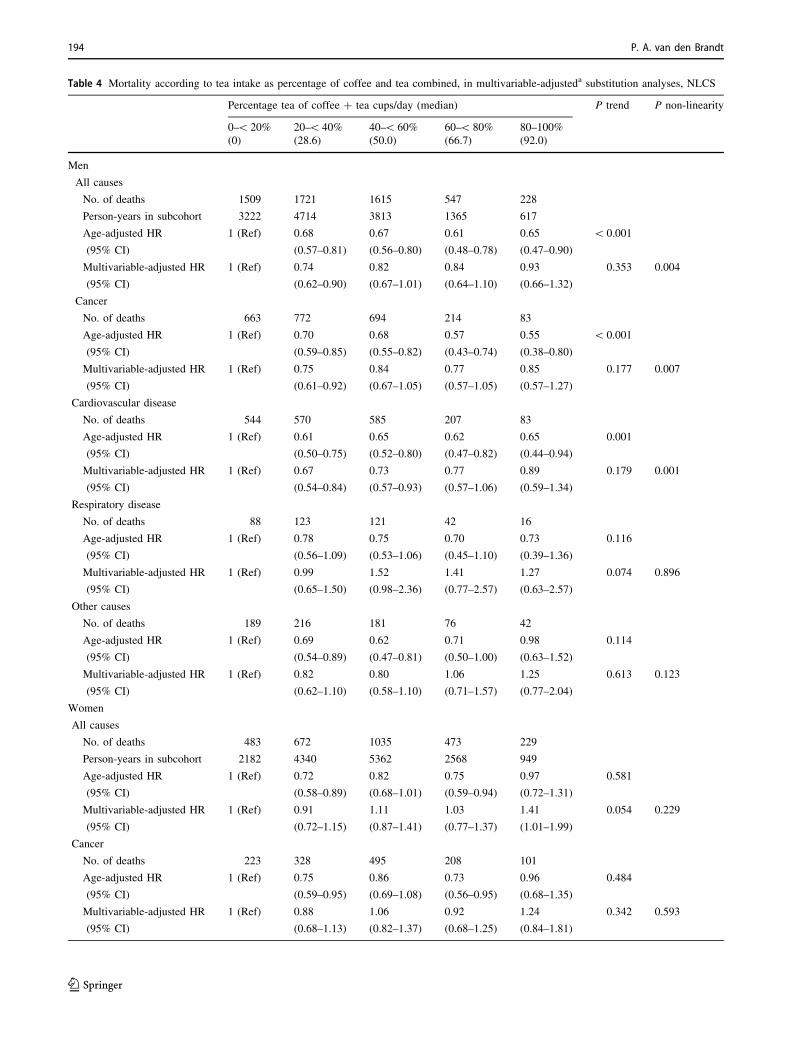
Table 4 Mortality according to tea intake as percentage of coffee and tea combined, in multivariable-adjusteda substitution analyses, NLCS
Percentage tea of coffee ? tea cups/day (median) P trend P non-linearity
0–\ 20% 20–\ 40% 40–\ 60% 60–\ 80% 80–100%
(0) (28.6) (50.0) (66.7) (92.0)
Men
All causes
No. of deaths 1509 1721 1615 547 228
Person-years in subcohort 3222 4714 3813 1365 617
Age-adjusted HR 1 (Ref) 0.68 0.67 0.61 0.65 \ 0.001
(95% CI) (0.57–0.81) (0.56–0.80) (0.48–0.78) (0.47–0.90)
Multivariable-adjusted HR 1 (Ref) 0.74 0.82 0.84 0.93 0.353 0.004
(95% CI) (0.62–0.90) (0.67–1.01) (0.64–1.10) (0.66–1.32)
Cancer
No. of deaths 663 772 694 214 83
Age-adjusted HR 1 (Ref) 0.70 0.68 0.57 0.55 \ 0.001
(95% CI) (0.59–0.85) (0.55–0.82) (0.43–0.74) (0.38–0.80)
Multivariable-adjusted HR 1 (Ref) 0.75 0.84 0.77 0.85 0.177 0.007
(95% CI) (0.61–0.92) (0.67–1.05) (0.57–1.05) (0.57–1.27)
Cardiovascular disease
No. of deaths 544 570 585 207 83
Age-adjusted HR 1 (Ref) 0.61 0.65 0.62 0.65 0.001
(95% CI) (0.50–0.75) (0.52–0.80) (0.47–0.82) (0.44–0.94)
Multivariable-adjusted HR 1 (Ref) 0.67 0.73 0.77 0.89 0.179 0.001
(95% CI) (0.54–0.84) (0.57–0.93) (0.57–1.06) (0.59–1.34)
Respiratory disease
No. of deaths 88 123 121 42 16
Age-adjusted HR 1 (Ref) 0.78 0.75 0.70 0.73 0.116
(95% CI) (0.56–1.09) (0.53–1.06) (0.45–1.10) (0.39–1.36)
Multivariable-adjusted HR 1 (Ref) 0.99 1.52 1.41 1.27 0.074 0.896
(95% CI) (0.65–1.50) (0.98–2.36) (0.77–2.57) (0.63–2.57)
Other causes
No. of deaths 189 216 181 76 42
Age-adjusted HR 1 (Ref) 0.69 0.62 0.71 0.98 0.114
(95% CI) (0.54–0.89) (0.47–0.81) (0.50–1.00) (0.63–1.52)
Multivariable-adjusted HR 1 (Ref) 0.82 0.80 1.06 1.25 0.613 0.123
(95% CI) (0.62–1.10) (0.58–1.10) (0.71–1.57) (0.77–2.04)
Women
All causes
No. of deaths 483 672 1035 473 229
Person-years in subcohort 2182 4340 5362 2568 949
Age-adjusted HR 1 (Ref) 0.72 0.82 0.75 0.97 0.581
(95% CI) (0.58–0.89) (0.68–1.01) (0.59–0.94) (0.72–1.31)
Multivariable-adjusted HR 1 (Ref) 0.91 1.11 1.03 1.41 0.054 0.229
(95% CI) (0.72–1.15) (0.87–1.41) (0.77–1.37) (1.01–1.99)
Cancer
No. of deaths 223 328 495 208 101
Age-adjusted HR 1 (Ref) 0.75 0.86 0.73 0.96 0.484
(95% CI) (0.59–0.95) (0.69–1.08) (0.56–0.95) (0.68–1.35)
Multivariable-adjusted HR 1 (Ref) 0.88 1.06 0.92 1.24 0.342 0.593
(95% CI) (0.68–1.13) (0.82–1.37) (0.68–1.25) (0.84–1.81)
194 P. A. van den Brandt
123

percentage tea intake in women (Pinteraction = 0.011) and
not in men (Pinteraction = 0.599). This is further illustrated
in Supplementary Figure S6, where a strong positive
association with percentage tea intake is visible in over-
weight women and no association in normal weight
women. Because the percentage never smokers was very
low in NLCS men, smoking was categorized into a sub-
group of never smokers or those who stopped C 10 years
ago, and a subgroup of current smokers or stopped
\ 10 years ago. Both subgroups showed comparable
associations between percentage tea intake and mortality,
in men (Pinteraction = 0.954) and women (Pinterac-
tion = 0.541) (Supplementary Figure S7). Additional
adjustment for other fluid intake in sensitivity analyses
yielded essentially similar estimates (data not shown).
Discussion
In this large prospective study higher coffee intake was
significantly and nonlinearly related to lower overall mor-
tality in women, after adjusting for confounders including
tea intake. When comparing 6? versus 0–1 cups (of
125 ml) coffee/day, the HR (95% CI) was 0.65
(0.47–0.90). No significant association was seen with
overall mortality in men. In women, the inverse association
with coffee was seen for cancer, cardiovascular mortality
and other causes of death, but not for respiratory mortality,
while the results for men showed the opposite. Restricted
cubic splines analyses indicated that drinking up to 5 cups
(or 625 ml)/day of coffee was associated with significantly
decreased mortality in women, with no further decrease in
mortality with higher intakes. In contrast, tea intake was
significantly nonlinearly related to lower overall, cancer
and CVD mortality in men, but showed no association with
overall mortality in women, nor with specific causes of
death. Restricted cubic splines analyses indicated that
drinking up to 5 cups (or 625 ml)/day of tea was associated
with significantly decreased mortality in men, with the
lowest HR (0.72, 95% CI 0.57–0.91) observed in men
drinking 2–3 cups/day, compared to nonconsumers. There
was no significant interaction between coffee and tea
intake. In substitution analyses, increasing tea intake (ex-
pressed as percentage of total coffee and tea intake) was
Table 4 (continued)
Percentage tea of coffee ? tea cups/day (median) P trend P non-linearity
0–\ 20% 20–\ 40% 40–\ 60% 60–\ 80% 80–100%
(0) (28.6) (50.0) (66.7) (92.0)
Cardiovascular disease
No. of deaths 156 189 315 171 66
Age-adjusted HR 1 (Ref) 0.64 0.77 0.81 0.84 0.794
(95% CI) (0.48–0.85) (0.59–1.00) (0.60–1.09) (0.57–1.24)
Multivariable-adjusted HR 1 (Ref) 0.92 1.12 1.28 1.40 0.042 0.229
(95% CI) (0.66–1.29) (0.80–1.57) (0.87–1.88) (0.87–2.25)
Respiratory disease
No. of deaths 24 35 43 16 10
Age-adjusted HR 1 (Ref) 0.76 0.68 0.50 0.84 0.154
(95% CI) (0.44–1.31) (0.40–1.15) (0.26–0.96) (0.38–1.84)
Multivariable-adjusted HR 1 (Ref) 1.09 1.19 0.62 1.62 0.912 0.791
(95% CI) (0.55–2.15) (0.60–2.36) (0.25–1.54) (0.60–4.34)
Other causes
No. of deaths 67 105 157 64 47
Age-adjusted HR 1 (Ref) 0.82 0.89 0.71 1.41 0.643
(95% CI) (0.57–1.16) (0.64–1.25) (0.48–1.06) (0.89–2.21)
Multivariable-adjusted HR 1 (Ref) 1.11 1.34 1.07 2.44 0.023 0.356
(95% CI) (0.72–1.69) (0.87–2.07) (0.65–1.77) (1.39–4.28)
aMultivariable analyses were adjusted for: age at baseline (continuous, in years), cigarette smoking status (coded as never, former, current
smoker), number of cigarettes smoked per day, and years of smoking (both continuous, centered)), history of physician-diagnosed hypertension
(no, yes) and diabetes (no, yes), body height (continuous, m), BMI (\ 18.5, 18.5–\ 25, 25–\ 30, C 30 kg/m2), non-occupational physical
activity (\ 30, 30–60, 61–90, C 90 min/day), highest level of education (primary school or lower vocational, secondary or medium vocational,
and higher vocational or university), intake of alcohol (0, 0.1–\ 5, 5–\ 15, 15–\ 30, 30? g/day), nuts (0, 0.1–\ 5, 5–\ 10, 10? g/day),
vegetables and fruit (both continuous, g/day), coffee ? tea (continuous, cups/day), energy (continuous, kcal/day), use of nutritional supplements
(no, yes), and, in women, postmenopausal HRT (never, ever)
Coffee, tea and mortality 195
123

significantly and nonlinearly related to lower overall,
cancer and cardiovascular mortality in men, but in women
higher tea percentages were positively associated with
overall mortality (and most causes of death). This Dutch
study suggests that for men, compared to exclusive coffee
drinkers, those drinking 30–50% tea have the lowest
mortality (HR 0.70); any nonzero percentage tea drinking
seems better than only coffee. For women, those who drank
exclusively coffee or drinking up to 40% tea had the lowest
mortality, but those drinking higher percentages of tea were
at increased mortality risk, up to a HR of 1.41 (1.01–1.99)
for 80–100% tea drinkers).
The association between coffee and tea (and fluid)
intake and mortality due to IHD or stroke was previously
investigated in the NLCS [20]. Then, it was found that
coffee was inversely associated with IHD mortality in
women only (and positively in men), while tea intake was
associated with lower IHD mortality in men only. For
stroke mortality, no associations with coffee or tea were
observed [20]. In this Dutch population, there is no dif-
ference between men and women in the way coffee and tea
are prepared and consumed.
Several meta-analyses have been published on mortality
and coffee and tea intake [4, 7, 21–25]. The most recent
meta-analysis for coffee with 31 cohort studies [4] con-
cluded that overall and CVD mortality were significantly
reduced for consumption of up to 4 cups/day of coffee,
with no further decrease in mortality with higher intakes.
Nevertheless, there was significant heterogeneity in the
estimates. When analyses were limited to non-smokers,
cancer mortality was also decreased with increasing coffee
intake. No relevant differences were noted according to
gender, type of coffee, or geographical area. However,
their restricted cubic splines analyses (Suppl Fig. 1 in
Grosso et al. [4.]) also suggests that for cancer mortality,
there was a clear inverse association with coffee in women,
and no or a possibly positive association in men, similar to
the current NLCS findings. In the NLCS we also found a
significantly decreased overall mortality for intake up to
4–5 cups/day in women, but in men this was far less evi-
dent and not significant, and there was significant hetero-
geneity between the sexes. Recently, two major cohort
studies also reported their findings on coffee and mortality
[5, 6]. In EPIC, inverse associations with coffee intake
were found with overall mortality in men and women, but
coffee was positively associated with cancer mortality in
women and not associated in men. For CVD mortality the
association was much stronger inverse in women than in
men [5]. In the MEC study, significantly inverse associa-
tions with increasing coffee intake were found with overall
mortality in men and women in various nonwhite popula-
tions and in whites [6]. Inverse associations were also
found with, a.o., deaths due to heart disease, cancer and
respiratory disease, but no cause-specific results per sex
were presented. Both studies did not additionally adjust for
tea intake, nor reported on tests for nonlinearity in the
associations with coffee. In another recent analysis [26] of
three major cohorts, the Nurses’ Health Study (NHS)
cohorts I and II, and Health Professionals Follow-up Study
(HPFS), nonlinear associations between (total, caffeinated
and decaffeinated) coffee intake and total mortality and
most causes of death were seen, but not for cancer.
Although the authors mentioned that results were not dif-
ferent for men and women, their sex-specific results for
total mortality show that significantly inverse associations
with coffee were only present for women in the NHS
cohorts, but not for men in the HPFS. Unfortunately, no
significance test was shown for the possible interaction
with sex in that publication [26]. In the NIH-AARP Diet
and Health Study [27] and the PLCO cohort [28], signifi-
cant associations were seen for men and women. In the
NLCS, associations with total mortality seem somewhat
stronger inverse in women than in most other major cohorts
and meta-analyses [4–6, 26, 27].
0.5
0.6
0.7
0.80.91.0
1.2
1.5
2.0H
azar
d R
atio
0 10 20 30 40 50 60 70 80 90 100
Percentage tea of coffee+tea
MenWomen
Fig. 3 Spline regression curves for the association between percent-
age tea of total coffee and tea and total mortality in substitution
analyses. Red lines: men. Blue lines: women. Multivariate HRs are
calculated by restricted cubic spline regression (using 3 knots at 10th,
50th, and 90th percentiles) adjusting for: age at baseline (continuous,
in years), cigarette smoking status (coded as never, former, current
smoker), number of cigarettes smoked per day, and years of smoking
(both continuous, centered), history of physician-diagnosed hyper-
tension (no, yes) and diabetes (no, yes), body height (continuous, m),
BMI (\ 18.5, 18.5–\ 25, 25–\ 30, C 30 kg/m2), non-occupational
physical activity (\ 30, 30–60, 61–90, C 90 min/day), highest level
of education (primary school or lower vocational, secondary or
medium vocational, and higher vocational or university), intake of
alcohol (0, 0.1–\ 5, 5–\ 15, 15–\ 30, 30? g/day), nuts (0, 0.1–\ 5,
5–\ 10, 10? g/day), vegetables and fruit (both continuous, g/day),
coffee ? tea (continuous, cups/day), energy (continuous, kcal/day),
use of nutritional supplements (no, yes), and, in women, post-
menopausal HRT (never, ever). (Color figure online)
196 P. A. van den Brandt
123

The most recent meta-analysis for tea with 18 cohort
studies concluded that black tea consumption was signifi-
cantly inversely associated with overall and cancer mor-
tality, while green tea consumption was significantly
inversely associated with overall and CVD mortality [7].
However, there was large and significant heterogeneity in
the estimates for both types of tea. Both green and black tea
showed significant nonlinear associations with overall
mortality; for black tea this was a U-shaped relation with
the lowest risk for those drinking 2–3 cups/day (of size
150 ml) [7]. This is comparable with the current NLCS
findings among men. Due to the limited number of studies
in the meta-analysis on black tea among men, differences
according to gender could not be investigated very well. A
recent analysis from the NHS II cohort [29] reported
inverse associations between tea consumption (more than
once per week versus nonconsumers) and total, cancer and
CVD mortality, but no adjustment was made for coffee
intake. It should be noted that the studied contrast in tea
intake in NHS II (more than once per week versus non-
consumers) reflects the low tea intake levels in the NHS
and is quite different from the levels studied in the NLCS
(5? cups/day versus nonconsumers) reflecting much higher
intakes.
In a limited number of the previous studies, analyses for
coffee were adjusted for tea intake, and vice versa. Sur-
prisingly few studies have evaluated coffee and tea
simultaneously in relation to mortality [30]. In the Northern
Manhattan Study cohort (n = 2461, 36% men; 863 deaths),
inverse associations for coffee and tea with total mortality
were reported [30], and HRs for coffee were somewhat
attenuated when other beverages were adjusted for, while
associations for tea were strengthened. More so than cof-
fee, tea was inversely associated with nonvascular mor-
tality, particularly cancer death. They also found an inverse
association of total intake of coffee and tea with mortality
[30]. While no significant interaction was found between
coffee and tea in the NLCS, the substitution analyses
revealed that in men who only drink coffee had the highest
mortality, and men drinking 30–50% of total coffee and tea
intake as tea had the lowest mortality. Women who drank
exclusively coffee or drank up to 40% tea had the lowest
mortality, but mortality was increased at higher tea intake
percentages. To the knowledge of the author, there is no
other study that has investigated substitution effects of
coffee versus tea on mortality. Before interpreting this (as
causal), these differences in mortality risks associated with
coffee and tea and per sex need confirmation first in other
studies that can examine coffee and tea simultaneously.
Roasted coffee contains many bioactive compounds, the
most important classes of which seem to be chlorogenic
acids, caffeine, trigonelline and the diterpenes kahweol and
cafestol [31]. In vitro experiments have shown antioxidant,
anti-inflammatory, antihypertensive, hypoglycemic, and
anticarcinogenic activity of these compounds [4, 31–35].
For example, caffeine might contribute to the antioxidant
capacity of coffee. In addition, roasted coffee is an
important source of nicotinic acid [36], but also of acry-
lamide which may exert adverse health effects [37]. For
both coffee and tea, antioxidant mechanisms have been
proposed as the most likely explanation of potential health
benefit against chronic diseases, as well as anti-inflamma-
tory mechanisms [4, 7]. The main polyphenols present in
coffee are phenolic acids, particularly chlorogenic acids
[4]. The main polyphenols present in tea are flavonoids,
particularly catechins (in green tea) and flavanols, thea-
flavins and thearubigins in black tea [38–40]. It has been
suggested that tea polyphenols could lower plasma
cholesterol, inhibit reactive oxygen species, induce hypo-
lipemia and decrease antifibrinolysis [7, 41, 42]. Cancer-
protective effects of tea have been found in laboratory
studies; the potential mechanisms responsible for this
include modulation of phase II metabolism, increased
antioxidant response, reduced inflammation through inhi-
bition of NF-jB, inhibited growth factor (VEGF-1) sig-
naling, and control of epigenetic modifications and
modulation of immune system [7, 39, 43–45].
The observed differences for coffee and tea, according
to gender, are potentially related to modulated endogenous
sex hormone and sex hormone binding globulin (SHBG)
levels. Only few studies have been conducted on coffee, tea
and sex hormone and SHBG levels, and most were cross-
sectional by design with varying results. Regarding cross-
sectional studies, no significant association was found
between coffee or caffeine intake and serum sex hormone
and SHBG levels in 1241 middle-aged American men [46].
In a study among 52 healthy elderly Greek men, coffee
intake was positively related to serum estradiol levels, but
not to testosterone or SHBG levels [47]. In a study among
1563 Norwegian men, coffee was positively associated
with SHBG and total testosterone levels [48]. A recent
French study in 2377 women reported that (caffeinated)
coffee, but not tea intake, was positively related with
SHBG levels, notably in postmenopausal women [49],
confirming earlier studies on coffee and SHBG levels in
women. Low SHBG levels are considered as a consistent
marker of type 2 diabetes risk, especially in women [50].
The estrogens estradiol and estrone are metabolized along
three pathways, according to the initial hydroxylation at the
2-, 4- or 16-positions of the steroid ring [51]. In a study
among 587 premenopausal US nurses focusing on coffee/
tea intake and estrogen metabolism, coffee intake was
associated with higher urinary 2-hydroxyestradiol and
2-hydroxyestrone levels, while tea intake was positively
associated with 17-epiestriol levels (from the 16-pathway).
Metabolites in the 2-pathway are hypothesized to have less
Coffee, tea and mortality 197
123

genotoxic and estrogenic potential than metabolites form
the 4- and 16-pathway, based on laboratory data [52]. The
only randomized controlled trial on coffee and serum sex
hormone levels found no consistent effect of caffeinated
coffee on SHBG or sex hormones in men and women after
8 weeks, but the trial size was small (14 men and 28
women) [53]. Thus, associations between coffee and
SHBG levels seem more consistent for women than men.
Although several studies point towards possible differential
associations of coffee and tea with sex hormone and SHBG
levels in men and women, which might explain some of the
observed mortality differences in the NLCS, the evidence
is still inconsistent. More research is needed on this,
especially from randomized controlled trials.
Strengths of the large-scale NLCS include the prospec-
tive design and high completeness of follow-up, which
makes information and selection bias unlikely. The Dutch
participants had both relatively high coffee and tea con-
sumption levels with large variation between participants
[3, 54], which enabled substitution analyses. Possible
reverse causation due to changes in diet or lifestyle was
minimized by excluding prevalent CVD or cancer cases
[11]. Exclusion of early deaths from follow-up also did not
change the results. Sensitivity analyses among stable coffee
drinkers showed comparable associations, reducing the
likelihood of reverse causation. The availability of detailed
information on smoking habits also enabled better control
for confounding. There was a large impact of multivariable
adjustment on HRs, particularly with smoking; it is
important to control for smoking as tightly as possible [15].
Associations with coffee and tea were also observed in the
group of never smokers or those who stopped C 10 years
ago. Nevertheless, the possibility of residual confounding
by smoking or confounding by unmeasured factors
remains. Other limitations of the NLCS include the absence
of updated information on coffee and tea intake during
follow-up. Because there was no possibility to update
dietary or other lifestyle data during follow-up, this may
have resulted in some attenuated associations. However,
analyses in other cohorts that have evaluated this with
cumulatively updated measurements over time, no sub-
stantial changes in associations with coffee were seen [26].
The validation study of the food frequency questionnaire
has shown that it performs relatively well [13], but mea-
surement error may still have attenuated associations.
Unfortunately, no specific validation study results were
available relating to coffee and tea. Finally, only black tea
could be evaluated, and no information on decaffeinated
coffee was available in the NLCS.
In conclusion, coffee and tea intake were differently
associated with total and cause-specific mortality in this
cohort study, and associations varied between men and
women. This was especially visible when substituting
coffee with tea. Further research is needed to confirm or
refute the mortality results in men and women obtained in
the current study, and on possible differential effects of
coffee and tea on sex hormone and SHBG levels.
Acknowledgements I thank the participants of this study and Statis-
tics Netherlands/CBG for providing data, and I thank the staff of the
Netherlands Cohort Study for their valuable contributions.
Compliance with ethical standards
Conflict of interest There are no competing financial interests in
relation to this work.
Open Access This article is distributed under the terms of the Creative
Commons Attribution 4.0 International License (http://creative
commons.org/licenses/by/4.0/), which permits unrestricted use, dis-
tribution, and reproduction in any medium, provided you give
appropriate credit to the original author(s) and the source, provide a
link to the Creative Commons license, and indicate if changes were
made.
References
1. Ozen AE, Bibiloni M, Pons A, Tur JA. Fluid intake from bev-
erages across age groups: a systematic review. J Hum Nutr Diet.
2015;28(5):417–42. https://doi.org/10.1111/jhn.12250.
2. Elmadfa I, Meyer AL. Patterns of drinking and eating across the
European Union: implications for hydration status. Nutr Rev.
2015;73(Suppl 2):141–7. https://doi.org/10.1093/nutrit/nuv034.
3. Food and Agriculture Organization of the United Nations. Food
Balance Sheets. http://www.fao.org/faostat. Accessed 23 July
2017.
4. Grosso G, Micek A, Godos J, et al. Coffee consumption and risk
of all-cause, cardiovascular, and cancer mortality in smokers and
non-smokers: a dose-response meta-analysis. Eur J Epidemiol.
2016;31(12):1191–205. https://doi.org/10.1007/s10654-016-
0202-2.
5. Gunter MJ, Murphy N, Cross AJ, et al. Coffee drinking and
mortality in 10 European countries: a multinational cohort study.
Ann Intern Med. 2017;167(4):236–47. https://doi.org/10.7326/
M16-2945.
6. Park SY, Freedman ND, Haiman CA, Le Marchand L, Wilkens
LR, Setiawan VW. Association of coffee consumption with total
and cause-specific mortality among nonwhite populations. Ann
Intern Med. 2017;167(4):228–35. https://doi.org/10.7326/M16-
2472.
7. Tang J, Zheng JS, Fang L, Jin Y, Cai W, Li D. Tea consumption
and mortality of all cancers, CVD and all causes: a meta-analysis
of eighteen prospective cohort studies. Br J Nutr.
2015;114(5):673–83. https://doi.org/10.1017/
S0007114515002329.
8. Grigg D. The worlds of tea and coffee: patterns of consumption.
GeoJournal. 2002;57:283–94.
9. van den Brandt PA, Goldbohm RA, van ‘t Veer P, Volovics A,
Hermus RJ, Sturmans F. A large-scale prospective cohort study
on diet and cancer in The Netherlands. J Clin Epidemiol.
1990;43(3):285–95.
10. Prentice RL. A case-cohort design for epidemiologic studies and
disease prevention trials. Biometrika. 1986;73(1):1–11.
198 P. A. van den Brandt
123

11. van den Brandt PA. The impact of a Mediterranean diet and
healthy lifestyle on premature mortality in men and women. Am J
Clin Nutr. 2011;94(3):913–20. https://doi.org/10.3945/ajcn.110.
008250.
12. van den Brandt PA, Schouten LJ. Relationship of tree nut, peanut
and peanut butter intake with total and cause-specific mortality: a
cohort study and meta-analysis. Int J Epidemiol.
2015;44(3):1038–49. https://doi.org/10.1093/ije/dyv039.
13. Goldbohm RA, van den Brandt PA, Brants HA, et al. Validation
of a dietary questionnaire used in a large-scale prospective cohort
study on diet and cancer. Eur J Clin Nutr. 1994;48(4):253–65.
14. Zeegers MP, Dorant E, Goldbohm RA, van den Brandt PA. Are
coffee, tea, and total fluid consumption associated with bladder
cancer risk? Results from the Netherlands Cohort Study. Cancer
Causes Control. 2001;12(3):231–8.
15. Goldbohm RA, Hertog MG, Brants HA, van Poppel G, van den
Brandt PA. Consumption of black tea and cancer risk: a
prospective cohort study. J Natl Cancer Inst. 1996;88(2):93–100.
16. Nevo-Table. Dutch Food Composition table 1986–1987; Neder-
lands voedingsstoffenbestand 1986–1987, 1986.
17. Lin D, Wei L. The robust inference for the Cox proportional
hazards model. J Am Stat Assoc. 1989;84(408):1074–8.
18. Borgi L, Rimm EB, Willett WC, Forman JP. Potato intake and
incidence of hypertension: results from three prospective US
cohort studies. BMJ. 2016;353:i2351. https://doi.org/10.1136/
bmj.i2351.
19. Fung TT, McCullough ML, Newby PK, et al. Diet-quality scores
and plasma concentrations of markers of inflammation and
endothelial dysfunction. Am J Clin Nutr. 2005;82(1):163–73.
20. Leurs LJ, Schouten LJ, Goldbohm RA, van den Brandt PA. Total
fluid and specific beverage intake and mortality due to IHD and
stroke in the Netherlands Cohort Study. Br J Nutr.
2010;104(8):1212–21.
21. Malerba S, Turati F, Galeone C, et al. A meta-analysis of
prospective studies of coffee consumption and mortality for all
causes, cancers and cardiovascular diseases. Eur J Epidemiol.
2013;28(7):527–39. https://doi.org/10.1007/s10654-013-9834-7.
22. Je Y, Giovannucci E. Coffee consumption and total mortality: a
meta-analysis of twenty prospective cohort studies. Br J Nutr.
2014;111(7):1162–73. https://doi.org/10.1017/
S0007114513003814.
23. Crippa A, Discacciati A, Larsson SC, Wolk A, Orsini N. Coffee
consumption and mortality from all causes, cardiovascular dis-
ease, and cancer: a dose-response meta-analysis. Am J Epi-
demiol. 2014;180(8):763–75. https://doi.org/10.1093/aje/kwu194.
24. Zhao Y, Wu K, Zheng J, Zuo R, Li D. Association of coffee
drinking with all-cause mortality: a systematic review and meta-
analysis. Public Health Nutr. 2015;18(7):1282–91. https://doi.org/
10.1017/S1368980014001438.
25. Zhang C, Qin YY, Wei X, Yu FF, Zhou YH, He J. Tea con-
sumption and risk of cardiovascular outcomes and total mortality:
a systematic review and meta-analysis of prospective observa-
tional studies. Eur J Epidemiol. 2015;30(2):103–13. https://doi.
org/10.1007/s10654-014-9960-x.
26. Ding M, Satija A, Bhupathiraju SN, et al. Association of coffee
consumption with total and cause-specific mortality in 3 large
prospective cohorts. Circulation. 2015;132(24):2305–15. https://
doi.org/10.1161/CIRCULATIONAHA.115.017341.
27. Freedman ND, Park Y, Abnet CC, Hollenbeck AR, Sinha R.
Association of coffee drinking with total and cause-specific
mortality. N Engl J Med. 2012;366(20):1891–904. https://doi.org/
10.1056/NEJMoa1112010.
28. Loftfield E, Freedman ND, Graubard BI, et al. Association of
coffee consumption with overall and cause-specific mortality in a
large US Prospective Cohort Study. Am J Epidemiol.
2015;182(12):1010–22. https://doi.org/10.1093/aje/kwv146.
29. Ivey KL, Jensen MK, Hodgson JM, Eliassen AH, Cassidy A,
Rimm EB. Association of flavonoid-rich foods and flavonoids
with risk of all-cause mortality. Br J Nutr. 2017;117(10):1470–7.
https://doi.org/10.1017/S0007114517001325.
30. Gardener H, Rundek T, Wright CB, Elkind MS, Sacco RL.
Coffee and tea consumption are inversely associated with mor-
tality in a multiethnic urban population. J Nutr.
2013;143(8):1299–308. https://doi.org/10.3945/jn.112.173807.
31. Ludwig IA, Clifford MN, Lean ME, Ashihara H, Crozier A.
Coffee: biochemistry and potential impact on health. Food Funct.
2014;5(8):1695–717. https://doi.org/10.1039/c4fo00042k.
32. Onakpoya IJ, Spencer EA, Thompson MJ, Heneghan CJ. The
effect of chlorogenic acid on blood pressure: a systematic review
and meta-analysis of randomized clinical trials. J Hum Hypertens.
2015;29(2):77–81. https://doi.org/10.1038/jhh.2014.46.
33. Lopez-Garcia E, van Dam RM, Qi L, Hu FB. Coffee consumption
and markers of inflammation and endothelial dysfunction in
healthy and diabetic women. Am J Clin Nutr. 2006;84(4):888–93.
34. Wang S, Yoon YC, Sung MJ, Hur HJ, Park JH. Antiangiogenic
properties of cafestol, a coffee diterpene, in human umbilical vein
endothelial cells. Biochem Biophys Res Commun.
2012;421(3):567–71. https://doi.org/10.1016/j.bbrc.2012.04.046.
35. Cardenas C, Quesada AR, Medina MA. Anti-angiogenic and anti-
inflammatory properties of kahweol, a coffee diterpene. PLoS ONE.
2011;6(8):e23407. https://doi.org/10.1371/journal.pone.0023407.
36. Higdon JV, Frei B. Coffee and health: a review of recent human
research. Crit Rev Food Sci Nutr. 2006;46(2):101–23. https://doi.
org/10.1080/10408390500400009.
37. Hogervorst JG, Schouten LJ, Konings EJ, Goldbohm RA, van den
Brandt PA. A prospective study of dietary acrylamide intake and
the risk of endometrial, ovarian, and breast cancer. Cancer Epi-
demiol Biomark Prev. 2007;16(11):2304–13.
38. Beecher GR. Overview of dietary flavonoids: nomenclature,
occurrence and intake. J Nutr. 2003;133(10):3248S–54S.
39. Lambert JD. Does tea prevent cancer? Evidence from laboratory
and human intervention studies. Am J Clin Nutr. 2013;98(6
Suppl):1667S–75S. https://doi.org/10.3945/ajcn.113.059352.
40. Arts IC, Hollman PC, Feskens EJ, Bueno de Mesquita HB,
Kromhout D. Catechin intake and associated dietary and lifestyle
factors in a representative sample of Dutch men and women. Eur
J Clin Nutr. 2001;55(2):76–81.
41. Vinson JA, Teufel K, Wu N. Green and black teas inhibit
atherosclerosis by lipid, antioxidant, and fibrinolytic mechanisms.
J Agric Food Chem. 2004;52(11):3661–5. https://doi.org/10.
1021/jf035255l.
42. Garcia-Lafuente A, Guillamon E, Villares A, Rostagno MA,
Martinez JA. Flavonoids as anti-inflammatory agents: implica-
tions in cancer and cardiovascular disease. Inflamm Res.
2009;58(9):537–52. https://doi.org/10.1007/s00011-009-0037-3.
43. Dou QP. Molecular mechanisms of green tea polyphenols. Nutr
Cancer. 2009;61(6):827–35. https://doi.org/10.1080/
01635580903285049.
44. Tachibana H. Molecular basis for cancer chemoprevention by
green tea polyphenol EGCG. Forum of nutrition.
2009;61:156–69. https://doi.org/10.1159/000212748.
45. Lambert JD, Elias RJ. The antioxidant and pro-oxidant activities
of green tea polyphenols: a role in cancer prevention. Arch
Biochem Biophys. 2010;501(1):65–72. https://doi.org/10.1016/j.
abb.2010.06.013.
46. Field AE, Colditz GA, Willett WC, Longcope C, Mckinlay JB.
The relation of smoking, age, relative weight, and dietary-intake
to serum adrenal-steroids, sex-hormones, and sex hormone-
binding globulin in middle-aged men. J Clin Endocr Metab.
1994;79(5):1310–6. https://doi.org/10.1210/Jc.79.5.1310.
47. Hsieh CC, Signorello LB, Lipworth L, Lagiou P, Mantzoros CS,
Trichopoulos D. Predictors of sex hormone levels among the
Coffee, tea and mortality 199
123

elderly: a study in Greece. J Clin Epidemiol. 1998;51(10):
837–41. https://doi.org/10.1016/S0895-4356(98)00069-9.
48. Svartberg J, Midtby M, Bonaa KH, Sundsfjord J, Joakimsen RM,
Jorde R. The associations of age, lifestyle factors and chronic dis-
ease with testosterone in men: the Tromso Study. Eur J Endocrinol.
2003;149(2):145–52. https://doi.org/10.1530/eje.0.1490145.
49. Pihan-Le Bars F, Gusto G, Boutron-Ruault MC, Fagherazzi G,
Bonnet F. Cross-sectional association of coffee and caffeine
consumption with sex hormone-binding globulin in healthy
nondiabetic women. Clin Endocrinol (Oxf). 2017;87(5):475–83.
https://doi.org/10.1111/cen.13411.
50. Goto A, Song YQ, Chen BH, Manson JE, Buring JE, Liu SM.
Coffee and caffeine consumption in relation to sex hormone–
binding globulin and risk of type 2 diabetes in postmenopausal
women. Diabetes. 2011;60(1):269–75. https://doi.org/10.2337/
db10-1193.
51. Gu F, Caporaso NE, Schairer C, et al. Urinary concentrations of
estrogens and estrogen metabolites and smoking in caucasian
women. Cancer Epidemiol Biomark Prev. 2013;22(1):58–68.
https://doi.org/10.1158/1055-9965.EPI-12-0909.
52. Sisti JS, Hankinson SE, Caporaso NE, et al. Caffeine, coffee, and
tea intake and urinary estrogens and estrogen metabolites in
premenopausal women. Cancer Epidem Biomark. 2015;24(8):
1174–83. https://doi.org/10.1158/1055-9965.EPI-15-0246.
53. Wedick NM, Mantzoros CS, Ding EL, et al. The effects of caf-
feinated and decaffeinated coffee on sex hormone-binding globulin
and endogenous sex hormone levels: a randomized controlled trial.
Nutr J. 2012. https://doi.org/10.1186/1475-2891-11-86.
54. Zhang X, Albanes D, Beeson WL, et al. Risk of colon cancer and
coffee, tea, and sugar-sweetened soft drink intake: pooled analysis of
prospective cohort studies. J Natl Cancer Inst. 2010;102(11):771–83.
200 P. A. van den Brandt
123