cognitive and affective brand trust: an approach to baby
TRANSCRIPT

Cognitive and Affective brand trust: an approach to baby
care category
By
Ana Inês Ferreira Martins
Master’s Dissertation in Marketing
Supervisor: Amélia Brandão
September 2017

i
Biography
Ana Inês Ferreira Martins was born in Viseu in April 7th, 1992.
Inês has a bachelor degree in Economics from Porto School of Economics and
Management (FEP) and have been doing, since 2015, a Master in Marketing at the same
University, which is expected to be concluded with this Master Dissertation.
During her academic life, she was an active member of AIESEC in FEP, namely, she was
External Relations Director AIESEC in FEP 2012/2013 and Vice – President 2013/2014.
Inês also did a two months volunteer period at AIESEC Casablanca’s nonprofit
organization partners (Morocco).
In September 2015, Inês started her professional career at SONAE MC (Loyalty program
development department – Cartão Continente) as a trainee, and later as a Marketing
Technician.
In July 2017 Inês did a certification in International Project Management at ISM
University of Management and Economics (Lithuania) and nowadays she works at
Western Union Business Solutions, in Malta.

ii
Acknowledgements
I would like to thank the continuous support of my supervisor, Professor Amélia Maria
Pinto da Cunha Brandão (PhD).
I also would like to express my gratitude to my family since they have been there for me
during all my academic journey, especially my parents who provided me the needed
support, and my sister, who is the love of my life.
Also, a word must be given to my true and patient friends, who nicely helped me in every
step they could.
A special thank you to Flávio Fernandes for brainstorming with me every time I was
stuck. But most important, for being by my side in life. For being my safe harbour.

iii
Abstract
In a brand era, brand trust is a relevant topic for both management and academy. The
decisive goal of marketing is to create a powerful bond between the consumer and the
brand, and the main element of this bond is trust (Hiscock, 2001).
Nevertheless, previous studies about the topic have essentially focused on commonly
purchased low inherent risk products (Srivastava et al., 2016). Thus, this study will
contribute to filling this gap since it intends to empirically investigate Cognitive and
Affective brand trust antecedents in the context of a high perceived risk product category.
The proposed model is new, allowing a new approach. The main innovativeness of the
proposed model is the empirical investigation of Consumer’s consumption of brand-
related social media content as an antecedent of Cognitive and Affective brand trust, with
the surplus of empirically examine the invariance of the proposed model between two
different groups - insignia brand and national brand, which is a relevant topic nowadays.
A quantitative research methodology using an online survey questionnaire to collect data
was conducted. In order to analyse the results and test the hypotheses, the Structural
Equation Model (SEM) was used. Baby food category (Fruit compotes) was the object of
this study, since it represents a high-risk product category where trust gains extra
importance.
This investigation concludes that Brand credibility positively and directly influences
Cognitive brand trust. However, Consumer’s consumption of brand related social media
content was not confirmed as a Cognitive brand trust antecedent. Consumer’s
consumption of brand related social media content and Cognitive brand trust positively
and directly influences Affective brand trust. For both groups – insignia and national
brand – it was assumed metric noninvariance, which has its roots on Brand credibility
and Cognitive brand trust constructs.
Key Words - Brand trust, Affective brand trust, Cognitive brand trust, insignia brand,
national brand
JEL - M31

iv
Resumo
Numa era em que as marcas assumem um papel crucial, Confiança na marca é um tópico
relevante tanto para a academia como para a gestão. O verdadeiro objetivo do marketing
é criar uma relação forte entre consumidor e a marca, sendo a Confiança o principal
elemento (Hiscock, 2001).
Pode-se no entanto concluir que estudos prévios focam-se maioritariamente em bens de
baixo risco inerente (Srivastava et al., 2016). Assim, este estudo pretende preencher este
gap, uma vez que propõe-se a investigar empiricamente os antecedentes de Confiança
cogitiva e Confiança afetiva na marca, no contexto de uma categoria com elevado risco
inerente. O modelo proposto é novo, permitindo uma nova abordagem. A inovação do
modelo encontra-se especialmente na investigação empírica de Consumo de conteúdo
relacionado com a marca nos social media como antecedente de Confiança cognitiva e
afetiva na marca. É analisada a invarância do modelo proposto para dois grupos – marca
própria e de forncedor, dada a atual relevância do tema.
Foi utlizada uma metodologia quantitiva e, para recolha de dados, foi conduzido online
um inquérito por questionário. Para análise dos resultados e teste das hipóteses, foi
utilizada a abordagem do Modelo ds Equações Estruturais. Como objeto de estudo, foi
escolhida a categoria alimentar para bebés, especificamente Compotas de fruta, pois é
uma categoria com elevado risco onde a confiança ganha uma importância adicional.
Este estudo conclui que Credibilidade da marca influencia positiva e diretamente a
Confiança cognitiva na marca. Por outro lado, não se provou uma influência direta e
positiva de Consumo de conteúdo relacionado com a marca nos social media na
Confiança cognitiva na marca. O Consumo de conteúdo relacionado com a marca nos
social media e Confiança cognitiva na marca influenciam direta e positivamente
Confiança afetiva na marca. Para ambos os grupos – marca própria e de fornecedor –
assumiu-se não invariancia métrica.
Palavras-chave – Confiança na marca, Confiança afetiva na marca, Confiança cognitive
na marca, marca própria, marca fornecedor
JEL - M31

v
Index
Biography ........................................................................................................................ i
Acknowledgements ........................................................................................................ii
Abstract ........................................................................................................................ iii
Resumo ......................................................................................................................... iv
Index ............................................................................................................................. v
Index of tables ..............................................................................................................vii
Index of figures .......................................................................................................... viii
1. Introduction .......................................................................................................... 1
1.1Research topic, relevance, motivation and aim ....................................................... 1
1.2 Methodology ........................................................................................................... 2
1.3Results ...................................................................................................................... 2
1.4 Structure .................................................................................................................. 3
I - Literature review ....................................................................................................... 4
2. Brand trust ............................................................................................................ 4
2.1Brand Trust .............................................................................................................. 4
2.1.1 Cognitive and Affective brand trust .................................................................... 11
2.1.2 Brand credibility......................................................................................................... 13
2.1.3 Brand trust consequences ........................................................................................... 14
3. Consumer’s engagement with brand-related social media content .................... 16
3.1Consumer’s consumption of brand-related social media content .......................... 18
3.2 Consumer’s contribution to brand-related social media content .......................... 18
3.3 Consumer’s creation to brand-related social media content ................................. 19
4. Insignia and national brands ............................................................................... 20
II – Empirical Study ..................................................................................................... 24
5. Methodology ...................................................................................................... 24
5.1 Research questions ................................................................................................ 24
5.2 Object of study ...................................................................................................... 25
5.3 Conceptual Model and research hypotheses ......................................................... 26
5.4 Methodology’ relevant considerations ............................................................. 28
5.4.1 Questionnaire ............................................................................................................. 28
5.4.2 Latent variables .......................................................................................................... 29
5.4.3 Measurement Scales ................................................................................................... 32

vi
5.4.4 Data collection and sample characterization .............................................................. 33
5.5 Structural Equation Modelling .............................................................................. 36
5.5.1 Factorial analysis ................................................................................................. 37
6. Results ................................................................................................................ 40
6.1 Conceptual Model ................................................................................................. 40
6.1.1 Measurement Model ................................................................................................... 40
6.1.2 Structural Model......................................................................................................... 45
6.1.3 Hypotheses Testing .................................................................................................... 47
6.1.4 Multi group analysis ................................................................................................... 48
7. Discussion .......................................................................................................... 54
Conclusion ................................................................................................................... 59
References .................................................................................................................... 62
Appendix ...................................................................................................................... 67
A – Questionnaire ....................................................................................................... 67
B – Factorial analysis .................................................................................................. 72

vii
Index of tables
Table 1 - Literature review on the attributes of brand trust........................................................... 9
Table 2 - Conceptual Model’ definitions .................................................................................... 26
Table 3 - Summary of hypotheses of investigation ..................................................................... 27
Table 4 - Latent variables ............................................................................................................ 30
Table 5 - Descriptive statistics .................................................................................................... 31
Table 6 - Cronbach Alfa .............................................................................................................. 32
Table 7 - Social demographic variables analysis ....................................................................... 35
Table 8 - KMO and Bartlett's Test .............................................................................................. 40
Table 9 - Exploratory Factorial Analysis - Principal Component Analysis ................................ 41
Table 10 - Construct Reliability (CR) and Average Variance Extracted (AVE) ........................ 42
Table 11 - Correlations matrix .................................................................................................... 42
Table 12 - Statistics and indexes of goodness of fit of the models ............................................. 45
Table 13 - Standardized Total Effects (Direct + Indirect) .......................................................... 47
Table 14 - SEM Model Estimates ............................................................................................... 47
Table 15 - Multigroup Invariance analysis ................................................................................. 48
Table 16 - Multigroup Invariance analysis (invariance of factor loadings relative to each
construct) ..................................................................................................................................... 50
Table 17 - Multigroup Invariance analysis (invariance of factor loadings relative to Brand
credibility) ................................................................................................................................... 51
Table 18 - Invariance / Noninvariance Items’ description .......................................................... 52

viii
Index of figures
Figure 1 - Srivastava et al. (2016) study’s theoretical framework ............................................... 8
Figure 2 - Continuum of three usage types – consuming, contributing and creating .................. 17
Figure 3 - Hypothesized model ................................................................................................... 26
Figure 4 - Measurement Model ................................................................................................... 44
Figure 5 - Structural model (AMOS Standardized Estimates) .................................................... 46

1
1. Introduction
1.1 Research topic, relevance, motivation and aim
The research topic chosen for this dissertation is entitled as “Cognitive and Affective
brand trust: an approach to baby care category”.
Considering we are currently living in a brand era, brand trust is a relevant topic for
companies. It is the most important attribute a brand can own, as Delgado-Ballester et al.
(2003) note. The decisive goal of marketing is to create a powerful bond between the
consumer and the brand, and the main element of this bond is trust (Hiscock, 2001).
It is essential for both management and academic purposes to understand the antecedents
of brand trust and to recognize a robust brand trust scale. Trust is an evidence of quality
in a consumer-brand relationship (Srivastava et al., 2015).
In terms of academic purposes, there are many authors and studies about the topic.
However, despite the unanimous opinion that the brand trust is important to the consumer-
brand relationship, there is no consensus about its definition and antecedents (Lassoued
and Hobbs, 2015).
The research aims to contribute to a better understanding of brand trust - Cognitive and
Affective brand trust -, specifically the state of art and respective antecedents. More into
detail, this study intends to empirically investigate Cognitive and Affective brand trust
antecedents in the context of the baby category. Furthermore, the study intends to apply
the brand trust model for an insignia and a national brand and, consequently, analyse the
invariance between the two groups.
This investigation is one between others that examines the role of brand trust antecedents
in less researched context of high-risk products, which assumes a relevant role in this
study. The pertinence of this topic is related, among others, with the discussion of the
state of the art in terms of brand trust and in terms of insignia and national brands.

2
There are no extended investigations considering the effect of brand trust in different
product categories on consumer-brand relations (Aydin et al., 2014). Specifically, in the
context of high perceived risk product category such baby food products. Previous studies
have essentially focused on commonly purchased low inherent risk products (Srivastava
et al., 2016).
Thus, this study will contribute to filling this gap with the surplus of empirically examine
the invariance of the proposed model between two different groups - insignia brand and
national brand - in the context of the baby category. This aspect is truly relevant since
insignia brands are not seen as trustworthy by the consumers (Brandão, 2014) and, as
trust can take on extra importance in the context of baby care products (Aydin et al.,
2014).
1.2 Methodology
To address the research topic, a quantitative research methodology using an online survey
questionnaire to collect data will be conducted. The target population of the survey is
Portuguese consumers who buy fruit compotes for babies (up to two years old). The
survey will be disseminated by FEP dynamic email, via Facebook messages and feed,
groups, pages, and blogs created by and for parents. In resume, convenience sample and
snowball techniques will be used. To analyse the results and test the hypotheses, a
Structural Equation Model (SEM) technique will be used. Later, invariance will be tested
within the two groups: insignia brand and national brand.
1.3 Results
This investigation result´s will evidence that Brand credibility positively and directly
influences Cognitive brand trust. However, Consumer’s consumption of brand related
social media content was not confirmed as a Cognitive brand trust antecedent.
Consumer’s consumption of brand related social media content and Cognitive brand trust
positively and directly influences Affective brand trust. For both groups – insignia and
national brand – the results will show metric noninvariance, which has its roots on Brand
credibility and Cognitive brand trust constructs.

3
1.4 Structure
This dissertation will be structured in two main parts. In the first part will be presented
the review of relevant literature around the definition and antecedents of brand trust.
Additionally, it will be presented some literature review about Consumer’s consumption
of brand-related social media content and insignia and national brands specificities.
In the second part will be presented the empirical study. Firstly, it will be presented the
research objectives and object of study. Then, it will be presented the proposed model,
measurement scales, and the research hypotheses. Methodology’ relevant considerations
about the questionnaire such as latent variables, collection and processing of empirical
data and sample characterization will then be explained in detail. Finally, the technique
used to analyse the data will be described. Subsequently, the results of the research will
be presented as well as the hypotheses analysis. Next, the results will be discussed.
Finally, the main conclusions of the dissertation will be presented, as well as its academic
and managerial contributions. Also, main limitations and suggestions for future research
will be referred.
Last sections present references and appendix.

4
I - Literature review
2. Brand trust
The following sections of this chapter present some literature review about brand trust.
Particularly, the discussion will be based, among others, on the different studies regarding
the multiple definitions of brand trust definitions and its antecedents.
2.1 Brand Trust
There is an extended literature discussion about institutional trust (Lassoued and Hobbs,
2015), mostly since Morgan and Hunt (1994) theorized about the importance of trust for
relationship marketing (Delgado-Ballester, 2004). Morgan and Hunt (1994) explain the
two elements of trust - reliability and integrity – and mention their association with
consistency, competency, honesty, fairness, responsibility, helpfulness and benevolence.
Rousseau et al. (1998) acknowledge trust as a psychological state comprising the
intention to accept vulnerability based on the positive expectations of intentions or
behaviours of another. Trust is essential to a stable, durable (Gurviez and Korchia, 2003)
and healthy (Fournier, 1998) relationship, hence different disciplines have studied the
concept of trust and have recognized it as a complex concept (Lassoued and Hobbs,
2015).
Brand trust has been deserving similar attention in the matter of consumer-brand
relationships. Among various disciplines such as psychology, sociology, economics,
marketing and management there is no consensus either on a standard definition of brand
trust, on its dimensionality, or approaches to its measurement, despite the unanimous
opinion that the brand trust is important to the consumer-brand relationship (Lassoued
and Hobbs, 2015). The interest of several disciplines about the topic has been increasing
its richness, however, it has been also increasing the difficulty of consensus. The key
issue is based on which antecedents is brand trust formed (Delgado-Ballester et al., 2005).

5
Firstly, brand trust was analysed in the marketing literature globally, without specific
dimensions. Then, due to the increasing relevance of the topic, it became mandatory to
the academy to understand the specific dimensions/antecedents of brand trust, keeping in
mind emotions and rationality. The brand trust concept has expanded over the years: it
has been considering not only product and performance expectations but also emotional
evaluations (Srivastava et al., 2016). Nowadays, recent academic studies are focused on
analysing brand trust as a macro topic and applying the brand trust concept across
industries, product categories and cultures, among others. As Bastos et al. (2015)
acknowledge, in recent years’ brand trust and the consumer-brand relations have been
empirically examined more into detail.
Delgado-Ballester (2004) theorized that applying a trust concept (an interpersonal
relationship theory) could not be well understood since the brand is an inanimate object.
Differently from a person, a brand is unable to respond to the consumer (Delgado-
Ballester et al., 2003). However, brands are no longer a product. Brands have been
assuming a partner role in the customer-brand relationship (Folse et al, 2013 cited on
Srivastava et al., 2016). In this domain, the brand is an active relational partner (Delgado-
Ballester, 2004), consumers easily attribute personalities’ qualities to them (Aaker, 1997)
and will not just perceive them (Delgado-Ballester, 2004). In Fournier’s study (1998) can
be found complete arguments that legitimize the brand as a partner.
A brand goal is to “own” the customer by building high-trust relationships. High-trust
relationships increase the array of products and services that can be sold (Johnson and
Grayson, 2005).
Brand trust is affected by consumers direct (e.g.: trial, usage) and indirect contact (e.g.:
advertising, worth of mouth) with the brand. So, it could be said that brand trust is an
experience attribute (Keller, 1993).
Lau and Lee (1999) defined brand trust as the “Willingness to reply on the brand”. Their
study proposes the following constructs as brand trust antecedents: brand predictability,
brand linking, brand competence, brand reputation and trust in the company. However,

6
Li et al. (2008) argue that the study is focused on the brand itself rather than specific
dimensions, which results in a measurement scale of a global nature.
Chaudhuri and Holbrook (2001, p.82) define brand trust - in consonance with the trust
definition provided by Morgan and Hunt (1994) - as “The willingness of the average
consumer to rely on the ability of the brand to perform its stated function” and identify
two brand trust aspects: Utilitarian value and Hedonic value. In concrete, they examine
purchase loyalty and attitudinal loyalty, as linking variables in the chain of effects from
brand trust and brand affect to brand performance - market share and relative price
(Chaudhuri and Holbrook, 2001). However, this approach centers on the performance
competence (Li et al., 2008) and omits the motivational aspects associated with brand
trust, which may limit its conceptual richness (Delgado-Ballester et al., 2003).
Gurviez and Korchia (2003) mention that from the consumer standpoint, brand trust is a
psychological variable that reflects a set of accumulated presumptions relating to
credibility, integrity, and benevolence that a consumer attributes to the brand.
Delgado-Ballester et al. (2003, p. 11) proposes the follow definition: “Feeling of security
held by the consumer in his/her interaction with the brand, that it is based on the
perceptions that the brand is reliable and responsible for the interests and welfare of the
consumer”; and Delgado-Ballester (2004, p.574): “The confident expectations of the
brand’s reliability and intentions in situations entailing risk to the consumer”. This means
these studies analyse brand trust through two antecedents – brand reliability and brand
intentions. Reliability is the perceived trustworthiness on the brand’s functional
performance (Almeida, 2013), it is the brand trust attribute that will help brands to earn
customers’ rational trust (Ong and Zien Yusoff, 2016). Brand intentions reflect an
emotional security on the part of the individuals (Delgado-Ballester, 2004) and will help
to earn the customer’s emotional trust (Ong and Zien Yusoff, 2016). Regarding this
approach, Li et al., (2008) acknowledge that by incorporating reliability and intentions
on the scale, the authors are considering additional facets and expanding the domain of
brand trust. These scales are well-known scales in the brand trust literature and have been

7
applied in more recent studies such as Ong and Zien Yusoff (2016), Gözükara et al.
(2016), Bastos et al. (2015) and Başer et al. (2015).
Johnson and Grayson’s (2005) work - about financial adviser’s services - explore
Cognitive and Affective brand trust as two dimensions of trust - based on the theoretical
precedent from the social psychology work of Lewis and Weigert (1985). Cognitive and
Affective brand trust are considered as distinct constructs once these dimensions affect
consumer-brand relationship differently with unique antecedents (Srivastava et al., 2016).
This approach is complete since it considers both technical and emotional components of
brand trust (Srivastava et al., 2016). Johnson and Grayson’s (2005) also mention a third
dimension called behavioural trust, that establishes the movement from a state of
Cognitive and affective trust.
Recently Srivastava et al. (2015) empirically tested brand predictability and brand
innovativeness as Cognitive brand trust antecedents and brand intimacy as Affective
brand trust antecedent. In an attempt to improve their model - it means, in order to better
explain brand trust in high inherent risk products - Srivastava et al. (2016) tested and
proved Brand credibility, brand innovativeness and family influence as antecedents of
Cognitive brand trust and brand intimacy and family influence as antecedents of Affective
brand trust.
These studies introduced in the brand trust literature an innovative analyse that can help
to explain how brand trust is formed: the moderating roles. Srivastava et al. (2015)
address the impact of the following moderation roles: openness to experience (for brand
innovativeness), conscientiousness (for brand predictability) and agreeableness (for
brand intimacy). Only the moderation role of openness to experience was not empirically
supported. Srivastava et al. (2016) address the impact of the following moderation roles:
education (for credibility and brand innovativeness) and working status (for family
influence and brand intimacy). The data analysis proved that the model is different
between working and non-working groups and it is similar between high and low
educated groups.

8
Figure 1 - Srivastava et al. (2016) study’s theoretical framework
Source: Srivastava et al. (2016)
9
Despite the several definitions and antecedents proposed by various authors, it is
consensual, as Delgado-Ballester et al. (2003) acknowledge, that brand trust is related to
reducing consumer uncertainty and consequently the effects of perceived risks. So
consumers believe that the brand's behaviour is motivated by favourable and positive
intentions concerning the consumer's needs and well-being. Also, they believe that the
brand will meet their interests when unexpected problems with the consumption of the
product arise (Delgado-Ballester et al., 2003). Therefore, brand trust has been used as a
risk reduction strategy (Lassoued and Hobbs, 2015). Accordingly, brand trust becomes
even more fundamental in the context of high-risk products category (Srivastava et al.,
2016) such baby food products category.
The study of brand trust has already been extended to employer branding by Rampl and
Kenning (2014).
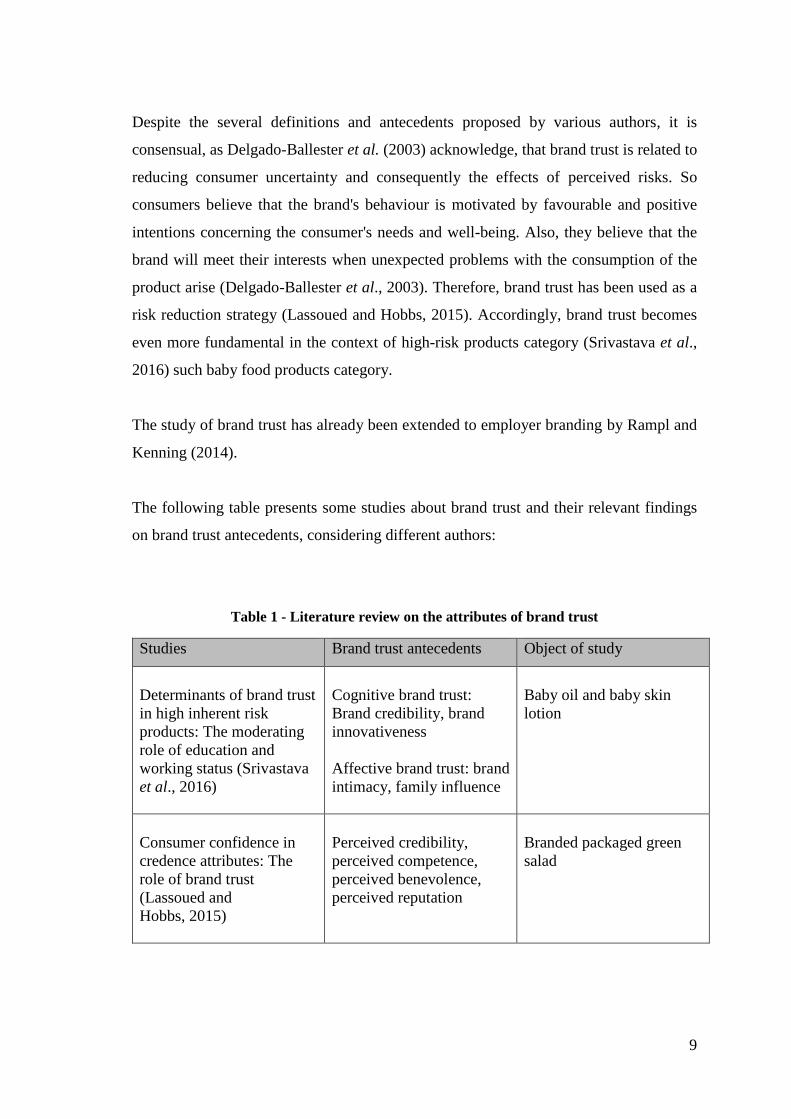
The following table presents some studies about brand trust and their relevant findings
on brand trust antecedents, considering different authors:
Table 1 - Literature review on the attributes of brand trust
Studies Brand trust antecedents Object of study
Determinants of brand trust
in high inherent risk
products: The moderating
role of education and
working status (Srivastava
et al., 2016)
Cognitive brand trust:
Brand credibility, brand
innovativeness
Affective brand trust: brand
intimacy, family influence
Baby oil and baby skin
lotion
Consumer confidence in
credence attributes: The
role of brand trust
(Lassoued and
Hobbs, 2015)
Perceived credibility,
perceived competence,
perceived benevolence,
perceived reputation
Branded packaged green
salad

10
Antecedents and
moderators of brand trust
in the context of baby care
toiletries (Srivastava et al.,
2015)
Cognitive brand trust:
brand predictability, brand
innovativeness
Affective brand trust: brand
intimacy
Baby oil and baby skin
lotion
Consumer’s Trust in the
Brand: Can it be built
through Brand Reputation,
Brand Competence and
Brand Predictability
(Hasan et al., 2009)
Brand Reputation, Brand
Competence and Brand
Predictability
Non-durable brand items
Brand trust as a second
order factor (Li et al.,
2008)
Competence, benevolence
Detergent, beer, digital
camera, laptop computer,
car and wireless phone
service
Cognitive and affective
trust in service
relationships (Johnson and
Grayson, 2005)
Cognitive brand trust:
product performance,
expertise, satisfaction with
previous interactions
Affective brand trust: firm
reputation, similarity, and
Cognitive trust
Service - financial advisers
Applicability of a brand
trust scale across product
categories: A multigroup
invariance analysis
(Delgado-Ballester, Elena,
2004)
Reliability, intentionality
Deodorant and beer
Development and
validation of a brand trust
scale (Delgado-Ballester et
al., 2003)
Reliability, intentionality
Deodorant

11
Proposal for a
multidimensional brand
trust scale (Gurviez and
Korchia, 2003)
Credibility, Integrity,
Benevolence
Cosmetics and Coca-cola
The chain of effects from
brand trust and brad affect
to brand performance: the
role of brand loyalty
(Chaudhuri and Holbrook,
2001)
Utilitarian value, Hedonic
value
50 different products
Consumers’ trust in a brand
and the link to customer
loyalty (Lau and Lee,
1999)
Brand predictability, brand
link, brand competence,
brand reputation, trust in
the company
Non-durable goods
Source: own elaboration
2.1.1 Cognitive and Affective brand trust
Cognitive and Affective brand trust are considered as distinct constructs once these
dimensions affect consumer-brand relationship differently with unique antecedents
(Srivastava et al., 2016).
Cognitive trust was introduced in the marketing literature by Johnson and Grayson (2005)
in their study about service relationship.
Cognitive brand trust emerges from an accumulated knowledge that allows customers to
make predictions, with a certain level of confidence, and also allows them to build
confidence that the brand will meet its obligations (Johnson and Grayson, 2005).
Johnson and Grayson (2005, p. 501) define Cognitive trust has a “customer’s confidence
or willingness to rely on a service provider’s competence and reliability”. At the product
brand level, Srivastava et al. (2016) define Cognitive brand trust as the knowledge driven
trust in a brand, where the customer has “good reasons” to have faith in the brand.

12
Srivastava et al. (2016) point the concept of reliableness, based on a “leap of faith”. It
refers to the confidence that a customer has for a brand competency and reliability.
Reliability is the perceived trustworthiness on the brand’s functional performance
(Almeida, 2013). In terms of consumer brand relations, there are consumer’s expectations
and needs to be accomplished and satisfied by the brand. Therefore, brand reliability
represents a set of technical or competency-based nature items. This dimension is
essential because it provides to consumers a certain confidence about future satisfaction
(Delgado-Ballester, 2004).
If there was a state of complete certainty respecting brand future actions, it wouldn’t exist
risk and trust would be redundant. However, trust is needed because the consumer lives
in a state of incomplete knowledge (Johnson and Grayson, 2005).
Affective brand trust should be developed after Cognitive brand trust since Cognitive
brand trust provides the basis for it (Lewis and Weigert, 1985). However, there are some
previous researchers that believe that the relationship between cognition and affect in
attitude formation should work both directions (Johnson and Grayson, 2005).
Affective brand trust can drive customer trust in a brand to be more than which is justified
by available knowledge (Srivastava et al., 2016).
This dimension is the emotional dimension of trust, it “is reliance on a partner based on
emotions” (Johnson and Grayson, 2005, p.501). Customers may build positive
perceptions about the brand based on affective signals (Srivastava et al., 2016).
Affective brand trust reflects the consumer perceived strength of the consumer-brand
relationship (Johnson and Grayson, 2005). It designates confidence based on the level of
care and concern exhibited by the brand (Srivastava et al., 2016).
This dimension is essential for consumers to evaluate high-risk product categories, such
as baby categories (Srivastava et al., 2016). However, it could make the consumer-brand
relationship less transparent concerning objective risk (Johnson and Grayson, 2005).

13
Srivastava et al. (2016) prove that in the context of baby care category, Cognitive brand
trust is an antecedent of Affective brand trust.
(H4: Cognitive brand trust positively influences Affective brand trust)1
2.1.2 Brand credibility
Literature has examined Brand credibility and its relationship with brand trust (Lau and
Lee, 1999; Gurviez and Korchia, 2003; Johnson and Grayson, 2005; Lassoued and
Hobbs, 2015; Srivastava et al., 2016).
Brand credibility has been predominantly conceptualized as a signal of product quality
(Keller and Aaker, 1992; Srivastava et al., 2016) and as a signal that the brand must have
some competence in the area (Keller and Aaker, 1992), lowering perceived risk and
information costs (Lassoued and Hobbs, 2015). Brand credibility is defined by Erdem et
al. (2006, p.191) as the “believability of the product information contained in the brand,
which requires that consumers perceive that the brand has the ability and willingness to
continuously deliver what is promised”.
Since the consumer lives in a state of incomplete and asymmetric knowledge, credibility
is expected to be a key element of customer trust in a brand (Lassoued and Hobbs, 2015).
Srivastava et al. (2016) prove that Brand credibility is an antecedent of Cognitive brand
trust.
(H1: Brand credibility positively influences Cognitive brand trust.)
1 The numeration of the research hypotheses follows the proposed model sequence, which will be
present in chapter 5. The Literature review chapter is not organized accordingly to the research
hypotheses sequential numeration.

14
2.1.3 Brand trust consequences
Trust has been treated as a critical predictor of favourable marketing outcomes. Trust
increases competitiveness, reduces searching and transaction costs, and mitigates
opportunism under uncertain contexts (Doney and Cannon, 1997). Scholars are
increasingly becoming interested not only in how brand trust is formed but also on its
favourable consequences. It is unanimous that brand trust creates a positive impact across
several essential marketing constructs.
Chaudhuri and Holbrook (2001) mention that brand trust has implications to other
relevant areas such as brand loyalty and brand equity.
Most of the existing marketing and business literature focuses on the direct relationship
between brand trust and brand loyalty (Lassoued and Hobbs, 2015).
Fournier study (1998) provides a clear explanation for the difference between brand
loyalty and brand trust: brand loyalty is demarcated as consumer commitment to
repurchase a chosen brand consistently in the future. While trust is more about
perceptions, loyalty is theorized as the behaviour engaged in over successive transactions.
Lau and Lee (1999) results’ show that there is a positive relationship between trust in a
brand and brand loyalty. The study also mentions that trust in a brand is a crucial element
in brand loyalty development. Chaudhuri and Holbrook (2001) also prove the positive
influence of brand trust on the two brand loyalty dimensions - attitudinal and behavioural.
Loyalty is a result of the ongoing process of maintaining a relationship that has been
created by the trust (Chaudhuri and Holbrook, 2001). According to several authors, such
as Lau and Lee (1999), Chaudhuri and Holbrook (2001), Delgado-Ballester et al. (2003)
and Delgado-Ballester et al. (2005) brand trust leads to brand loyalty because it creates
exchange relationships that are highly valued. So, in conclusion, the literature shows
concordance about brand trust being an antecedent of brand loyalty.
Brand trust has also been treated as a crucial component of brand equity and its essential
in brand buying behaviours (Luk and Yip, 2008, cited on Srivastava et al., 2016). Brand

15
trust contributes to a better explanation of brand equity through brand loyalty (Delgado-
Ballester et al., 2005).
In their study, Morgan and Hunt (1994) prove the favourable impact of brand trust on
brand commitment. Brand trust drives to more commitment and motivates higher market
share and premium prices (Chaudhuri and Holbrook, 2001).

16
3. Consumer’s engagement with brand-related social media content
The following sections of this chapter present some literature review about Consumer’s
engagement with brand-related social media content. Particularly, the discussion will be
based, among others, on the different levels of this concept and its importance for brand
management nowadays, which provides support for the importance of crossing these
concepts with brand trust topic.
Facebook, YouTube, Twitter, among others, have become more and more significant in
consumers' lives and impacted their communication behaviours: in the 1990’s consumers
started using bulletin boards on sites such as Yahoo to share information about products;
nowadays, consumers relationship with social media is reshaping consumers engagement
with brands and consequently marketing, due to social media interactive nature
(Schivinski et al, 2016).
Schivinski et al. (2016), in their study “Measuring Consumers’ Engagement with Brand-
Related Social-Media Content - Development and Validation of a Scale That Identifies
Levels of Social-Media Engagement with Brands” cover a massive range of brand related
social media activities and identify different levels (dimensions) of engagement:
consumption, contribution and creation of brand related social media content. These three
dimensions are based on previous literature about the topic, namely on the study
“Consumer’s Online Brand-Related Activities” (Muntinga et al, 2011). The proposed
framework is defined as a set of brand-related online consumer´s activities that diverge
in the degree to which the they interact with social media and consequently engage in the
consumption, contribution, and creation of media content (Schivinski et al, 2016).
Muntinga et al. (2011) demonstrate that brand-related activity on social media is
principally motivated by information and entertainment.
As well, in their study “Consumer engagement in a virtual brand community: An
exploratory analysis”, Brodie et al. (2013) acknowledge that consumer engagement is a
multidimensional and dynamic concept covering Cognitive, emotional, and/or
behavioural dimensions, playing a vital role in the process of relational exchange and
which may arise at different levels of intensity over time, accordingly reflecting distinct

17
engagement states. These authors also identify that consumer engagement consequences
include consumer loyalty and satisfaction, consumer empowerment, connection and
emotional bonding, trust and commitment.
It is mostly recognized the importance of understanding the levels of consumer
engagement. But it is essential to note that a consumer, depending on the context, can be
a consumer, contributor and/or creator of brand-related content for the same brand
concurrently or successively. Also, the same consumer can contribute to one brand but
only consume content for another brand (Schivinski et al, 2016).
In the context of the present dissertation, it will be presented in detail the three levels of
consumer engagement, considering the Schivinski et al. (2016) scale. Examples of the
three levels can be seen in the following figure. Nonetheless, firstly it is important to
clarify that brand related social media means both firm-created and user-generated media
(Schivinski et al., 2016).
Figure 2 - Continuum of three usage types – consuming, contributing and creating
Source: Muntinga et al. (2011, p.16)

18
3.1 Consumer’s consumption of brand-related social media content
Consumer’s consumption of brand related social media content represents the most
frequent kind of online consumers brand related activity and it means the consumers'
participation in networks and online brand communities (Schivinski et al., 2016). A
virtual brand community is an online community which is a specialized and non-
geographically bound, based on social communications and relationships between a
brand's consumers (Brodie et al., 2013).
Consumer’s consumption of brand related social media content involves a minimum level
of engagement of the consumers who passively consume brand-related media without
actively contributing (Muntinga et al., 2011; Schivinski et al., 2016).
Examples of this first level of brand related social: consulting product reviews, reading
brand-related discussions on forums, and viewing brand-related videos (e.g. Bickart and
Schindler, 2001; Hennig Thurau and Walsh, 2003, cited on Muntinga et al., 2011).
3.2 Consumer’s contribution to brand-related social media content
Subsequently, there is the middle level of brand-related activeness on social media. The
middle level - Consumer’s contribution to brand-related content – represents more
engagement than consumption of brand-related content, it represents consumer-to-
content and consumer-to-consumer interactions about brands (Muntinga et al., 2011).
This level does not include the creation of social media content but reflects consumers'
contribution by participating in media previously created by a company or another
consumer (Schivinski et al., 2016).
Examples of this dimension of brand related social: conversations on social networking
sites and comments on brand-related weblogs (Muntinga et al., 2011).

19
3.3 Consumer’s creation to brand-related social media content
The highest level - Consumer’s creation of brand-related content – represents consumers
who are actively producing and online publishing brand-related content, frequently with
the contribution of other consumers (Muntinga et al., 2011).
This dimension is the strongest level of online brand-related engagement (Schivinski et
al., 2016).
Examples of this dimension of brand related social: writing brand-related articles and
posting product reviews (Muntinga et al., 2011).
(H2: Consumer’s consumption of brand related social media content positively influences
Cognitive brand trust)
(H3: Consumer’s consumption of brand related social media content positively influences
Affective brand trust)

20
4. Insignia and national brands
The present section presents some literature review about insignia and national brands’
specificities. Particularly, the discussion will be based, among others, on the differences
between the two categories of brands and its evolution during the last decades.
Insignia brands have known in recent years an extraordinary development combined with
an increasing market share, as a result of both economic crisis and a new consumer
dynamic. Thus, competition between national and insignia brands become a hot topic for
manufacturers and retailers (Brandão, 2014).
Insignia brand concept – also known as store brands, private brands, retailer brands,
wholesale brands, and distributor’s brands (Calvo-Porral et al., 2016) – refers to products
that are developed, managed and sold exclusively by retailers (Da Silva Borges et al.,
2016; Calvo-Porral et al., 2016). Because of this unique specificity of insignia brands
when compared to national brands, since national brands are available across different
distribution formats, the choice of point of sale determines the brand’s object of the
purchase decision process and, consequently, the purchase made (Brandão, 2014).
Retailers can present insignia brand in various formats:
(1) Umbrella brand: the studies agree that using an umbrella brand in the context
of insignia brands has favourable impact for the retailer (Rubio et al, 2017);
(2) Umbrella label brand;
(3) Brand not connected to the store name.
There have been a few trends such as higher store concentration, retailing
internationalization, global recession, and changing consumer habits, which had triggered
many retailing companies to have as a top priority the construction of strong insignia
brands (Ailawadi and Keller, 2004). Calvo-Porral et al. (2016) resume some favourable
consequences of retailers focus on creating and managing insignia brands: increasing
customer loyalty, retailer performance, profit margins, and a high-value offering in the
marketplace. Rubio et al. (2017) mention another benefit: the positive impact on retailers
negotiating power.

21
Price is an essential element of the insignia brands value propositions. Customers
perceive insignia brands as a convenient price, that offers a competitive price as an
alternative to national brands (Calvo-Porral et al., 2016). As Brandão (2014)
acknowledge, some consumers still have a stigma related to insignia brands value, mostly
because there is an association of low-cost products with lower quality to them.
Consumers perceive national brands as safest and with less quality variation than insignia
brands (Rubio et al. 2014). The perceived risk is lower when the price is higher since
consumers assume a linear relationship between price and quality. This triggers
uncertainty about satisfaction levels and increases risk associated with the purchase of
insignia brand products (Da Silva Borges et al., 2016). Da Silva Borges (2016) provides
evidence that supports the relationship between perceived risk and purchase intention in
the matter of insignia brands. This study summarizes six different types of perceived risk
described in the literature:
(1) Financial risk: monetary loss trigged by the bad choice;
(2) Social risk: customers believes that society could not accept their brand
choice;
(3) Physical risk: fear of health and physical damages;
(4) Psychological risk: anticipation of a possible disappointment with the product
bad quality;
(5) Time risk: time lost related with the time speeded buying a bad quality
product;
(6) Performance risk: customer fear about the product performance being worse
than what was promised by the brand.
It should be noted that previous literature identifies that insignia brands’ competitiveness
comes mainly from lower prices and less promotional expenses (Calvo-Porral et al.,
2016) and not from low-cost products with lower quality. Typically, insignia brand
products are 10% to 30% less expensive (Cardoso and Neves, 2008).
Cardoso and Neves (2008) explain how retailers achieve lower prices:

22
(1) Retailers pay lower prices to manufacturers, once manufacturers use company
inactive capacity to produce retailer’s products. This way, there are no
additional production costs for the manufacturers;
(2) Retailers purchase to manufacturers in a wide scale, so they can negotiate
better prices;
(3) Insignia brand products are cheaper and easier to promote than national brand
products, since retailers use strategically the available space in store;
(4) Retailers do not have huge R&D costs as national brands do.
Consumer perceptions of insignia have been changing during the last few years (Rossi et
al., 2015). Recent literature notices that insignia brand products offer similar quality as
national brand products (Rossi et al., 2015; Calvo-Porral et al., 2016). Insignia brands
usually offer a better price-quality relationship since they tend to attract a specific
customer segment with an appropriate offer, price and packaging (Ailawadi and Keller,
2004). However, consumer acceptance of insignia brands products is rising across
sociodemographic segments (Da Silva Borges et al., 2016). Nowadays, insignia brand
market has become more complex and has been not only growing in quality but also
adopting different positions to serve different market segments (Rossi et al., 2015).
Retailers have already an array of insignia brand product, based on different market
segmentation - e.g.: premium, first prices (Lucas, 2013). Rossi et al. (2015) cite previous
literature that mentions that there are some premium insignia brand products with better
quality than national brands.
Furthermore, market share of the insignia brand products is increasing and still has a great
growing potential (Brandão, 2014) around the world, with significant market positions
specifically in Europe and North America (Kumar and Steenkamp, 2007; Manzur,
Olavarrieta, Hidalgo, Farías, and Uribe, 2011, cited on Calvo-Porral et al., 2016). The
use of store brands in Europe was promoted by the economic recession (Rubio et al.,
2017).
Insignia brands are now consolidating their positions in the food sector, once they have
been offering similar quality at lower prices comparing to national brands (Rubio et al.,

23
2014). However, Brandão (2014) acknowledge that insignia brands are not seen as
trustworthy by the consumers. Thus, this dissertation addresses the question if, in the
matter of brand trust in the baby food category, the proposed model shows or not
invariance for two different groups surveys: insignia brand (Continente) and national
brand (Nestlé).

24
II – Empirical Study
5. Methodology
Following the previous chapter with literature review, that provides to this study some
theoretical knowledge, will be now presented the empirical study.
Firstly, it will be presented the research objectives and object of study. Then, it will be
presented the proposed model, measurement scales, and the research hypotheses.
Methodology’ relevant considerations about the questionnaire such as latent variables,
collection and processing of empirical data and sample characterization will then be
explained more in detail. Finally, the technique used to analyse the data will be described.
Two software were used in this study: SPSS 24 and AMOS2 24.
5.1 Research questions
Recalling what has been previously said, this research aims to contribute to a better
understanding of brand trust - Cognitive and Affective brand trust -, specifically the state
of art and respective antecedents. More into detail, this study intends to empirically
investigate Cognitive and Affective brand trust antecedents in the context of the baby
category. Furthermore, the study intends to apply the brand trust model for an insignia
and a national brand and, consequently, analyse the invariance between the two groups.
Thus, this investigation questions are:
(I) How is Affective brand trust formed in the context of baby
category?
(II) Are there relevant differences between the model in the case of an
insignia or a national brand?
The following sub-sections will provide important findings to the research objectives.
2 Analysis of Moment Structure

25
5.2 Object of study
The choice of baby products category (babies up to two years) to develop this dissertation
is mostly related to the specificities and particularities of it:
(1) Trust in this category must be analysed keeping in mind non-consumers - i.e.
customers who do not use the product category at all. Purchase decision is totally
in the hands of adults - e.g.: parents - and the baby has no influence on it
(Srivastava et al., 2016),
(2) A high inherent risk is attached to this category product (Srivastava et al., 2016);
(3) It is difficult for consumers - e.g.: parents - to judge the competency of this
product category, because they do not use the product. The products are used by
babies who are incapable to express their opinions about it (Srivastava et al.,
2016). A baby doesn’t speak, so he/her can’t express if a product is or is not
appropriate for him/her.
(4) The category is preferred by consumers during a specific period of time, so the
customers intend to have only a short-term relationship (Aydin et al., 2014).
The product chosen for this investigation is Fruit compotes. The product selected was
based on two main informations:
(1) Srivastava et al. (2015) brand trust study suggests that studies could be conducted
for other high perceived risk products or to other baby care products, such as food;
(2) In the actual context, the convenience formats are crucial and consequently, Fruit
compotes are recording significant dynamism and growth in the Portuguese
market – 11% in value and 9% in volume (2016), as mention by Maria Ana Góis,
Client Service Executive at Nielsen (in Grande Consumo, accessed in 1/04/2017).
The relevance of this study is highlighted because trust can take on extra importance in
the context of baby care products (Aydin et al., 2014). Brand trust construct has a central
role in terms of the baby products (Brandão, 2014), once trust is related to reducing
consumer uncertainty and consequently the effects of perceived risks (Delgado-Ballester

26
et al., 2003). To consumers is essential to feel secure about the product in the matter of
baby care products.
5.3 Conceptual Model and research hypotheses
According to the study aim, it is proposed a model to explain the consumer behaviour.
Figure 3 illustrates the proposed model and its research hypotheses. The proposed model
is new, allowing a new approach.
Figure 3 - Hypothesized model
Source: own elaboration
To a better interpretation of the proposed model, Table 2 presents same central
definitions, based in the previous Literature review Chapter.
Table 2 - Conceptual Model’ definitions
Model / Variable Definition
Proposed model The proposed model intends to measure Affective brand trust through
Cognitive brand trust which is the moderate variable in this model, and
Brand credibility and Consumer’s consumption of brand-related social
media content, which are the starting point of the proposed model. The
proposed model is new, allowing a new approach.

27
Affective brand trust Affective brand trust reflects the consumer perceived strength of the
consumer-brand relationship (Johnson and Grayson, 2005). It
designates confidence based on the level of care and concern exhibited
by the brand (Srivastava et al., 2016).
Cognitive brand trust Cognitive brand trust emerges from an accumulated knowledge that
allows customers to make predictions, with a certain level of
confidence, and also allows them to build confidence that the brand
will meet its obligations (Johnson and Grayson, 2005).
Brand credibility Brand credibility is defined by Erdem et al. (2006, p.191) as the
“believability of the product information contained in the brand,
which requires that consumers perceive that the brand has the ability
and willingness to continuously deliver what is promised”
Consumer’s
consumption of
brand-related social
media content
Consumer’s consumption of brand related social media content
represents the most frequent kind of online consumers brand related
activity. Involves a minimum level of engagement of the consumers
who passively consume brand-related media without actively
contributing (Schivinski et al., 2016)
Source: own elaboration
In Table 3, the hypotheses of investigation will be summarized. They are theoretically
explained in detail in the Literature review chapter.
Table 3 - Summary of hypotheses of investigation
H1: Brand credibility positively influences Cognitive brand trust.
H2: Consumer’s consumption of brand related social media content positively
influences Cognitive brand trust.
H3: Consumer’s consumption of brand related social media content positively
influences Affective brand trust.
H4: Cognitive brand trust positively influences Affective brand trust.
Source: adapted from Srivastava et al. (2016) and Schivinski et al. (2016)

28
5.4 Methodology’ relevant considerations
5.4.1 Questionnaire
To validate the hypotheses of investigation, it was conducted an online questionnaire,
which will be explained detailly through this section.
This study intends to apply a quantitative methodology to address the research question.
The primary data was obtained using online questionnaires, which are available for
consultation in Annex A. The data collection tool was built using a personal installation
of the LimeSurvey software platform. The study population was Portuguese consumers
who purchase fruit compotes for babies up to two years (Madeira and Açores were not
included). Online surveys were published directly to consumers, through FEP dynamic
email, Facebook Social Network, and a blog during the period between 10 of June of
2017 and 4 of July of 2017.
There are two different surveys, applied to two different brands:
(a) Insignia brand: Fruit compotes Continente
(b) National brand: NATURNES Fruit compotes Nestlé
The disseminated link redirect for each brand´s survey on an alternative basis. However,
each respondent was asked to respond for the same questions (the only difference was the
precisely brand).
The questionnaire has been prefaced by an explanation and the goal of the study was
revealed in the title. All the survey questions were closed and mandatory questions.
Regarding the measurement of constructs, this study opted for the use of previously
developed and tested scales and the last page of the survey was built to understand the
respondent profile through some sociodemographic variables: gender, age, education
level, household’s net monthly income and Portuguese district of residence. The
questionnaire was conducted in Portuguese, so the scales were previously translated in
the best way possible to retain their original context and meaning.

29
Before being launched directly to the consumer, the survey was submitted to a pre-test
with 15 respondents who purchase fruit compotes for babies. The pre-test had the main
goal to analyse if the questions were clear and identify possible mistakes. Consequently,
some structural improvements were made.
This quantitative (extensive) research intends to produce statistical data regarding the
hypotheses designed having as starting point the theory. This research methodology is a
more objectivist approach to Social Science (Bahari, 2010).
The survey tool is one of the most popular techniques for data gathering in the context of a
quantitative (extensive) research. Spread surveys online present a set of benefits: access
to a large population of individuals despite their geographic location; savings in both time
and money; present survey information in formats that were previously difficult to
achieve (Schmidt, 1997). With the exponential impact of social networks nowadays, it is
also easier to share the surveys.
5.4.2 Latent variables
For the present study are being considered the following latent variables: Cognitive brand
trust, Affective brand trust, Brand credibility, and Consumer’s Consumption of brand-
related social media content.
Latent variables, also known as constructs, are concepts that are not directly observable.
Latent variables can be explained using observable variables (Marôco, 2010). Other latent
variables examples: intelligence and social capital.
The latent variables presented correspond to the items described in the following table.

30
Table 4 - Latent variables
Construct
Items Author(s)
Cognitive brand
trust
CBT_1: I can confidently depend on this
brand since it does not adversely affect my
baby by functioning carelessly
CBT_2: Given by this brand’s past record, I
see no reason to doubt its competence
CBT_3: Given by this brand’s past record, I
have strong reason to doubt its
effectiveness*
Srivastava et al.
(2016)
Affective brand
trust
ABT_1: This brand is only interested in
selling products*
ABT_2: Brand displays a warm and caring
attitude towards baby
ABT_3: I would feel a sense of personal
loss, if I could no longer use this brand
ABT_4: I feel brand would respond
caringly, if I face problem with the product
Srivastava et al.
(2016)
Brand credibility
BC_1: This brand reminds me of someone
who is competent and knows what he /she is
doing
BC_2: This brand has the ability to deliver
what it promises
BC_3: This brand’s product claims are
believable
BC_4: This brand has a name you can trust
BC_5: This brand does not pretend to be
something it is not
Srivastava et al.
(2016)

31
Consumer’s
consumption of
brand-related
social media
content
CONS_1: I read posts related to brand [X]
on social media
CONS_2: I read fan page (s) related to
brand [X] on social network sites
CONS_3: I watch pictures/graphics related
to brand [X]
CONS_4: I follow blogs related to brand
[X]
CONS_5: I follow brand [X] on social
network sites
Schivinski et al.
(2016)
Source: own elaboration
Notes:
[X] is a brand name.
*The Likert scale was inverted for this item.
Table 5 - Descriptive statistics
Mean Median Mode Std. Deviation
Total CNT N Total CNT N Total CNT N Total CNT N
Cognitive brand trust
CBT_1 5,50 5,40 5,60 6 6 6 7 7 7 1,64 1,66 1,62
CBT_2 5,53 5,36 5,72 6 6 6 6 6 6 1,41 1,47 1,33
CBT_3 5,62 5,51 5,75 6 6 6 7 7 7 1,70 1,77 1,60
Affective brand trust
ABT_1 4,28 4,53 4,00 4 5 4 5 5 3a 1,87 1,78 1,94
ABT_2 5,38 5,21 5,56 5 5 6 5 5 6 1,30 1,37 1,20
ABT_3 3,52 3,15 3,94 3 3 4 1 1 4 1,99 2,01 1,90
ABT_4 5,21 5,03 5,41 5 5 6 5a 5 7 1,51 1,57 1,41
Brand credibility
BC_1 5,49 5,34 5,65 6 6 6 6 6 6 1,31 1,34 1,25
BC_2 5,38 5,22 5,57 6 5 6 6 6 6 1,27 1,36 1,14
BC_3 5,33 5,21 5,47 5 5 6 6 5 6 1,29 1,30 1,28
BC_4 5,51 5,30 5,74 6 5 6 7 4 7 1,33 1,34 1,29
BC_5 5,24 5,10 5,40 5 5 5 5 4 5 1,44 1,52 1,34

32
Consumer’s consumption of brand-related social media content
CONS_1 4,19 4,39 3,96 4 5 4 4a 6 4 1,95 1,93 1,95
CONS_2 3,19 3,31 3,05 3 3 3 1 1 1 1,94 1,93 1,96
CONS_3 3,81 3,92 3,68 4 4 4 1a 5 1 1,96 1,93 2,00
CONS_4 2,91 2,97 2,84 2 3 2 1 1 1 1,97 1,85 2,12
CONS_5 3,09 3,22 2,95 2 3 2 1 1 1 2,04 1,95 2,12
Source: own elaboration on SPSS
Legend: CNT – Continente; N – Nestlé.
In all the items (questions) the answers options are between 1 and 7. Regarding Cognitive
brand trust and Brand credibility, most of the answers are superior to 4. Regarding
Affective brand trust, there is only one question with mean inferior to 4: ABT_3:
However, the mean is 3,52, which is approximately 4. Regarding Consumption of brand-
related social media content, only one question out of 5 has a mean superior to 4.
5.4.3 Measurement Scales
As described in a previous section, regarding the measurement of constructs, this study
opted for the use of previously developed and tested scales. These scales were
theoretically supported and previously tested in other scientific studies.
A 7-points Likert scale was applied to all the constructs analysed to ensure uniformity of
scales. The respondents could select from (1) “Strongly disagree” to (7) “Strongly agree”
and “I don’t know / not applicable”. This scale is the most usual in marketing studies
since it presents a set of benefits: it is easy to build and to manage and allows to
respondents an easy comprehension and simple answer (Matell and Jacoby, 1971). A 7-
points Likert scale provides more information given its degree of approval/disapproval.
Table 6 - Cronbach Alfa
Latent variables # Items α Cronbach
Cognitive brand trust 3 0,780
Affective brand trust 4 0,728
Brand credibility 5 0,931

33
Consumer’s consumption of
brand-related social media
content
5 0,929
Source: own elaboration on SPSS
To properly analyse the scales of measure - explained in detail in the previous section,
Table 4 - it is necessary to validate their internal reliability/consistency. Therefore, it was
made the Cronbach’s alpha test. Internal consistency designates the extent to which all
the items in a test measure the same construct. Cronbach’s alpha reliability coefficient
normally ranges between 0 and 1: if all the scale items are entirely independent of one
another (i.e., are not correlated or share no covariance), then α = 0; and, if all the items
have high covariances, then α will approach 1. There are different reports about the
acceptable values of alpha (α), but it is commonly accepted that the minimum value for
α should be 0.7. However, sometimes in the context of the social sciences, it is acceptable
a α=0.6. It should be interpreted with caution. Internal consistency also estimates the
reliability of an instrument (Marôco and Garcia-Maques, 2006).
As it could be analysed from the Table 6, all the constructs are above the recommendable
minimum value.
5.4.4 Data collection and sample characterization
Once the objectives of the study are settled, and the latent variables and scales are
presented, it is essential to define the sample of the study.
Regarding to data collection, the survey was disseminated online in order to reach as
many fruit compotes for babies’ buyers as possible and, consequently, as many
respondents as possible in Portugal Continental. To improve the effectiveness of the data
collection, Facebook groups of parents were contacted to disseminate the survey. The
groups that disseminated the surveys were: “Mães de 2017 e 2018 Portugal”; “Pais e
Mães de 2017 Portugal”; “Bazar de vendas das mamãs e dos papás”; “Dúvidas Mães e
Bebés”; “Desabafos mamãs e papás de portugal”; “Mães Julho e Agosto - 2017 Portugal”;
“Mães e Mulheres”. Additionally, it was disseminated at the Facebook page “Mães com

34
Pinta” and at the blog “De Mãe para Mãe”. Also, Nestlé was contacted via messages in
Facebook, however, because of their internal policies and the number of similar requests,
the answers were negative.
Hence, a nonprobability approach was adopted to reach “hidden populations”
(Heckathorn, 2010):
(1) Convenience sample – firstly, the respondents were chosen based on the following
logic: friends, friends of friends, etc;
(2) Snowball – secondly, in addition, the respondents of the convenience samples were
asked to spread the survey to other people. The idea is those people continuously
spread the survey to fruit compote for babies’ buyers, consequently creating a
snowball effect.
Additionally, the survey was sent via University of Oporto dynamic email, posted on
Facebook’ profile by friends and posted on a Facebook event created for this propose.
As mention before, the disseminated link redirect for each group of surveys (insignia
brand and national brand) on an alternative basis. Thus, the sample of this study contains
274 complete responses, after eliminating respondents with less than 18 years and
respondents who choose “I don’t know / not applicable”. It was considered the right
action, in order to ensure the quality of the data. Thus, the sample has 145 (52,9%)
responses regarding the insignia brand Continente, and 129 (41,1%) responses regarding
the national brand Nestlé. Some studies propose minimum sample sizes. “Researcher
generally would not factor analyse sample of fewer than 50 observations, and preferably
the sample size should be 100 or larger. As a general rule, the minimum is to have at least
five times as many observations the number of variables (Hair Jr. et al., 2010).
Accordingly, the sample size is totally adequate for the present empirical study.

35
Table 7 - Social demographic variables analysis
Number
%
Gender
Female 189 69
Male 85 31
Age
<18 0 0
18 to 25 68 24,8
26 to 35 95 34,7
36 to 45 44 16,1
46 to 55 40 14,6
56 to 65 25 9,1
> 65 2 0,7
Household's net monthly income
≤1000€ 66 24,1
1001 to 2000€ 114 41,6
2001 to 3000€ 67 24,5
>3000€ 27 9,9
Educational level
Primary and secondary
school
9 3,3
High school 69 25,2
Bachelor degree 132 48,2
Master 63 23
PhD 1 0,4
District
Aveiro 26 9,5
Braga 48 17,5
Coimbra 18 6,6
Faro 1 0,4
Guarda 12 4,4
Leiria 4 1,5
Lisboa 22 8,0
Porto 72 26,3
Santarém 7 2,6
Setúbal 2 0,7
Vila Real 1 0,4
Viseu 61 22,3
Source: own elaboration on SPSS
Most of the respondents are female (69%) and this number is probably related to the fact
that, in Portugal, are frequently mothers who take care of family feed, and also because

36
most of the Facebook groups, the Facebook page and the blog that disseminated the
questionnaire have as a target the mothers. 34,7% of the respondents are between 26 and
35 years old, followed by 24,8% of the respondents between 18 and 25 years old. This
range of ages makes sense in the context of the present study. Regarding Household's net
income, 41,6% of the respondents have 1001 a 2000€ for a month, 24,5% have 2001 to
3000€ month and 24,1% less than 1000€. 48,2% of the respondents have a Bachelor
degree, 25,2% high school education and 23% have a master degree. Relating to
demographic location, most of the respondents are from Porto (26,3%), Viseu (22,3%)
and Braga (17,5%).
5.5 Structural Equation Modelling
Structural Equation Modelling (SEM) is a general modeling framework used to test the
validity of theorist models – which define relationships between variables - and test
consequently their hypotheses using data gathered (Marôco, 2010).
SEM permits separate relationship for each of a set of dependent variables. It provides
the appropriate and most efficient estimation technique for a series of separate multi
regression equations estimated at the same time (Hair Jr. et al., 2010). Hair Jr. et al. (2010,
p.634)) also mention that SEM is “a family of statistical models that seek to explain the
relationships among multiple variables”.
Constructs, also known as latent variables, are variables that cannot be explained by
themselves. They are unobserved variables, so they only can be explained by observable
variables. Although, observable variables are directly measured (items of a scale). Hence,
latent variables are measured by observable variables that can be collected by surveys,
tests, among others (Hair Jr. et al., 2010; Marôco, 2010).
Thus, the use of SEM is commonly justified in the social sciences because of its ability
to impute relationships between unobserved constructs from observable variables – this
means, it analysis the impact between variables.

37
5.5.1 Factorial analysis
Factor analysis is a statistical technique used to explain the interrelationships between a
large number of variables. This technique aims to reduce a large number of observed
variables to a few factors, with minimal loss of information (Hair Jr. et al., 2010).
There are two main types of Factorial Analysis: Exploratory Factor Analysis (EFA) and
Confirmatory Factor Analysis (CFA).
Exploratory factor analysis
Hair Jr. et al. (2010, p.693) provide the following definition of EFA: “EFA explores the
data and provides the researcher with information about how many factors are needed to
best represent the data”.
In the context of the present study, to proceed with EFA, an extraction method was used:
Principal Component Analysis - after grouping similar items of a common variable, or
which of the observed variables are influenced by specific latent variables, this method
finds structural patterns (Marôco, 2010). However, before conducting the process of
factorial analysis, it is necessary to understand if the data is suitable for the analysis. It
can be made using Bartlett's Test of Sphericity and Kaiser-Meyer-Olkin (KMO) and
Bartlett's Test of Sphericity. KMO indicates which components to use, that is, the
appropriateness of factor analysis (Marôco, 2010). KMO returns values between 0 and 1.
The sample is suitable if the number is between 0.5 and 1 (Silva, 2006). Bartlett's Test of
Sphericity statistically tests the presence of correlations among variables (Hair Jr. et al.,
2010).
After all, the principal components should be analysed taking into consideration factors
loading higher than 0.5 (each item). Factor loading is the correlation between the original
variables and the factors, and it is crucial to understand the nature of a particular factor
(Hair Jr. et al., 2010).

38
Confirmatory factor analysis
Afterwards running the Exploratory Factor Analysis, it is necessary to confirm the
obtained results through the Confirmatory Factor Analysis.
Marôco (2010, p. 172) provides the following explanation: “CFA is used to evaluate the
quality of fit of a theoretical measurement model to the correlational structure observed
between the manifest variables (items)”. This is, a confirmatory structural model specifies
the causal relations of the constructs to one another, as suggested by theory. In CFA, it
can be assessed the contribution of each scale item and how well the scale measures the
concept (Hair Jr. et al., 2010).
This is made by evaluating the reliability and validity of the scale. Validity is related with
how well the concept is defined by the measure(s), while reliability relays to the
consistency of measure(s) (Hair Jr. et al., 2010).
Regarding reliability, it is explained by the Construct Reliability (CR) that represents “the
measure of reliability and internal consistency of the measured variables representing a
latent construct” (Hair Jr. et al., 2010, p.689). The value should be superior to 0.7
(Marôco, 2010). Concerning validity, there are several types of validity, but this study
focusses on convergent validity and discriminant validity.
Convergent validity is the degree to which the scale indeed measures what it is made-up
to measure (Marôco, 2010). Convergent validity is recognized when there are positive
and high correlations between the items of a given construct. This measure of consistency
is composed by Construct Reliability (CR) and Average Variance Extracted (AVE)
(Marôco, 2010). CR must be higher than AVE and AVE must be superior to 0,5 (Hair Jr.
et al., 2010).
Discriminant validity is the degree to which two conceptually similar concepts are distinct
(Hair Jr. et al., 2010). This means, discriminant validity demonstrates how much a
construct is different from the other constructs, that it is not correlated with them,
measuring different factors of them. If the root square of AVE is higher than the

39
correlations of the given construct, we are in presence of discriminant validity (Marôco,
2010).

40
6. Results
Subsequently, the results of this research will be presented as well as the hypotheses
analysis.
6.1 Conceptual Model
As mentioned in the previous chapter, the conceptual model is based on the following
constructs: Cognitive brand trust, Affective brand trust, Brand credibility, and
Consumer’s Consumption of brand-related social media content.
6.1.1 Measurement Model
In the aftermath of knowing the sample and the questions in the study, it is necessary to
develop its factorial analysis. Nonetheless, before conducting the process of factorial
analysis, it is essential to understand if the data is suitable for the analysis.
Table 8 - KMO and Bartlett's Test
Cognitive
brand trust
Affective
brand trust
Brand
credibility
CCBRSMC
Kaiser-Meyer-Olkin
Measure of Sampling
Adequacy.
0,580395 0,661156 0,888850 0,861217
Bartlett's
Test of
Sphericity
Approx.
Chi-Square
341,101257 423,055903 1171,03028 1156,42809
gl 3 6 10 10
Sig. ,000 ,000 ,000 ,000
Source: own elaboration on SPSS
Kaiser-Meyer-Olkin (KMO) test is a measure of how the data is suitable. It indicates
which components to use, that is, the appropriateness of factor analysis (Marôco, 2010).
KMO returns values between 0 and 1. The sample is suitable if the number is between
0.5 and 1 (Silva, 2006). As can be concluded from the previous table, the numbers are
positives.
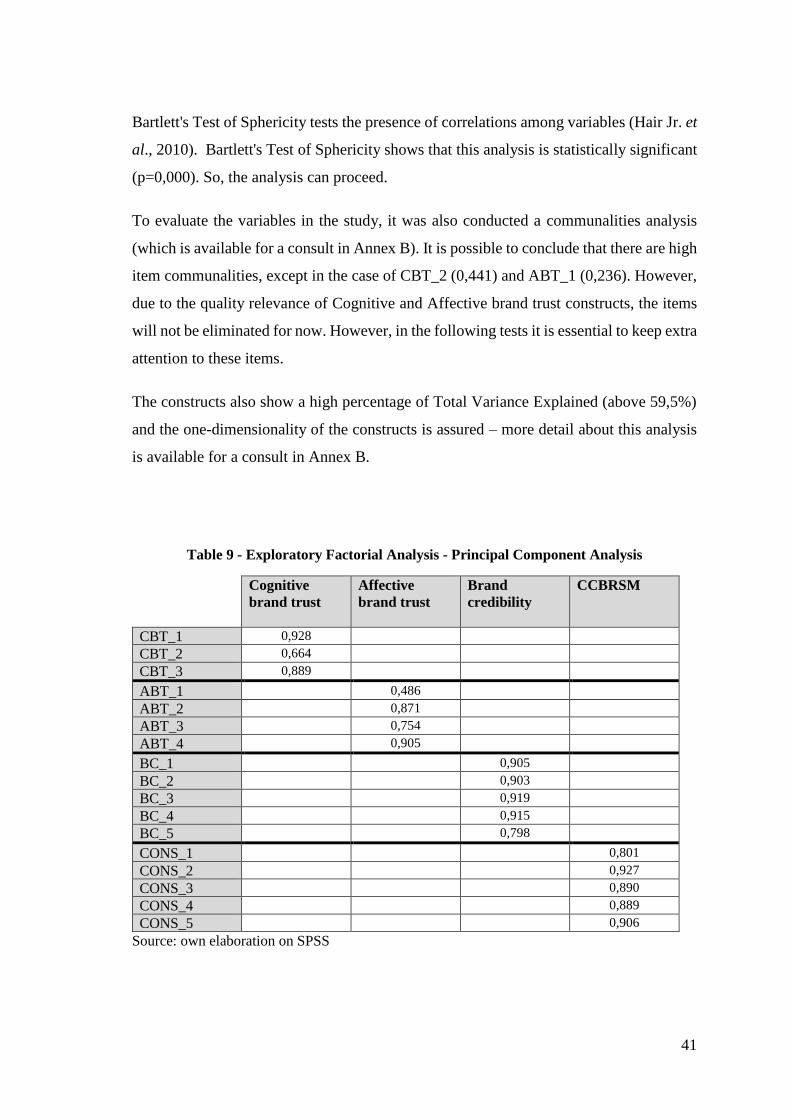
41
Bartlett's Test of Sphericity tests the presence of correlations among variables (Hair Jr. et
al., 2010). Bartlett's Test of Sphericity shows that this analysis is statistically significant
(p=0,000). So, the analysis can proceed.
To evaluate the variables in the study, it was also conducted a communalities analysis
(which is available for a consult in Annex B). It is possible to conclude that there are high
item communalities, except in the case of CBT_2 (0,441) and ABT_1 (0,236). However,
due to the quality relevance of Cognitive and Affective brand trust constructs, the items
will not be eliminated for now. However, in the following tests it is essential to keep extra
attention to these items.
The constructs also show a high percentage of Total Variance Explained (above 59,5%)
and the one-dimensionality of the constructs is assured – more detail about this analysis
is available for a consult in Annex B.
Table 9 - Exploratory Factorial Analysis - Principal Component Analysis
Cognitive
brand trust
Affective
brand trust
Brand
credibility
CCBRSM
CBT_1 0,928
CBT_2 0,664
CBT_3 0,889
ABT_1 0,486
ABT_2 0,871
ABT_3 0,754
ABT_4 0,905
BC_1 0,905
BC_2 0,903
BC_3 0,919
BC_4 0,915
BC_5 0,798
CONS_1 0,801
CONS_2 0,927
CONS_3 0,890
CONS_4 0,889
CONS_5 0,906
Source: own elaboration on SPSS

42
As it can be seen in the previous table, factor loadings are superior to 0,5, which is a
positive number. The exception is the ABT_1 item that has 0,486 of factor loading.
Afterwards running the Exploratory Factor Analysis, it is necessary to confirm the results
through the Confirmatory Factor Analysis. As described in the Methodology Chapter, it
is now required to analyse Construct Reliability (CR) and Average Variance Extracted
(AVE). Reliability and validity of the scales must be assured.
Table 10 - Construct Reliability (CR) and Average Variance Extracted (AVE)
Cognitive
brand trust
Affective
brand trust
Brand
credibility
CCBRSM
AVE
0,697
0,595
0,791
0,781
CR
0,871
0,849
0,950
0,947
Source: own elaboration on SPSS
It can be concluded that all the constructs have an AVE superior to 0.6, which is a positive
number since AVE should be superior to 0.5 (Marôco, 2010). Regarding CR, the value
for each construct should be higher than the AVE value to validate the convergence. Also,
CR value should be superior to 0.7 (Marôco, 2010), which all the constructs have.
In conclusion, there are reliability and convergent validity, and there are positive and high
correlations between the items of the constructs (Marôco, 2010).
Table 11 - Correlations matrix
Cognitive
brand trust
Affective
brand trust
Brand
credibility
CCBRSM
Cognitive
brand trust
0,835

43
Affective
brand trust
0,333
0,772
Brand
credibility
0,426
0,762
0,889
CCBRSM
0,020
0,431
0,383
0,884
Source: own elaboration on SPSS
In addition, the discriminant validity should be analysed according to the previous table.
In the diagonal, it is presented the square root of AVE values. Since the square root of
AVE is higher than the correlations of each construct, we are in presence of discriminant
validity. This means that each latent variable is explained by their items, and not for other
latent variables items.
After all, it is now possible to affirm that all constructs have both convergent and
discriminant validity.
Afterwards, the Measurement Model is presented. It involves four latent variables.

44
Figure 4 - Measurement Model
Source: own elaboration on AMOS
Some adjustments to the model were made, to improve model fit:
(1) ABT_1 (factor loading 3,17) and CBT_2 (factor loading 4,89) were eliminated.
This was already expected, due to the communalities results for these two items.
(2) Two covariances between errors were established (modification indices higher
than 19).

45
6.1.2 Structural Model
Table 12 presents the most common indexes used to measure the goodness of fit of the
model and the respective results of this study.
Model fit “compares the theory to reality by assessing the similarity of the estimated
covariance matrix (theory) to reality (the observed covariance matrix)” (Hair Jr. et al.,
2010).
Table 12 - Statistics and indexes of goodness of fit of the models
Statistics Reference Index model fit –
Measurement
Model
Index model fit –
Structural Model
χ 2 /gl > 5 – Bad Adjustment
]2; 5] – Tolerable Adjustment
]1; 2] – Good Adjustment
~1 – Very Good Adjustment
2,262
2,719
CFI
< 0.8 – Bad Adjustment
]0,8; 0,9] – Tolerable Adjustment
]0,9; 0,95] – Good Adjustment
≥ 0,95 – Very Good Adjustment
,969 ,957
TLI
,961 ,946
NFI
,946 ,934
RMSEA > 0.10 – Unacceptable Adjustment
]0,05; 0,10] – Tolerable Adjustment
≤ 0,05 – Good Adjustment
,068
,079
Source: Adapted from Marôco (2010) and AMOS Output
As it is possible to perceive, χ 2 /gl and RMSEA indexes demonstrate tolerable adjustment
for both Measurement model and Structural model. CFI demonstrates very good
adjustment for both Measurement model and Structural model. TLI demonstrates a very
good adjustment for the Measurement model and a good adjustment for the Structural
model. NFI demonstrates a good adjustment for both Measurement model and Structural
model.

46
Figure 5 - Structural model (AMOS Standardized Estimates)
Source: own elaboration on AMOS
The structural model shows a good loading on the relation between Brand credibility and
Cognitive brand trust (0,92), between CCBRSMC and Affective brand trust (0,76) and
between Cognitive brand trust and Affective brand trust (0,80). However, there is a low
and negative loading for the relation between CCBRSMC and Cognitive brand trust. This
low value is not totally unexpected since literature doesn’t provide any specific
information about this direct relation.
Nevertheless, some attempts were made to increase these loadings. Several alternative
models were tested with all the possible relations. Yet, the best indexes were the ones of
the proposed model.

47
6.1.3 Hypotheses Testing
The validation of the hypotheses is made through SEM. It was made a factorial analysis
that proved the convergent and discriminant validity of the constructs, which means that
is possible to proceed will all of them in the model.
Table 13 - Standardized Total Effects (Direct + Indirect)
Cognitive brand
trust
Affective brand
trust
Brand
credibility
CCBRSM
Cognitive brand
trust
,000
,000 ,916 -,292
Affective brand trust
,796
,000
,729
,187
Source: own elaboration on AMOS
The standardized total effects allow understanding the impact of each variable on the
others. Thus, it is possible to affirm that Brand credibility is the construct with more
impact on Cognitive brand trust, and Cognitive brand trust is the construct with more
impact on Affective brand trust, immediately followed by Brand credibility (see Table
13).
Table 14 - SEM Model Estimates
Estimates3
p-value Conclusion
H1: Brand credibility positively influences
Cognitive brand trust.
,565 *** Confirmed
H2: Consumer’s consumption of brand related
social media content positively influences
Cognitive brand trust.
-,118
,007
Not confirmed
H3: Consumer’s consumption of brand related
social media content positively influences
Affective brand trust.
,264
***
Confirmed
H4: Cognitive brand trust positively
influences Affective brand trust.
1,235
***
Confirmed
Source: own elaboration on AMOS
Legend: *** means approximately zero
3 E.g.: When Brand credibility goes up by 1, Cognitive brand trust goes up by ,565.

48
Table 14 provides information concerning the validation of H1, H3 and H4, since p-value
< 0,001. Also, the table shows that the positive relation between CCBRSMC and
Cognitive brand trust is not confirmed (p-value = ,007). This was already expected since
literature does not prove this relationship.
6.1.4 Multi group analysis
In this section, it will be conducted a multi group analysis to understand the impact of the
insignia brand (Continente) responses and national brand (Nestlé) responses.
“The Multi group Confirmatory Factor Analysis (MGCFA) is a structural equation
modelling technique which evaluates to what extent the configuration and the parameters
of a psychometric instrument are invariant (equivalent) in several groups.” (Damásio,
2013, p.211). It consists on split the groups, this means, the initial sample is divided into
two subgroups (Srivastava et al., 2016).
Thus, the sample was split into two groups: Continente and Nestlé. The analysis starts
with the estimation of four models:
M0 - Unconstrained model – without constraints (equal form).
M1 - Measurement weights – equal factor loadings.
M2 - Structural Covariances – equal covariance weights.
M3 - Measurement Residuals – equal weights, covariances, and residuals.
Table 15 - Multigroup Invariance analysis
CMIN DF χ 2 / DF
CFI
RMSEA
PCLOSE
ΔDF
Δ χ 2 / DF
ΔCFI
M0 384,789 166 2,318 ,936 ,070 ,000 - - -
M1 401,972 177 2,271 ,934 ,068 ,000 11 -0,047 -,002
M2 410,174 183 2,241 ,934 ,068 ,001 17 -0,077 -,002
M3 445,714 203 2,196 ,929 ,066 ,001 37 -0,122 -0,07
Source: own elaboration on AMOS

49
Configural invariance – “Both groups associate the same subsets of items with the same
constructs” (Cheung and Rensvold, 2002, p.236).
The first step is to analyse configural invariance, that is the initial model (M0), and,
because of that, it cannot be compared to any other previous model. Thus, it should be
evaluated through some fit indexes (Damásio, 2013).
χ 2 and RMSEA demonstrate a tolerable adjustment and CFI demonstrates a very good
adjustment. As the indexes are adequate, the plausibility of the model suggests that the
configuration proposed is plausible for both groups (Damásio, 2013).
Metric invariance – “Overall, the strength of the relationships between items and their
underlying constructs are the same for both groups” (Cheung and Rensvold, 2002, p.236).
As it can be seen in Table 15, M1 presents Δ χ 2 = -0,047. The difference is statistically
significate if Δ χ 2 <0,05 (Damásio, 2013). So, to this model, the difference is statistically
significate. It suggests that invariance assumption is not accepted, so the parameter in
evaluation is different between groups (Brown, 2006; Steiger, Shapiro and Browne, 1985;
cited on Damásio, 2013).
Although, as Damásio (2013) acknowledge, researchers have demonstrated that
differences in X2 are also dependent on sample size. So, CFI will also be analysed.
The model should not present ΔCFI > 0,01 when compared to the previous model
(Cheung and Rensvold, 2002). For M1, ΔCFI = -0,002, so it can be assumed metric
invariance.
According to Byrne (2010) is not unexpected, given its statistical stringency, that the χ2
difference test argues for evidence of noninvariance, while the CFI difference test argues
for invariance. In this situation, the same author says that the decision “of which one to
accept is purely an arbitrary one and rests solely with each individual researcher”.

50
Thus, in the context of this dissertation, metric invariance will not be accepted.
Consequently, scalar invariance cannot be tested (Damásio, 2013).
Once determined evidence of noninvariance when all factor loadings are held equal across
groups, the next step is to test the invariance of factor loadings relative to each item
separately (Byrne, 2010). To do so, the estimation of the following models was
conducted. Then, Table 16 shows the comparison of each model with M0 (Unconstrained
model – without constraints).
M1.1 - Measurement weights: Factor loadings for only Brand credibility (BC)
constrained equal.
M1.2 - Measurement weights: Factor loadings for only Consumer’s consumption of brand
related social media content (CCBRSMC) constrained equal.
M1.3 – Measurement weights: Factor loadings for only Cognitive brand trust (CBT)
constrained equal.
M1.4 – Measurement weights: Factor loadings for only Affective brand trust (ABT)
constrained equal.
Table 16 - Multigroup Invariance analysis (invariance of factor loadings relative to each
construct)
χ 2
DF Δ χ 2
ΔDF
Statistical
significance
CFI
ΔCFI
Conclusion
M0 384,789 166 - - - ,936 - -
M1.1 394,394 170 9,605 4 0,048 ,934 -0,002 noninvariant
M1.2 385,262 170 0,473 4 0,976 ,937 0,001 invariant
M1.3 391,724 167 6,935 1 0,008 ,934 -0,002 noninvariant
M1.4 385,028 168 0,239 2 0,887 ,936 0,000 invariant
BC_1 384,796 167 0,007 1 0,933 ,936 0 invariant
BC_2 385,948 167 1,159 1 0,282 ,936 0 invariant
BC_3 384,812 167 0,023 1 0,879 ,936 0 invariant
BC_4 385,852 167 1,063 1 0,303 ,936 0 invariant
BC_5 384,796 167 0,007 1 0,933 ,936 0 invariant
CBT_1 391,724 167 6,935 1 0,008 ,934 -0,002 noninvariant

51
CBT_3 391,724 167 6,935 1 0,008 ,934 -0,002 noninvariant
Source: own elaboration on AMOS
Table 16 shows that the noninvariance has its roots on Brand credibility and Cognitive
brand trust constructs. For this reason, the analyse of these constructs proceeded more
into detail, so, consequently, it was tested the invariance of factor loadings relative to
items.
Thus, concerning Cognitive brand trust none of the two constructs show invariance, and
they present the same values. Regarding Brand credibility, none of the five constructs
shows noninvariance individually. For this reason, the analysis was conduct grouping
items (see Table 17).
Table 17 - Multigroup Invariance analysis (invariance of factor loadings relative to Brand
credibility)
χ 2
DF Δ χ 2
ΔDF
Statistical
significance
CFI
ΔCFI
Conclusion
BC_1
BC_2
388,508 168 3,719
2 0,156 ,935 -0,001
invariant
BC_1
BC_3
384,817 168 0,028
2 0,986 ,937 0,001
invariant
BC_1
BC_4
387,091 168 2,302
2 0,316 ,936 0 invariant
BC_1
BC_5
387,091 168 2,302
2 0,316 ,936 0 invariant
BC_2
BC_3
389,580 168 4,791
2 0,094 ,935 -0,001
noninvariant
BC_2
BC_4
393,904 168 9,115
2 0,010 ,934 -0,002
noninvariant
BC_2
BC_5
388,508 168 3,719
2 0,156 ,935 -0,001
invariant
BC_3
BC_4
386,733 168 1,944
2 0,378 ,936 0 invariant

52
BC_3
BC_5
384,817 168 0,028
2 0,986 ,937 0,001
invariant
BC_4
BC_5
387,901 168 3,112
2 0,211 ,936 0
invariant
Source: own elaboration on AMOS
When grouping BC_2 and BC_3 or BC_2 and BC_4 noninvanriance is proved, as it can
be seen in Table 17.
In the following table, it can be seen a resume of which items of Cognitive brand trust
and Brand Credibility show invariance or noninvariance, and the respective items’
description. In the case of Brand credibility, the table represents the fact that
noninvariance only appear when grouping items.
Table 18 - Invariance / Noninvariance Items’ description
Construct
Invariance /
Noninvariance
Items
Cognitive brand
trust
Noninvariance
CBT_1: I can confidently depend on this brand
since it does not adversely affect my baby by
functioning carelessly
CBT_3: Given by this brand’s past record, I have
strong reason to doubt its effectiveness*
Invariance
CBT_2: Given by this brand’s past record, I see
no reason to doubt its competence

53
Brand credibility
Noninvariance
BC_2: This brand has the ability to deliver what it
promises
BC_3: This brand’s product claims are believable
BC_3: This brand’s product claims are believable
BC_4: This brand has a name you can trust
Invariance
BC_1: This brand reminds me of someone who is
BC_2: This brand has the ability to deliver what it
promises
BC_3: This brand’s product claims are believable
BC_4: This brand has a name you can trust
BC_5: This brand does not pretend to be
something it is not
Source: own elaboration

54
7. Discussion
This chapter intends to discuss the results of the previous one, keeping in account the
theoretical support presented in the Literature review chapter.
Taking into consideration the data gathered, the fruit compote for babies’ buyers are
majority female (69%), and they are 26 to 35 years old (34,7%) and hold a bachelor
degree (48,2%). In Portugal, are frequently mothers who take care of family feed. Also,
the previous study conducted by Srivastava et al. (2016), mentions various authors who
proved that mothers are the primary caregivers for children. In 2016, the average age of
women who gave birth in Portugal was 31,9 years old (Pordata Portugal, 25/07/2017),
which provides support to the profile of the respondents.
After the validation of the sample characteristics is now possible to proceed with the
discussion of the results of the constructs belonging to the proposed model.
Recalling the first question of this study research objective, it is “How is Affective brand
trust formed in the context of baby category?”. To answer the first question, Brand
credibility will be discussed as an antecedent of Cognitive brand trust, and Cognitive
brand trust as an antecedent of Affective brand trust, and consequently compared with
the results of previous studies. Distinctly, Consumer’s consumption of brand related
social media content will be discussed as an antecedent of Cognitive and Affective brand
trust.
Given the results presented in the previous section (see Table 14), it is possible to affirm
that the first hypothesis of the investigation is confirmed, with an acceptable loading. So,
in fact, Brand credibility positively and directly influences Cognitive brand trust.
Srivastava et al. (2015) and Srivastava et al. (2016) also proved this relation in their
studies about baby care category. Additionally, it is important to note that Brand
credibility is commonly accepted as a brand trust antecedent. For example, Lassoued and
Hobbs (2015) prove that brand competence, credibility, benevolence, and reputation
contribute to overall consumer trust in brands in the case of bagged salad; Gurviez and
Korchia (2003) prove in their study that Brand credibility is an antecedent of brand trust
in the context of cosmetics and Coca-cola.

55
It is also possible to conclude that the fourth hypothesis of the investigation is confirmed:
Cognitive brand trust positively and directly influences Affective brand trust. As Lewis
and Weigert (1985) acknowledge, Cognitive brand trust should exist before affective trust
since it provides a base for Affective brand trust. Johnson and Grayson (2005) and the
already mentioned studies of Srivastava et al. (2015) and Srivastava et al. (2016) also
prove this relation.
Regarding the construct Consumer’s consumption of brand related social media content,
it is possible to affirm that the second hypotheses is not confirmed and the third
hypotheses is confirmed. This means, Consumer’s consumption of brand related social
media content does not positively and directly influence Cognitive brand trust, but it
positively and directly influences Affective brand trust.
The discussion of these two hypotheses is particularly interesting since literature does not
prove these relationships. However, these relationships were considered in the proposed
model of this study, because Facebook, YouTube, Twitter, among others, have become
more and more significant in consumers’ lives. Nowadays, consumers’ relationship with
social media is reshaping consumers’ engagement with brands and consequently
marketing, due to social media interactive nature (Schivinski et al, 2016). So, it is
mandatory for the academy to study the relationship between relevant constructs
regarding social media engagement - such as Consumer’s consumption of brand related
social media content, which is the first and most relevant level of Consumer’s engagement
with brand related social media content (Schivinski et al, 2016) – and Cognitive and
Affective brand trust.
Moreover, it is important to note that some previous literature already has predicted the
relevance of studying and crossing engagement concepts with brand trust topic. Brodie et
al. (2013) mention that engaged consumers exhibit enhanced trust, among other
consequents. Their study identifies trust and commitment, among others, as consumer
engagement outcomes. They also mention other authors who previously talked about the
topic: Casalo et al. (2007) and Hollebeek (2011).

56
Therefore, it is now essential to understand why Consumer’s consumption of brand
related social media content does not positively and directly influence Cognitive brand
trust, but it positively and directly influences Affective brand trust. So, when talking about
social media, we are talking about relational marketing, which assumes an approach
related to opinions and personal evaluations. That is one very reasonable reason for the
cognitive aspect do not be potentialized in the context of social media. Perhaps, when the
engagement with the brand on social media starts, the cognitive knowledge is already
settle. The object of study of this dissertation intensifies this interpretation, since people
tend to intensely search for knowledge concerning products for babies both offline and
online.
To conclude the analysis of those relationships, it is important to note that Brand
credibility is the construct with more impact on Cognitive brand trust, and Cognitive
brand trust is the construct with more impact on Affective brand trust, immediately
followed by Brand credibility.
Finally, in order to answer the second question of this study research objective – “Are
there relevant differences between the model in the case of an insignia or a national
brand?”- it was conducted a multi group analysis. It evaluates to what extent the
configuration and the parameters of a psychometric instrument are invariant (equivalent)
in several groups. The results of the configural and metric invariance will be explained in
detail.
Firstly, it can be concluded that the model proved configural invariance. That means the
proposed model is robust. However, about metric invariance the conclusions are not so
clear. Δ χ 2 demonstrates noninvariance but ΔCFI demonstrates invariance (see Table 15).
In the context of this study, it was assumed metric noninvariance, the analysis proceeded
and the test of invariance of factor loadings relative to items was conducted.
The analysis showed evidence that metric noninvariance has its roots on Brand credibility
and Cognitive brand trust constructs (see Table 16).
57
As it was discussed in Literature review chapter, Brand credibility has been
predominantly conceptualized as a signal of product quality (Keller and Aaker, 1992;
Srivastava et al., 2016) and as a signal that the brand must have some competence in the
area (Keller and Aaker, 1992). As Brandão (2014) acknowledge, some consumers still
have a stigma related to insignia brands value, mostly because there is an association of
low cost products with lower quality to them. In conclusion, metric noninvariance is not
unexpected in this particular construct, specifically because we are working in the context
of baby food category. It is also important to note that this study is confronting two
significantly different brands: Continente, that is an insignia brand; and Nestlé, that is a
well stablished brand in Portugal, and that has been passing and proving quality through
generation to generation.
In a deeper analysis, none of the five items of Brand credibility showed metric
noninvariance individually (see Table 16), however, when grouping BC_2 and BC_3 or
BC_2 and BC_4, it showed metric noninvariance (see Table 17). These items are: BC_2
“This brand has the ability to deliver what it promises”; BC_3 “This brand’s product
claims are believable”; BC_4 “This brand has a name you can trust”.
The same logic must be applied to Cognitive brand trust. As it was mention in Literature
review chapter, Cognitive brand trust emerges from an accumulated knowledge that
allows customers to make predictions, with a certain level of confidence and allows
customers to build confidence that the brand will meet its obligations (Johnson and
Grayson, 2005). However, consumers perceive national brands as safest and with less
quality variation than insignia brands (Rubio et al. 2014). This triggers uncertainty about
satisfaction levels of the products (Da Silva Borges et al., 2016). Thus, once again, metric
noninvariance is not surprising in this construct. Since customers perceive quality
variation differently when referred to an insignia or a national brand, it seems natural that
Cognitive brand trust would be formed somehow differently for each brand.
In a deeper analyse concerning Cognitive brand trust, none of the two items showed
invariance (see Table 16). Remembering the items, they are: CBT_1 “I can confidently
depend on this brand since it does not adversely affect my baby by functioning

58
carelessly”; CBT_3 “Given by this brand’s past record, I have strong reason to doubt its
effectiveness”.
After discussing the results, the conclusions and limitations of this study will
consequently be presented. Also, some considerations for future research will be given.

59
Conclusion
This dissertation intended to contribute to the literature of Brand Management. In this
conclusion, the main conclusions of the dissertation will be presented, as well as its
academic and managerial contributions. In terms of managerial implications, a brand trust
scale provides to the managers a useful tool to create and increase stockholders trust in a
brand (Bastos et al., 2015). Thus, this conclusion will provide fruitful insights. Also, main
limitations and suggestions for future research will be referred.
This study highlights the growing importance that Brand trust has achieved both in the
world of management, whether in the academic world. The topic has been studied by
several authors. Firstly, brand trust was analysed in the marketing literature globally,
without specific dimensions. Then, due to the increasing relevance of the topic, it became
mandatory to the academy to understand the specific dimensions/antecedents of brand
trust, keeping in mind emotions and rationality. Subsequently, nowadays academic
studies are focused on analysing brand trust as a macro topic.
However, despite the unanimous opinion that the brand trust is important to the consumer-
brand relationship, there are no consensus either on a standard definition of brand trust,
on its dimensionality, or approaches to its measurement (Lassoued and Hobbs, 2015).
Previous studies about the topic have essentially focused on commonly purchased low
inherent risk products (Srivastava et al., 2016). Thus, this study contributes to filling this
gap since it empirically investigates Cognitive and Affective brand trust antecedents in
the context of a high perceived risk product category. The main innovativeness of the
proposed model is the empirical investigation of Consumer’s consumption of brand-
related social media content as an antecedent of Cognitive and Affective brand trust, with
the surplus of empirically examine the invariance of the proposed model between two
different groups - insignia brand and national brand, which is a relevant topic nowadays.
A quantitative research methodology using an online survey questionnaire to collect data
was conducted. In order to analyse the results and test the hypotheses, the Structural
Equation Model (SEM) was used. Baby food category (Fruit compotes) was the object of
this study, since it represents a high-risk product category where trust gains extra
importance.

60
Hence, this study contributes to a better academic and management knowledge about
brand trust formation, by introducing a model that has not been applied in this research
area before. The proposed model measures Affective brand trust through Cognitive brand
trust which is the moderate variable in this model, and Brand credibility and Consumer’s
consumption of brand-related social media content, which are the starting point of the
proposed model.
The proposed model considers Cognitive and Affective brand trust as distinct constructs
once these dimensions affect consumer-brand relationship differently with unique
antecedents (Srivastava et al., 2016).
So, in fact, the study showed that Cognitive brand trust positively and directly influences
Affective brand trust. Also, Consumer’s consumption of brand related social media
content positively and directly influences Affective brand trust. This relationship is a
novelty since previous literature does not prove it. Thus, it is a useful insight to
management.
Regarding Cognitive brand trust antecedents, in this study Consumer’s consumption of
brand related social media content is not confirmed as a Cognitive brand trust antecedent.
This relationship was not previously proven in previous literature.
This study proves that Brand credibility positively and directly influences Cognitive
brand trust. This relationship is not new in the Brand trust literature since previous authors
have already proved Brand credibility as an antecedent of Cognitive brand trust or, more
generally, as an antecedent of brand trust. This relationship is very logic since it seems
natural that if a brand is credible, it will be trustful in a Cognitive point of view.
After analysing the research hypotheses, it was conducted a multi group analysis to
evaluate to what extent the configuration and the parameters of a psychometric instrument
are invariant (equivalent) in several groups. The analysis showed evidence that the metric
noninvariance in the model has its roots on Brand credibility and Cognitive brand trust
constructs. Metric noninvariance is not unexpected in these constructs, specifically
because the object of study is Baby food category (Fruit compotes), a high inherent risk

61
category. In this particular context, is not a surprise that some consumers still have a
stigma related to insignia brands value, mostly because they associate low-cost products
with lower quality. Thus, it is also important to note that this study is confronting two
significantly different brands: Continente, that is an insignia brand; and Nestlé, that is a
well-stablished brand in Portugal, and that has been passing and proving quality through
generation to generation.
Despite the efforts to reach the fruit compotes for babies’ buyers, it would be better to
have a bigger sample. Also, the brands chosen for this study are very different in terms
of positioning and maturity in the Portuguese market. This fact probably influences the
proposed model results.
To future investigations it would be fruitful to study more into detail the relationship
between Affective brand trust and Consumer’s consumption of brand-related social
media content and the succeeding levels of Consumer’s engagement with brand related
social media content, which are: Consumer’s contribution to brand-related social media
content and Consumer’s creation to brand-related social media content. Additionally, it
would be very interesting to study which kind of social media content and which
platforms most influence the relationship between Affective brand trust and Consumer’s
consumption of brand-related social media content.

62
References
Aaker, J. L. (1997). Dimensions of brand personality. Journal of marketing research,
347-356.
Ailawadi, K. L., and Keller, K. L. (2004). Understanding retail branding: conceptual
insights and research priorities. Journal of Retailing, 80(4), 331-342.
Almeida, V. D. O. A. d. (2013). Antecedentes da lealdade à marca – clientes vs. não-
clientes da Apple. Departamente de Economia, Gestão e Engenharia Industrial,
Universidade de Aveiro (Portugal).
AYDIN, G., Ar, A. A., and TAŞKIN, Ç. (2014). The role of brand trust on parents’
purchase intentions of baby-care products. Doğuş Üniversitesi Dergisi, 15(2),
165-180.
Bahari, S. F. (2010). Qualitative versus quantitative research strategies: contrasting
epistemological and ontological assumptions. Sains Humanika, 52(1).
Bastos, D. H., Cunha Moura, L. R., and Magalhães Christino, J. M. (2015). Mensuração,
teste e validação da confiança na marca. Measurement, testing and confidence
validation in brand., 13(2), 100-113.
Brandão, A. M. P. d. C. (2014). MEASURING THE VALUE OF THE INSIGNIA
BRAND PRODUCTS: A STRUCTURAL MODELLING APPROACH.
Faculdade de Economia da Universidade do Porto (Portugal).
Brodie, R. J., Ilic, A., Juric, B., and Hollebeek, L. (2013). Consumer engagement in a
virtual brand community: An exploratory analysis. 66(1), 105.
doi:10.1016/j.jbusres.2011.07.029
Byrne, B. M. (2010). Structural Equation Modeling with AMOS: Basic Concepts,
Applications, and Programming: Routledge.
Cardoso, A., and Neves, P. (2008). Atitude dos consumidores relativamente à marca dos
distribuidores.
Chaudhuri, A., and Holbrook, M. B. (2001). The chain of effects from brand trust and
brand affect to brand performance: the role of brand loyalty. Journal of marketing,
65(2), 81-93.
Cheung, G. W., and Rensvold, R. B. (2002). Evaluating goodness-of-fit indexes for
testing measurement invariance. Structural equation modeling, 9(2), 233-255.

63
Cristina, C.-P., ValentÍN-Alejandro, M.-F., and Oscar, J.-B. (2016). INFLUENCE OF
MANUFACTURER SIGNATURE ON STORE BRANDS' LOYALTY AND
PURCHASE INTENTION / Influencia de la firma del fabricante sobre la lealtad
a las marcas blancas y la intención de compra / Influência da assinatura do
fabricante na lealdade e intenção de compra de marcas próprias de varejista (Vol.
56, pp. 29).
Da Silva Borges, L. A., De Carvalho, D. T., and De Souza Miranda, C. (2016).
ANTECEDENTES DA INTENÇÃO DE COMPRA DE MARCAS PRÓPRIAS:
UM ESTUDO NO MERCADO EMERGENTE (Vol. 56, pp. 611).
Damásio, B. F. (2013). Contribuições da Análise Fatorial Confirmatória Multigrupo
(AFCMG) na avaliação de invariância de instrumentos psicométricos. Psico-Usf,
18(2), 211-220.
Delgado-Ballester, E. (2004). Applicability of a brand trust scale across product
categories: A multigroup invariance analysis. European Journal of Marketing,
38(5/6), 573-592.
Delgado-Ballester, E., and Luis Munuera-Alemán, J. (2005). Does brand trust matter to
brand equity? Journal of Product and Brand Management, 14(3), 187-196.
Delgado-Ballester, E., Munuera-Alemán, J. L., and Yagüe-Guillén, M. J. (2003).
Development and validation of a brand trust scale (Vol. 45, pp. 35).
Doney, P. M., and Cannon, J. P. (1997). Trust in buyer-seller relationships. Journal of
marketing, 61(2), 35-51.
Erdem, T., and Swait, J. (2004). Brand credibility, brand consideration, and choice.
Journal of consumer research, 31(1), 191-198.
Fournier, S. (1998). Consumers and their brands: developing relationship theory in
consumer research (Vol. 24, pp. 343).
Gurviez, P., and Korchia, M. (2003). Proposal for a multidimensional brand trust scale.
Paper presented at the 32nd Emac-Conference-Glasgow, Marketing: Responsible
and Relevant.
Hair, J. F., Anderson, R. E., Babin, B. J., and Black, W. C. (2010). Multivariate data
analysis: A global perspective (Vol. 7): Pearson Upper Saddle River, NJ.
Heckathorn, D. D. (2011). Comment: snowball versus respondent‐driven sampling.
Sociological methodology, 41(1), 355-366.

64
Hiscock, J. (2001). Most trusted brands. Marketing, 1(1), 32-33.
Johnson, D., and Grayson, K. (2005). Cognitive and affective trust in service
relationships. Journal of Business research, 58(4), 500-507.
Keller, K. L., and Aaker, D. A. (1992). The effects of sequential introduction of brand
extensions. Journal of marketing research, 35-50.
Lassoued, R., and Hobbs, J. E. (2015). Consumer confidence in credence attributes: The
role of brand trust. Food Policy, 52, 99-107. doi:10.1016/j.foodpol.2014.12.003
Lau, G. T., and Lee, S. H. (1999). Consumers' trust in a brand and the link to brand
loyalty. Journal of Market-Focused Management, 4(4), 341-370.
Lewis, J. D., and Weigert, A. (1985). Trust as a social reality. Social forces, 63(4), 967-
985.
Li, F., Zhou, N., Kashyap, R., and Yang, Z. (2008). Brand trust as a second-order factor
(Vol. 50, pp. 817).
Marôco, J. (2010). Análise de Equações Estruturais: Fundamentos teóricos, software and
Aplicações. Pêro Pinheiro.
Marôco, J., and Garcia-Marques, T. (2006). Qual a fiabilidade do alfa de Cronbach?
Questões antigas e soluções modernas? Laboratório de psicologia, 65-90.
Matell, M. S., and Jacoby, J. (1971). Is there an optimal number of alternatives for Likert
scale items? Study I: Reliability and validity. Educational and psychological
measurement, 31(3), 657-674.
Morgan, R. M., and Hunt, S. D. (1994). The commitment-trust theory of relationship
marketing. The journal of marketing, 20-38.
Muntinga, D. G., Moorman, M., and Smit, E. G. (2011). Introducing COBRAs: Exploring
motivations for brand-related social media use. International Journal of
advertising, 30(1), 13-46.
Ong, C. H., and Zien Yusoff, R. (2016). The Role of Emotional and Rational Trust in
Explaining Attitudinal and Behavioral Loyalty: An Insight Into SME Brands.
Gadjah Mada International Journal of Business, 18(1), 1-19.
Rossi, P., Borges, A., and Bakpayev, M. (2015). Private labels versus national brands:
The effects of branding on sensory perceptions and purchase intentions. 27, 74.
doi:10.1016/j.jretconser.2015.07.006

65
Rousseau, D. M., Sitkin, S. B., Burt, R. S., and Camerer, C. (1998). Not so different after
all: A cross-discipline view of trust. Academy of management review, 23(3), 393-
404.
Rubio, N., Oubiña, J., and Villaseñor, N. (2014). Brand awareness–Brand quality
inference and consumer’s risk perception in store brands of food products. Food
quality and preference, 32, 289-298.
Rubio, N., Villaseñor, N., and Yagüe, M. J. (2017). Creation of consumer loyalty and
trust in the retailer through store brands: The moderating effect of choice of store
brand name. 34, 358. doi:10.1016/j.jretconser.2016.07.014
Schivinski, B., Christodoulides, G., and Dabrowski, D. (2016). Measuring Consumers'
Engagement With Brand-Related Social-Media Content. Journal of Advertising
Research, 56(1), 64-80.
Schmidt, W. C. (1997). World-Wide Web survey research: Benefits, potential problems,
and solutions. Behavior Research Methods, 29(2), 274-279.
Silva, J. S. F. d. (2006). Modelagem de Equações Estruturais: Apresentação de uma
metodologia.
Srivastava, N., Dash, S. B., and Mookerjee, A. (2015). Antecedents and moderators of
brand trust in the context of baby care toiletries. Journal of Consumer Marketing,
32(5), 328-340.
Srivastava, N., Dash, S. B., and Mookerjee, A. (2016). Determinants of brand trust in
high inherent risk products: The moderating role of education and working status.
Marketing Intelligence and Planning, 34(3), 394-420.
Thorbjørnsen, H., Supphellen, M., Nysveen, H., and Pedersen, P. E. (2002). Building
brand relationships online: A comparison of two interactive applications. Journal
of Interactive Marketing, 16(3), 17-34.
Ullman, J. B., and Bentler, P. M. (2003). Structural equation modeling: Wiley Online
Library.
Webgraphy
Grande Consumo, http://www.grandeconsumo.com/noticia/11609/alimentacao-infantil-
e-puericultura-mercados-a-prova-de-maturidade , accessed in 1/04/2017

66
Pordata Portugal,
http://www.pordata.pt/Portugal/Idade+m%C3%A9dia+da+m%C3%A3e+ao+nasciment
o+de+um+filho-417 , accessed in 25/07/2017

67
Appendix
A – Questionnaire
A.1 – Insignia Brand Survey (Continente)
Confiança na marca – Boiões de Fruta Continente
Este inquérito destina-se a compradores de boiões de fruta para bebés (até 2 anos) que sejam residentes em Portugal
Continental.
POR FAVOR, PARA RESPONDER A ESTE INQUÉRITO TENHA EM MENTE OS BOIÕES PURÉ DE FRUTA PARA
BEBÉ MARCA CONTINENTE.
O tempo estimado para o preenchimento do questionário é de 5 minutos.
O inquérito é anónimo e os dados serão utilizados unicamente no âmbito deste estudo.
Desde já muito obrigada pela sua participação neste estudo.
Grupo A
[] *
Por favor, selecione a posição apropriada para cada elemento:
Eu posso ter confiança na marca Continente, uma vez que não afeta negativamente o meu bebé, funcionando
descuidadamente
1 = Discordo totalmente 2 3 4 5 6 7 Não sei / Não se aplica
○ ○ ○ ○ ○ ○ ○ ○
Tendo em conta a performance passada desta marca, não há duvida da sua competência
1 = Discordo totalmente 2 3 4 5 6 7 Não sei / Não se aplica
○ ○ ○ ○ ○ ○ ○ ○
Tendo em conta a performance passada desta marca, há fortes razões para duvidar da sua efetividade
1 = Discordo totalmente 2 3 4 5 6 7 Não sei / Não se aplica
○ ○ ○ ○ ○ ○ ○ ○
Grupo B
[] *
Por favor, selecione a posição apropriada para cada elemento:
O Continente apenas tem interesse em vender os seus produtos
1 = Discordo totalmente 2 3 4 5 6 7 Não sei / Não se aplica
○ ○ ○ ○ ○ ○ ○ ○
Esta marca tem uma atitude quente e carinhosa com os bebés
1 = Discordo totalmente 2 3 4 5 6 7 Não sei / Não se aplica
○ ○ ○ ○ ○ ○ ○ ○
Se eu não pudesse usar mais esta marca, iria ter um sentimento pessoal de perda
1 = Discordo totalmente 2 3 4 5 6 7 Não sei / Não se aplica
○ ○ ○ ○ ○ ○ ○ ○
Eu sinto que a marca iria responder carinhosamente, se eu enfrentasse um problema com o produto
1 = Discordo totalmente 2 3 4 5 6 7 Não sei / Não se aplica
○ ○ ○ ○ ○ ○ ○ ○
Grupo C
[] *
Por favor, selecione a posição apropriada para cada elemento:
O Continente transmite competência e transmite que sabe o que está a fazer

68
1 = Discordo totalmente 2 3 4 5 6 7 Não sei / Não se aplica
○ ○ ○ ○ ○ ○ ○ ○
Esta marca tem a capacidade de entregar o que promete
1 = Discordo totalmente 2 3 4 5 6 7 Não sei / Não se aplica
○ ○ ○ ○ ○ ○ ○ ○
As reivindicações (características anunciadas) de produtos desta marca são credíveis
1 = Discordo totalmente 2 3 4 5 6 7 Não sei / Não se aplica
○ ○ ○ ○ ○ ○ ○ ○
Esta marca tem um nome em que podemos confiar
1 = Discordo totalmente 2 3 4 5 6 7 Não sei / Não se aplica
○ ○ ○ ○ ○ ○ ○ ○
Esta marca não pretende ser algo que não é
1 = Discordo totalmente 2 3 4 5 6 7 Não sei / Não se aplica
○ ○ ○ ○ ○ ○ ○ ○
Grupo D
[] *
Por favor, selecione a posição apropriada para cada elemento:
1 = Discordo totalmente 2 3 4 5 6 7 Não sei / Não se aplica
○ ○ ○ ○ ○ ○ ○ ○
Eu leio publicações relacionadas com o Continente nos social media
1 = Discordo totalmente 2 3 4 5 6 7 Não sei / Não se aplica
○ ○ ○ ○ ○ ○ ○ ○
Eu leio fanpages desta marca nos social network sites
1 = Discordo totalmente 2 3 4 5 6 7 Não sei / Não se aplica
○ ○ ○ ○ ○ ○ ○ ○
Eu vejo imagens / gráficos relacionados com esta marca
1 = Discordo totalmente 2 3 4 5 6 7 Não sei / Não se aplica
○ ○ ○ ○ ○ ○ ○ ○
Eu sigo blogues relacionados com esta marca
1 = Discordo totalmente 2 3 4 5 6 7 Não sei / Não se aplica
○ ○ ○ ○ ○ ○ ○ ○
Eu sigo esta marca nos social network sites
1 = Discordo totalmente 2 3 4 5 6 7 Não sei / Não se aplica
○ ○ ○ ○ ○ ○ ○ ○
Grupo E
[]Género *
Por favor, selecione apenas uma das seguintes opções:
○ Masculino
○ Feminino
[]Idade *
Escolha uma das seguintes respostas
Por favor, selecione apenas uma das seguintes opções:
○ <18
○ 18 a 25 anos
○ 26 a 35 anos
○ 36 a 45 anos

69
○ 46 a 55 anos
○ 56 a 65 anos
○ Mais de 65 anos
[]Escolaridade *
Escolha uma das seguintes respostas
Por favor, selecione apenas uma das seguintes opções:
○ Ensino Básico
○ Ensino Secundário
○ Licenciatura
○ Mestrado
○ Doutoramento
[]Rendimento líquido mensal do agregado familiar *
Escolha uma das seguintes respostas
Por favor, selecione apenas uma das seguintes opções:
○ <=1000€
○ 1001 a 2000€
○ 2001 a 3000€
○ >3000€
[]Zona Geográfica de residência *
Escolha uma das seguintes respostas
Por favor, selecione apenas uma das seguintes opções:
○ Viana do Castelo
○ Braga
○ Bragança
○ Proto
○ Viseu
○ Guarda
○ Aveiro
○ Coimbra
○ Castelo Branco
○ Leiria
○ Santarém
○ Vila Real
○ Lisboa
○ Évora
○ Beja
○ Portalegre
○ Setúbal
○ Faro
Muito obrigada pela sua participação!
20/06/2017 – 19:16
A.2 – National Brand Survey (Nestlé)
Confiança na marca – NATURNES Boiões de Fruta Nestlé
Este inquérito destina-se a compradores de boiões de fruta para bebés (até 2 anos) que sejam residentes em Portugal
Continental.
POR FAVOR, PARA RESPONDER A ESTE INQUÉRITO TENHA EM MENTE OS NATURNES BOIÕES DA NESTLÉ.
O tempo estimado para o preenchimento do questionário é de 5 minutos.
O inquérito é anónimo e os dados serão utilizados unicamente no âmbito deste estudo.
Desde já muito obrigada pela sua participação neste estudo.

70
Grupo A
[] *
Por favor, selecione a posição apropriada para cada elemento:
Eu posso ter confiança na Nestlé, uma vez que não afeta negativamente o meu bebé, funcionando descuidadamente
1 = Discordo totalmente 2 3 4 5 6 7 Não sei / Não se aplica
○ ○ ○ ○ ○ ○ ○ ○
Tendo em conta a performance passada desta marca, não há duvida da sua competência
1 = Discordo totalmente 2 3 4 5 6 7 Não sei / Não se aplica
○ ○ ○ ○ ○ ○ ○ ○
Tendo em conta a performance passada desta marca, há fortes razões para duvidar da sua efetividade
1 = Discordo totalmente 2 3 4 5 6 7 Não sei / Não se aplica
○ ○ ○ ○ ○ ○ ○ ○
Grupo B
[] *
Por favor, selecione a posição apropriada para cada elemento:
A Nestlé apenas tem interesse em vender os seus produtos
1 = Discordo totalmente 2 3 4 5 6 7 Não sei / Não se aplica
○ ○ ○ ○ ○ ○ ○ ○
Esta marca tem uma atitude quente e carinhosa com os bebés
1 = Discordo totalmente 2 3 4 5 6 7 Não sei / Não se aplica
○ ○ ○ ○ ○ ○ ○ ○
Se eu não pudesse usar mais esta marca, iria ter um sentimento pessoal de perda
1 = Discordo totalmente 2 3 4 5 6 7 Não sei / Não se aplica
○ ○ ○ ○ ○ ○ ○ ○
Eu sinto que a marca iria responder carinhosamente, se eu enfrentasse um problema com o produto
1 = Discordo totalmente 2 3 4 5 6 7 Não sei / Não se aplica
○ ○ ○ ○ ○ ○ ○ ○
Grupo C
[] *
Por favor, selecione a posição apropriada para cada elemento:
A Nestlé transmite competência e transmite que sabe o que está a fazer
1 = Discordo totalmente 2 3 4 5 6 7 Não sei / Não se aplica
○ ○ ○ ○ ○ ○ ○ ○
Esta marca tem a capacidade de entregar o que promete
1 = Discordo totalmente 2 3 4 5 6 7 Não sei / Não se aplica
○ ○ ○ ○ ○ ○ ○ ○
As reivindicações (características anunciadas) de produtos desta marca são credíveis
1 = Discordo totalmente 2 3 4 5 6 7 Não sei / Não se aplica
○ ○ ○ ○ ○ ○ ○ ○
Esta marca tem um nome em que podemos confiar
1 = Discordo totalmente 2 3 4 5 6 7 Não sei / Não se aplica
○ ○ ○ ○ ○ ○ ○ ○
Esta marca não pretende ser algo que não é
1 = Discordo totalmente 2 3 4 5 6 7 Não sei / Não se aplica
○ ○ ○ ○ ○ ○ ○ ○

71
Grupo D
[] *
Por favor, selecione a posição apropriada para cada elemento:
Eu leio publicações relacionadas com a Nestlé nos social media
1 = Discordo totalmente 2 3 4 5 6 7 Não sei / Não se aplica
○ ○ ○ ○ ○ ○ ○ ○
Eu leio fanpages desta marca nos social network sites
1 = Discordo totalmente 2 3 4 5 6 7 Não sei / Não se aplica
○ ○ ○ ○ ○ ○ ○ ○
Eu vejo imagens / gráficos relacionados com esta marca
1 = Discordo totalmente 2 3 4 5 6 7 Não sei / Não se aplica
○ ○ ○ ○ ○ ○ ○ ○
Eu sigo blogues relacionados com esta marca
1 = Discordo totalmente 2 3 4 5 6 7 Não sei / Não se aplica
○ ○ ○ ○ ○ ○ ○ ○
Eu sigo esta marca nos social network sites
1 = Discordo totalmente 2 3 4 5 6 7 Não sei / Não se aplica
○ ○ ○ ○ ○ ○ ○ ○
Grupo E
[]Género *
Por favor, selecione apenas uma das seguintes opções:
○ Masculino
○ Feminino
[]Idade *
Escolha uma das seguintes respostas
Por favor, selecione apenas uma das seguintes opções:
○ <18
○ 18 a 25 anos
○ 26 a 35 anos
○ 36 a 45 anos
○ 46 a 55 anos
○ 56 a 65 anos
○ Mais de 65 anos
[]Escolaridade *
Escolha uma das seguintes respostas
Por favor, selecione apenas uma das seguintes opções:
○ Ensino Básico
○ Ensino Secundário
○ Licenciatura
○ Mestrado
○ Doutoramento
[]Rendimento líquido mensal do agregado familiar *
Escolha uma das seguintes respostas
Por favor, selecione apenas uma das seguintes opções:

72
○ <=1000€
○ 1001 a 2000€
○ 2001 a 3000€
○ >3000€
[]Zona Geográfica de residência *
Escolha uma das seguintes respostas
Por favor, selecione apenas uma das seguintes opções:
○ Viana do Castelo
○ Braga
○ Bragança
○ Proto
○ Viseu
○ Guarda
○ Aveiro
○ Coimbra
○ Castelo Branco
○ Leiria
○ Santarém
○ Vila Real
○ Lisboa
○ Évora
○ Beja
○ Portalegre
○ Setúbal
○ Faro
Muito obrigada pela sua participação!
20/06/2017 – 19:16
B – Factorial analysis
B.1 – Communalities (Source: own elaboration on SPSS)
CBT
Initial Extraction
CBT_1 1,000 ,861
CBT_2 1,000 ,441
CBT_3 1,000 ,790
Extraction Method: Principal
Component Analysis.
ABT
Initial Extraction
ABT_1 1,000 ,236
ABT_2 1,000 ,758
ABT_3 1,000 ,568
ABT_4 1,000 ,820
Extraction Method: Principal
Component Analysis.

73
BC
Initial Extraction
BC_1 1,000 ,820
BC_2 1,000 ,815
BC_3 1,000 ,845
BC_4 1,000 ,838
BC_5 1,000 ,636
Extraction Method: Principal
Component Analysis.
CCBRSMC
Initial Extraction
CONS_1 1,000 ,642
CONS_2 1,000 ,859
CONS_3 1,000 ,793
CONS_4 1,000 ,790
CONS_5 1,000 ,820
Extraction Method: Principal
Component Analysis.
B.2 – Total Variance Explained (Source: own elaboration on SPSS)
CBT
Component
Initial Eigenvalues Extraction Sums of Squared Loadings
Total % of Variance Cumulative % Total % of Variance Cumulative %
1 2,092 69,735 69,735 2,092 69,735 69,735
2 ,719 23,965 93,701
3 ,189 6,299 100,000
Extraction Method: Principal Component Analysis.
ABT
Component
Initial Eigenvalues Extraction Sums of Squared Loadings
Total % of Variance Cumulative % Total % of Variance Cumulative %
1 2,381 59,535 59,535 2,381 59,535 59,535
2 ,874 21,858 81,393
3 ,566 14,162 95,555
4 ,178 4,445 100,000
Extraction Method: Principal Component Analysis.

74
BC
Component
Initial Eigenvalues Extraction Sums of Squared Loadings
Total % of Variance Cumulative % Total % of Variance Cumulative %
1 3,954 79,071 79,071 3,954 79,071 79,071
2 ,465 9,294 88,365
3 ,221 4,417 92,782
4 ,189 3,787 96,569
5 ,172 3,431 100,000
Extraction Method: Principal Component Analysis.
CCBRSMC
Component
Initial Eigenvalues Extraction Sums of Squared Loadings
Total % of Variance Cumulative % Total % of Variance Cumulative %
1 3,903 78,062 78,062 3,903 78,062 78,062
2 ,499 9,988 88,050
3 ,258 5,166 93,217
4 ,203 4,065 97,281
5 ,136 2,719 100,000
Extraction Method: Principal Component Analysis.