cognitive maps i would like to acknowledge emel aktaş who has great influence on the organization...
TRANSCRIPT
Cognitive Maps
I would like to acknowledge Emel Aktaş
who has great influence on the organization of these slides
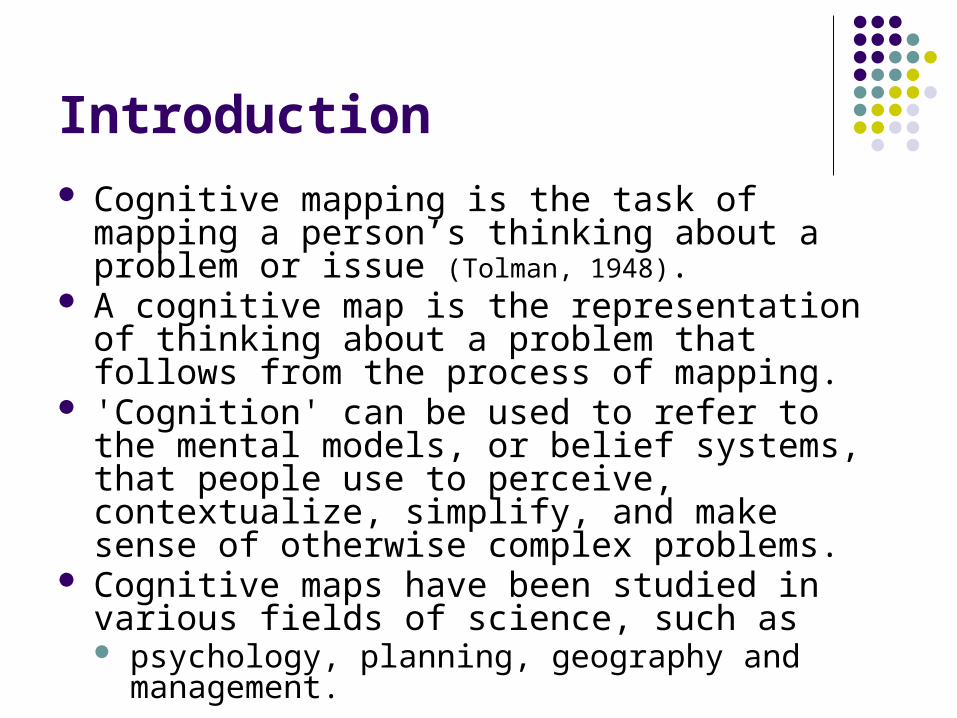
Introduction Cognitive mapping is the task of mapping a person’s
thinking about a problem or issue (Tolman, 1948). A cognitive map is the representation of thinking
about a problem that follows from the process of mapping.
'Cognition' can be used to refer to the mental models, or belief systems, that people use to perceive, contextualize, simplify, and make sense of otherwise complex problems.
Cognitive maps have been studied in various fields of science, such as psychology, planning, geography and management.
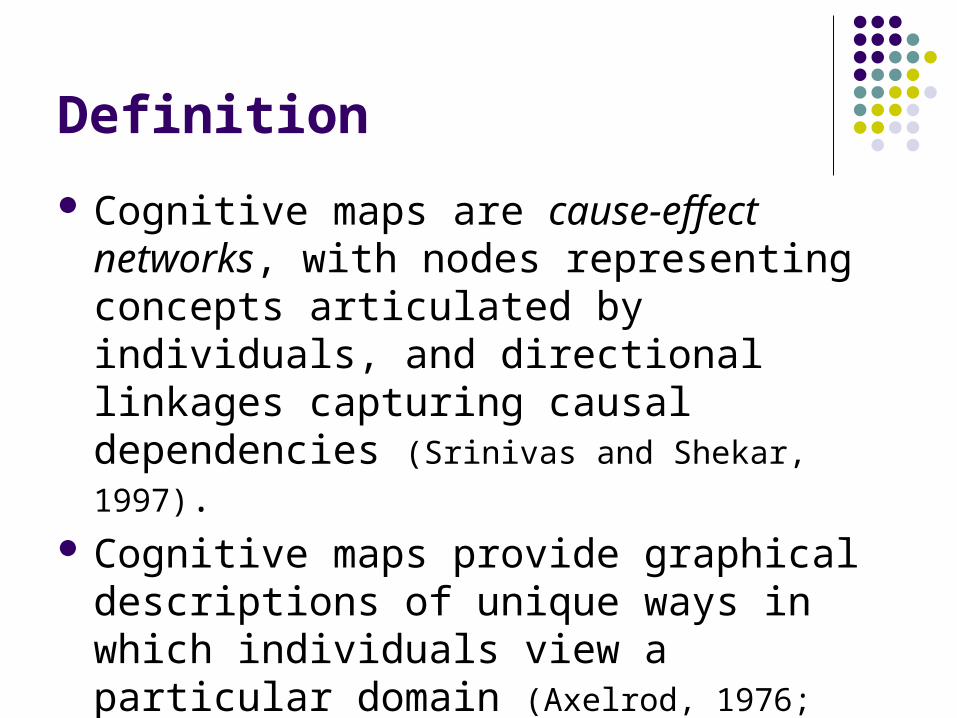
Definition
Cognitive maps are cause-effect networks, with nodes representing concepts articulated by individuals, and directional linkages capturing causal dependencies (Srinivas and
Shekar, 1997). Cognitive maps provide graphical descriptions
of unique ways in which individuals view a particular domain (Axelrod, 1976; Eden, 1990).
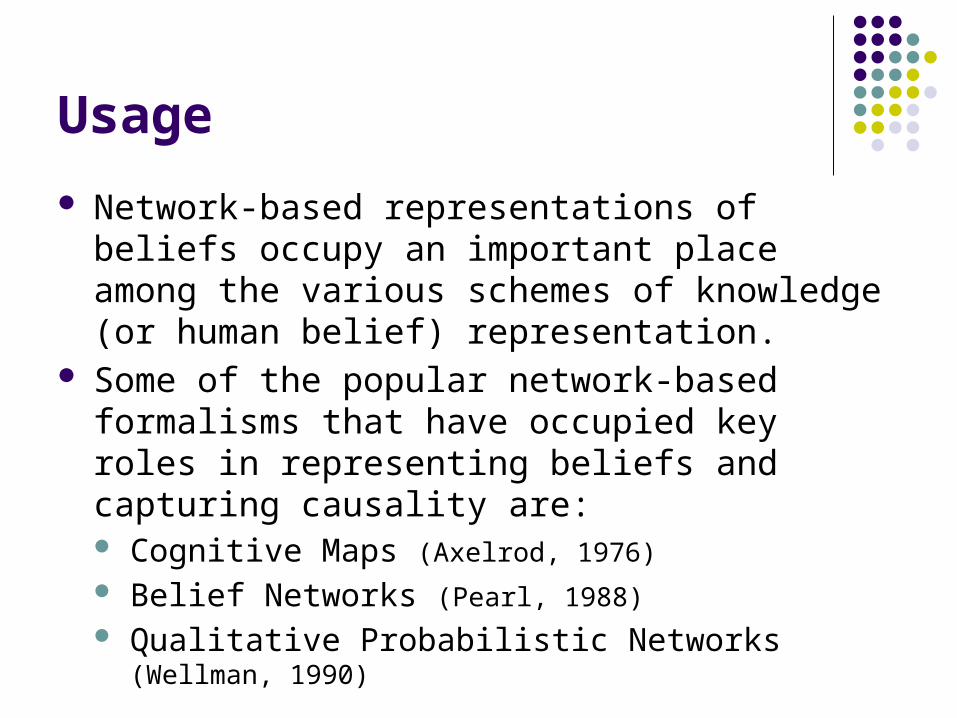
Usage
Network-based representations of beliefs occupy an important place among the various schemes of knowledge (or human belief) representation.
Some of the popular network-based formalisms that have occupied key roles in representing beliefs and capturing causality are: Cognitive Maps (Axelrod, 1976)
Belief Networks (Pearl, 1988)
Qualitative Probabilistic Networks (Wellman, 1990)
Causal map
The term “cognitive map” has been used to describe several forms of diagrammatic representation of an individual’s cognitions.
Causal map is one such form of cognitive maps which are essentially network representation of beliefs of individuals.
The networks have nodes representing concepts, and arcs representing directional relationships between these nodes.
Causal map
The maps are a network of nodes and arrows as links (a particular type of ‘directed graph’ (Harary et al.,
1965; Harary, 1972), where the direction of the arrow implies believed causality.
Thus, cognitive maps are also known as ‘cause maps’ or ‘causal maps’. When they are constructed by a group, they represent the
cognition of the group rather than an individual. The formalisms for cause maps will be the same as those
for cognitive maps.
Mapping
Cognitive maps are usually derived through interviews, so they represent the subjective world of the interviewee.
Cognitive mapping is a formal modeling technique with rules for its development.
The formal basis for cognitive maps derives from personal construct theory (Kelly, 1955) which proposes an understanding of how humans ‘‘make sense of’’ their world by seeking to manage and control it.
Representation
For representational purposes a cognitive map is usually drawn as short pieces of text linked with unidirectional arrows to link them.
In the general case, a statement at the tail of an arrow is taken to cause, or influence, the statement at the arrowhead.
Cognitive maps can be derived by questionnaire survey, documentary coding and/or interviews.
Representation
In cognitive mapping concepts (nodes) are connected to the others by incoming or outgoing arrows.
When there is a negative relationship between concepts a minus sign is attached to the arrow.
For positive relationships plus sign may or may not be attached.
This representation is also referred as signed directed graph.
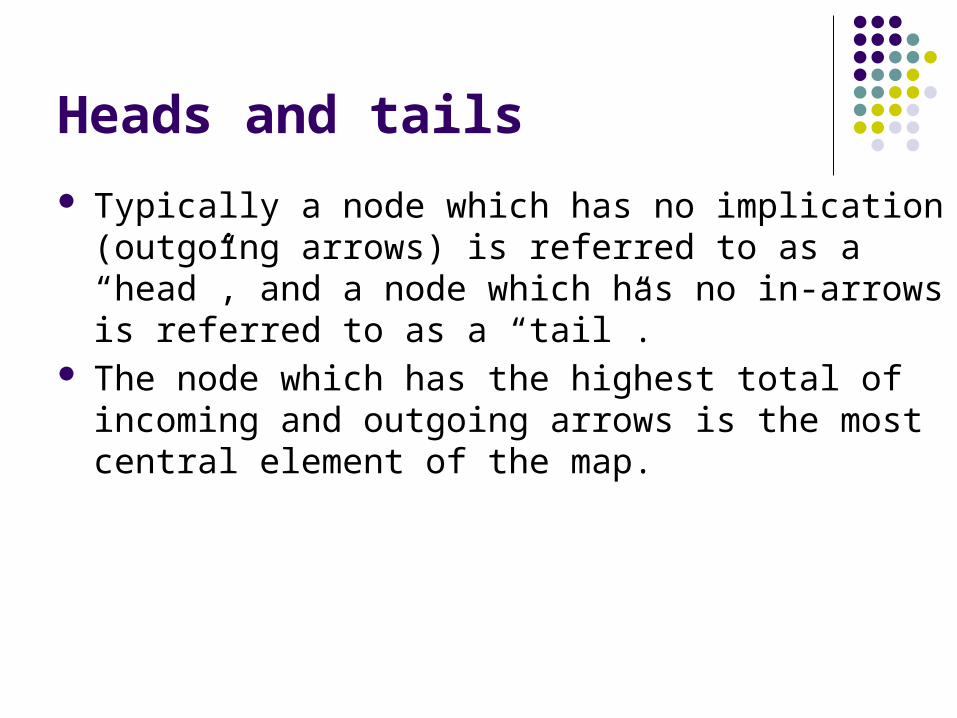
Heads and tails
Typically a node which has no implication (outgoing arrows) is referred to as a “head”, and a node which has no in-arrows is referred to as a “tail”.
The node which has the highest total of incoming and outgoing arrows is the most central element of the map.
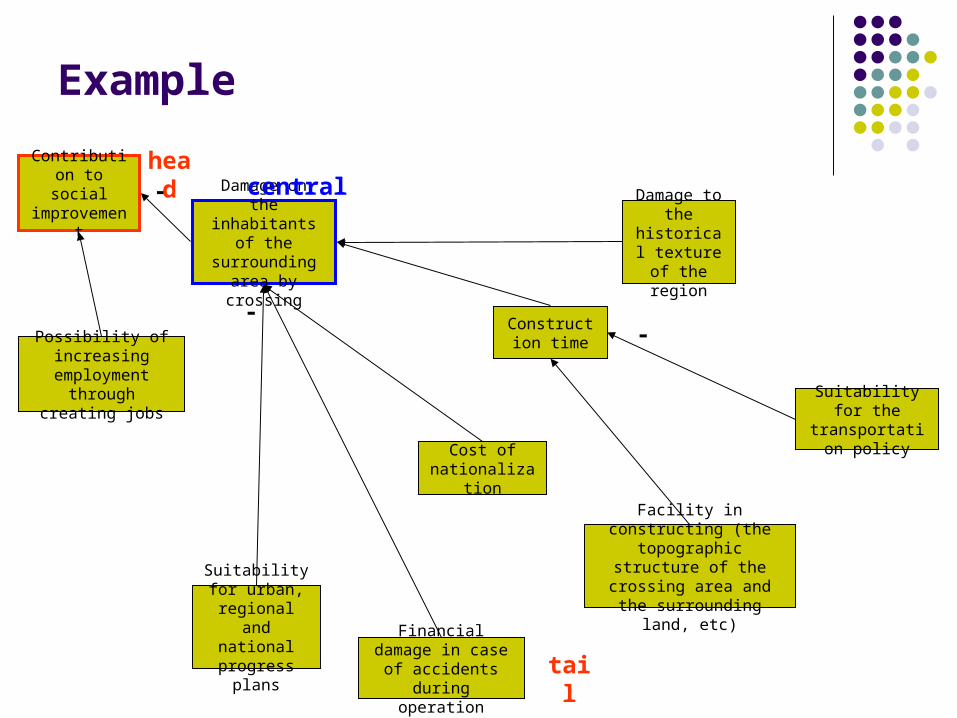
Example
Contribution to social
improvement Damage on the inhabitants of the surrounding area
by crossing
Damage to the historical texture of the
region
Cost of nationalization
Possibility of increasing
employment through creating jobs
-
Construction time
Facility in constructing (the topographic structure of
the crossing area and the surrounding land, etc)Suitability for
urban, regional and national
progress plans
-
Suitability for the transportation
policy
-
Financial damage in case of accidents during operation
headcentral
tail
Heads and tails
Heads will usually be “goal” type statements: expressions of desired or not-desired outcomes,
Tails will be “options”. When goals are expressed as not-desired
outcomes, sometimes indicating disasters to be avoided at all costs, they are referred to as “negative-goals”.
Usually the map will contain more goal statements than those shown by heads, and more options than those shown by tails.
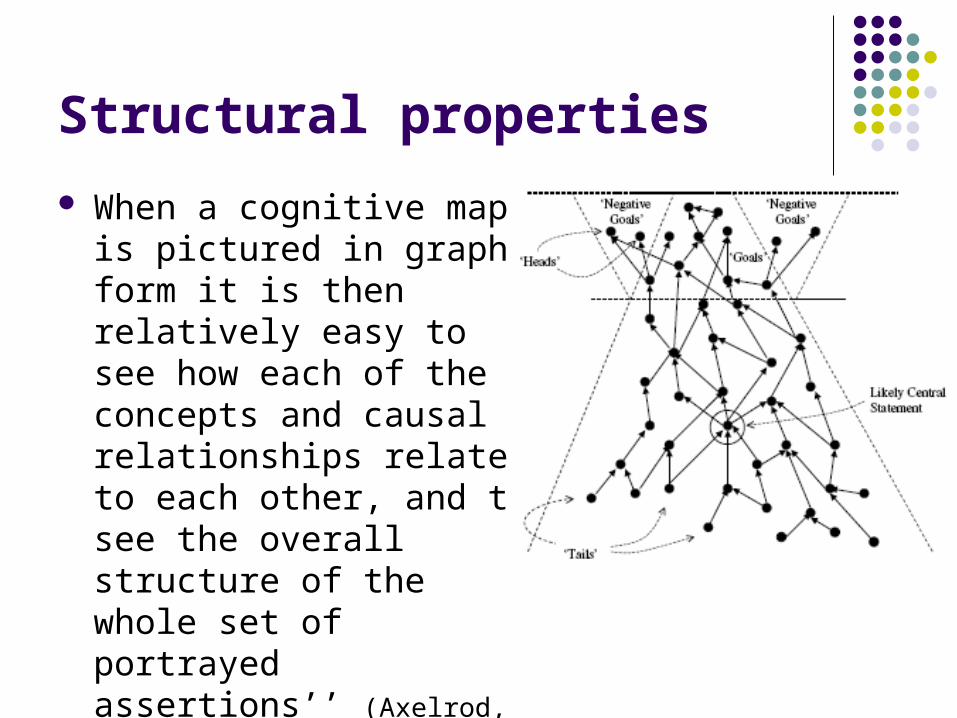
Structural properties
When a cognitive map is pictured in graph form it is then relatively easy to see how each of the concepts and causal relationships relate to each other, and to see the overall structure of the whole set of portrayed assertions’’ (Axelrod, 1976).
Problem/issue complexity
Both cognitive scientists and organizational scientists have been fond of simple analyses of cognitive maps.
These analyses are supposed to indicate the central features of a directed graph. The first of these simple analyses explores the
total number of nodes and the total number of arrows;
The second is concerned with “cognitive centrality” of particular nodes.
The extent of the map
The more nodes (or concepts) are there in a map, the more complex is the map and the issue.
The map, as model, acts as a device for establishing a mutual understanding of the issue.
The number of concepts elicited during an interview is dependent upon the length of the interview and the skills of the interviewer.
The complexity of the map as a network
An alternative analysis of issue complexity is to determine the ratio of arrows to concepts. A higher ratio indicates a densely connected map and supposedly a higher level of complexity.
Ratios of 1.15 to 1.20 is fine for maps elicited from interviews.
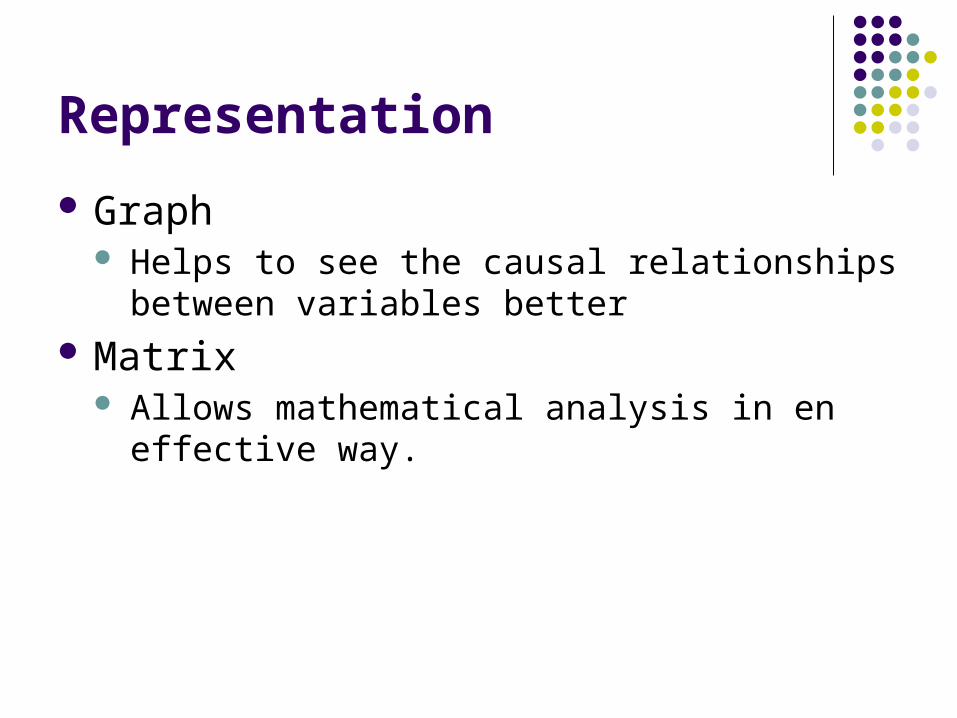
Representation
Graph Helps to see the causal relationships between
variables better Matrix
Allows mathematical analysis in en effective way.
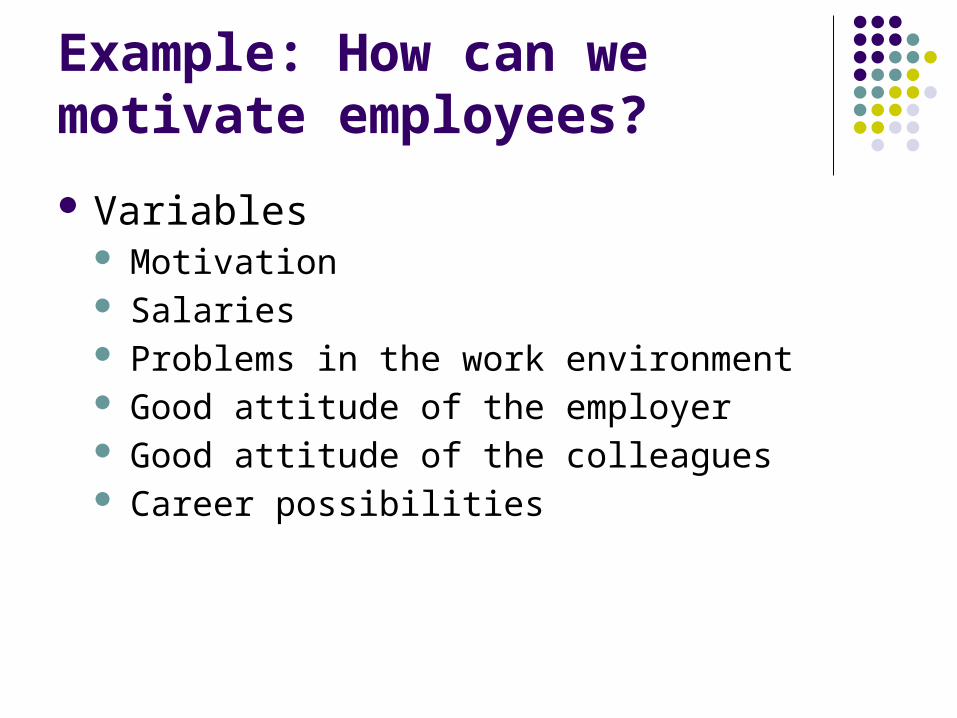
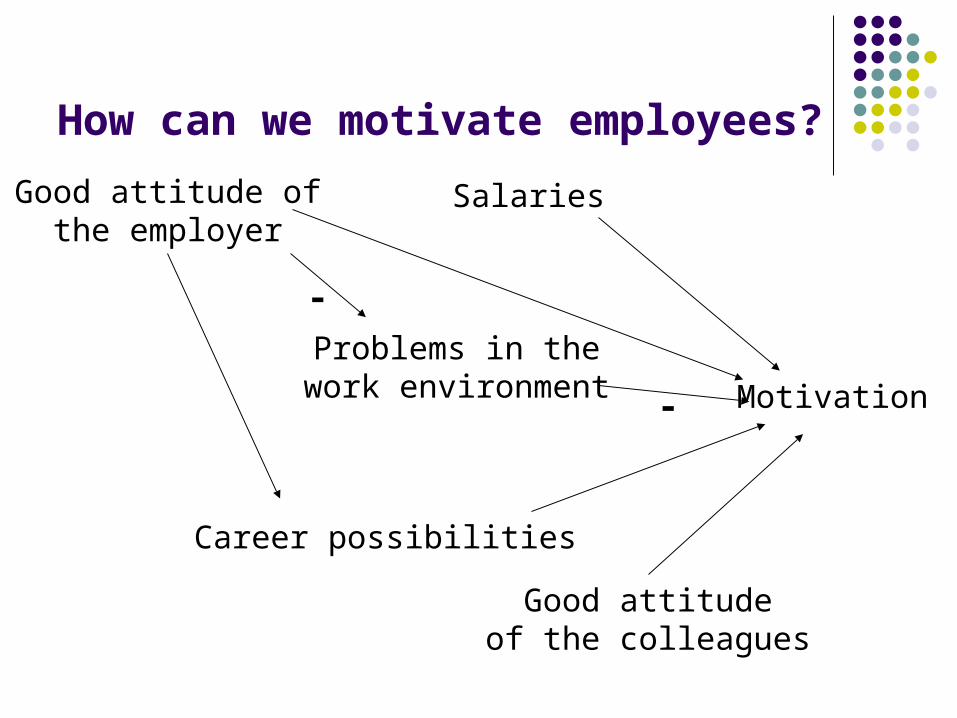
Example: How can we motivate employees?
Variables Motivation Salaries Problems in the work environment Good attitude of the employer Good attitude of the colleagues Career possibilities
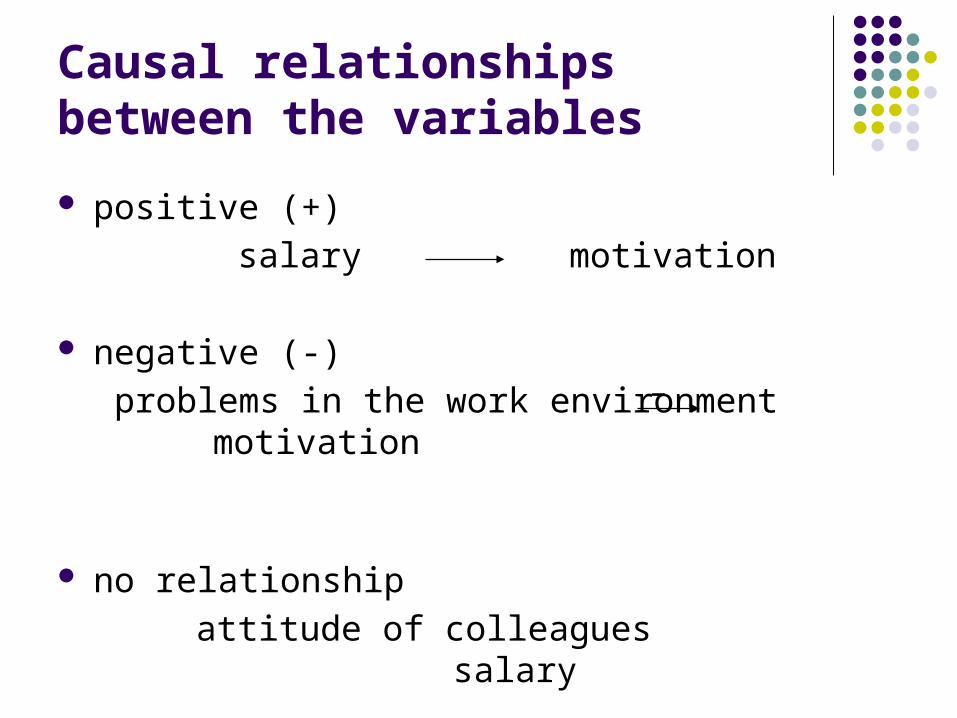
positive (+)
salary motivation
negative (-)
problems in the work environment motivation
no relationship
attitude of colleagues salary
Causal relationships between the variables
–
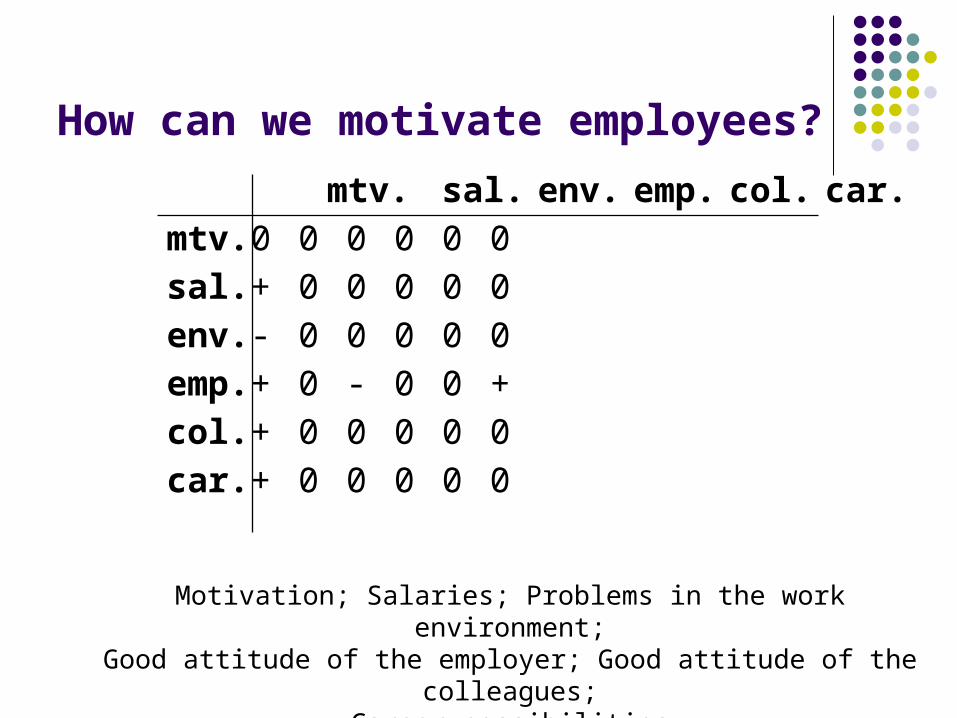
How can we motivate employees?
mtv. sal. env. emp. col. car.
mtv. 0 0 0 0 0 0
sal. + 0 0 0 0 0
env. - 0 0 0 0 0
emp. + 0 - 0 0 +
col. + 0 0 0 0 0
car. + 0 0 0 0 0
Motivation; Salaries; Problems in the work environment;Good attitude of the employer; Good attitude of the colleagues;
Career possibilities
How can we motivate employees?
Motivation
Salaries
Problems in thework environment
Good attitude ofthe employer
Good attitudeof the colleagues
Career possibilities
-
-
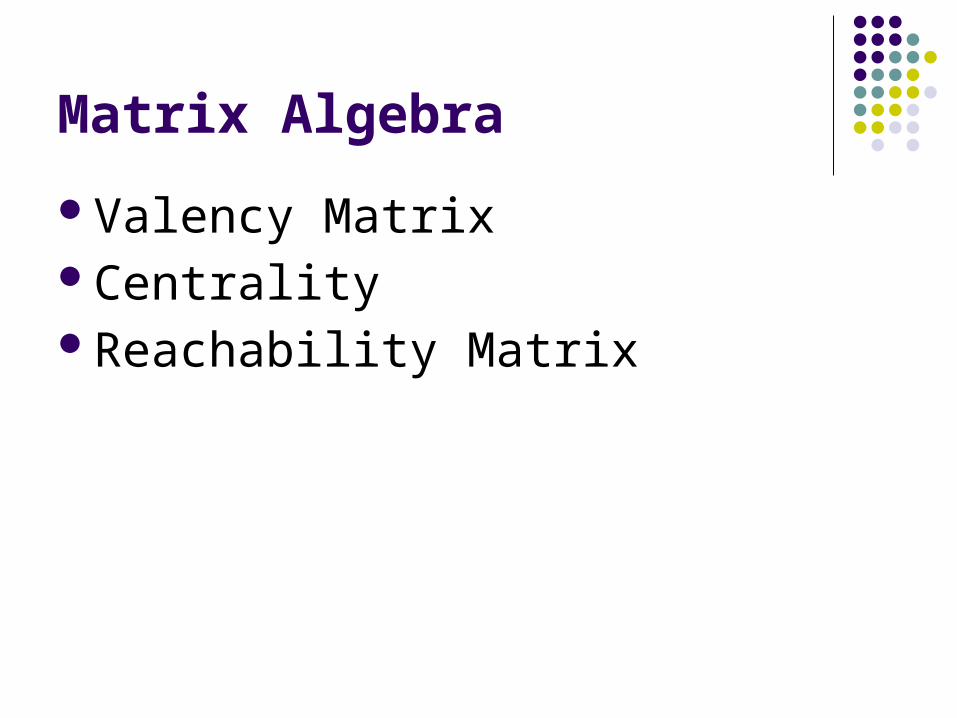
Matrix Algebra
Valency MatrixCentralityReachability Matrix
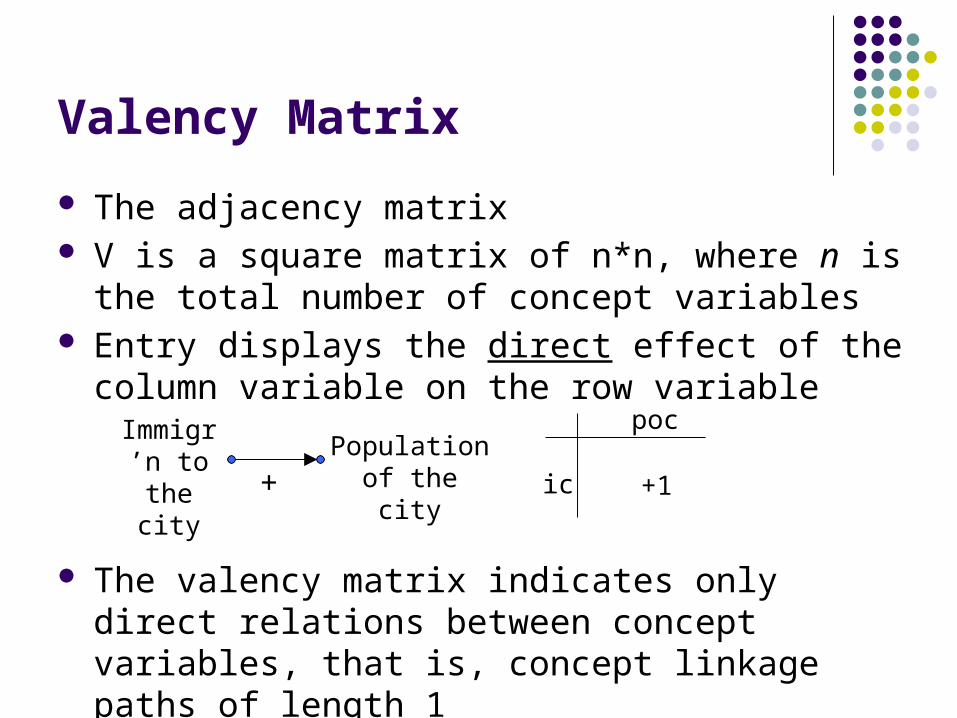
Valency Matrix
The adjacency matrix V is a square matrix of n*n, where n is the total
number of concept variables Entry displays the direct effect of the column variable
on the row variable
The valency matrix indicates only direct relations between concept variables, that is, concept linkage paths of length 1
Immigr’n to the city
Population of the city+ ic
poc
+1
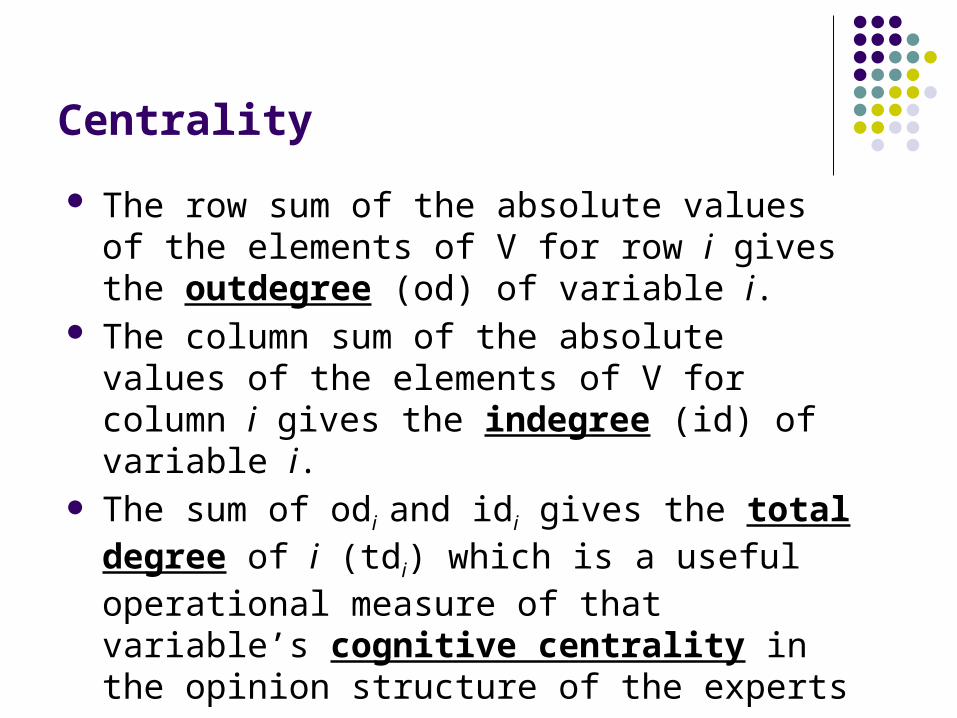
Centrality
The row sum of the absolute values of the elements of V for row i gives the outdegree (od) of variable i.
The column sum of the absolute values of the elements of V for column i gives the indegree (id) of variable i.
The sum of odi and idi gives the total degree of i (tdi) which is a useful operational measure of that variable’s cognitive centrality in the opinion structure of the experts
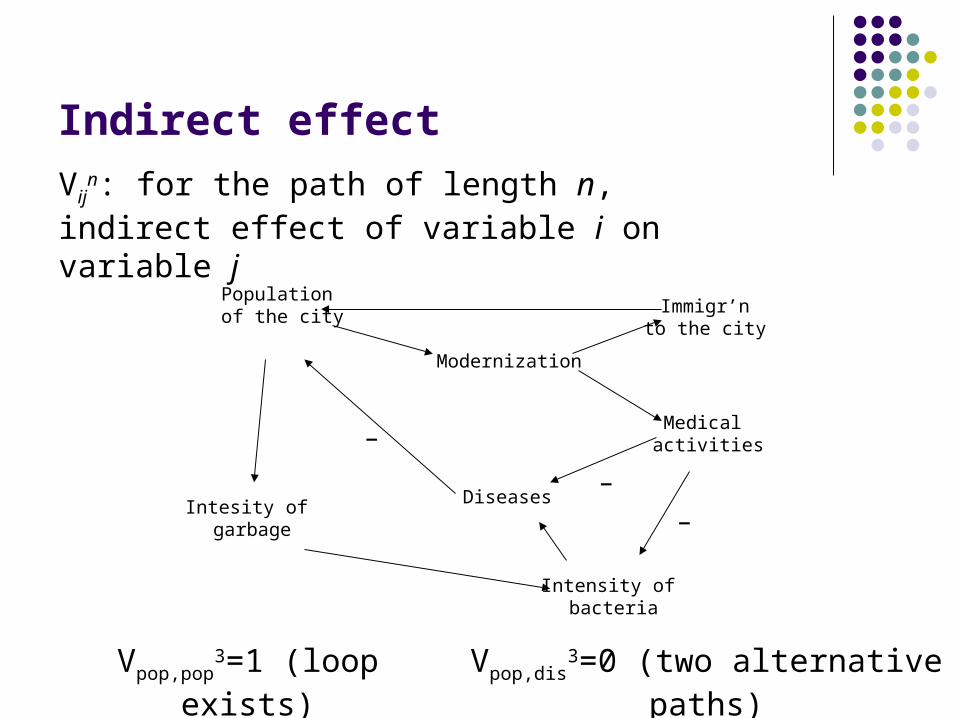
Indirect effect
Population of the city
Modernization
Medical activities
Intesity of garbage
Immigr’nto the city
Diseases
Intensity of bacteria
–
–
–
Vpop,pop3=1 (loop exists) Vpop,dis
3=0 (two alternative paths)
Vijn: for the path of length n, indirect effect of
variable i on variable j
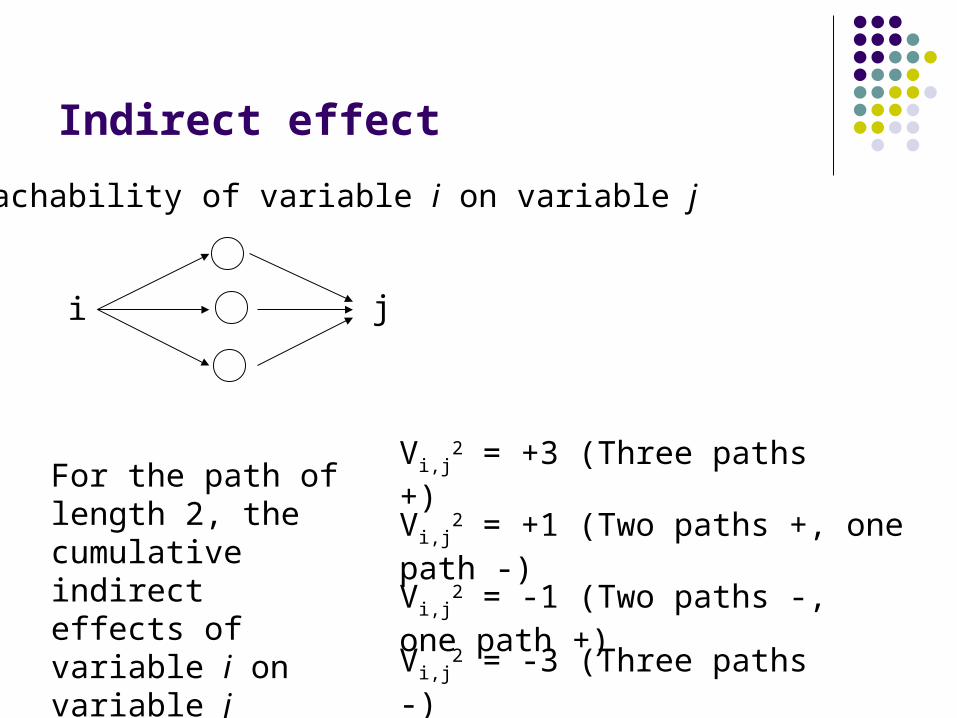
Indirect effect
i j
Vi,j2 = +3 (Three paths +)
Vi,j2 = +1 (Two paths +, one path -)
Vi,j2 = -1 (Two paths -, one path +)
Vi,j2 = -3 (Three paths -)
Reachability of variable i on variable j
For the path of length 2, the cumulative indirect effects of variable i on variable j
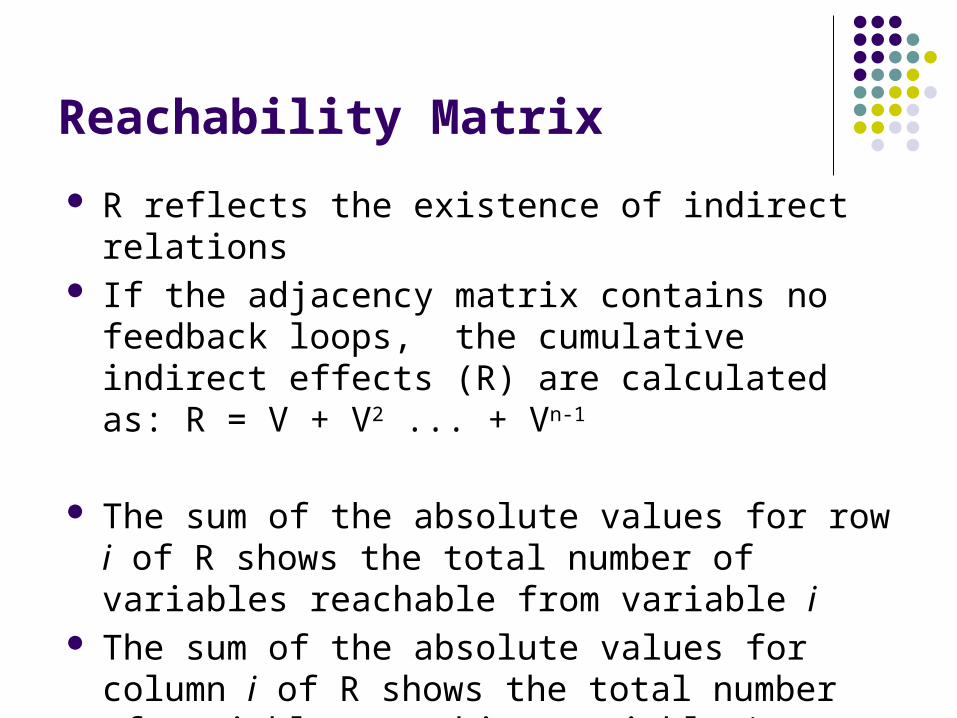
Reachability Matrix
R reflects the existence of indirect relations If the adjacency matrix contains no feedback loops,
the cumulative indirect effects (R) are calculated as: R = V + V2 ... + Vn-1
The sum of the absolute values for row i of R shows the total number of variables reachable from variable i
The sum of the absolute values for column i of R shows the total number of variables reaching variable i
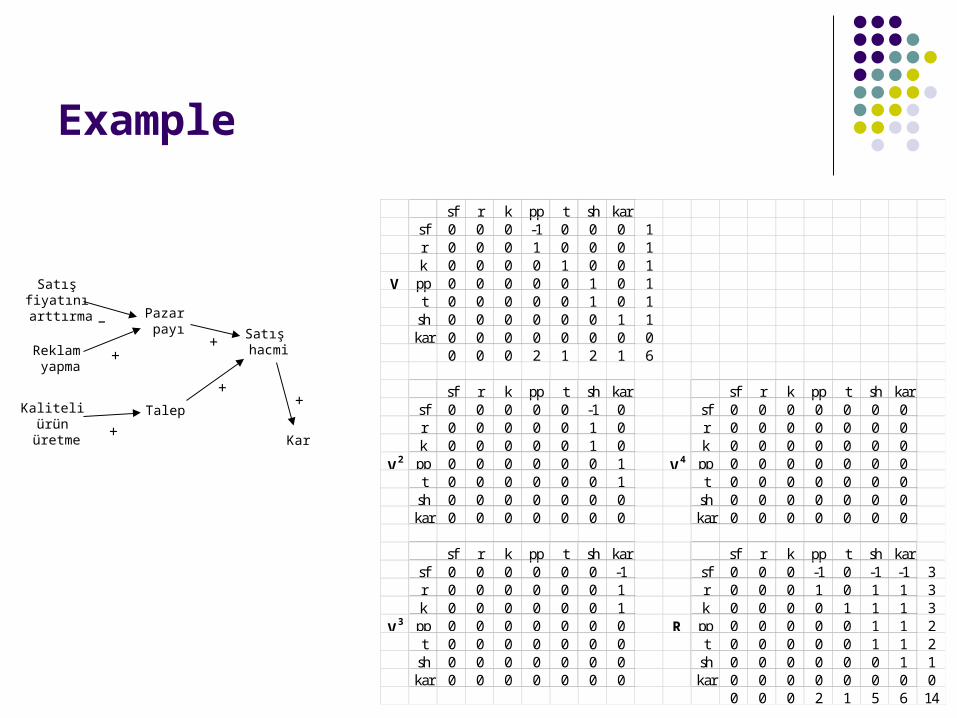
Example
sf r k pp t sh karsf 0 0 0 -1 0 0 0 1r 0 0 0 1 0 0 0 1k 0 0 0 0 1 0 0 1
V pp 0 0 0 0 0 1 0 1t 0 0 0 0 0 1 0 1sh 0 0 0 0 0 0 1 1kar 0 0 0 0 0 0 0 0
0 0 0 2 1 2 1 6
sf r k pp t sh kar sf r k pp t sh karsf 0 0 0 0 0 -1 0 sf 0 0 0 0 0 0 0r 0 0 0 0 0 1 0 r 0 0 0 0 0 0 0k 0 0 0 0 0 1 0 k 0 0 0 0 0 0 0
V2 pp 0 0 0 0 0 0 1 V4 pp 0 0 0 0 0 0 0t 0 0 0 0 0 0 1 t 0 0 0 0 0 0 0sh 0 0 0 0 0 0 0 sh 0 0 0 0 0 0 0kar 0 0 0 0 0 0 0 kar 0 0 0 0 0 0 0
sf r k pp t sh kar sf r k pp t sh karsf 0 0 0 0 0 0 -1 sf 0 0 0 -1 0 -1 -1 3r 0 0 0 0 0 0 1 r 0 0 0 1 0 1 1 3k 0 0 0 0 0 0 1 k 0 0 0 0 1 1 1 3
V3 pp 0 0 0 0 0 0 0 R pp 0 0 0 0 0 1 1 2t 0 0 0 0 0 0 0 t 0 0 0 0 0 1 1 2sh 0 0 0 0 0 0 0 sh 0 0 0 0 0 0 1 1kar 0 0 0 0 0 0 0 kar 0 0 0 0 0 0 0 0
0 0 0 2 1 5 6 14
Satış fiyatını arttırma
Reklam yapma
Kaliteli ürün
üretme
Satış hacmi
Pazar payı
Talep
Kar
+
+
+
++
–
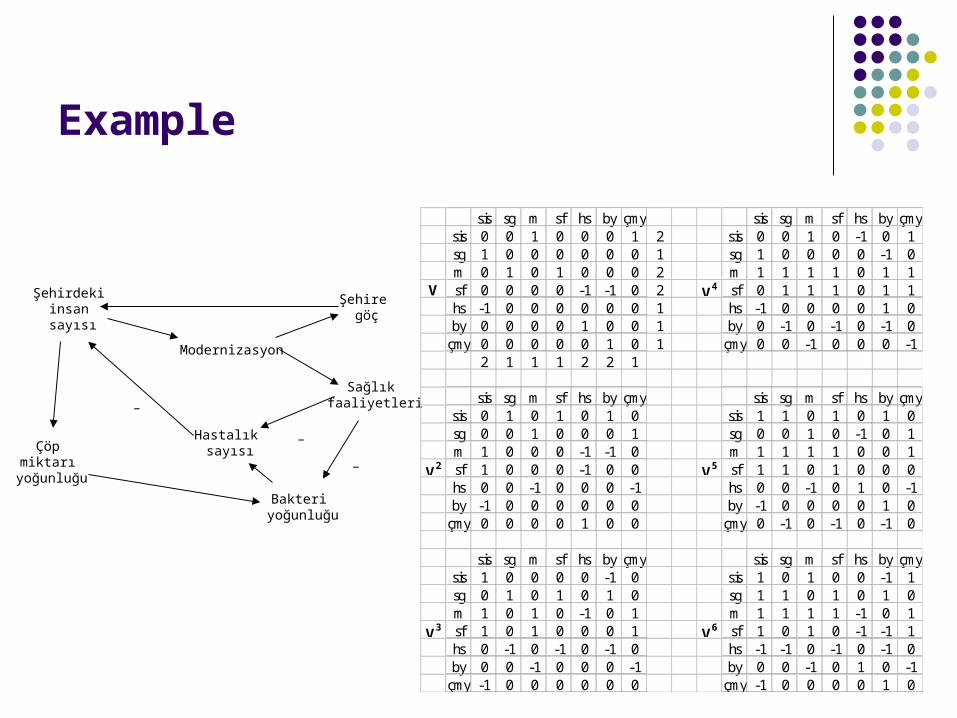
sis sg m sf hs by çmy sis sg m sf hs by çmysis 0 0 1 0 0 0 1 2 sis 0 0 1 0 -1 0 1sg 1 0 0 0 0 0 0 1 sg 1 0 0 0 0 -1 0m 0 1 0 1 0 0 0 2 m 1 1 1 1 0 1 1
V sf 0 0 0 0 -1 -1 0 2 V4 sf 0 1 1 1 0 1 1hs -1 0 0 0 0 0 0 1 hs -1 0 0 0 0 1 0by 0 0 0 0 1 0 0 1 by 0 -1 0 -1 0 -1 0çmy 0 0 0 0 0 1 0 1 çmy 0 0 -1 0 0 0 -1
2 1 1 1 2 2 1
sis sg m sf hs by çmy sis sg m sf hs by çmysis 0 1 0 1 0 1 0 sis 1 1 0 1 0 1 0sg 0 0 1 0 0 0 1 sg 0 0 1 0 -1 0 1m 1 0 0 0 -1 -1 0 m 1 1 1 1 0 0 1
V2 sf 1 0 0 0 -1 0 0 V5 sf 1 1 0 1 0 0 0hs 0 0 -1 0 0 0 -1 hs 0 0 -1 0 1 0 -1by -1 0 0 0 0 0 0 by -1 0 0 0 0 1 0çmy 0 0 0 0 1 0 0 çmy 0 -1 0 -1 0 -1 0
sis sg m sf hs by çmy sis sg m sf hs by çmysis 1 0 0 0 0 -1 0 sis 1 0 1 0 0 -1 1sg 0 1 0 1 0 1 0 sg 1 1 0 1 0 1 0m 1 0 1 0 -1 0 1 m 1 1 1 1 -1 0 1
V3 sf 1 0 1 0 0 0 1 V6 sf 1 0 1 0 -1 -1 1hs 0 -1 0 -1 0 -1 0 hs -1 -1 0 -1 0 -1 0by 0 0 -1 0 0 0 -1 by 0 0 -1 0 1 0 -1çmy -1 0 0 0 0 0 0 çmy -1 0 0 0 0 1 0
Example
Şehirdeki insan sayısı
Modernizasyon
Sağlık faaliyetleri
Çöp miktarı
yoğunluğu
Şehire göç
Hastalık sayısı
Bakteri yoğunluğu
–
–
–
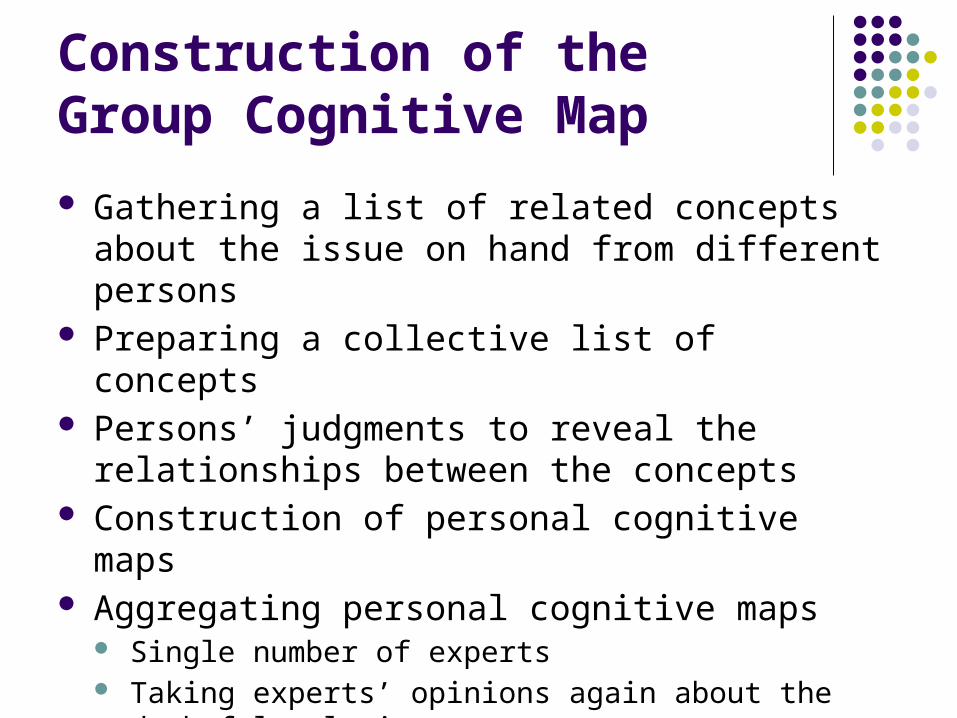
Construction of the Group Cognitive Map
Gathering a list of related concepts about the issue on hand from different persons
Preparing a collective list of concepts Persons’ judgments to reveal the relationships
between the concepts Construction of personal cognitive maps Aggregating personal cognitive maps
Single number of experts Taking experts’ opinions again about the doubtful relations
Size Over 100 nodes on the map
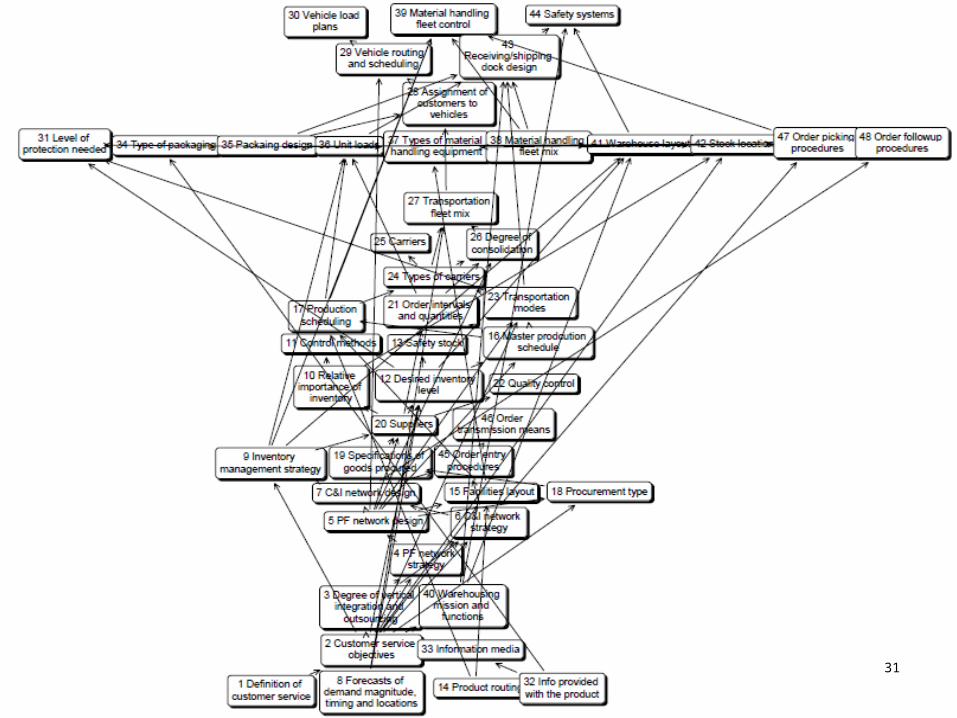
31
The most fundamental decisions are Definition of customer service (1) Forecasts of demand (8) Product routing (14) Information to be provided with the product (32)
The rest of the decisions cannot be taken unless these 4 decisions are given
Hierarchy of decisions
32
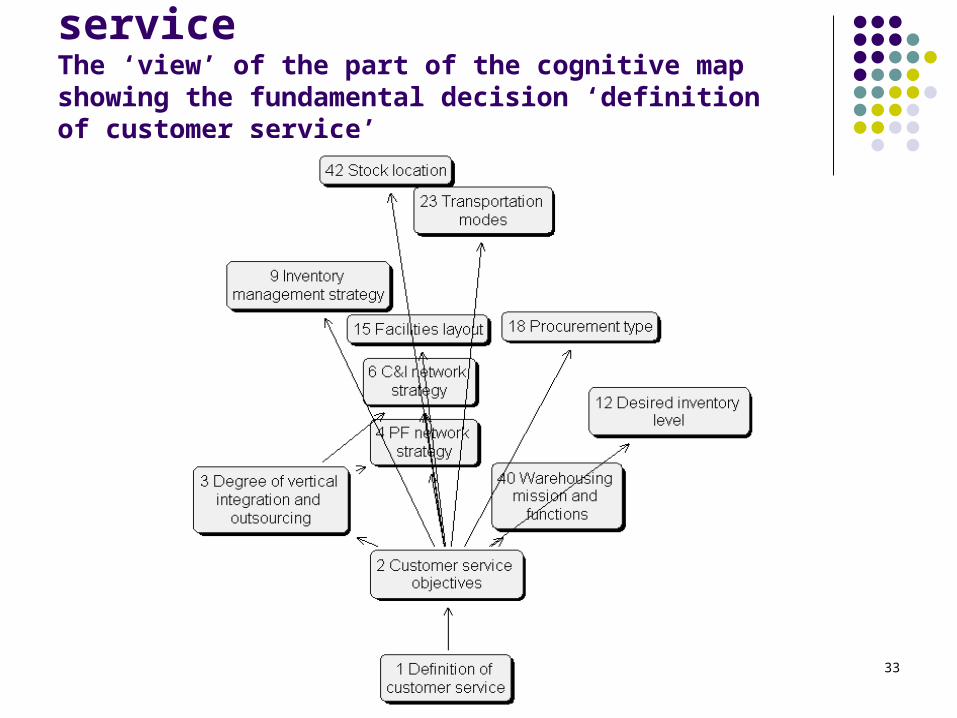
Definition of customer serviceThe ‘view’ of the part of the cognitive map showing the fundamental decision ‘definition of customer service’
33
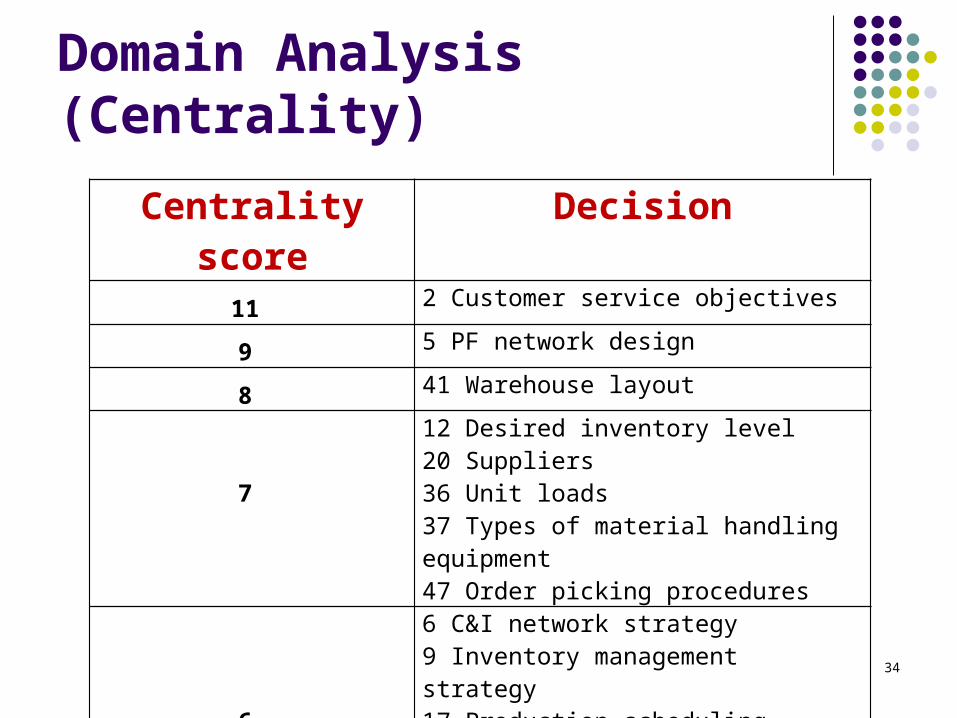
Domain Analysis (Centrality)
Centrality score Decision11 2 Customer service objectives
9 5 PF network design
8 41 Warehouse layout
7
12 Desired inventory level20 Suppliers36 Unit loads37 Types of material handling equipment47 Order picking procedures
6
6 C&I network strategy9 Inventory management strategy17 Production scheduling23 Transportation modes35 Packaing design43 Receiving/shipping dock design
34
Islands of themes
without accounting for hierarchy
Nodes in each cluster tightly linked
Bridges with other clusters minimized
Cluster Analysis
35
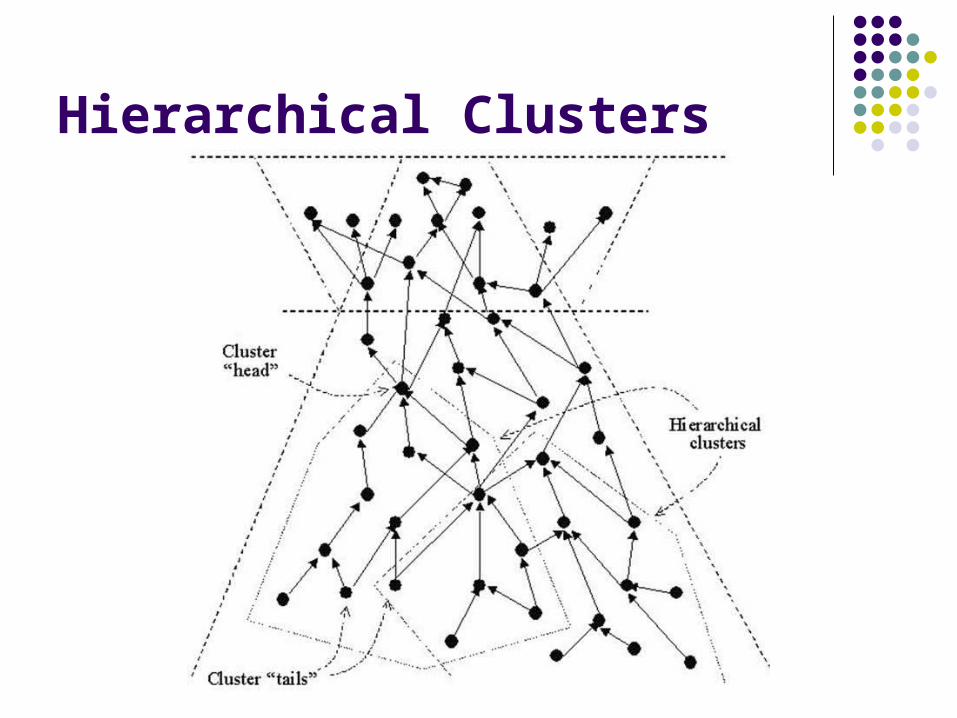
Hierarchical Clusters
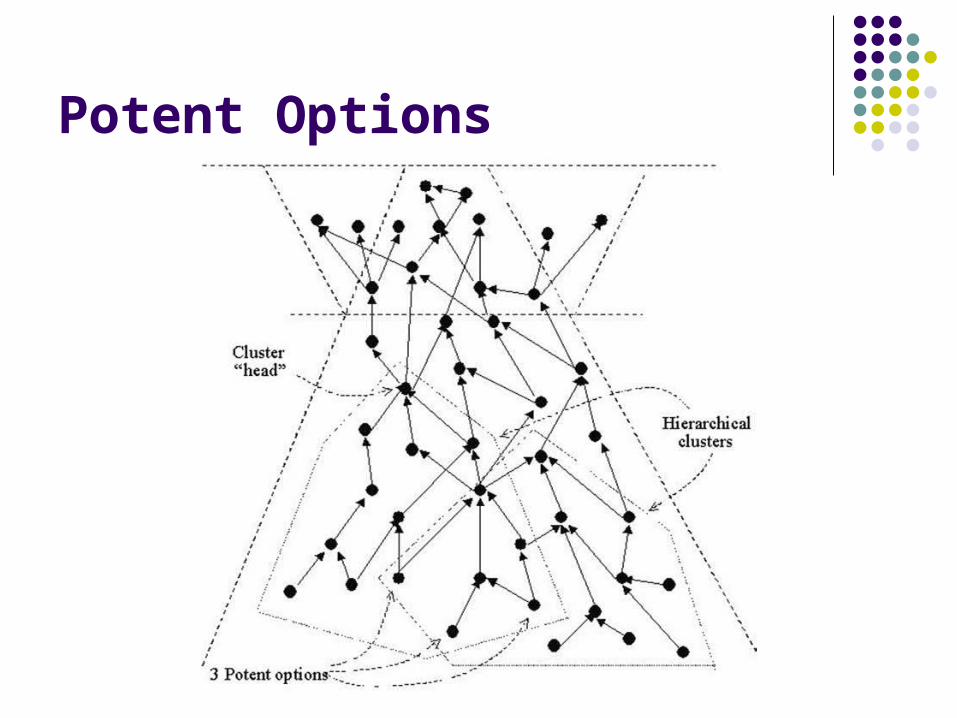
Potent Options
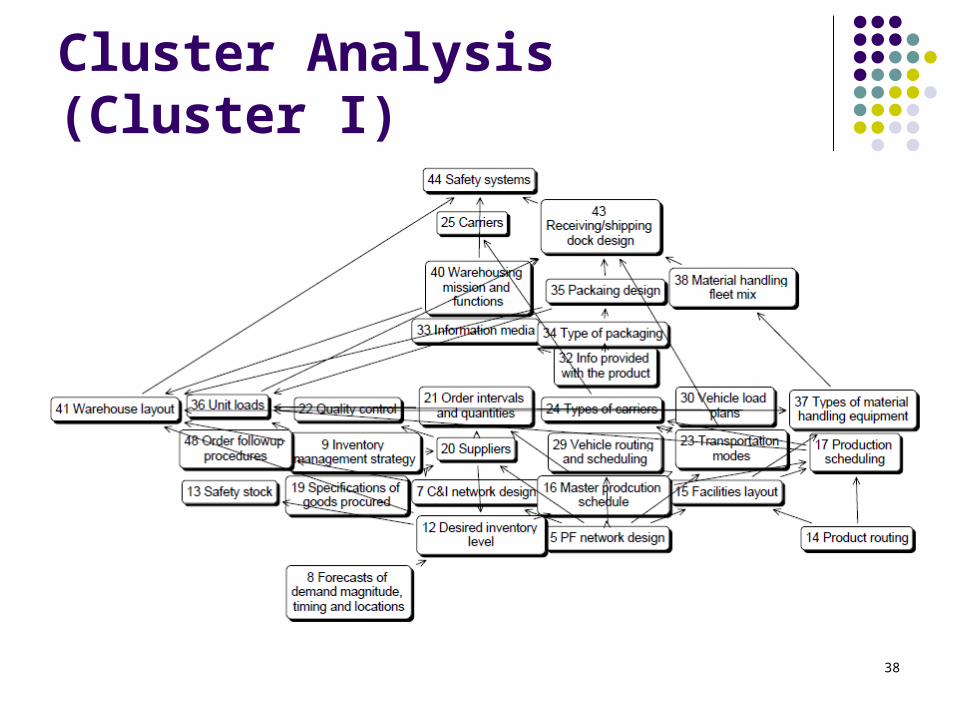
Cluster Analysis (Cluster I)
38
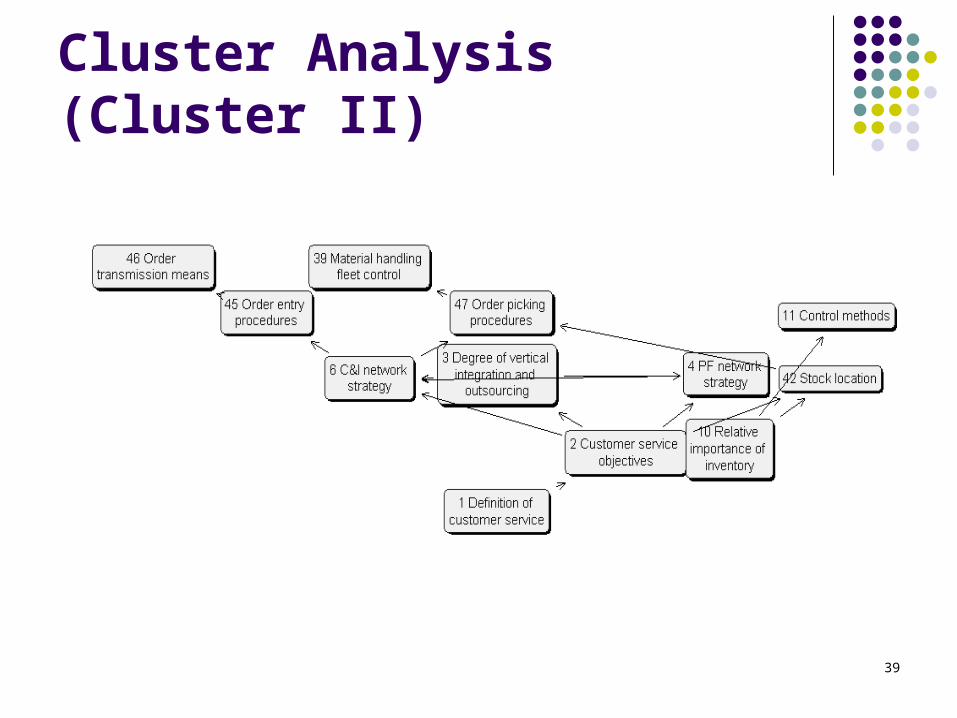
Cluster Analysis (Cluster II)
39