coherent coupling of molecular resonators with a micro ... · coherent coupling of molecular...
TRANSCRIPT
1
Coherent coupling of molecular resonators with a micro-cavity mode
A. Shalabney1, J. George
1, J. Hutchison
1, G. Pupillo
2, C. Genet
1* and T.W. Ebbesen
1*
1ISIS & icFRC, University of Strasbourg and CNRS (UMR 7006), 67000 Strasbourg, France
2IPCMS (UMR 7504) & ISIS (UMR 7006), University of Strasbourg and CNRS (UMR 7006), 67000 Strasbourg, France
Contact emails: [email protected] and [email protected]
The optical hybridization of the electronic states in strongly coupled molecule-cavity systems have
revealed unique properties such as lasing, room temperature polariton condensation, and the
modification of excited electronic landscapes involved in molecular isomerization. Here we show that
molecular vibrational modes of the electronic ground state can also be coherently coupled with a
micro-cavity mode at room temperature, given the low vibrational thermal occupation factors
associated with molecular vibrations, and the collective coupling of a large ensemble of molecules
immersed within the cavity mode volume. This enables the enhancement of the collective Rabi-
exchange rate with respect to the single oscillator coupling strength. The possibility of inducing large
shifts in the vibrational frequency of selected molecular bonds should have immediate consequences
for chemistry.
Intra-molecular vibrational motions can be described as a superposition of simple harmonic
vibrations, so called molecular normal modes. For each of these modes, the atoms vibrate in specific
directions that correspond to the observable vibrational transitions measured in infrared spectroscopy.
The relatively high frequencies of molecular vibrational transitions ωv, fixed by the bond strength f
(typically of the order of 103 N.m
-1) and the tiny atomic masses involved in the vibrations, immediately
lead to two important features.
First, it is possible to perform direct resonant dipolar coupling by engineering micro-scaled
cavities with a fundamental mode ωc tuned to the molecular vibrational transitions. Then, as a

2
consequence of their high frequencies in the infrared (IR) regime, vibrational resonances are
characterized by small thermal occupation factors ν
∼ eℏ∕ ∼ 10 , even at room temperature.
This means that such molecular normal modes are in their ground state allowing coherent light-matter
coupling in a straightforward manner.
In the following we demonstrate the coherent coupling between molecular vibrational
transitions and an optical mode of a micro-cavity, leading to the possibility to swap, at room
temperature, excitations coherently between the molecular oscillators and the optical mode. To do so,
we have exploited two crucial features offered by polymers. First, the possibility to have an isolated,
practically homogeneous, spectral signal associated to a specific vibrational molecular normal mode.
Second, the capacity offered through the bulky extension of the polymer film inserted in a Fabry-Perot
micro-cavity to have within a volume of strong optical confinement (i.e. the coherence volume of the
cavity mode) a large number of resonators. The colocalization of the optical and mechanical modes
induces a collective enhancement of the resonant coupling rate between the vibrational resonators and
the cavity mode reaching the regime of strong coherent coupling. In other words, a macroscopic
coherent mechanical mode is now generated by strong coupling.
Results
Hamiltonian description
Infrared spectra associated with gas-phase molecules usually display features where rotational
transitions are coupled to vibrational ones. The resulting well-known complexity of rovibrational
molecular spectra leads to spectral components separated by wave numbers less than 10 cm-1
. Still,
there are specific environments where molecules can display much simpler spectra from which it is
possible to select and manipulate chosen vibrational normal modes. Polymeric phases are in this context

3
particularly interesting to explore since free rotations of molecular moieties are frozen-out and the
excitation spectrum of the polymer is determined solely by electronic and vibrational contributions. One
should also consider low frequency vibrations of the polymer lattice itself. Yet, given the small wave
numbers for such lattice vibrations (less than ca. 100 cm-1
) compared to the vibrations of individual
bonds (ca. 1000 cm-1
), the two classes of motions can be clearly separated1. In this regime therefore,
vibrational spectra of polymers display normal mode transitions sufficiently isolated from the
background to be tuned properly to a given cavity resonance, as presented on Fig. 1.
Figure 1 | Polymer vibrational spectrum. a, Transmission spectrum of polyvinyl acetate (PVAc) thin
layer deposited on Ge substrate. The thickness of the film is about 2 microns and the measurement
was performed at normal incidence. The measured transmission is normalized to free-space
transmission. The black line fits the data modeling the polymer dispersion by ideal damped
harmonic oscillators (see Supplementary Note 2). The inset shows the absorption band of the PVAc
due to the (C=O) bond stretching band around 1740 cm-1
with the same fit (black line). b, Chemical
structure of a single PVAc monomer unit. c, Three dimensional structure of one PVAc monomer
showing the (C=O) bond.
1,000 2,000 3,000 4,000 5,000
25
50
75
1,500 1,750 2,000
25
50
75 C
OH
Wavenumber (cm-1)
Tran
smis
sion
%
a
C
b
c
C-O-Cantisymmetric
C-O-Csymmetric
CH3
C=O
4
This situation allows us to define the molecular Hamiltonian from a “double adiabatic
approximation” where a slow component (inter-molecular lattice vibrations) is separated from a fast
subsystem describing intra-molecular motions2. In our situation, the fast component of the whole
Hamiltonian is the only relevant one. We can then perform a second adiabatic (Born-Oppenheimer)
approximation in order to separate the vibrational and electronic degrees of freedom. This separation
leads to the definition of the vibrational dipole operator corresponding to the dependence on nuclear
coordinates Q of the expectation value of the dipole moment ⟨⟩ in the electronic state considered.
We emphasize that our coupling scheme only involves the fundamental electronic state. The low
vibrational occupancy number implies moreover that only the fundamental level of the vibrational
spectrum is populated. At such low excitations, the molecular vibrations occur within a mean electronic
potential that is well treated in the harmonic approximation. We are thus finally dealing with a
mechanical normal mode in its harmonic quantum ground state, which constitutes the engaging feature
of molecular vibrations in this context - see Fig. 2(b).
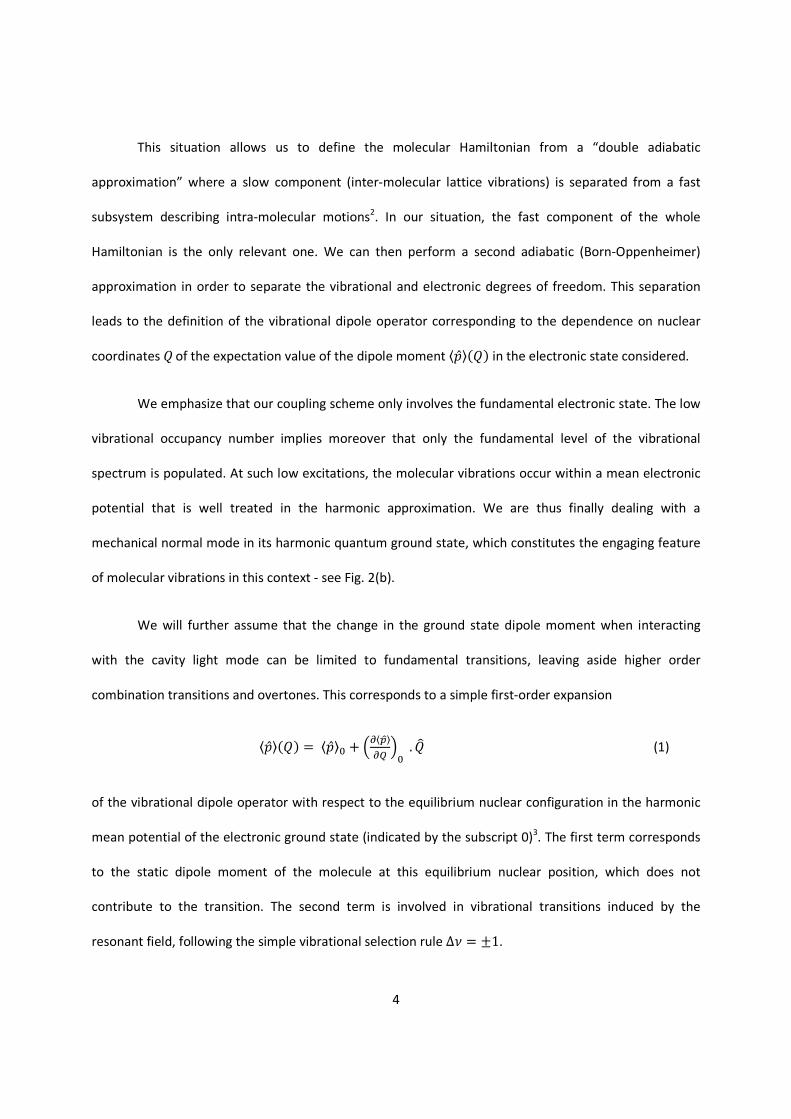
We will further assume that the change in the ground state dipole moment when interacting
with the cavity light mode can be limited to fundamental transitions, leaving aside higher order
combination transitions and overtones. This corresponds to a simple first-order expansion
⟨⟩ = ⟨⟩ + ⟨⟩ . ! (1)
of the vibrational dipole operator with respect to the equilibrium nuclear configuration in the harmonic
mean potential of the electronic ground state (indicated by the subscript 0)3. The first term corresponds
to the static dipole moment of the molecule at this equilibrium nuclear position, which does not
contribute to the transition. The second term is involved in vibrational transitions induced by the
resonant field, following the simple vibrational selection rule ∆# = ±1.
5
Under these assumptions, it is straightforward to treat in the dipole approximation the
conservative interaction between a single molecular vibrational (one-dimensional) mode and the field in
the cavity. This leads to the following Hamiltonian describing the coherent coupling regime:
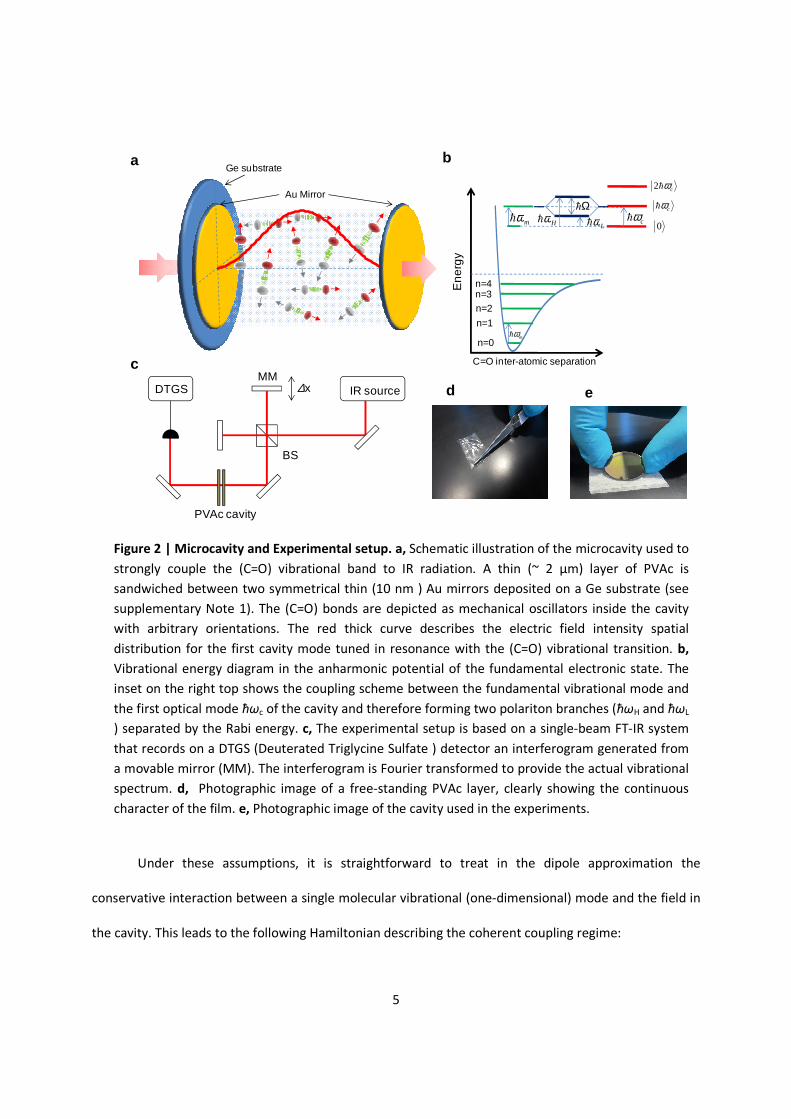
Figure 2 | Microcavity and Experimental setup. a, Schematic illustration of the microcavity used to
strongly couple the (C=O) vibrational band to IR radiation. A thin (~ 2 µm) layer of PVAc is
sandwiched between two symmetrical thin (10 nm ) Au mirrors deposited on a Ge substrate (see
supplementary Note 1). The (C=O) bonds are depicted as mechanical oscillators inside the cavity
with arbitrary orientations. The red thick curve describes the electric field intensity spatial
distribution for the first cavity mode tuned in resonance with the (C=O) vibrational transition. b,
Vibrational energy diagram in the anharmonic potential of the fundamental electronic state. The
inset on the right top shows the coupling scheme between the fundamental vibrational mode and
the first optical mode ћωc of the cavity and therefore forming two polariton branches (ћωH and ћωL
) separated by the Rabi energy. c, The experimental setup is based on a single-beam FT-IR system
that records on a DTGS (Deuterated Triglycine Sulfate ) detector an interferogram generated from
a movable mirror (MM). The interferogram is Fourier transformed to provide the actual vibrational
spectrum. d, Photographic image of a free-standing PVAc layer, clearly showing the continuous
character of the film. e, Photographic image of the cavity used in the experiments.
Au Mirror
Ge substratea
d eIR source∆xDTGS
PVAc cavity
BS
MMc
b
n=0
n=1
n=2n=3n=4
C=O inter-atomic separation
En
erg
y
mωh
cωhmωhLωhHωh
Ωh
0
cωh
cωh2

6
% = & ℏ'
ν(ν
) + *ν
)+ + & ℏ',(,) + *,)+ − ℏ.
ν,, (2)
where , = 01 + 123 corresponds to the optical position quadrature related to the photon 10123
annihilation (creation) operators associated with the cavity field at the position 4 of the molecular
vibration bond, and ν
= 05 + 523 corresponds to the vibrational position quadrature related to
phonon 50523 annihilation (creation) operators, as a consequence of the mean potential harmonic
approximation. While Eq. (2) is typical for cQED-physics, we emphasize that here the 6 quadrature
corresponds not to electronic oscillations, but to a (optically induced) motion of atoms within the
molecules.
In this approximation, the coupling strength reads
ℏ. = 7 ⟨⟩ 8 ℏ9
):;< =>?, (3)
where @is the cavity mode volume and =>? = Aℏ/2D'ν
the zero-point fluctuation amplitude of the
molecular oscillator, determined from the reduced mass μ involved in the bond vibration. We also
account for an orientation factor 7 = E6 ∙ E, between the field polarization E, and the transition dipole
polarization E6. Spectrally, the regime of coherent coupling is seen as an avoided crossing between the
two coupled modes at resonance. This splitting corresponds to the definition of two new normal modes
for the coupled system with frequencies shifted from the individual (uncoupled) modes and separated by
a vacuum Rabi energy equal to the coupling strength at resonance. This picture however neglects
mechanical damping and cavity decay. In reality, the condition to reach such a strong coupling regime for
a single oscillator is particularly stringent since ℏ. is well below 1 µeV for typical molecular vibrational
transitions in the vacuum field of a micro-cavity. Therefore, this cannot exceed radiative and non-
radiative damping rates of the system, including cavity losses. As well known however, the situation
becomes different when several resonators are coupled to the same cavity mode.
7
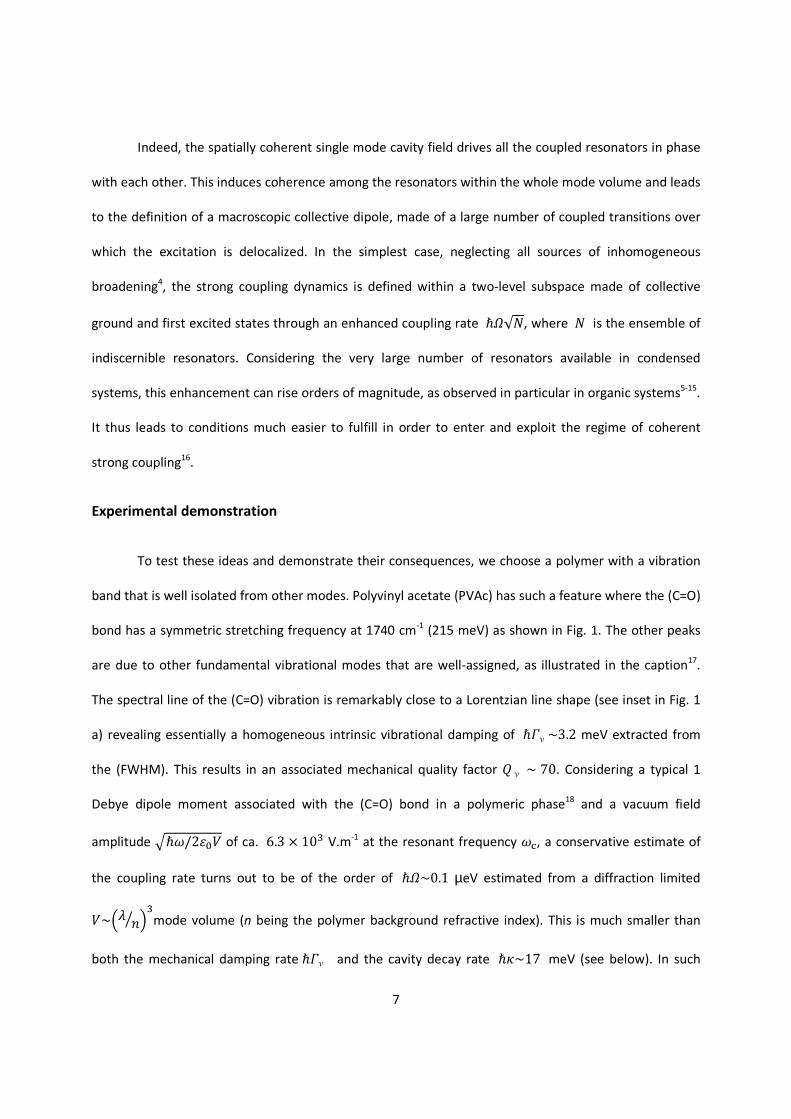
Indeed, the spatially coherent single mode cavity field drives all the coupled resonators in phase
with each other. This induces coherence among the resonators within the whole mode volume and leads
to the definition of a macroscopic collective dipole, made of a large number of coupled transitions over
which the excitation is delocalized. In the simplest case, neglecting all sources of inhomogeneous
broadening4, the strong coupling dynamics is defined within a two-level subspace made of collective
ground and first excited states through an enhanced coupling rate ℏ.√H, where H is the ensemble of
indiscernible resonators. Considering the very large number of resonators available in condensed
systems, this enhancement can rise orders of magnitude, as observed in particular in organic systems5-15
.
It thus leads to conditions much easier to fulfill in order to enter and exploit the regime of coherent
strong coupling16
.
Experimental demonstration
To test these ideas and demonstrate their consequences, we choose a polymer with a vibration
band that is well isolated from other modes. Polyvinyl acetate (PVAc) has such a feature where the (C=O)
bond has a symmetric stretching frequency at 1740 cm-1
(215 meV) as shown in Fig. 1. The other peaks
are due to other fundamental vibrational modes that are well-assigned, as illustrated in the caption17
.
The spectral line of the (C=O) vibration is remarkably close to a Lorentzian line shape (see inset in Fig. 1
a) revealing essentially a homogeneous intrinsic vibrational damping of ℏIν
~3.2 meV extracted from
the (FWHM). This results in an associated mechanical quality factor ν
∼ 70. Considering a typical 1
Debye dipole moment associated with the (C=O) bond in a polymeric phase18
and a vacuum field
amplitude Aℏ'/2M@ of ca. 6.3 × 10P V.m-1
at the resonant frequency ',, a conservative estimate of
the coupling rate turns out to be of the order of ℏ.~0.1 µeV estimated from a diffraction limited
@~Q R Pmode volume (n being the polymer background refractive index). This is much smaller than
both the mechanical damping rateℏIν
and the cavity decay rate ℏS~17 meV (see below). In such
8
conditions, it is thus impossible to strongly couple a single molecular vibration to the cavity vacuum field.
However the extremely high density ρ of (C=O) bonds in the polymer can in principle enable the
formation of a collective dipole within the cavity mode volume, as discussed above. With one (C=O) bond
per monomer, this density corresponds to approximately ρ = 1021
cm-3
(see Supplementary Note 4). This
should indeed make reaching the strong coupling regime possible.
To demonstrate this, a specific Fabry-Perot cavity was engineered to have a first mode in the mid
infrared (MIR) range resonant with the (C=O) vibrational transition (Fig. 1 a). This tuning requires a
careful choice of substrates and metals forming the mirrors but eventually allowed us to demonstrate
direct dipolar coupling between the cavity field and the molecular motion. The whole experimental
setup, together with the description of the best material compromise, is shown in Fig. 2. Fourier-
Transform Infra-red (FTIR) spectroscopy gives direct access to the spectral density of the transition
through a phase-modulated signal transmitted through the cavity+polymer ensemble (see
Supplementary Note 1). This interrogation mode allows the recording of angle-resolved spectral
coherent responses of the coupled system.
As shown in Fig. 3, a Rabi anti-crossing is demonstrated at normal incidence in the dispersion
relation of the cavity. The associated vacuum Rabi splitting ℏΩU ∼ 20.7 meV exceeds all decoherence
rates (evaluated above) and therefore corresponds to the regime of strong coupling. This leads to the
formation of two new opto-vibrational modes for the system, as illustrated in Fig. 4. These new modes
are the lower and upper polaritonic states and correspond to molecular vibrations dressed by the cavity
vacuum field. From the widths of the associated spectral peaks, it is possible to give an estimate of the
dephasing times of the dressed states which are 0.23 ps and 0.44 ps for the upper (UP) and lower (LP)
polariton states, respectively. The generation of new hybrid vibrational states was further confirmed
through the modification of the cavity fundamental modes as shown in Fig. 4. The obvious splitting in the

9
field's distribution due to the strong coupling immediately indicates that the integrated absorption of the
coupled system shows the same splitting as well, which is the unambiguous signature of the strong
coupling regime (see Supplementary Figure S1). In our experiments, the observed splittings are probed
at very low power and do not depend on it. This rules out any multi-photonic effects occurring in the
experiments and reveals that the probe does not induce any AC-Stark effect in the system19
. It thus
confirms that the observed energy splittings are due to vacuum Rabi splitting only.
Figure 3 | Cavity angular dispersion and strong coupling. a, Cascade plot of measured
transmission spectra through the Au-PVAc cavity as a function of the IR beam incidence angle.
The spectra are vertically shifted every 5 degrees and the angular range covers -60 ; +60 degrees
relatively to the cavity normal. At normal incidence (θ=0°), the avoided crossing is clearly
revealed as the signature of the strong coupling regime between the cavity mode and the (C=O)
stretching mode (which position in an uncoupled situation is indicated by the vertical line). b,
Color-plot of the cavity (Au-PVAc) dispersion calculated with parameters retrieved from the best
transmission data fit at normal incidence (see supplementary Note 2). White diamonds and
purple circles correspond respectively to the measured positions of the upper (UP) and lower (LP)
polaritons extracted from the data displayed in a. Dashed curve and dashed horizontal line show
respectively the dispersion of the empty cavity and (C=O) vibrational mode (see supplementary
Note 2). The dispersion of the empty cavity was calculated by deactivating vibrational
contributions and considering the background refractive index of the polymer. The crossing point
between the dashed curves at normal incidence corresponds to the careful tuning between the
first mode of the cavity with the (C=O) bond stretching mode. The Rabi splitting at the crossing
point at normal incidence reaches 20 meV.
1,500 1,700 1,900 2,100 2,300 2,5000
10
20
30
40
50
-60 -40 -20 0 20 40 60
200
220
240
260
280
300
0.5
1
1.5
2
2.5
Wavenumber (cm-1)
Tra
nsm
issi
on
%
Incidence angle (deg.)
Ene
rgy
(me
V)
a b
θ= -60°
θ =0°
θ=60°

10
The relatively high value for the Rabi splitting is the clear signature of the collective coupling with
ℏ.U = ℏ.√H , from which it is tempting to evaluate an effective number of resonators coupled within
the cavity mode volume. This is most easily given as an effective concentration ρC of coupled molecules.
With the same figures given above, this concentration can be estimated to be of the order of VW~4.4 ×10) cm
-3. This number turns out to be slightly smaller than the expected (C=O) bond density ρ(see
Supplementary Note 4). This discrepancy immediately points to the central fact that in the real situation,
the actual distribution of the (C=O) bonds within the cavity must be accounted for, including the spatial
overlap between the molecules and the cavity mode and the orientational distribution of the molecular
dipoles with respect to the cavity field. In such a “non-symmetrical” coupling, the initial rate Ω must be
replaced by an averaged one, necessarily leading to a reduced Rabi splitting ℏ⟨.U⟩ < ℏ.√H. As
discussed in20
, this can be understood as an effective coherence volume associated with a single
molecular resonator smaller than the cavity mode volume.
Discussion
Exploiting specific properties of polymers, we have been able to demonstrate for the first time
the regime of vibrational strong coupling. The microscopic nature of our individual resonators leads to a
practically perfect thermal decoupling of the molecular vibrations. Indeed, with ν
∙ 'ν
2π⁄ ≫ ]^_ ∕ℏ , thermal decoherence can be neglected over more than one vibrational period. Thus, essentially due
to the extremely tiny effective mass involved in the mechanical stretching mode of the (C=O) bond,
coherent coupling is achieved at room temperature. In addition, the high mechanical product
ν
∙ 'ν
2`⁄ holds promises in the context of transient spectroscopy. Indeed, while our discussion was
here limited to the electronic ground state and first vibrational transition, one can envision to actually
pump transiently the vibrational manifold. This might lead to inverted population dynamics in
connection with polariton vibrational lasing21
.
11
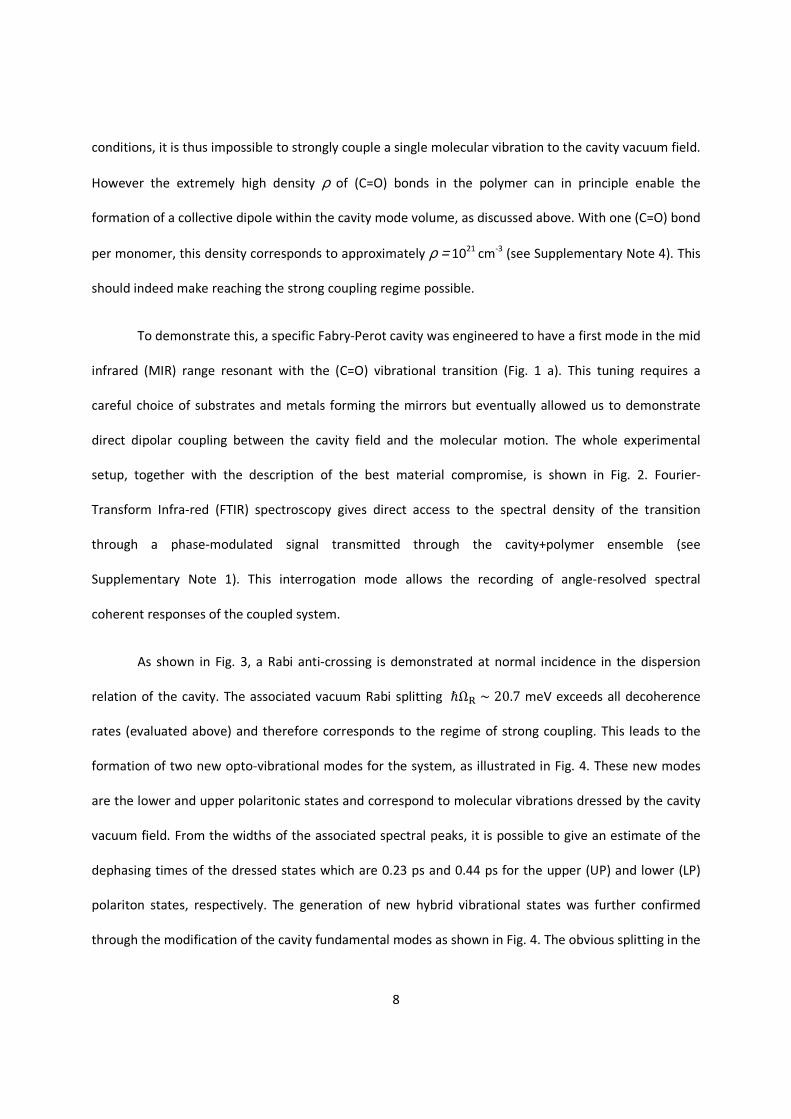
Figure 4 | Strong coupling and intra-cavity field distributions. a, Color-plot of the evolution of the
intensity distribution inside the cavity in wavenumber. The vertical axis (z) scaled in mm is
perpendicular to the cavity plane, with the first Au mirror at z=0. The thicknesses of both Au
mirrors are 10 nm and the PVAc layer thickness is 1930 nm, values that were retrieved from the
best fits. The intensity distribution is calculated in the situation of an uncoupled cavity where
vibrational transitions within the polymer are deactivated, leaving only the non-dispersive
background response of the polymer (see supplementary Note 2). The cavity polarizability is
assumed to be homogenous and isotropic and the incidence angle is taken equal to zero. Vertical
dashed line corresponds to the (C=O) vibration. b, Similar evaluation this time for the strongly
coupled cavity where all the vibrational bands of PVAc are considered. The redistribution of the field
into two new normal modes inside the cavity is clearly seen in the vicinity of the (C=O) vibrational
band. In both cases, the second cavity mode is seen at higher wavenumber (ca. 3500 cm-1
) and
characterized by two maxima across the cavity (λ-mode). The large differences between the first
and second mode intensities are due to the mirrors dispersion. c, Transmission spectrum of the
uncoupled cavity at normal incidence. d, Transmission spectrum of the coupled cavity at normal
incidence (solid black curve) and associated theoretical fit (red curve). Here, the PVAc polarizability
was retrieved from the measured transmission of the bare PVAc film (see Supplementary Note 2).
Dashed vertical line indicates the (C=O) vibrational band. The signature of the strong coupling
between the (C=O) band and the first cavity mode is clearly seen in such static transmission spectra
by the new normal modes. All fit procedures and field calculations are detailed in the
supplementary Notes 2 and 3 respectively.
1,000 1,500 2,000 2,500 3,000 3,500 4,000 4,5000
2
4
6
8
10
12
1,000 1,500 2,000 2,500 3,000 3,500 4,000 4,5000
2
4
6
8
10
12
1000 1500 2000 2500 3000 3500 4000 45000
0.5
1
1.5
2
1000 2000 3000 40000
0.5
1
1.5
2
0
0.2
0.4
0.6
0.8
1
1.2
1.4
1.6
1.8
Wavenumber (cm-1)Wavenumber (cm-1)
Tra
nsm
issi
on
%
Tra
nsm
issi
on
%
z(µ
m)
z(µ
m)
a b
c d
UPLP
00

12
Finally, because it involves dressed collective modes through the colocalization of the cavity field
and the vibrational modes, large coupling rates with ratios .U ∕ S close to 1 can be reached. This could
lead to non-linear behavior in the infrared regime similar to that recently demonstrated for polariton
Bose-Einstein condensation22,23
in the optical regime.
The strong coupling of vibrational modes demonstrated here could have profound consequences
for chemistry, as well as biochemistry. We have already shown that the rate and yield of a chemical
reaction can be modified by strongly coupling an electronic excited state to the vacuum field6. In that
case, the reaction involved a light induced isomerisation, a structural transformation of individual
photochromic molecules, electronically strongly coupled in the optical regime. However most chemistry
is done in the ground state and starts by bond breaking and formation. Therefore the modification of
bond strengths in the ground state by strong coupling to molecular vibrations could open many
possibilities in chemical reactivity, catalysis and site selective reactions. For instance, the optical
resonance could be selectively tuned to the vibration of a bond targeted for dissociation. A reduction of
the vibrational frequency through hybridization will most likely imply a weakening of the bond strength f
since µ/fω ∝ . The ground state energy landscape governing the chemistry may be significantly
modified. As an example of important chemical functional groups, the carbonyls (C=O), coupled in this
study, play a central role in amide bonding in peptides and as coordinating units in metalloenzymes, as
ligands in organometallic and coordination complexes, and as the active site in many industrial and
pharmaceutical syntheses. For instance the reaction between benzaldehyde with phenylhydrazine to
give a hydrazone, shown in Fig. 5, involves the breaking of the (C=O) bond and therefore its rate and
possibly yield could be modified by such bond weakening through strong coupling. Of course this
approach is not limited to the carbonyl stretch, any IR active mode of a molecular functional group could
be coupled to a light mode in the way shown here.

13
The possibility of modifying chemical reaction rates, as described above, seems plausible
based on several earlier experiments where bulk properties were modified by strong coupling, such as
the already cited photochemical reaction, work-function and the ground state energy 6,24,25
. However the
actual mechanism of how the strong coupling modifies the molecular material properties is still not clear
and it might be counter-intuitive that the collective coupling induced in such systems will affect the
properties of individual molecules. Further theory is indeed needed on such topic that can handle the
complexity of strongly coupled molecular systems in order to be able to fully understand the potential of
light-matter strong coupling for molecular science.
References
1. Bower, D. I. & Maddams, W. F. Vibrational Spectroscopy of Polymers. (Cambridge University Press,
Cambridge, 1992).
2. Voltz , R. Theory of molecular decay processes. Org. Mol. Photophysics 2, 217-302 (1975).
3. Barron, L. Molecular Light Scattering and Optical Activity. (2nd
Ed. Cambridge University Press,
Cambridge, 2004).
Figure 5 | chemical reaction involves C=O bond breaking. Benzaldehyde reacts with
Phenylhydrazine to give a Hydrazone demonstrating a chemical reaction in which C=O bond
breaking is involved.
NH
NH2
H
OHN
N

14
4. Houdré, R., Stanley, R. P. & Ilegems, M. Vacuum-field Rabi splitting in the presence of inhomogeneous
broadening: Resolution of a homogeneous linewidth in an inhomogeneously broadened system. Phys.
Rev. A 53, 2711-2715 (1996).
5. Agranovich, V. M., Gartstein, Y. N. & Litinskaya, M. Hybrid Resonant Organic_Inorganic
Nanostructures for Optoelectronic Applications. Chem. Rev. 111, 5179-5214 (2011).
6. Hutchison, J. A., Schwartz, T., Genet, C., Devaux, E., Ebbesen, T. W. Modifying Chemical Landscapes
by Coupling to Vacuum Fields. Angew. Chem. 51, 1592-1596 (2012).
7. Pockrand, I., Brillante, A. & Möbius, D. Exciton–Surface Plasmon Coupling: An Experimental
Investigation. J. Phys. Chem. 77, 6289-6295 (1982).
8. Lidzey, D. G. et al. Strong exciton–photon coupling in an organic semiconductor microcavity. Nature
395, 53-55 (1998).
9. Schwartz, T., Hutchison, J. A., Genet, C., Ebbesen, T. W. Reversible switching of ultrastrong light-
molecule coupling. Phys. Rev. Lett. 106, 196405-196408 (2011).
10. Aberra Guebrou, S. et al. Coherent emission from a disordered organic semiconductor induced by
strong coupling to surface plasmons. Phys. Rev. Lett. 108, 066401 (2012).
11. Wang, S. et al. Quantum yield of polariton emission from hybrid light-matter states. J. Phys. Chem.
Letters 5, 1433-1439 (2014).
12. Wang, S. et al. Phase transition of a perovskite strongly coupled to the vacuum field. Nanoscale 6,
7243-7248 (2014).
13. Berrier, A. et al. Active control of the strong coupling regime between porphyrin excitons and surface
plasmon polaritons. ACS Nano 5, 6226-6232 (2010).
14. Hakala, T. K. et al. Vacuum Rabi splitting and strong-coupling dynamics for surface plasmon
polaritons and rhodamine 6G molecules. Phys. Rev. Lett. 103, 053602 (2009)
15. Vasa, P. et al. Real-time observation of ultrafast Rabi oscillations between excitons and plasmons in metal
nanostructures with J-aggregates. Nature Photon. 7, 128-132 (2013).
16. Kaluzny, Y., Goy, P., Gross, M., Raimond, J. M. & Haroche, S. Observation of Self-Induced Rabi Oscillations in Two-Level Atoms Excited Inside a Resonant Cavity: The Ringing Regime of Superradiance. Phys. Rev. Lett. 51, 1175-1178 (1983).
17. Terui, Y. & Hirokawa, K. Fourier transform infrared emission spectra of poly(vinyl acetate) enhanced
by the island structure of gold. Vib. Spec. 6, 309-314 (1994).
15
18. Koenig , J. Spectroscopy of Polymers. (2nd
ed. Elsevier Science Inc., New-York, 1999).
19. Schwartz, T.et al. Polariton Dynamics under Strong Light-Molecule Coupling. Chem. Phys. Chem. 14,
125-131 (2013).
20. Haroche, S. Fundamental Systems in Quantum Optics. Proceedings of the Les Houches Summer
School. (Les Houches, session LIII, Elsevier Science Publishers, Amsterdam, 1992).
21. Kéna-Cohen, S. and Forrest S. R. Room-temperature polariton lasing in an organic single-crystal microcavity. Nature Photon. 4, 371-375 (2010).
22. Plumhof, J. D., Stöferle, T., Mai, L., Scherf, U., & Mahrt, R. F. Room-temperature Bose-Einstein
condensation of cavity exciton-polaritons in a polymer. Nature Mat. 13, 247-252 (2014).
23. Daskalakis, K. S., Maier, S. A., Murray, R., & Kéna-Cohen, S. Nonlinear interactions in an organic
polariton condensate. Nature Mat. 13, 271-278 (2014).
24. Hutchison, J. A., et al., Tuning the Work-Function Via Strong Coupling, Adv. Mat. 25, 2481-2485
(2013).
25. Canaguier-Durand, A. et al. Thermodynamics of Molecules Strongly Coupled to the Vacuum Field. Angew. Chem. Int. Ed. 125, 10727-10730 (2013).
Acknowledgments
The authors thank C. Genes, P.S. Julienne and J. Moran for discussions and acknowledge support from
the ERC (Grants 227557 and 307688), the International Center for Frontier Research in Chemistry (icFRC,
Strasbourg), the ANR Equipex “Union” (ANR-10-EQPX-52-01) and the Labex NIE projects (ANR-11-LABX-
0058_NIE) within the Investissement d’Avenir program ANR-10-IDEX-0002-02, and EOARD.
Authors contribution
All authors contributed to all aspects of this work.

16
Supplementary information
Supplementary Note 1
Supplementary Figure S1| Transmission, absorption, and reflection of the un-coupled and coupled cavity.
a, Transmission (red solid line), absorption (green dashed line), and reflection (blue dashed dotted line) of
the uncoupled cavity using the best fit parameters from the measured transmission spectrum. b,
Transmission (red solid line) with the measured spectrum (black solid line), absorption (green dashed line),
and reflection (blue dashed dotted line) of the coupled cavity.
1000 1500 2000 2500 3000 3500 4000 4500
0
5
10
124 186 248 310 372 434 496 558
0
30
60
90
Energy (meV)
Tran
smis
sion
%
Abs
orpt
ion\
Ref
lect
ance
%R
T
A
a
1000 1500 2000 2500 3000 3500 4000 4500
0
6
12
124 186 248 310 372 434 496 558
0
30
60
90
Wavenumber (cm-1)
Tran
smis
sion
%
Abs
orpt
ion\
Ref
lect
ance
%
R
T
A
b
,,,,,,,,

17
Cavity preparation and dispersion measurements
An approximately 10 nm- thick Au mirror was sputtered on a clean Ge substrate. Then, a polymer (Poly
Vinyl Acetate or PVAc) film was deposited by spin-casting (4230 rpm) to form a layer of about 2 microns
thickness tuned to overlap the first cavity mode with the (C=O) bond stretching band of PVAc at 1740 cm-
1.
PVAc (MW: 140000) was dissolved in Toluene (15 wt. %) and mechanically steered at 100 °C for 40
hours, cooled to room temperature and passed thru a 0.22 μm Nylon filter prior to spin-casting. Finally,
the cavity was formed by sputtering a second Au layer (10 nm) directly on top of the polymer. The
thickness of the Au mirrors was optimized to obtain sufficient intensity in the transmission spectra in the
required spectral region. Due to the significant increase of both the real and imaginary parts of the
dielectric constant of Au in the infra-red (IR) region, a compromise was necessary between the cavity
quality factor and the transmission mode intensity.
To measure the net polymer absorption without the cavity, another sample of the same thickness was
prepared by spin-casting the PVAc solution directly on top of a clean Ge substrate.
The spectra of the cavity were acquired by standard FTIR (Fourier transform infra-red) spectrometer
(Nicolet 6700) in transmission mode (description of the measurement set-up is given in Fig. 2c in the
main text). Prior to every measurement, a background was acquired in order to normalize the actual
measurement and avoid baseline instability. All the measurements were performed with a resolution of
1 cm-1
and averaged over 128 scans to enhance the signal to noise (SNR) in the spectral range 400-7400
cm-1
.
The dispersion of the two hybrid states of the coupled system was measured by varying the incidence
angle in the range from -60° to +60° (as shown in Fig. 3 in the main text). The position of the bare cavity
mode was tuned by varying the in-plane wave vector kx with the incidence angle (

18
)cos2/(10 4indk θ= ) whereas k is the first cavity mode wave-vector in cm
-1, n the background
polymer refractive index, d the cavity thickness, and iθ the incidence angle.
Supplementary Note 2
Theoretical fit of the transmission spectra
In order to simulate the optical response of the polymer in the IR region, the Lorenz model was used to
describe the molecular polarizability. Since the absorption of the uncoupled polymer was obtained from
the transmission of a bare polymer thin film on Ge substrate, an interference pattern was observed with
values higher than 100% (negative absorbance values). This interference effect is observed when the
measurement is normalized to the substrate transmission. In order to estimate the real absorption of the
bare film, the Lorenz model with multiple resonances in the relevant spectral range was assumed as
follows1:
∑= Γ+−
−=N
j jj
jB ikkk
fk
120
2)( εε (1)
Here, ,Bε ,, 0 jj kf and jΓ are respectively the background dielectric contribution, oscillator
strength, resonance wave vector, and the phenomenological damping constant of vibrational band j. The
absorption intensity of the band is determined by both jf and jΓ whereas the FWHM is solely
governed by jΓ . In our fit procedure, all these parameters together with the thin film thickness were
varied to obtain the best fit with the experimental measurements. The best fit parameters for the (C=O)
19
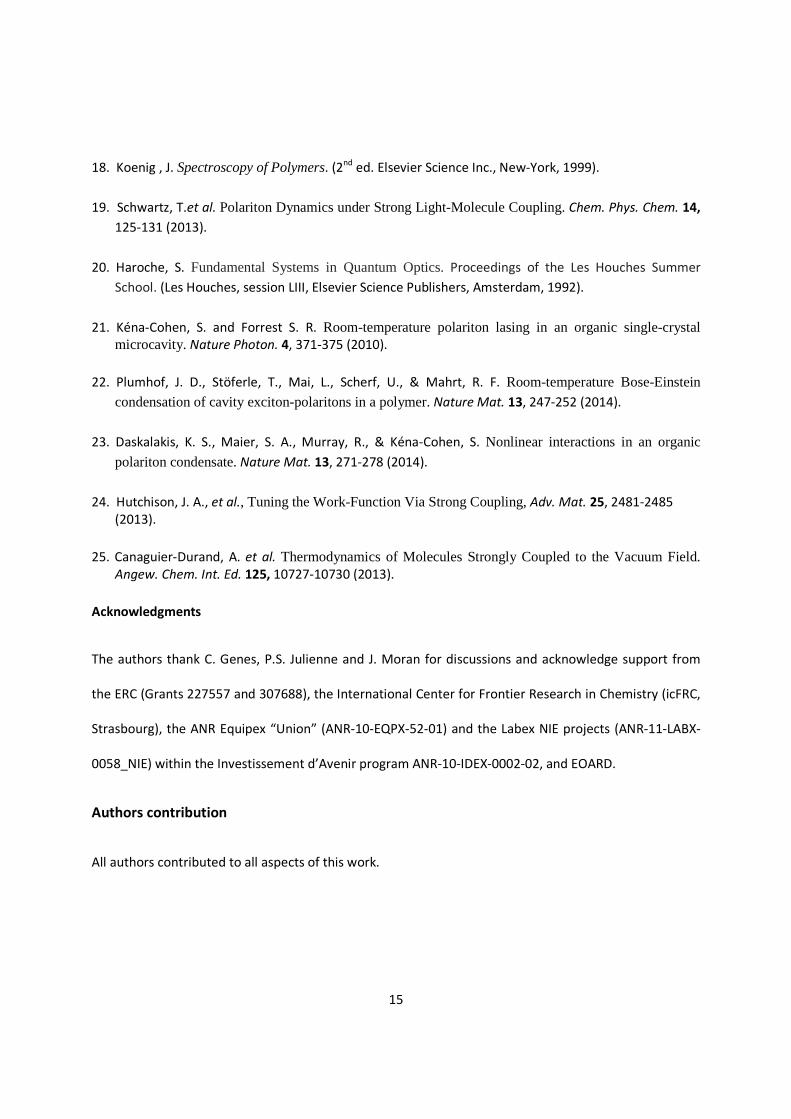
bond absorption band were 110
3 13,1739,1050 −− =Γ=×= cmcmkf jjj and the background refractive
index (RI) is 41.1== BBn ε .
The dispersion of the Au mirrors, on the other hand, was modeled by the Lorenz-Drude equation (2). In
this model, the contributions of the intra-band and the inter-band transitions are explicitly separated as
can be seen in Eq. (2)2:
∑
=−−
−−
Γ+−=
Γ−−=
+=K
j jj
pjelectronsbound
pelectronsfree
electronsboundelectronsfreem
i
f
i
f
122
2
0
20
)(;
)(1
ωωωω
εωω
ωε
εεε
(2)
In the last two terms, pω is the plasma frequency, K is the number of oscillators involved, each with
frequency jω , strength jf and life time jΓ/1 .
Since the thickness of the Au mirrors used in our study is very small, the dielectric constant becomes size
dependent. For noble metals, this applies to structures smaller than the conduction electron mean-free
path which is roughly 20 nm or less in the smallest dimensions3. The most significant influence of the
size-dependence on the dielectric function is broadening of the plasmon width due to electron scattering
at the boundaries. In order to describe this effect, it is convenient to consider the same Lorenz-Drude
model as in Eq. (2) with the introduction of additional damping term SΓ to the normal damping 0Γ
which is proportional to L/Fν where Fv and L are the Fermi velocity and the mirror thickness
respectively. Within our theoretical procedure, this additional term was varied to improve the fit with
the experimental measurements. The parameters of Au were adopted from Rakic et al. (see Table 1)2.
The overall damping term Stot Γ+Γ=Γ 0 which gave the best fit with the experimental results was found
to be 05.2 Γ .

20
Table 1 Gold dielectric constant parameters according to Eq. 2, all the parameters are given in eV units.
pω 0f
0Γ*
1f 1Γ 1ω 2f 2Γ 2ω 3f
3Γ 3ω
4f 4Γ 4ω 5f
5Γ 5ω
9.03 0.76 0.05 0.02 0.24 0.41 0.01 0.34 0.83 0.07 0.870 2.96 0.60 2.49 4.30 4.38 2.21 13.32
* The total damping term was considered as 0.125 in the simulations.
The transmission of the entire cavity was calculated using the standard 2x2 propagation matrices for a
multilayer system embedded between two semi-infinite dielectric, isotropic, and homogenous media4.
Correction for the transmission from the rear Ge/air interface was performed using the transmission
spectrum of the bare Ge substrate.
After retrieving the optimal parameters of the cavity, the dispersion for the empty cavity was estimated
by eliminating the absorption band's contributions from the dielectric constant. The splitting in reflection
and absorption are compared to the transmission measurements as shown in Fig. S1. The observed
values of transmission as well as the spectral shapes are in excellent agreement with the theoretical
calculations. However, from the reflection and absorption spectra, one can see that the splitting is
dependent on the measurement type as was confirmed in our previous works5. The observed splitting in
transmission )( TΩ is 167 cm-1
(20.7 meV), whereas the splitting in absorption )( AΩ and reflection )( RΩ
were slightly smaller (162 cm-1
and 161 cm-1
respectively). The ratio )/( AT ΩΩ is very close to unity
which is an indication of high coupling strength5.
In the measured spectra, one can note some asymmetries between the LP and UP spectra at normal
incidence (Fig. 3a in the main text). The small spectral asymmetry of the two hybrid states with respect
to the vibrational band frequency is mainly caused by the background effect of the polymer. We
assumed for the uncoupled cavity that the background polarizability is frequency independent. In fact,
the non-uniform free spectral range (FSR), measured for higher modes of control cavities made on glass
substrates, showed that the background slightly disperses through the spectral range. The intensities and
21
shapes of the polariton profiles, on the other hand, are mainly affected by the dispersion of the metallic
mirrors as well as the vibrational band profile. From the excellent fit of the measured spectra (Fig. 4d),
we can ascertain the difference in polariton peak intensities to the dispersive response of the metal.
Finally, added to the dispersion of the metal, the original asymmetry in the (C=O) bond vibrational mode
explains the differences in the shapes of the two polariton spectral signatures.
Supplementary Note 3
Field distribution
The electromagnetic field intensity calculations were based on a general algorithm considering the well
known 4x4 propagation matrices in stratified media. In our case, the layers constituting the cavity,
namely the two thin Au mirrors and the polymer layer were assumed to be isotropic and homogeneous
and the incident field to be arbitrary polarized. In all the calculations, the experimental beam divergence
and the approximately Gaussian beam shape of the FTIR were taken into account.
Supplementary Note 4
Estimation to the number of (C=O) bonds inside the cavity volume
The (C=O) density in the cavity can be calculated by dividing the PVAc density (1.18 g/cm3) by the PVAc
monomer weight (86.09 g/mole) and multiplying by Avogadro’s number, yielding 8.25x10²¹
(C=O) per
cm3. This implies that in the mode volume of the cavity (ca. 10
-4 cm
3) there are about 8.25x10
17 (C=0)
bonds.

22
Supplementary References
1. Oughstun, K. E. & Cartwright, N. A. On the Lorentz-Lorenz formula and the Lorenz model of dielectric
dispersion. Opt. Express 11, 13, 1541-1546 (2003).
2. Rakic, A. D. , Djurišic, A. B. , Elazar, J. M. & Majewski, M. L. Optical properties of metallic films for
vertical-cavity optoelectronic devices. Appl. Opt. 37, 22, 5271-5283 (1998).
3. Kreibig, U. Electronic properties of small silver particles: the optical constants and their temperature
dependence. J. Phys. F: Metal Phys. 4, 999-1014 (1998).
3. Born, M. & Wolf, E. Principles of Optics: Electromagnetic Theory of Propagation, Interference and
Diffraction of Light. (7th Ed., Cambridge press, 1999)
5. Schwartz, T., Hutchison, J. A., Genet, C. & Ebbesen, T. W. Reversible switching of ultrastrong light-
molecule coupling. Phys. Rev. Lett. 106, 196405-196408 (2011).