coi disclosure i have no conflict of interest to disclose i have no conflict of interest to disclose
TRANSCRIPT
COI DisclosureCOI Disclosure
• I have no conflict of interest to discloseI have no conflict of interest to disclose

Calcium is Strongly Correlated Calcium is Strongly Correlated with Necrotic Core in Human with Necrotic Core in Human
Coronary Arteries: Insights from Coronary Arteries: Insights from the Multicenter VH-IVUS Registrythe Multicenter VH-IVUS Registry Eduardo Missel, Gary S. Mintz, Stephane G. Carlier, Eduardo Missel, Gary S. Mintz, Stephane G. Carlier, Koichi Sano, Joanna Lui, Roxana Mehran, Jeffrey Koichi Sano, Joanna Lui, Roxana Mehran, Jeffrey
Moses, Gregg W. Stone, and Martin B. LeonMoses, Gregg W. Stone, and Martin B. Leon
Cardiovascular Research Foundation Cardiovascular Research Foundation Columbia University Medical Center Columbia University Medical Center
New York – NY - USANew York – NY - USA
European Society of Cardiology Congress 2007European Society of Cardiology Congress 2007Vienna - AustriaVienna - Austria

I - BackgroundI - Background
• Unstable and/or ruptured plaques: Unstable and/or ruptured plaques: - Larger necrotic core content - Larger necrotic core content (Histopathology)(Histopathology)- Less quantitative calcium with a - Less quantitative calcium with a “spotty” pattern (IVUS) when compared to “spotty” pattern (IVUS) when compared to stable/non-ruptured plaques, stable/non-ruptured plaques,
HOWEVER…HOWEVER…• Calcification in the coronary tree is a Calcification in the coronary tree is a
predictor of coronary events (EBCT)predictor of coronary events (EBCT)
The “coronary calcification paradox” The “coronary calcification paradox”

II- MethodsII- Methods
• Allows spectral analysis of Allows spectral analysis of radiofrequency (RF) radiofrequency (RF) ultrasound backscatter; ultrasound backscatter;
• 80-92% 80-92% ex-vivo ex-vivo and 87-and 87-92% 92% in vivoin vivo accuracy for accuracy for characterization of basic characterization of basic plaque componentsplaque components
Virtual HistologyVirtual Histology
Fibrous tissue (FI) Fibrous tissue (FI) Fibro-fatty (FF)Fibro-fatty (FF)Dense calcium (DC)Dense calcium (DC)Necrotic core (NC)Necrotic core (NC)
II - MethodsII - Methods
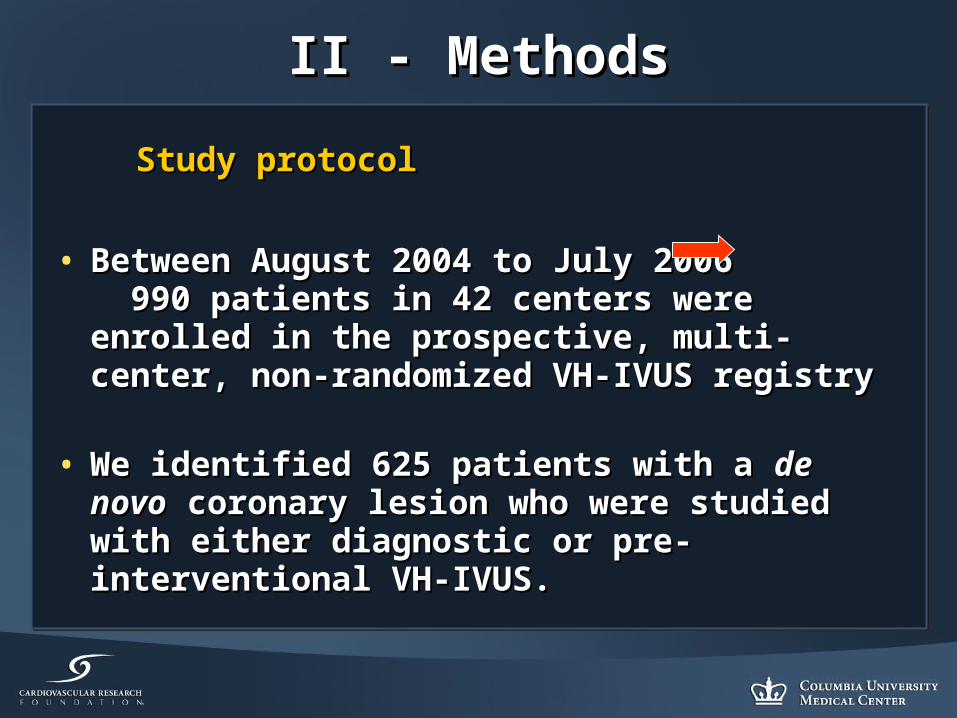
Study protocolStudy protocol
• Between August 2004 to July 2006 990 Between August 2004 to July 2006 990 patients in 42 centers were enrolled in the patients in 42 centers were enrolled in the prospective, multi-center, non-randomized VH-prospective, multi-center, non-randomized VH-IVUS registryIVUS registry
• We identified 625 patients with a We identified 625 patients with a de novode novo coronary lesion who were studied with either coronary lesion who were studied with either diagnostic or pre-interventional VH-IVUS. diagnostic or pre-interventional VH-IVUS.

II - MethodsII - Methods
VH-IVUS imaging protocolVH-IVUS imaging protocol
• A phased-array, 20MHz, 3.2Fr IVUS catheter A phased-array, 20MHz, 3.2Fr IVUS catheter was placed at a branch distal to the lesion was placed at a branch distal to the lesion
• A motorized pull-back through the diseased A motorized pull-back through the diseased segment was performed at 0.5mm/s to a point segment was performed at 0.5mm/s to a point proximal to the lesion siteproximal to the lesion site
• Grey-scale IVUS was recorded, raw RF data Grey-scale IVUS was recorded, raw RF data was captured at the top of the R wave, and a was captured at the top of the R wave, and a color-coded VH-IVUS map was generatedcolor-coded VH-IVUS map was generated

II - MethodsII - Methods
Data AnalysisData Analysis
• Off-line volumetric reconstruction of the four Off-line volumetric reconstruction of the four tissue types along the whole diseased segment tissue types along the whole diseased segment was performed using pcVH 2.1 software was performed using pcVH 2.1 software
• The four VH-IVUS plaque components were The four VH-IVUS plaque components were measured in every recorded frame, and measured in every recorded frame, and expressed asexpressed as- Mean analysis segment CSA (mm2)- Mean analysis segment CSA (mm2)- Absolute volume (mm3)- Absolute volume (mm3)- Percentages of total plaque volume (%)- Percentages of total plaque volume (%)
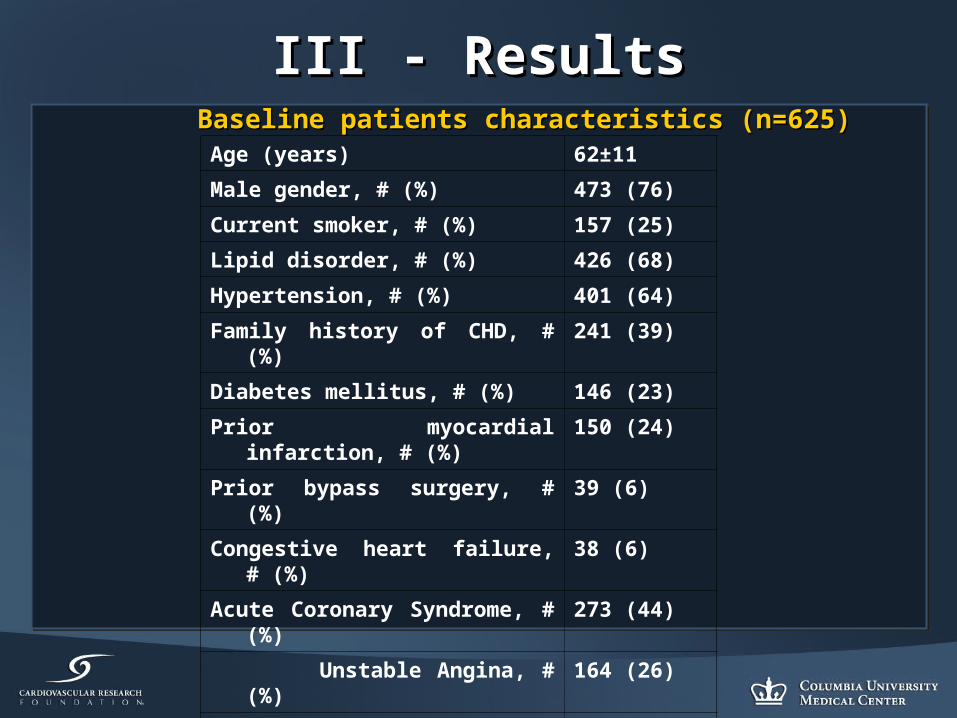
III - ResultsIII - ResultsBaseline patients characteristics (n=625)Baseline patients characteristics (n=625)
Age (years) 62±11
Male gender, # (%) 473 (76)
Current smoker, # (%) 157 (25)
Lipid disorder, # (%) 426 (68)
Hypertension, # (%) 401 (64)
Family history of CHD, # (%) 241 (39)
Diabetes mellitus, # (%) 146 (23)
Prior myocardial infarction, # (%) 150 (24)
Prior bypass surgery, # (%) 39 (6)
Congestive heart failure, # (%) 38 (6)
Acute Coronary Syndrome, # (%) 273 (44)
Unstable Angina, # (%) 164 (26)
Non-Q-wave MI, # (%) 62 (10)
Acute MI, # (%) 48 (8)

III - ResultsIII - Results
Target VesselTarget Vessel
28, 4%
179, 29%
302, 49%
109, 17%
7, 1%LM
RCA
LAD
LCX
Other
III - ResultsIII - Results
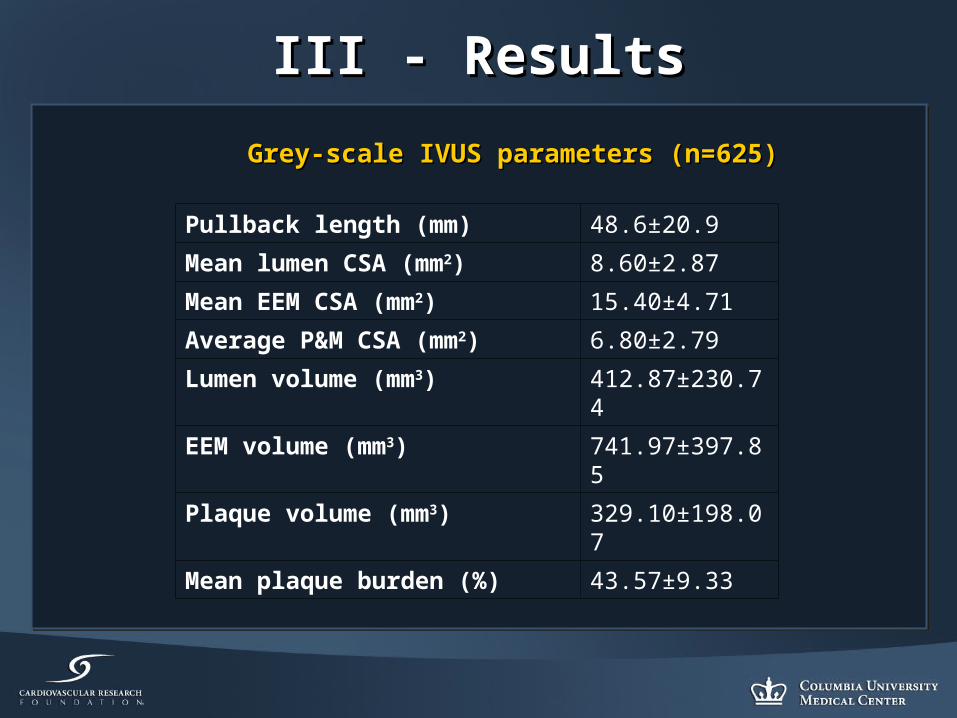
Grey-scale IVUS parameters (n=625)Grey-scale IVUS parameters (n=625)
Pullback length (mm) 48.6±20.9
Mean lumen CSA (mm2) 8.60±2.87
Mean EEM CSA (mm2) 15.40±4.71
Average P&M CSA (mm2) 6.80±2.79
Lumen volume (mm3) 412.87±230.74
EEM volume (mm3) 741.97±397.85
Plaque volume (mm3) 329.10±198.07
Mean plaque burden (%) 43.57±9.33

III - ResultsIII - ResultsVH-IVUS parameters (n=625)VH-IVUS parameters (n=625)
Mean fibrous plaque CSA (mm2) 2.16±1.45
Mean fibro-fatty plaque CSA (mm2) 0.73±0.62
Mean necrotic core CSA (mm2) 0.43±0.41
Mean dense calcium CSA (mm2) 0.29±0.34
Fibrous plaque volume (mm3) 104.99±87.75
Fibro-fatty plaque volume (mm3) 34.79±33.18
Necrotic core volume (mm3) 20.42±20.03
Dense calcium volume (mm3) 13.86±17.65
% Fibrous volume 28.81±9.68
% Fibro-fatty volume 9.59±5.54
% Necrotic core volume 5.74±3.78
% Calcified volume 3.83±3.49

III - ResultsIII - Results Relationship between NC and DC (n=625)Relationship between NC and DC (n=625)
r=0.81
r2=0.68
P<0.0001
-20
0
20
40
60
80
100
120
140
160
Nec
rotic
Cor
e V
olum
e (m
m3)
-20 0 20 40 60 80 100 120 140 160 180 200Calcif ied Volume (mm3)
Y = 7.441 + .936 * X; R^2 = .681
Regression Plot

III - ResultsIII - Results
Lipid Profile Parameters NC/DC ratio p
Median IQR
Male Gender Yes 1.79 [1.24-2.68] 0.04
No 1.60 [1.11-2.34]
Diabetes Yes 1.63 [1.22-2.68] 0.08
No 1.58 [1.14-2.25]
Smoking Yes 1.96 [1.29-2.88] 0.007
No 1.65 [1.19-2.44]
Hypertension Yes 1.86 [1.35-2.53] 0.06
No 1.65 [1.16-2.66]
Family history of CHD
Yes 1.82 [1.22-2.63] 0.51
No 1.70 [1.23-2.52]
NC/DC ratio and risk factors (n=625)NC/DC ratio and risk factors (n=625)

III - ResultsIII - Results
Lipid Profile Parameters NC/DC ratio p
Median IQR
Total Cholesterol >200mg/dl 1.83 [1.29-2.91] 0.08
≤200mg/dl 1.68 [1.16-2.57]
LDL-C ≥100mg/dl 1.79 [1.26-2.93] 0.003
<100mg/dl 1.58 [1.11-2.29]
HDL-C <50mg/dl 1.78 [1.24-2.68] 0.22
≥50mg/dl 1.63 [1.15-2.40]
TC/HDL ratio ≥5 1.98 [1.17-3.37] 0.006
<5 1.67 [1.16-2.41]
Triglycerides ≥150mg/dl 1.92 [1.43-3.18] 0.005
<150mg/dl 1.66 [1.16-2.50]
NC/DC ratio and serum lipid cutoffs (n=625)NC/DC ratio and serum lipid cutoffs (n=625)

III - ResultsIII - Results
Independent predictors of p-Value
NC/DC ratio:
Admission hs-CRP p=0.007
LDL-C p=0.03
-Age, smoking, hypertension p=NS
-Stepwise regression was performed
-HDL-C, TG, previous history of CHD and diabetes were dropped from the analysis

III - ResultsIII - Results
NC/DC ratio and LDL-C Quartiles (n=625)NC/DC ratio and LDL-C Quartiles (n=625)
1.52
1.691.76
1.86
11.11.21.31.41.51.61.71.81.9
2
1st 2nd 3rd 4th
<80.460 >=80.460,<100.541
>=100.541,<127.755
>127.755
NC
/DC
ra
tio
p=0.005

III - ResultsIII - Results
NC/DC ratio and TC/HDL Quartiles (n=625)NC/DC ratio and TC/HDL Quartiles (n=625)
p=0.003
1.62 1.63 1.65
2.12
0
0.5
1
1.5
2
2.5
1st 2nd 3rd 4th
<3.228 >=3.228,<3.858
>=3.858,<4.863
>4.863
NC
/DC
ra
tio

IV - ConclusionsIV - Conclusions
• Calcium has a strong correlation with Calcium has a strong correlation with necrotic core in human coronary arteriesnecrotic core in human coronary arteries
• The NC/DC ratio has a significant positive The NC/DC ratio has a significant positive association with an adverse lipid profile, association with an adverse lipid profile, and smokingand smoking

IV - ConclusionsIV - Conclusions
• Even though calcium is not prominent Even though calcium is not prominent within lesions of ACS patients, more within lesions of ACS patients, more calcium indicates larger and/or more calcium indicates larger and/or more numerous necrotic coresnumerous necrotic cores
• These findings are consistent with the These findings are consistent with the concept that an EBCT calcium score is able concept that an EBCT calcium score is able to predict further coronary eventsto predict further coronary events