coland holdings limited - colandpharma.com market is projected to grow at a 25% cagr ... 2019. 2020:...
TRANSCRIPT
Aug, 2013
Coland Holdings LimitedTWSE 4144

2
Disclaimer
• The presentation and the relevant information mentioned in this material, including operating performance, financial performance and the business outlook, have been compiled from both internal and external resources.
• These forward looking statements involve known and unknown risks, uncertainties and other factors, including price variation, competition, global economy, exchange rate movement and market demand, which may cause actual results to differ materially from those implied by such forward-looking statements.
• This Presentation should not be considered as the giving of investment advice by the Company or any of its shareholders, directors, officers, agents, employees or advisers. Each party to whom this Presentation is made available must make its own independent assessment of the Company after making such investigations and taking such advice as may be deemed necessary. In particular, any estimates or projections or opinions contained herein necessarily involve significant elements of subjective judgment, analysis and assumptions and each recipient should satisfy itself in relation to such matters.
• The forward looking statements expressed in this material reflect the Company’s current view about the future as of today. The Company is not responsible for any updates if there are any changes in the future.

3
Contents
Value Creation – Coland Style
Executive Summary
Outstanding Performance
Strategy for Future Growth
Appendix
Financial Performance

• We are the only Taiwan-listed, China-focused company specializing in the commercialization of healthcare products.
• We excel in product sourcing, registration, branding and marketing.
• Our superior performance is led by an industry-leading MNC-experienced, senior management team.
• Our unique Taiwan market insights and expertise enable us to source best-in-class healthcare products.
• We are strongly committed to providing superior returns to our shareholders.
4
Value Creation – Coland Style

5
Expand and Diversify Products
Build a Superior Pipeline
Leverage Strengths of Strategic Partners
Expand Network Coverage
Strong Product Sourcing and
Branding Capability
Extensive Sales Network
Experienced and Stable International Management Team
Superior Performance
Relative to Peers
Outstanding Performance Strategy for Future Growth
Executive Summary

6
Value Creation – Coland Style
Executive Summary
Outstanding Performance
Strategy for Future Growth
Appendix
Financial Performance

1. Strong Product Sourcing and Branding
7
Product Development
Manufacturing Sales & Marketing Distribution
Colandcollaborates with leading healthcare companies to develop promising products.
Dedicated in Product Sourcing
Colandcooperates with high quality GMP manufacturers.
Partner with high quality manufacturers
Our sales and marketing professionals promote products to China’s top hospitals.
Build and Develop a Professional Promotion Team
Work with nationwide top tier distributors.
Work with National Distributors to build National Network
Coland’s Strategic Focus

Milestones Accomplished since IPO in 2011
New Products Anti-HBV drug Lamivudine Yin Ding from Anhui Beike, COPD drug Bi Duo Yi and Rhinitis drug Yi Qing from Zhejiang Xianju
More Hospitals Increased coverage to over 2000 hospitals across China
More MNC products
In-licensed antibiotic injection Augmentin from GSK,Olbetam(Acipimox) and Detrusitol from Pfizer
M&A Purchased and obtained 51% equity of Heilongjiang TongzePharmaceutical company in July 2012 Strategic investments in Taiwan/PRC companies
New Medical Device Partners
Agreed to purchase in HC-BIOS-Dental Implant, Suzhou Micro Clear-Ophthalmoscope, Rendu Biotechnology-IVD reagents
8

Current Main Products
99
Therapeutic Area Year Product Generic name Indications Supplier
Hepatitis 2005 Dai Ding Adefovir Anti-HBV
Tianjin Institute of Pharmaceutical
Research
2012 Yin Ding Lamivudine Anti-HBV/HIVAnhui Biochem
United Pharmaceutical Co
Respiratory2011 Bi Duo Yi Tiotropium
Bromide COPD Zhejiang’s XianjuPharmaceutical
2013 Yi QingMometasone
Furoate Aqueous Nasal Spray
Rhinitis Zhejiang’s XianjuPharmaceutical
Immuno-suppressant 2005 Shun You Mycophenolate
MofetilOrgan
TransplantZhejiang JianfengPharmaceutical
Antibiotics 2012 Augmentin AmoxicillinandClavulanate
Bacteria Infection GSK
Cardiovascular 2013 Lezhiping Olbetam Treatment of Hyperlipidemia Pfizer
Urology 2013 Detrol TolterodineTartrate
Treatment of OAB Pfizer
Medical Device 2010 Sofamor Spinal Implants Spine Surgery Medtronic

10
8600+ Medical doctors2000+ Hospitals400+ Sales representatives200+ Distributors10 Sales offices1 Joint Venture (Heilongjiang Tongze)
Heilongjiang
Jilin
Liaoning
Beijing
Tianjin
Inner Mongolia
Hebei
Shandong
Jiangsu
Shanghai
Zhejiang
Fujian
Taiwan
Hainan
Guangdong
MacaoHong Kong
Guangxi
JiangxiHunan
Xinjiang
Tibet
Qinghai
Gansu
Sichuan
Yunnan
ChongqingHubei
Anhui
Henan
Shanxi
Shaanxi
Ningxia
Guizhou
• Success of blockbuster drug Dai Ding led to completion ofa national sales network
• Existing hospital network covers 50% of Tier-III, 30% of Tier-II hospitals
• M&A to accelerate pace of expansion
2. Extensive Sales Network

William Keller
Chairman
Key BOD Members captained the industry-leading Roche China Team in the late 1990s
Leo Lee
Co-Founderand Director
Xiaoping Ye
Co-Founderand Director
• As Head of S&M at Roche China, led company to win No.1 market share in prescription drugs in China
• Strengths in sales and management, especially the ability to retain talent
• Over 20-years career in China pharma industry, having worked at Johnson & Johnson, Schering-Plough, and Roche
• Ex-Medical Director at Roche China is key figure in contributing to Coland’ssuperior drug sourcing and pipeline capability
• Specializes in clinical trials for CFDA approval. Chaired 2 Pegasys Global Phase III studies for HBV at Roche
• Keen eye for CFDA / Market potential in drugs
• Key to identifying strategic partners for Coland
• Over 30-years management experience with Roche Pharma Group
• Held senior positions in Roche South America and Roche Asia
• GM of Roche China from 1995 until his retirement in 2002
• In 1999, was granted Honorary Citizenship of Shanghai and permanent resident permit in China for his outstanding contributions
11
3. Experienced and Stable Int’l Mgmt Team

Experienced and Stable Int’l Mgmt Team
Johua TsaoCFO20-yrs experience Int’l FMCG companies in Greater ChinaP&G, Dairy Farm( N. Asia Finance Head)
Tong HuNational Sales & Marketing Director15-yrs experienceShanghai SA, Roche, Novartis
David ChengCIO20-yrs experienceBoston Bioventure, YFY Bioventure Fund
Feng WangNational Sales DirectorOver 15-yrs experienceTong Sheng, Roche
Wenge Han Medical Registration DirectorOver 20-yrs experienceSanofi, Eddingpharm HK, Servier
Laura Guo, MDExternal Affairs Director20-yrs experienceSchering-Plough, Roche, NT Pharma
Jin-Fang LouProduct Development DirectorOver 20-yrs experienceNT Pharma, Hangzhou Saili, Hainan Puli
Sophie Jiang, MDMedical Device DirectorOver 20-yrs experienceAstra, Roche, Pharmacia & Upjohn
Leo LeeCEOOver 20-yrs experienceJ&J, Schering-Plough, and Roche
12

13
4. Coland vs. GC and International PeersColand has superior ROE and the highest yield, yet trades at a significant discount to peers
*Greater China peers: China Chemical & Pharma, CMS, Lee’s Pharm, Medigen, NT Pharma, Sihuan Pharm, Simcere Pharm, Sino Biopharm, Sinphar Pharm, TTY Biopharm, and United Lab.** International peers: Johnson & Johnson, Roche, and Pfizer.
-
5.0
10.0
15.0
20.0
25.0
30.0
Coland Greater China peer median*
International peer median**
(%) ROE
20112012
-1.0 2.0 3.0 4.0 5.0 6.0 7.0
Coland Greater China peer median*
International peer median**
(%) Dividend Yield
20112012
0.0
5.0
10.0
15.0
20.0
25.0
30.0
35.0
Coland Greater China peer median* International peer median**
(x) P/E20112012

14
Coland vs. GC and International PeersColand has superior FCF generation capability and high cash reserves
-60
-40
-20
0
20
40
60
80
Coland CMS Sino Biopharm
United Lab Lee's Pharma
Simcere Roche Pfizer
Net Cash/Total Assets2011
2012
%
-25
-20
-15
-10
-5
0
5
10
15
20
Coland CMS Sino Biopharm
United Lab Lee's Pharma
Simcere Roche Pfizer
FCF Yield 20112012
%

15
Value Creation – Coland Style
Executive Summary
Appendix
Financial Performance
Outstanding Performance
Strategy for Future Growth

Core Strategy
Build the best GC healthcare commercialization platform
Extensive sales network with national scale
Proven track record: Top-3 share in Adefovir sales
Source high-quality Rx drugs and Medical Devices
Prefer First-to-Market generics
Multiple sources: China, Taiwan, and International
Diversify product portfolio
Rich product offering: Rx drugs, Medical devices, IVD reagents
Product in-licensing, strategic investments, JV, and M&A
16

1. Expand and Diversify Products
Newlaunches At least one new product launch each year
Differentiation Sources: Class 1 New Drugs, FTM generics, MNC drugs
New therapeutic areas: Oncology, Respiratory, Cardiovascular
Medical device offerings Orthopedic (trauma & joint), dental, ophthalmology, IVD reagents
Operational excellence
Solidify leadership in hepatitis and respiratory drugs
Constant focus on high quality and best value proposition
17

Major New Products in 2013
Yi Qing(Mometasone furoate)
Aqueous nasal spray(Schering-Plough’s Nasonex®)
In-Licensed from producer Zhejiang Xianju and already included in the NRDL, Yi Qing targets the over RMB 500m-a-year nasal spray market in China.
Lezhiping is used for lowering high levels of cholesterol and triglycerides in the blood. It is a top-2 brand in China currently. Market size is RMB 80m in annual sales in China, according to IMS.
Detrol SR has been the world’s No.1 Rx drug for OAB since its 1998 debut. China’s RMB45m OAB market is projected to grow at a 25% CAGR between 2011-2015. Pfizer’s Detrol market share is 10% vs. 40% for Nanjing Meirui’s Tolterodine.
Lezhiping(acipimox capsules)
Cholesterol Reduction(Pfizer’s Olbetam®)
Detrol(Tolterodine L-Tartrate Sustained Release Capsules)
Overactive Bladder (OAB)(Pfizer’s Detrusitol SR®)
18

Dynamic Growth of Non-Daiding Sales
2.2%8.5%
17.7%
25.9%
31.0%
• Non-Daiding products grew from 0% in 2007 to 39.3% in 1H13• Non-Daiding sales grew at a 83.3% CAGR in 2008-2012*
19
*64.4% excluding contribution from Heilongjiang Tongze Pharmaceutical.
0.0%2.3% 2.2%
8.5%
17.7%
25.9%
39.3%
0.0%
5.0%
10.0%
15.0%
20.0%
25.0%
30.0%
35.0%
40.0%
45.0%
2007 2008 2009 2010 2011 2012 1H13
Non-Daiding sales

20
2. Building a Superior Pipeline
First-to-Market Generic
International Patented Products
Timing and branding are critical factors for fast market penetration
Products with international IP enjoy much longer life cycle
CFDA Class 1 New Drug Enjoy preferential pricing, tender-bidding rights, and insurance reimbursement

Pharma Product Pipeline
21
Indications Medicine Name 2014 2015 2016 2017 2018 2019 2020
Hepatitis
Entecavir dispersible tablets
Recom. HSA-Interferon α2b fusion
Tenofovir
Respiratory
Compound ipratropium bromide
Ciclesonide aerosol
Beclomethasone dipropionate Aerosol
Oncology
Irinotecan Injection
Temozolomide capsule
Vorinostat
Capecitabine
Imatinib
Bortezomib
G.I. Alvimopan
C.V. Metoprolol succinate sustained-release tablets
MORE PRODUCTS TO
BE ADDED INTO THE PIPELINE

22
Non-Pharma Product Pipeline
Indications Supplier Products Name 2013 2014 2015 2016 2017
Medical Devices
Orthopedic Medtronic/Kanghui Spine Balloon(PKP)
Dental HC-BIOS Dental Implant
Ophthalmology Suzhou Micro Clear
Scanning Laser Ophthalmoscope
Fluorescence Scanning Laser Ophthalmoscope
Handheld-Fundus Camera
IVD reagents
RNA Diagnosis RenduBiotechnology HIV/HBV/HCV
MORE PRODUCTS
TO BE ADDED
INTO THE PIPELINE

3. Leverage Strengths of Strategic Partners
Taiwanese partnership
Strategic investments in TW pharma and med device companies
Source high-market-potential TW products
MNC partnership In-license mature, registered, high-growth drugs from MNCs
Enter new therapeutic areas
Local joint ventures Product co-development to boost profitability
Local M&A Expand geographic reach
Increase product offerings
23

24
Value Creation Via Strategic Alliances
Colandmarketing
FormulationAPI
We aim to integrate API, Formulation & Marketing
For Example: Coland has formed a strategic alliance with ScinoPharm to co-develop oncologyproducts for the China market
ScinoPharm will exclusively provide APIs
Coland & ScinoPharm will jointly engage a formulation partner
Coland will manage the CFDA filing process and marketing

25
Value Creation – Coland Style
Executive Summary
Strategy for Future Growth
Appendix
Outstanding Performance
Financial Performance

26
Historical Performance
2006 2007 2008 2009 2010 2011 2012
Net Sales $570 $1,244 $1,671 $1,573 $1,509 $1,503 $1,722 Net Income $75 $246 $390 $459 $369 $314 $303
$0
$200
$400
$600
$800
$1,000
$1,200
$1,400
$1,600
$1,800
$2,000
(NTD mn)

27
Consolidated Income Statement
NTD Million 2013 Q2 2013 Q1 +/-% 2013 1H 2012 1H +/-%
Net Sales 456 100% 457 100% 0% 912 100% 791 100% 15%
Gross Profit 258 57% 243 53% 6% 502 55% 477 60% 5%
Operating Expense 185 41% 158 35% 17% 343 37% 280 35% 22%
Operating Profit 73 16% 86 18% -14% 159 18% 197 25% -19%
Non-Opt income/Exp 77 17% 73 16% 7% 150 16% 45 6% 233%
Profit Before Tax 151 33% 158 34% -5% 309 34% 242 31% 28%
Profit After Tax 120 26% 135 29% -11% 254 28% 179 23% 42%
Minority Interest 7 2% 7 2% 0% 15 2% 0 0% 100%
Net Profit 112 25% 127 28% -12% 239 26% 179 23% 34%
Basic EPS (NTD) 1.60 1.82 3.42 2.56
EPS is based on a total of 70 million issued shares.

28
Consolidated Balance Sheet
NTD Million 2013-6-30 2013-3-31 2012-12-31
Cash & Equivalents 920 33% 1,033 39% 930 40%
Accounts Receivable 356 13% 324 12% 365 16%
Inventory 163 6% 85 3% 81 3%
Long Term Investments 688 25% 662 25% 441 19%
Fixed Assets 11 0% 8 0% 9 0%
Intangible Assets 390 14% 389 15% 383 16%
Total Assets 2,798 100% 2,629 100% 2,337 100%
Short term Liabilities 419 15% 166 6% 142 6%
Long term & other liabilities 110 4% 108 4% 143 6%
Shareholders’ Equity 2,269 81% 2,355 90% 2,053 88%
Key Indices
Days Sales Outstanding 68 69 68
Inventory Turnover Days 57 36 39

29
1H13 Sales Breakdown
1H 13
Others,4%
1H 12
Notes: 1. Sales from Heilongjiang Tong-ze accounted for 21% of total 1H 13 sales.2. Others : Anti-infective, Immunomodulatory, Neuro system, Biological, Digestive system, etc.
Cardiovascular8%
Hepatits,83%
Medical Device,13%
Hepatits,68%
Respiratory,2%
MedicalDevice,11%
Others,11%Respiratory,1%

Dividends paid in 2011 and 2012
30
Source: TWSENote 1:Stock price based on closing price on 20 Jun 2012, the day before Ex-div dateNote 2:Stock price based on closing price on 10 July 2013, the day before Ex-div date
( NTD Million ) 2011 2012
Net income 314 303
Cash dividend 280 224
Dividend p/s (NT$) 4.0 3.2
Cash yield (%) 5.9*1 4.6*2
Payout ratio (%) 89% 74%

31
1H13 Milestones
Invested in ShanghaiRenduBiotechnology
Enter the China market for high-vitro diagnostic reagents
Invested inTaiwan HC-BIOS
To develop dental implant products for the China market
Invested in Suzhou Microclear
Enter the eye fundus photography laser scanning device market
Strategic alliance with Taiwan ScinoPharm
Co-develop oncologyproducts for the China market
Cooperation with KanghuiMedical
Obtain exclusive agency rights in Shanghai for spine balloon products
RenduHC-BIOS MicroclearScinoPharm Kanghui
Rx drugs Medical devices IVD reagents

32
• We aim to become the leading China-focused company specialized in the commercialization of healthcare products in China.
• We hope to sustain stable earnings growth. • We intend to maintain a consistently higher-
than-industry- average cash dividend payout to shareholders.
• We also pledge that our primary focus will be the maximization of returns to our shareholders via the profitable long-term growth of our core business.
Our Commitment to Shareholders

33
Value Creation – Coland Style
Executive Summary
Strategy for Future Growth
Outstanding Performance
Financial Performance
Appendix

Coland’s Existing Collaborations
34GSK
Medtronic
Anhui Beike
Hangzhou Jiuyuan
Zhejiang Xianju Pharma
Taiwan Lotus Pharma
Taiwan Nanguang Pharma
Pharma Dax
Taiwan Biotech Company
TIPR
pfizer
ScinoPharm Taiwan Ltd
HC Bio-S
Rendu Biotechnology
Micro Clear

Coland: the Go-To Partner for TW Pharma
Coland: The ideal platform for quality Taiwanese drugs and medical devices seeking entry into the vast China market
35
Partner Drug Name Drug Name Origin Brand Name Disease Type Mkt Launch
Taiwan Biotech Co 吸入用複方異丙托溴銨溶液Compound ipratropium
bromide BI可必特
Combivent COPD 2014
Taiwan NanguangPharma
鹽酸伊立替康注射液 Irinotecan Injection Pfizer開普拓Campto Cancer 2014
Lotus Pharma 替莫唑胺膠囊 Temozolomide capsule Merck泰道
Temodal Cancer 2017
PharmaDax 琥珀酸美托洛爾緩釋片Metoprolol succinate
sustained-release Tablets AstraZeneca倍他樂克
BetalocZOK(Toprol-XL)
Cardio 2017
Scinopharm 注射用硼替佐米 Bortezomib Takeda萬珂
Velcade Cancer 2017
36
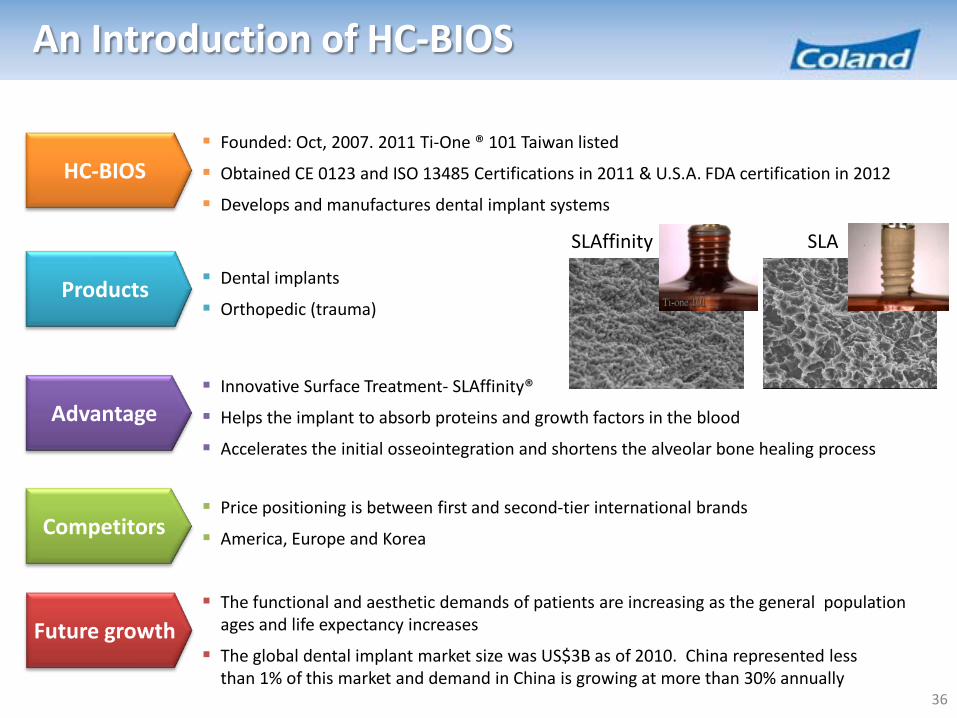
An Introduction of HC-BIOS
Founded: Oct, 2007. 2011 Ti-One ® 101 Taiwan listed
Obtained CE 0123 and ISO 13485 Certifications in 2011 & U.S.A. FDA certification in 2012
Develops and manufactures dental implant systems
Dental implants
Orthopedic (trauma)
Innovative Surface Treatment- SLAffinity®
Helps the implant to absorb proteins and growth factors in the blood
Accelerates the initial osseointegration and shortens the alveolar bone healing process
Price positioning is between first and second-tier international brands
America, Europe and Korea
The functional and aesthetic demands of patients are increasing as the general population ages and life expectancy increases
The global dental implant market size was US$3B as of 2010. China represented less than 1% of this market and demand in China is growing at more than 30% annually
SLAffinity SLA
HC-BIOS
Products
Advantage
Competitors
Future growth

37
An Introduction of Microclear
Suzhou Microclear
Founded: June, 2011. Based in Suzhou Industrial Park.
Founder Dr. Li was a researcher at the Houston Medical Center for Clinical Ophthalmology
Microclear’s scopes integrate optical, mechanical, electronic, and image processing technology
Products Scanning Laser Ophthalmoscope (2014.10)
Fluorescence Scanning Laser Ophthalmoscope (2014.11)
Handheld-fundus Camera (2015.06)
Advantage
One shot vs. Video
White light vs. IR light
Pupil size: 2.5mm vs. 1.5mm
Visual field: 30°~45° vs. 30°~60°
Competitors Microclear is the only China-based company to develop this technology
Germany (HEIDELBERG), England (OPTOS) and Holland (IOPTICS)
Future growth Demand from tier II hospitals, fundus screening, medical centers and other market segments
Based on current market trends, Scanning Laser Ophthalmoscopes will replace Fundus Cameras
The Chinese ophthalmic market is expected to reach 4 billion RMB

38
An Introduction of Rendu Biotechnology
Rendu Biotech Founded by a Chinese-American scientist in June, 2007
Based in Zhangjiang High Technology Park, Shanghai
Manufacture and sales of SAT (Simultaneous Amplification and Testing) equipment & reagents
Products
Full automatic RNA extractor
CT/NG/UU/MG Detection
TB/EV71/CA16/EV Detection
HIV/HBV/HCV Virus Diagnosis
Advantage
Fully automatic , improves process standardization, and reduces operator workload
Higher sensitivity and specificity for pathogen testing
Less contamination - RNA degrades easily
Convenient testing method (urine test), rapid delivery of results (2hrs vs. 14 days)
Competitors Rendu is the only China-based company that has RNA detection products and pipelines
Gen-Probe (TMA), Biomerieux (NASBA) have not entered the China market
China-based competitors: Molecular, Immuno-assay, Sansure
Future growth Global IVD market is US$35B, or 12% of total lab tests, and RNA detection is a leading method
China IVD market is only 1-2% total lab tests, and RNA detection is just beginning
RNA Diagnosis market growth in China is 25-30% annually, higher than general IVD market

China Pharmaceutical Market Forecasts
• China was the third largest pharma market in the world in 2011, according to IMS.• China’s health expenditure reached 5.4% of GDP in 2010, much lower than the
average 10% for developed countries and 16% for US.• China’s health care expenditures are projected to increase at a 20% CAGR between
2011 and 2016. China is projected to become the second largest Pharma market in the world in 2020, according to market research.
39
1 USA
2 Japan
3 China
4 Germany
5 France
6 Italy
7 Spain
8 Brazil
9 UK
10 Canada
1 USA
2 Japan
3 France
4 Germany
5 China
6 Italy
7 Spain
8 UK
9 Brazil
10 Canada
1 USA
2 Japan
3 Germany
4 France
5 UK
6 Italy
7 China
8 Brazil
9 Canada
10 Spain
1 USA
2 Japan
3 Germany
4 France
5 UK
6 Italy
7 China
8 Brazil
9 Canada
10 Spain
Source:IMS, PRC government publications, estimates from independent research firms.
Year 2005 Year 2009 Year 2011Year 2000

Targeting High Growth Market Segments
40
Source: IMS May 2013
Therapeutic Subcategory
China market(Million RMB)
2011/12-2012/11
CAGR (%) 2007-2012
Growth rate(%) 2012 vs.2011
Anti-infectives 83,049 10 0.4
Metabolism 58,080 25 24.0
Cardiovascular 57,176 25 27.4
Oncology 43,296 24 26.1
Respiratory 12,569 29 29.5
Targeted market segments have a
combined market size of
RM196 Bn with a projected 20%+ CAGR from 2007
to 2012

41
Investing in Medical Devices and IVD
• In 2012, the China IVD Reagent market reached US$1.7B
• It is projected to reach US$2.7B in 2015, with a CAGR of 20%+ between 2007-2015
950 1078 1211 1356 1534 1724 1933 2178 2450 2754268332
412492
606733
896
2006 2007 2008 2009 2010 2011 2012 2013 2014 2015
12.9%
20.8%
14.3%
Natural Growth Policy Driven Patient Driven
Market Size – Medical Equipment (in Hundred Million RMB)
501 794
1,259
1,712
2,714
-
500
1,000
1,500
2,000
2,500
3,000
2004 2007 2010 2012 2015
Market Size - IVD Reagent (in Million USD)
Source: Deutsche Bank
Source: Kalorama
20%+
• Prior to 2008: Medical device replacement as result of “wear and tear”
• 2009 to 2011: State-owned hospitals make collective purchases in the period of Medical System Reform
• 2012 to now: Increases in medical insurance coverage stimulate demand

42
Medical Devices Market
0%20%40%60%80%
100%41% 40% 41% 41% 42% 42% 42% 42%
Global pharmaceutical and medical devices market
Global pharmaceutical market
Global medical devices market
0%20%40%60%80%
100% 10% 10% 11% 11% 12% 13% 14% 14%
China pharmaceutical and medical devices market
China pharmaceutical market
China medical devices market
19% 20% 19% 20%23% 23% 23% 23%
25% 24%
17%14% 14%
17%14% 15%
17% 18% 17%19%
0
0.05
0.1
0.15
0.2
0.25
0.3
0200400600800
100012001400
2001 2002 2003 2004 2005 2006 2007 2008 2009 2010 2011
China medical device market(in Hundred Million RMB)
medical devices market size
medical devices market growth rate
pharmaceutical market growth rate
• Med device sales as % of total pharma + med devices mkt: China(15%) vs. Global(40%)
• Average expenditure on medical products per capita: China: US$ 13/per person vs. US: US$ 329/per person
• Demand driven by medical insurance increase and expansion
Source: Chinese Medical Device Industry Association

43
Dental Implant Market
Other Area,10%
China, Less than1%
Global Dental Implants Market255
192168
145133107
8763 57 54 44 39 35 25 18 17 7 1
Penetration rate of dental implants in 2008
The number of dental implants/ten thousand people
Source: Medical Technology, Merrill Lynch, 2007/Global Dental Implants Market, M&M, July2010
Europe,47%North America,27%
Asia Pacific,16%
Source: Straumann 2010
• Both functional and aesthetic demands of patients are increasing.
• The general population is aging and life expectancy is increasing. Tooth loss is a function of age.
• There is significant potential demand emerging in China. 0
50010001500200025003000350040004500
2005 2006 2007 2008 2009 2010 2011 2012 2013 2014 2015
773 886 1011 1147 1230 1378 1503 1631 1751 1867 1980445 560 693850 920 1021 1115 1208 1301 1386 1468
290347
413485 545
590630
679740
812897
Dental Implant Market Size(in Million USD)
Europe USA Asia Pacific
Source: Biomet/3i

COLAND GROUPTEL:+86-21-5137-1880FAX:+86-21-5137-1882/51371883ADD:1st Floor, No. 866, Halei Rd, Zhangjiang Hightech Park, Shanghai, ChinaTaipei OfficeTEL:+886-2-2546-9288FAX:+886-2-2546-6599 ADD:Rm. D, 10F., No.170, Dunhua N. Rd., Songshan Dist., Taipei City 105, TaiwanWEB:www.colandpharma.com
Thank you!