cold weather event simulations on the survival of larval
TRANSCRIPT

Cold Weather Event Simulations on the Survival of Larval Guadalupe Bass
byDusty McDonald
Hugh GlenewinkelPaul CasonCarl Kittel
Management Data SeriesNo. 289
2016
INLAND FISHERIES DIVISION4200 Smith School RoadAustin, Texas 78744
COLD WEATHER EVENT SIMULATIONS ON THE SURVIVAL OF
LARVAL GUADALUPE BASS
By
Dusty McDonald
Hugh Glenewinkel
Paul Cason
Carl Kittel
MANAGEMENT DATA SERIES
No. 289
2016
Texas Parks and Wildlife Department
Inland Fisheries Division
4200 Smith School Road
Austin TX 78744

i
ACKNOWLEDGMENTS
We would like to thank Gerald Kurten for the preliminary discussion on the design of this
study. We thank Donovan Patterson for his assistance with continued electrical maintenance of
our environmental chambers. We also appreciate Dan Daugherty for coordinating an internal
review.

ii
ABSTRACT
Guadalupe Bass are currently being produced at the A.E. Wood Hatchery to bolster
populations in their native range. Larval fish are raised in outdoor ponds and reared to 38 mm
(TL) before being stocked. During an extreme cold weather event occurring at the hatchery,
ponds harboring Guadalupe Bass larvae had low returns. Hatchery biologists speculated that low
returns could have been due to the cold weather event. In order to test the likelihood that larval
fish could withstand a cold weather event we conducted two cold weather simulations during
which larval Guadalupe Bass were exposed to 12-h treatments of 14°C or 16°C. No differences
in survival occurred between larvae exposed to 16°C for 12-h and control (P > 0.05) or larvae
exposed to 14° for 12-h and controls (P > 0.05). Growth was significantly lower (P < 0.05) for
fish exposed to 14°C, whereas fish exposed to 16°C no differences in growth were determined (P
> 0.05).
INTRODUCTION
The Guadalupe Bass Micropterus treculii is a species of concern due to genetic
introgression and competition with introduced stocks of Smallmouth Bass Micropterus dolomieu
(Garrett 1991; Koppelman and Garrett 2002). A recent genetic survey discovered that
introgression currently no longer occurs in the Lampasas and San Gabriel rivers and that recent
stocking efforts have not led to depressed genetic variation (Bean et al. 2013). The Texas Parks
and Wildlife Department conducts Guadalupe Bass culture as part of its Inland Fisheries stock
enhancement program (Carmichael and Williamson 1986).
In the spring season, captive Guadalupe Bass adults are spawned in indoor raceways at
the A.E. Wood Hatchery in San Marcos, Texas (AEW). Eggs are maintained indoors in ambient
temperature incubation troughs throughout the hatching process. After the larvae have
developed a functional digestive system, they are then stocked in outdoor rearing ponds and
ready to feed. Previous survival data in 2014 suggests the possibility that cold weather events
may have impacted survival. Current literature does not list a lower lethal temperature for larval
Guadalupe bass.
In this study, we exposed Guadalupe bass fry (~7-mm in SL) to a simulated cold weather
event, similar to a study conducted by McDonald et al. 2016. Throughout the temperature
exposure, experimental and control fish were monitored for indicators of stress (i.e., erratic
swimming), loss of equilibrium and death. These cold weather event simulations can give
insight into the low temperature tolerance of larval Guadalupe Bass maintained at AEW.
METHODS
Fish spawning and transfer
Spawning and incubation of Guadalupe Bass occurred at AEW using standard hatchery
protocols. First-feeding fry, commonly stocked into outdoor rearing ponds, were used for this
study. Fry (n = 200) were transported within a 45-L ice chest to the Perry R. Bass Marine
Fisheries Research Station (PRB), Palacios, Texas. Prior to live fish transport, water quality
records (daily temperature, pH, and DO) were documented throughout the life of the hatched
larvae; and the water used for transport was obtained from the same source. The PRB wetlab had
a prepared tank filled with San Marcos River water from AEW (~100 gallons) for each trial.
Experimental design
Cold weather simulations were conducted in a similar manner to McDonald et al. 2016,
using a temperature programmable environmental chamber (Luwa Environmental Specialties,
model ES2000 C-LT-R, Raleigh, NC) in concert with a LabLine environmental chamber for
controls. Recirculating systems were created using a polypropylene reservoir (55-L) equipped
with a regulated submersible water pump to an aerated shallow water bath (15-L) a water volume
of 40-L was cycled back through a 7.6-L biofilter. Duplicate systems were used within the
environmental chamber and as controls (total 4 systems). Each water bath contained 14, 500-mL
polypropylene jars with flow-through holes and a single plexiglass wall to separate two
independent fish (to maximize space and prevent overeating), allowing for a total of 28 fish per
2
individual recirculating system. At the start of each experiment, 28 fish fry were randomly
selected and placed within the 14 jars per recirculating system. Target sample sizes were 56
experimental fish and 56 control fish. Experiments began once all fish were randomly placed in
each recirculating system. All fish were fed a daily diet of live Artemia throughout the
experiment. Experimental fish were kept at the start temperature (22°C) for 24-h so that any
immediate mortalities caused by transportation could be replaced with acclimated reserve fish
prior to the actual experiment. After this 24-h monitoring period the temperature drop began to
decrease at a rate of Δ = 0.5°C/h to a target temperature of 16°C (Experiment 1) or 14°C
(Experiment 2) and kept at this temperature for a period of 6-h. Temperatures were then
increased Δ = 0.25°C/h to the original start temperature 22°C, and maintained for an additional
12-h. Control water temperatures were maintained at around 22°C using glass aquarium heaters
within the recirculation tanks. Experiment 1 was conducted on April 7, 2015 and Experiment 2
was conducted on April 13, 2015. Water temperature was monitored using submerged
thermisters (Tidbit, Hoboware, Onset, Bourne, Massachusetts). Fish were monitored for survival
periodically throughout the entire study for mortalities (every 4 hours). If a mortality was
observed, the fish was immediately removed and measured to nearest mm. Water quality was
recorded daily with the use of a hand-held meter (YSI Pro-plus with Quatro probe YSI, Yellow
Springs, Ohio); water parameters consisted of temperature (°C), dissolved oxygen (mg/L),
saturated dissolved oxygen (%), and pH. Un-ionized ammonia was monitored daily using a
colorimeter (Colorimeter II Hach, Loveland, Colorado). If ammonia levels became greater than
0.01-mg/L in any recirculating system, a dosage of 5-mL of ammonia remover (Amquel®
Kordon LLC, Hayward, California) was added to each system by the lab personnel.
Statistical analyses
Survival analysis was used to examine the effects of cold temperature treatment on
mortality. The response variable was time until death for these experiments. Our analysis
included right-censored data (individuals that did not experience death) because we had survival
in each experiment. Survival curves were created using the Survival Distribution Function (Proc
LIFETEST) along with a comparison of mortality between life stages using a Log rank test with
the Šidák multiple-comparison adjustment. Fish sizes of experimental vs. controls were
compared using a Mann-Whitney U statistic. All statistical analyses were performed using the
Statistical Analysis System (SAS) version 9.2 (SAS Institute, Inc., Cary NC), and statistical
significance was considered to occur at α = 0.05.
RESULTS AND DISCUSSION
16°C Test
Water quality (mean ± SD) for the control was pH 8.6 ± 0.18; dissolved oxygen 8.4 ±
0.23 mg/L; ammonia (NH3) <0.01 mg/L; and for treatment was pH 8.6 ± 0.03; dissolved oxygen
9.0 ± 0.7 mg/L; ammonia <0.01 mg/L. Water temperatures were maintained at 21.3°C for
treatment tanks and temperatures then dropped at a rate of 0.37°C for 14-h and was maintained at
15.5 ± 0.32°C for 12-h and temperatures then increased 0.24 for 20-h before reaching 21.2°C and
maintained for another 24-h. Control water temperatures were maintained at 21.7 ± 0.18°C for
the entire trial (Figure 1).
3
Twelve fish died within the treatment tanks of the 16°C test whereas seven fish died
within control tanks. The 16°C temperature treatment resulted in 20.7% mortality whereas the
control tanks resulted in 12.3% mortality, <9% difference. Log-ranked tests of survival curves
detected no differences between control and experimental survival exposed to 16°C for 12-h (P =
0.2571). Minimal differences in mortalities between control and treatments suggest that batch
fitness may have resulted in mortalities rather than a treatment effect. Surviving fish sizes
displayed no significant differences in sizes (P = 0.133) when comparing experimental fish vs.
control fish (Figure 2).
14°C Test
Water quality (mean ± SD) for the control was pH 8.7 ± 0.068; dissolved oxygen 8.0 ±
0.67 mg/L; ammonia (NH3) <0.01 mg/L; and for treatment was pH 8.7 ± 0.05; dissolved oxygen
8.9 ± 1.07 mg/L; ammonia <0.01 mg/L. Water temperatures were maintained at 21.4°C for
treatment tanks and temperatures then dropped at a rate of -0.45°C for 16-h and was maintained
at 14.0 ± 0.24°C for 12-h and temperatures then increased 0.25 for 22-h before reaching 20.2°C
and maintained for another 24-h. Control water temperatures were maintained at 21.7 ± 0.11°C
for the entire trial (Figure 3).
Sixteen fish died within the treatment tanks of the 14°C test whereas twelve fish died
within control tanks. The 14°C temperature treatment resulted in 27% mortality whereas the
control tanks resulted in 21.4% mortality, <6% difference. Log-ranked tests of survival curves
detected no differences between control and experimental survival exposed to 16°C for 12-h (P =
0.4673). Surviving fish sizes were significantly different between experimental and control fish
(P = 0.029), control fish being larger than experimental fish (Figure 2).
CONCLUSIONS
Laboratory exposed larval Guadalupe Bass fed a diet of live artemia had similar survival
rates when exposed to short-term durations (12-h exposure) of cold exposure to 14°C or 16°C.
Growth was significantly lower for fish exposed to 14°C when compared to controls whereas,
16°C exposure resulted in no difference in growth. This study had some limitations due to the
lack of replication, but we feel that good control survival warranted these data to be reported.
Further testing is necessary to determine if cooler temperatures and/or longer duration cold fronts
may result in mortality and/or slowed growth.
4
LITERATURE CITED
Bean, P.T., D.J. Lutz-Carrillo, and T.H. Bonner. 2013. Rangewide survey of the introgressive
status of Guadalupe Bass: implications for conservation and management. Transactions
of the American Fisheries Society 142(3):681-689.
Carmichael, G. J., and J. H. Williamson. 1986. Intensive production of Guadalupe Bass. The
Progressive Fish- Culturist 48:133–136.
Garrett, G.P. 1991. Guidelines for the management of Guadalupe Bass. Texas Parks and Wildlife
Department. Special Publication N3200-367, Austin, Texas.
Koppelman, J.B. and G.P. Garrett. 2002. Distribution, biology, and conservation of the rare black
bass species. Pages 333-341 in D.P. Phillip and M.S. Ridgway editors. Black bass:
ecology, conservation, and management. American Fisheries Society, Symposium 31,
Bethesda, Maryland.
McDonald D.L., T.H. Bonner, PD. Cason, B.W. Bumguardner and S. Bonnot. 2016. In Press.
Effects of three cold weather event simulations on early life stages of southern flounder
(Paralichtys lethostigma). Journal of Applied Aquaculture 28.
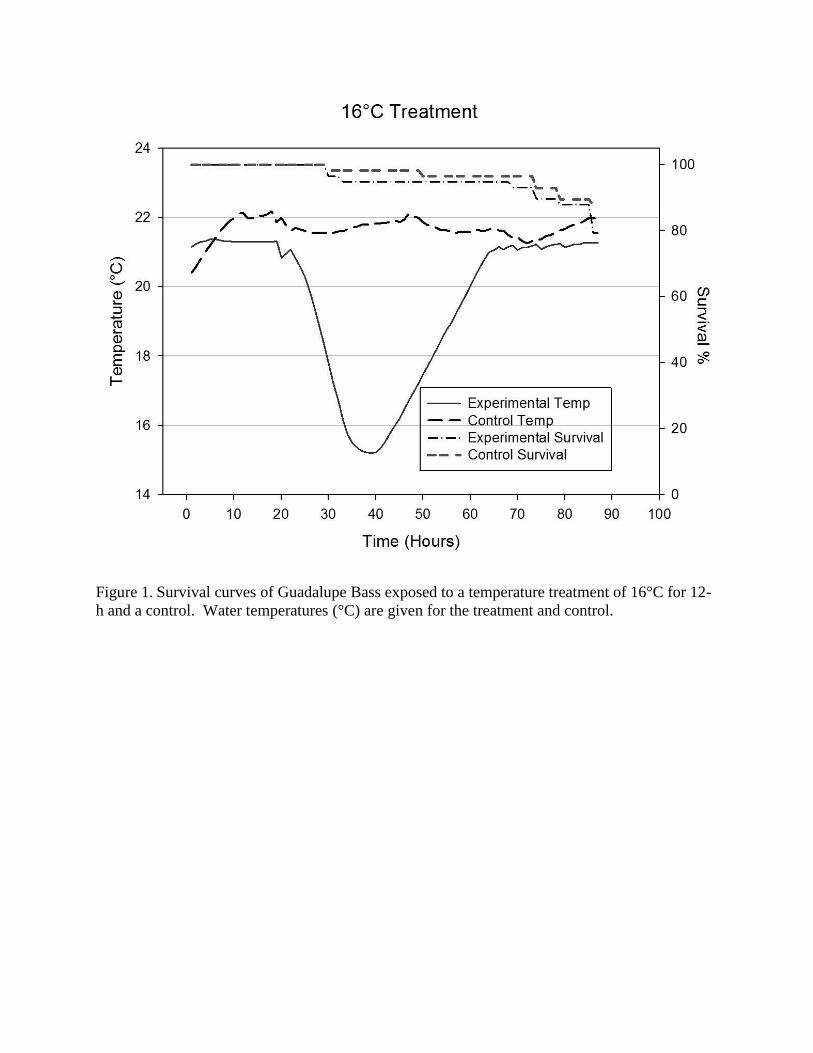
Figure 1. Survival curves of Guadalupe Bass exposed to a temperature treatment of 16°C for 12-
h and a control. Water temperatures (°C) are given for the treatment and control.

Figure 2. Box plots demonstrating total length (mm) of Guadalupe Bass at start of trials (pre-
trial) for both trials (16°C and 14°) and the result of sizes of survivors post-study for controls and
treatments.

Figure 3. Survival curves of Guadalupe Bass exposed to a temperature treatment of 14°C for 12-
h and a control. Water temperatures (°C) are given for the treatment and control.

Texas Parks and Wildlife Department4200 Smith School Road, Austin, Texas 78744
© 2016 TPWD. PWD RP T3200-2079C (3/16)
In accordance with Texas Depository Law, this publication is available at the Texas State Publications Clearinghouse and/or Texas Depository Libraries.
TPWD receives funds from the USFWS. TPWD prohibits discrimination on the basis of race, color, religion, national origin, disability, age, and gender, pursuant to state and federal law. To request an accommodation or obtain information in an alternative format, please contact TPWD on a Text Telephone (TDD) at (512) 389-8915 or by Relay Texas at 7-1-1 or (800) 735-2989. If you believe you have been discriminated against by TPWD, please contact TPWD or the U.S. Fish and Wildlife Service, Office for Diversity and Workforce Management, 5275 Leesburg Pike, Falls Church, VA 22041.