colgate’s growingsuccess o strong r market leadership o
TRANSCRIPT

Colgate’s Growing Success
o STRONG R MARKET LEADERSHIPo GREATER PROFITABILITYo THE POWER OF G OBAL TEAMWORK
Co~gate-Pa1mo1ive Company1998 Annual Report
1Colgate’s Growing Success
Highlights
New Records in Profits,
Good Unit Volume Growth
Colgate’s Growth Strategy
Dear Colgate Shareholder
Glossary of Terms
Colgate’s Growing Success
I. Stronger Market Leadership
Building Number One Positions
II. Greater Profitability
Bringing Colgate’s Products to
Consumers Faster and More Efficiently
III. The Power of Global Teamwork
38,000 Colgate People Sharing
Across Borders
Global Business Review
Operating Highlights for Latin America,
North America, Europe, Asia/Africa and
Hill’s Pet Nutrition
Board of Directors
Your Management Team
Shareholder Information
Eleven-Year Financial Summary
ANOTHER YEAR OF STRONG PROGRESS
Contents Highlights
1
2
3
5
6
9
13
15
19
19
21
21
Colgate-Palmolive is a $9 billion global company
serving people in more than 200 countries and
territories with consumer products that make lives
healthier and more enjoyable. The Company
focuses on strong global brands in its core busi-
nesses — Oral Care, Personal Care, Household Care,
Fabric Care and Pet Nutrition. Colgate is following
a tightly defined strategy to increase global market
leadership positions for key products, such as
toothpaste, toothbrushes, bar and liquid soap,
deodorants/antiperspirants, dishwashing deter-
gents, household cleaners, fabric softeners and
pet nutrition.
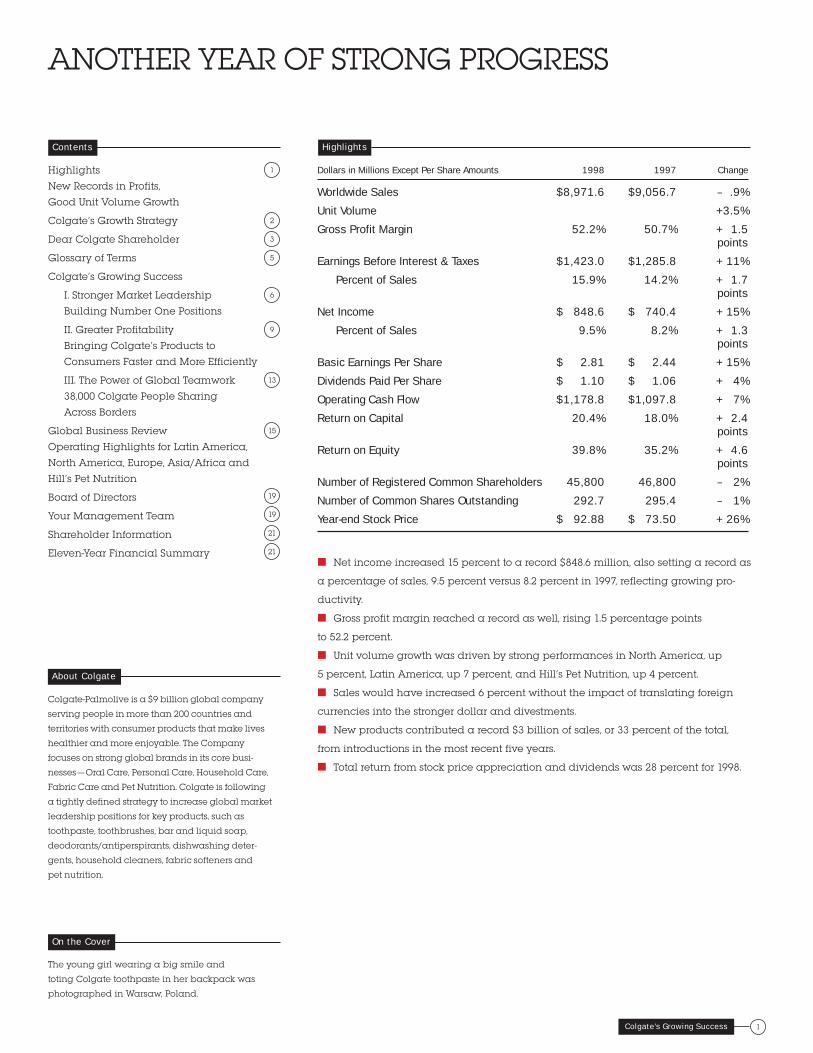
■ Net income increased 15 percent to a record $848.6 million, also setting a record as
a percentage of sales, 9.5 percent versus 8.2 percent in 1997, reflecting growing pro-
ductivity.
■ Gross profit margin reached a record as well, rising 1.5 percentage points
to 52.2 percent.
■ Unit volume growth was driven by strong performances in North America, up
5 percent, Latin America, up 7 percent, and Hill’s Pet Nutrition, up 4 percent.
■ Sales would have increased 6 percent without the impact of translating foreign
currencies into the stronger dollar and divestments.
■ New products contributed a record $3 billion of sales, or 33 percent of the total,
from introductions in the most recent five years.
■ Total return from stock price appreciation and dividends was 28 percent for 1998.
The young girl wearing a big smile and
toting Colgate toothpaste in her backpack was
photographed in Warsaw, Poland.
Dollars in Millions Except Per Share Amounts 1998 1997 Change
Worldwide Sales $8,971.6 $9,056.7 – .9%
Unit Volume +3.5%
Gross Profit Margin 52.2% 50.7% + 1.5points
Earnings Before Interest & Taxes $1,423.0 $1,285.8 + 11%
Percent of Sales 15.9% 14.2% + 1.7points
Net Income $ 848.6 $ 740.4 + 15%
Percent of Sales 9.5% 8.2% + 1.3points
Basic Earnings Per Share $ 2.81 $ 2.44 + 15%
Dividends Paid Per Share $ 1.10 $ 1.06 + 4%
Operating Cash Flow $1,178.8 $1,097.8 + 7%
Return on Capital 20.4% 18.0% + 2.4points
Return on Equity 39.8% 35.2% + 4.6points
Number of Registered Common Shareholders 45,800 46,800 – 2%
Number of Common Shares Outstanding 292.7 295.4 – 1%
Year-end Stock Price $ 92.88 $ 73.50 + 26%
About Colgate
On the Cover

2Colgate’s Growing Success
Colgate is continuing its record
of strong growth and increased profitability through
an aggressive strategy which takes
the Company well into the next century.
Central to this growth doctrine is strengthening
market leadership in Colgate’s core categories
while increasing the returns from all aspects
of the business. Colgate people worldwide
are using the latest business tools,
working together as an efficient team, to achieve
specific growth and shareholder value goals.
Colgate’s Growing Success

Colgate’s Growing Success3
We achieved in 1998 anotheryear of strong progress forColgate. Net income, earningsper share, gross profit marginand operating profit marginestablished new records. Fun-damental to our success — pre-sent and future —is ourcommitment to people workingtogether. Training and globalsharing of ideas enableColgate to maximize its bestresource: the 38,000 Colgatepeople worldwide.
Colgate people strength-ened our market leadershippositions. We are proud thatColgate-U.S. decisively gainedthe Number One spot in thedomestic toothpaste marketin 1998. We strengthenedColgate’s toothpaste market
share in many other countriesas well. At the same time,Colgate’s strong Personal Carepositions were improved, target-ing the fast-growing liquid soap,deodorant and hair care seg-ments. Broad gains in othercore categories encompassedcleaners, fabric softeners anddishwashing liquids.
Our leadership strategy issupported by a powerful butsimple financial approach thatenables Colgate to achieverecord profits. In 1998, yourCompany increased net income15 percent to a record $849million, or $2.81 versus $2.44per basic share. Gross profitmargin improved by 1.5 percen-tage points to 52.2 percent, andoperating profit margin improvedby 1.7 points to 15.9 percent.Both ratios were records.
Cash flow from operationsreached a new record as well:$1.2 billion. This healthy cashflow also helped us maintaindebt capitalization in the opti-mum 50 to 55 percent range.During 1998, Colgate repur-chased 7.1 million shares at acost of $542.5 million, as partof our previously announcedshare buyback programs.
Like other multinationals,Colgate has faced negative cur-rency translation and reducedpurchasing power in someregions. Still, unit volume grew3.5 percent for 1998, driven bystrong performance in NorthAmerica, Latin America andHill’s Pet Nutrition. Sales were$9.0 billion, a decrease ofless than 1 percent. Exclud-ing foreign currency transla-tion and divestments, salesincreased 6 percent.
Colgate’s financial perfor-mance is strong. And webelieve that Colgate’s provenbusiness strategies and globalexperience will serve us wellinto the next century. This con-fidence is based on experi-ence. Year after year, we haveadded to the number of leadingbrands in our portfolio. More-over, Colgate people are highlyadept at transferring success-ful programs and products fromone country to others. ForColgate shareholders, this hastranslated into consistent,favorable total return.
Powerful Strategy ProducesLeadership PositionsColgate’s leadership strategybegins with introducing innova-tive new products, and thenquickly realizing their worldwidepotential with the most effec-tive advertising, promotionsand distribution.
In addition to capturingtoothpaste leadership in theU.S., we strengthened ourNumber One rankings insuch countries as Canada,the U.K. and Mexico, andhold leadership positions intoothpaste in 175 countries.Colgate whitening toothpaste,for example, has capturedalmost 50 percent of theworld’s whitening segmentand has been expanded to75 countries. Colgate’s globalmarket share for toothpaste is at a record high.
Importantly, our leadershippositions extend throughout all core categories. Colgatealso leads the market in liquidsoaps, men’s stick deodorant,liquid cleaners and fabric
“Colgate people can be
justly proud of achieving
strong market shares here
and abroad while driving
down costs sharply in a
disciplined fashion. I am
delighted with our strong
1998 performance, even
during economic uncertainty
in many areas of the world.
We are looking forward to
another good year in 1999.”
Reuben Mark
“I take deep satisfaction from
Colgate’s having become
Number One in the U.S.
toothpaste market, a key
objective for several years.
From a global perspective, I
am pleased that we achieved
our strongest growth in Oral
Care, Personal Care and Hill’s
Pet Nutrition. These are our
most profitable categories.”
Bill Shanahan
EXCELLENT DOUBLE-DIGIT EARNINGS GROWTH;1998 WAS A RECORD YEAR
Dear Colgate Shareholder

4Colgate’s Growing Success
softeners in scores of coun-tries. New variants of Palmoliveshower gel introduced in Europehelped increase market sharesin nine countries. Halfwayaround the globe, in Argentina,new variants of the sameshower gel quickly achieved an 11 percent share of thissegment after launch. In theU.S., we restaged and intro-duced a new line of Softsoapbrand body washes, capitaliz-ing on the demand for colorful,scented shower gels. World-wide, our liquid soaps saw continued double-digit volumegrowth in 1998.
Around the world, a record$3.0 billion of sales, or 33 percent of the total, came fromnew products introduced duringthe last five years. And ourpipeline is full of new productsthat will offer consumers realvalue and benefits in the monthsto come.
Building consumption oftenis as important as increasing
market share, especiallywhere incomes are low. Weare working to encourage morepurchases per householdthrough special-size packaging,innovative distribution andeducation. For instance, ourprograms to increase homeusage in Colombia have helpedto more than triple householdpenetration of fabric softenerin just five years. As the mar-ket leader, with 80 percent ofthe category, Colgate-Colombiabenefits. Similar programsare working to build consump-tion in Asia.
Leaders Have theAdvantageIn addition to its financialrewards, market leadershipprovides us with other competi-tive advantages. The money wecommit to advertising and con-sumer research is spread overa larger sales base, therebymaking it a more efficientinvestment for Colgate. BeingNumber One also providesleverage with trade customers,and recognition value withconsumers.
Effective, sustained adver-tising is key to our continuedgrowth. Total ad spendingincreased again in 1998,rising to its highest level everin relation to sales. Mediaadvertising is augmented withpromotions that reach con-sumers in their daily lives.Linking with popular Disneyfilm characters, for example,is building sales of Colgatechildren’s toothbrushes in32 countries, from Australia toGermany to Venezuela.
Cost Savings ContinueTo support leadership, we relyon a financial strategy of reduc-ing overhead and increasinggross profit margin. We focuson profitable growth by allocat-ing 60 percent of capitalexpenditures to cost-savingsprograms. The money we saveis invested back into new prod-ucts and advertising and isreturned to shareholders inthe form of increased profits.
Savings will continue tocome from a number of areas.For several years, we havebeen telling you about the ben-efits of the high-tech globalsoftware called SAP. This inte-grated software reinforcesstreamlining of our business atevery level. Starting with thepurchasing of raw materials,right through to getting prod-ucts on store shelves, SAP pro-vides Colgate people with areal-time overview of the supplychain. Through SAP, they trackeach process, reduce ware-house inventories, controlwaste and save millions ofdollars.
Installation of SAP is com-plete in the U.S. and expectedto be fully operational in West-ern Europe in mid-1999. Nowbeing implemented in otherregions as well, this systemoffers opportunities for signifi-cant future savings. And it ishelping to ensure our readi-ness for year 2000 issues.
Another important sourceof savings is the increase inregional cooperation. Anticipat-ing this trend, Colgate estab-lished a firm foundation for
New ColgateTotal Fresh Stripe—United StatesColgate enters 1999 having just
announced an exciting new
toothpaste for the large U.S. mar-
ket. Colgate Total Fresh Stripe, a
striped gel, is the second variant
of the Colgate Total line to
receive U.S. Food and Drug
Administration approval — the
only toothpastes cleared to make
claims for gingivitis and plaque
reduction. Early reaction from the
trade is excellent.
0
1.50
2.00
2.50
$3.00
989796
$2.09
$2.44
$2.81
0
44
47
50
53
989796
49.1%
50.7%52.2%
%
Gross Profit Margin
(% to sales)
Earnings Per Share Growth
Charts: Gross profit mar-
gin continues to
increase as a percent-
age of sales, a key goal.
Basic earnings per
share have increased
by 34% over the past
two years.
(Basic Earnings Per Share)

Colgate’s Growing Success5
regionalization years ago.Colgate-Europe managers arewell prepared to take advan-tage of economic integration,including the transition towarda common currency in 11 coun-tries —the euro.
All Colgate divisions relyincreasingly on expert RegionalPurchasing Councils, whichmeet several times a year todocument best practices andnegotiate the best prices. Increating these groups, weaggregate volume in large con-tracts with fewer suppliers andsave on raw material costs.This program, in combinationwith globally driven supply ini-tiatives, has saved over $150million during the past threeyears. There are opportunitiesfor additional savings, as onlya portion of such expendituresare now made regionally orglobally.
Regional trade areas havealso helped Colgate consoli-date manufacturing and reducecosts. Today, we are supplyingproducts to wider geographicareas from fewer factories,each of which specializes ina specific manufacturingprocess. Stellar results fromthe developed world indicatefurther savings ahead, as con-solidation unfolds in LatinAmerica and Asia. Already, injust two years, the number offactories in Latin America hasdeclined to 18 from 32.
Work in this area is far fromdone, and we will continue tobenefit from new technologiesand improved efficiencies,
including new ways of stan-dardizing products and packag-ing. We are well aware thatevery Colgate activity repre-sents a link of efficiency, start-ing with the purchase of rawmaterials, all the way to thelast step, purchase by the con-sumer at store checkout.
38,000 People WorkingAs One Global TeamExperienced Colgate peopleacross all disciplines andregions are working in a collec-tive commitment to drive ourprofitable growth. For instance,teamwork is at the heart ofreaping the benefits of SAP.Colgate salespeople are alsosharing best practices withtheir peers as we move toteam-based selling for largemulti-country trade customers.Collaboration is equally impor-tant for new tightly focusedgroups of research scientistsand marketing experts workingtogether from various locationsto develop tomorrow’sproducts.
Colgate people in the U.S.,sharing knowledge and learn-ing to work in teams, are thefirst to have been trained in“Valuing Colgate People,” anaward-winning program recog-nized by the U.S. Departmentof Labor. Beginning this year,Colgate people worldwide areparticipating in this program.Its principles of managing withrespect are part of our promo-tion and performance appraisalsystem.
We also strive to build ourfuture management team asintently as we grow our prof-
itability. High performers servein different countries and jobs,experience different businessconditions and embraceColgate’s core values. It is pro-grams and practices like thesethat add an extra dimension tothe talents of all Colgate peo-ple, whose dedicated effortshave produced another year ofrecord performance. Colgateshareholders benefit as wellfrom an exceptional Board ofDirectors, whom we thank fortheir expert guidance.
Colgate continually rein-forces its core values todevelop the best qualities forpeople performance. This isthe foundation of Colgate’sworldwide leadership and con-sumer trust. Our history ofmanaging all people withrespect, and in turn their com-mitment to profitable growthand shareholder value, shouldassure that your Company willcontinue to grow and succeed.
Thank You.
Reuben MarkChairman and Chief Executive Officer
William S. ShanahanPresident andChief Operating Officer
I. STRONGER MARKET LEADERSHIP page
II. GREATER PROFITABILITYpage
III. THE POWER OF GLOBAL TEAMWORKpage
6
9
13
Glossary of TermsForeign currency translation–the
effect of translating sales orexpenses in a non-U.S. currencyinto U.S. dollar results.
Global market position–is basedon external market share infor-mation in major markets. Whereexternal data is not available,primarily in smaller markets,management estimates marketposition based upon its under-standing of the business and inrelation to competitors. Leader-ship and world ranking reflectcountries where Colgate hasestablished its brands and are inrelation to competitors in thosemarkets.
Market share–percentage of the category’s retail sales obtained by one brand or company. Inthis report, unless otherwise stated, market shares are basedon value shares provided byeither ACNielsen or IRI.
SAP–computer software that helpscompanies link all of their busi-ness processes into one inte-grated system, tying togetherdisparate business functionsand facilitating the smoothrunning of the business.
Supply chain–the process thatencompasses every effortinvolved in producing and deliv-ering a final product from thesupplier of ingredients to theretail customer, including plan-ning, sourcing, making anddelivering goods.
Unit volume growth–growth in product units sold, weighted toreflect price per unit.
Colgate’sGrowingSuccess

6Colgate’s Growing Success
I. STRONGER MARKET LEADERSHIPBuilding Number One Positions in Core Categories—Colgate’s Big Brands Generate Market Share Growth and Increased Profitability
Colgate’s powerful globalbrands performed like stars in1998. Global market sharesincreased for toothpaste, liquidsoaps & shower gels, deodor-ants/antiperspirants, liquidcleaners, dishwashing prod-ucts and fabric softeners. Fully$3.0 billion of sales —a record33 percent of total 1998 rev-enues —came from new prod-ucts that did not exist fiveyears ago.
Growing Leadership inOral CareThe huge success of ColgateTotal toothpaste, coupled withthe expansion of Colgate TotalFresh Stripe and Colgatewhitening, has catapultedColgate’s global toothpasteleadership to an all-time high.The key achievement of all,capturing annual leadershipof the $1.6 billion U.S.toothpaste market, occurredin 1998.
Gaining almost half of thefast-growing whitening segment,Colgate whitening toothpaste isnow sold in 75 countries.Colgate Total Fresh Stripe, amint-flavored gel, has beenintroduced in 58 markets as asecond variant of the ColgateTotal line. Higher toothpastemarket shares often resulted. InCanada, Colgate Total FreshStripe helped raise overall tooth-paste market share, which wasalmost 40 percent for 1998. ItsU.S. launch early in 1999 addsfurther impetus to domesticleadership.
The only toothpaste to gain FDA
approval to prevent gingivitis, plaque
and cavities, Colgate Total was one
of Business Week’s “Best New Products
of 1998.” Explaining its therapeutic
benefits from behind the counter are
Julia Reyes and Clark Wyly of Colgate
Oral Pharmaceuticals, with Dr. Noel
Capestany of Alexandria, VA, and
Dr. Sara Cohen of Washington, DC.
Most SuccessfulToothpaste —United States
Colgate’s growing leader-ship in Oral Care extendsbeyond toothpaste. New tooth-brushes are selling briskly. Thepremium Colgate Total Profes-sional cleans down and aroundteeth. It has added incrementalU.S. toothbrush market sharesince its mid-1998 launch. Newbrushes for children are alsodoing well worldwide, including(continued on page 7)
0
20
24
28
32
989796
%
22.4%24.6%
30.4%
Number One in Toothpaste
ACNielsen value market shares
Chart: Colgate’s share of the U.S.
toothpaste market is up almost
six share points over 1997,
reflecting strong new products.

Colgate’s Growing Success7
My First Colgate with Barney,*
Colgate Grip-em’s and Disneycharacter brushes.
Focus on Global BrandsStrong returns from Oral Careand other core categories helpfund business-building invest-ments. Total advertising spend-ing rose again in relation tosales in 1998. Media invest-ment is concentrated on ourglobal brand equities, whichbring in 70 percent of sales.Consumer research increasedtoo, with Colgate conductingmore than 500,000 in-countryinterviews.
Finding new trends enablesColgate to capitalize on rele-vant consumer benefits. Suchinsight generated the successof Colgate Total early on. Per-sonal Care growth is beingboosted by the experientialPalmolive Botanicals line.Having quickly added incre-mental share to the Palmolivebrand in Australia, Brazil andthe Philippines, this line will rollout broadly in 1999. In House-hold Care, understanding thetrend to combination dishwash-ing liquid & antibacterial handsoap products has helped gaindishwashing share in such markets as the U.S., France,Greece, Canada, Denmark,Australia and Venezuela. Andreinforcing Hill’s close associa-tion with veterinarians is Pre-scription Diet n/d, the firstproduct clinically proven toimprove both the quality andlength of life for dogs undergo-ing cancer treatment.
Market leadership alsoentails geographic expansion.Toothpaste has been intro-duced into 250 cities in China,100 of which have populationsof more than one millionpeople. Also, Colgate opera-
tions in Poland, Vietnam,Lebanon and Senegal were sig-nificantly expanded in 1998.
Starting with France in1997, Ajax Fête des Fleurs hasbeen introduced in 30 coun-tries, quickly boosting liquidcleaner leadership in most.And Hill’s expansion into17 new countries in the pastfive years has acceleratedits growth in pet nutrition.
Having the Right ProductMix for Each CountryThe Company’s dual strategyis to create innovative newproducts and offer choices forconsumers across the pricespectrum. Often, both premiumand budget products areoffered in the same country. InMexico, new premium stylingaids under the PalmoliveOptims brand brought incre-mental market share. So didnew varieties of Caprice haircare, a family value brand. InChina, Colgate introduced anentry-level toothbrush whilesimultaneously launchingColgate Total to more prosper-ous consumers.
The same holds true fordistribution. For small shops,Colgate adapts its packagedesigns to offer single-sizesachets, small refillable bottlesand paperboard cartons. Yetaround the corner, giant sup-erstores stack huge displaysof the same brands inlarger sizes.
Colgate excels at identify-ing big opportunities early,developing innovative newproducts to fulfill those needs,and quickly bringing them tomarket worldwide. In a chang-ing marketplace, Colgate pos-sesses the core strengths tocontinue to increase its globalleadership positions.
(continued from page 6)STRONGER MARKET LEADERSHIP
Softsoap Brand Body Wash,Five Varieties — United States
When research indicatedthat consumers wanted moreexperiential bathing products,Softsoap, the fast-growingbody wash, added new mood-evoking varieties at affordableprices. The line includesHydrating, Nourishing, Relax-ing, Refreshing and Soothingvariants. Double-digit volumegrowth resulted in 1998.
Number One Toothpaste Brand — Brazil
Colorful in-store displays,sweepstakes promotions andyouth-oriented advertising helpmake popular-priced SorrisoBrazil’s leading toothpaste.
Record Advertising Levels —Hill’s-United States
New advertising reinforces Hill’sclose ties with veterinarians,elevating the image of ScienceDiet brand pet food. Alsoadding to Hill‘s strong perfor-mance in 1998 was a series ofnew products, including thenew Science Diet dry andcanned varieties.
W H A T V E T S F E E D T H E I R P E T S
*The name and character Barney are trademarks of The Lyons Group. Barney is Reg. U.S. Pat. & TM. Off.

8Colgate’s Growing Success
Ajax Part of BiggestFloral Fiesta—GreeceSales of Ajax Fête des Fleurs rose
sharply after a winning promotion
in Greece. Bottles of the fragrant
cleaner were packed with flower
seed packs, and consumers received
free product samples and coupons.
Ajax Fête des Fleurs is a major new
global brand for Colgate.
Excellent Response toPalmolive Botanicals—PhilippinesColgate-Philippines, one of five lead
markets for a new line of Personal Care
products, has increased its shampoo
market share to 28 percent, further
strengthening Palmolive as the coun-
try’s top brand. The Palmolive Botani-
cals line offers natural ingredients and
a renewing experience. It will soon
include skin cleansers, linked by colors
and principal ingredients.
0
24
26
28
30
989796
%
25.8%
27.9%
30.0%European Liquid Cleaners
ACNielsen/IRI value market shares
Chart: Increasing its share of the
liquid cleaners market in Western
Europe, Colgate has added more
than four share points in two years.
0
24
26
28
30
4Q984Q974Q96
%
25.7%
25.5%
27.7%
Philippines Shampoo
ACNielsen value market shares
Chart: Strongly increasing its shampoo
market share since the final quarter of 1997:
Colgate-Philippines.

Colgate’s Growing Success9
Cutting order-cycle time meanshaving the right amount of theright product at the right placeat the right time. This savesmoney for Colgate and providesbetter service to customers. Forexample, when an order arrivedat Colgate-U.S. five years ago, ittook ten days to move productsto the store shelf. Today, ittakes four days, saving moneyand serving customers better.This improvement is happeningaround the world. In Brazil andAustralia, for example, shelfdelivery of Colgate products iscomparable to that of Colgate-United States.
Colgate’s increasingly effi-cient supply chain is centralto its financial strategy —increasing profit margins andreducing overhead. Meetingthese objectives enhancesfinancial power to invest in newproducts, increase advertisingand provide a healthy return to shareholders. Profitabilityset new all-time records forColgate in 1998. Gross profitmargin, earnings before inter-est and taxes (EBIT), andreturn on capital all improvedstrongly.
Contributions came fromacross geographies and cate-
gories. For example, stream-lined operations enabledColgate-Europe to increase1998 operating earnings by12 percent despite negativecurrency translation. The grossmargin for Colgate’s toothpastecategory has increased sixpercentage points since 1995,through global sourcing,regional manufacturing andother initiatives. Recentchanges in Colgate’s fabricsoftener business helpedgenerate record sales andoperating profits for thatcategory in 1998.
II. GREATER PROFITABILITY
Bringing Colgate’s Products to Consumers Faster and More Cost-Efficiently than Ever Before
High-Tech SoftwareBoosts GlobalEffectivenessColgate’s state-of-the-art data
center in Piscataway, NJ, has
replaced over 25 individual pro-
cessing centers worldwide. From
here, the Company manages
communication networks and the
advanced software — SAP — that
monitors activities across the
entire supply chain. Left to right:
Arthur Fleiss, Maria Zuliani, Ann
Marie Spiller, Deighton Weekes,
Joe Spitaleri and Anthony
Cernuto, Division Coordinators.

10Colgate’s Growing Success
Opportunities AheadSignificant profit potentiallies ahead — from technology,from regionalization, from stan-dardization and from creationof new processes for multi-country use.
Colgate has implementedhigh-tech global software, SAP,in the U.S., most of Europe,and part of Asia. The processis now under way in Latin Amer-ica and the rest of Asia. Inevery Colgate area where SAPhas been installed, customerservice performance is better,inventory levels are down, thecycle time of deliveries hasimproved and working capitalis lower.
At Colgate-U.S., for exam-ple, supply chain inventoryhas been reduced to half thatrequired just a few yearsago, while customer servicelevels have improved to 99percent. The end result is anearly 10 percent reduction inthe average cost of a deliveredcase of Colgate product.
The outstanding successof Colgate Total toothpastealso reflects the faster infor-mation flow SAP makes possi-ble. Within four weeks of itslaunch, Colgate Total attained90 percent distributionthroughout the United States.
Importantly, we expectgreater future benefits, sinceas SAP is expanded globally,implementation is faster andsmarter. In addition, we arepartnering with SAP on devel-oping new systems that reapmore benefits from Colgate’sexisting investment.
Regional/Global EfficienciesManufacturing consolidation,efficient purchasing, productharmonization and betterservice to different types ofretailers all contribute tofulfilling Colgate’s goal of being
Speed Stick in Multi-LanguagePacks — United StatesGlobal manufacturing for Mennen
Speed Stick deodorant at a single
location in Morristown, NJ, serves 48
different countries. Inspecting the
multi-language labeling, which
enables the same product to be
sold in broad regions, is Operator
Technician Marie Honachefsky.
the world’s most efficientglobal marketer of consumerproducts.
Global negotiation isColgate’s first priority for effi-cient purchasing. When thisis not possible, Colgate Region-al Purchasing Councils negoti-ate with a limited number ofsuppliers. Their objective is to get the highest quality rawmaterials at the lowest pricesin the various trade blockswhere Colgate does business.Approximately half of purchas-ing expenditures are madethrough these Councils, withsignificant additional contri-butions expected as thiseffort grows.
Consolidation of NorthAmerican and European manu-facturing at focused factorieshas strengthened profit mar-gins for both regions. Similar
(continued on page 11)
0
12
14
16
18
989796
%
13.2%
14.2%
15.9%
Chart: A key profitability
indicator, the EBIT margin
in 1998 increased by 1.7
percentage points to
15.9%, an all-time record.
EBIT Margin(Earnings Before Interest & Taxes)
(% to sales)

Colgate’s Growing Success11
Colgate has also takensteps to increase efficiency inthe ASEAN region. In December1998, a regional research cen-ter was established in thePhilippines. Regional sourcingof toothpaste and soap willbegin in spring 1999.
The Company is becomingbetter at servicing all of its cus-tomers, particularly in changingmarkets like Asia, where multi-national retailers are joiningtraditional stores on the retaillandscape. Meeting the differ-ent requirements of the mod-ern trade, such as morefrequent deliveries and exclu-sive consumer promotions,positions Colgate as the sup-plier of choice.
Continuous ImprovementColgate continues to focus onprofitable growth by allocating60 percent of the capitalexpenditure budget to pro-grams that pay back quickly.Projected rates of return aver-age over 40 percent. New capinjection molds for shampoo
(continued from page 10)
Distribution to Small Store — ChinaSelling to small retail outlets is
central to Colgate’s success in this
country of 1.3 billion people. Rapid
expansion to secondary and tertiary
cities has helped make Colgate the
leading Western brand in toothpaste
and toothbrushes.
GREATERPROFITABILITY
Speed-to-Market —United States Working closely with its largest
retail customers, Colgate schedules
shipments that enable truck-to-truck
transfers to place product directly on
store shelves, often arriving within 24
hours. This speed-to-market reduces
the amount of money tied up in
inventory and results in higher sales
and greater efficiency for Colgate
and its trade partners.
savings are beginning inother parts of the world.Today, in Latin America,toothpaste is made in ninefactories, down from 15, andtoothbrushes are made inthree facilities, compared withnine locations two years ago.A single facility in Mexico sup-plies liquid products for thatcountry and part of CentralAmerica.

12Colgate’s Growing Success
and shower gel in Europe willpay for themselves in less thanfour years. And installation oflaminate tube-making lines inBrazil, where Colgate leads thetoothpaste market, also willpay back in under four years.
All over the world, Colgatepeople are finding and imple-menting new and better pro-cesses. In the U.K. plant, anengineering team designedan enhanced system for guid-ing bottles through the linechangeover process, reducingdowntime from 11⁄2 hours to15 minutes. In Indiana, a teamreplaced the mechanical fin-gers used to transfer emptytubes to the toothpaste linewith a simple gravity feed sys-tem, an efficiency with poten-tial cost savings of $700,000.
The new ideas coming fromthe minds of Colgate peopleeverywhere are never-ending,and they provide ongoing sav-ings to meet aggressive prof-itability improvement targets tocontinue Colgate’s record ofstrong performance.
The World’s Largest andMost Efficient Toothpaste Cap Mold — Global
This steel mold is one of seven unitsaround the world producing 1.4billion flip-top toothpaste capsevery year. Developed in partnershipwith a global supplier, the unit, thelargest flip-top closure mold everbuilt, weighs one ton and efficientlyproduces 128 caps in a single15-second cycle.
Streamlined Production—Mexico
Colgate benefits fromeconomies of scale at thisintegrated liquids plant —a showcase for low-costproduction and technicalexcellence.
The modern four-year-old facility supplies liquidproducts, such as market-leading Suavitel fabricsoftener, for Mexico andpart of Central America.Monitoring quality controlis Alfredo HernándezGarcía, Operator.
Cost Savings from Structural Bottle
Under development foruse around the world, thisunique bottle saves Colgateboth time and money. It uses20 percent less plastic andlends itself to efficient fillingline and labeling proce-dures. It will be used for suchproducts as Ajax Fête desFleurs cleaner as it is rolledout globally.

Colgate’s Growing Success13
Colgate people are at the heartof the Company’s growing suc-cess. With 38,000 dedicatedemployees across all majorgeographies, Colgate benefitsfrom diverse cultural and mar-ket expertise. Colgate peopleexchange proprietary knowl-edge and work in multi-countryteams to develop the bestproducts, best manufacturingand best distribution.
Colgate teams are usingSAP integrated software and
saving millions of dollars. And as the experience of one region is transferred toanother, so too are the bestpractices. For example, whenemployees at the liquids plantin France developed a moreefficient way to switch produc-tion between products, reduc-ing the changeover process toone-fifth the time, that knowl-edge was passed along to ben-efit liquids production in Ohio.
Colgate marketers acrossEurope also teamed up to tell
III. THE POWER OF GLOBAL TEAMWORK
Colgate’s 38,000 Employees Sharing Across Borders—Delivering Results and Enhancing Shareholder Value
Creating Multi-CountryAdvertising — EuropeAt Colgate’s European headquarters
in Paris, a single advertising
campaign was developed to re-
launch Colgate Total across 16
countries in the European division.
This approach conveys the same
key benefits everywhere and saves
on creative and production costs. Left
to right: Helen Landau, Philippe
Sandt and Arturo Garcia, Directors
involved in the marketing launch.
14Colgate’s Growing Success
the story of Colgate Total,stressing its unique benefit ofworking both above and belowthe gum line to fight gingivitis.Citing new clinical support, themessage was carried acrossthe continent. This 16-countrycampaign has helped to addan average of one to two sharepoints to European marketshares for Colgate Total.
The power of globalteamwork is also seen in thecross-training that occurs Com-pany-wide. The average Colgateperson took part in seven daysof training in 1998, such as:
■ Key Account Managementtraining program, held inMexico City. Colgate execu-tives from Europe and NorthAmerica —experienced in sell-ing to large trade customerssuch as Wal-Mart —made pre-sentations to sales directorsfrom Asia and Latin America,markets that large chains arebeginning to enter.
■ Total Productive Mainte-nance training, held at fac-tories. The user-friendlycourses help reduce equip-ment downtime, increase pro-ductivity and improve safety.
■ Marketing Training pro-grams, held everywhere.Managers hone their skills inadvertising, consumer insight,effective promotions andmedia selection.
Global teamwork goes waybeyond market data and tech-nology. Developing the bestqualities in Colgate peoplemeans embracing core values,which involve caring for col-leagues, customers, consumersand the communities whereColgate does business. Colgateis recognized by many organiza-tions, including the U.S. Depart-ment of Labor, for effectiveprograms that enhance interper-sonal skills, and promoterespect and workforce diversity.This culture flows through to thebottom line and benefits allshareholders.
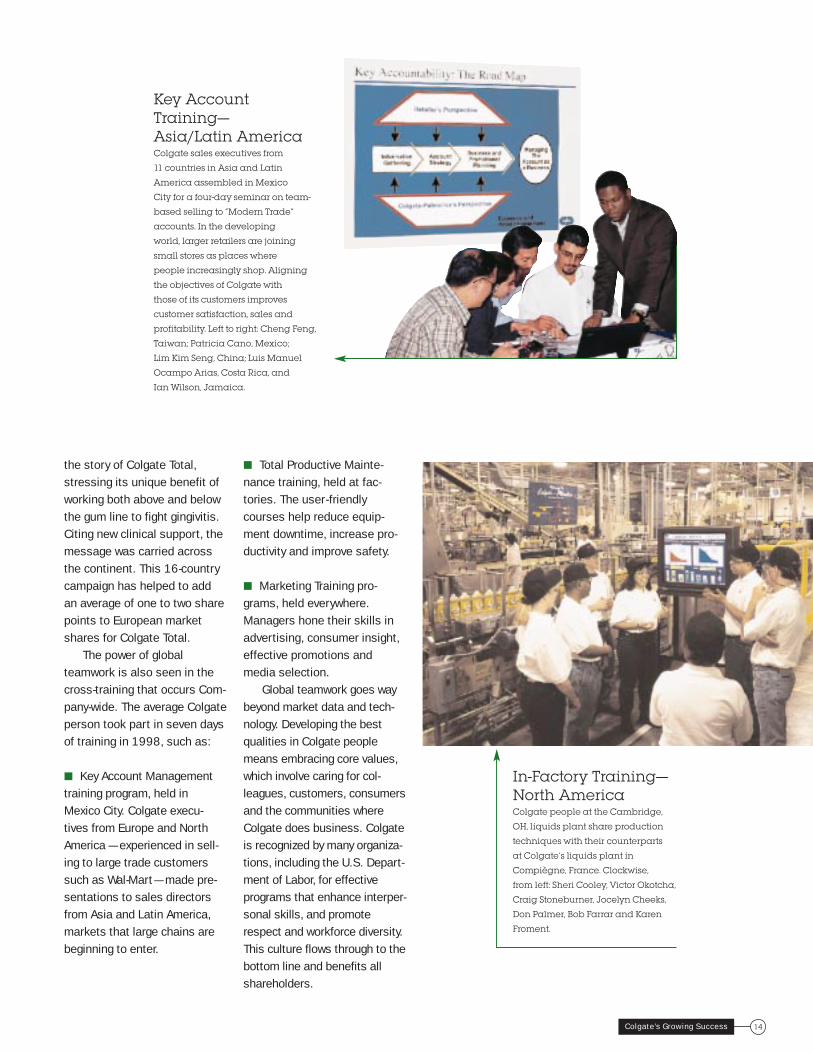
Key AccountTraining—Asia/Latin AmericaColgate sales executives from
11 countries in Asia and Latin
America assembled in Mexico
City for a four-day seminar on team-
based selling to “Modern Trade”
accounts. In the developing
world, larger retailers are joining
small stores as places where
people increasingly shop. Aligning
the objectives of Colgate with
those of its customers improves
customer satisfaction, sales and
profitability. Left to right: Cheng Feng,
Taiwan; Patricia Cano, Mexico;
Lim Kim Seng, China; Luis Manuel
Ocampo Arias, Costa Rica, and
Ian Wilson, Jamaica.
In-Factory Training—North AmericaColgate people at the Cambridge,
OH, liquids plant share production
techniques with their counterparts
at Colgate’s liquids plant in
Compiègne, France. Clockwise,
from left: Sheri Cooley, Victor Okotcha,
Craig Stoneburner, Jocelyn Cheeks,
Don Palmer, Bob Farrar and Karen
Froment.

Colgate’s Growing Success15
GLOBAL BUSINESS REVIEW
Colgate’s growing success reflects the Company’s ability to increasemarket leadership positions in the 213 countries and territories whereit does business. New products, aggressively supported by advertising,were a major contributor to Colgate’s 1998 growth. Most importantlaunches cut across several or all geographic regions. In keeping witha desirable geographic balance — approximately 55 percent of salescomes from Developed Markets and 45 percent from High GrowthMarkets — sales from new products are also balanced between thesetwo areas.
Colgate-Latin America had anexcellent year, with marketshare gains, successful newproduct introductions andinnovative programs to buildconsumption. Contributing tostrong Oral Care market sharesacross the region were ColgateSensation whitening andColgate Double Cool Stripetoothpastes, plus new herbalvariants for Sorriso in Brazil.Innovations in toothbrushesand rinses, for example, theColgate Sensation brush andSorriso herbal mouthwash,drove category growth in OralCare as well.
In fast-growing PersonalCare, Palmolive Botanicalsshampoo, Lady Speed Stickgel deodorant and Optims haircare products added incremen-tal market share in variouscountries. Global initiatives in home care also helpeddrive Latin America business
growth, most notably AjaxFiesta de Flores fragrancedcleaner and Suavitel vanillafabric softener.
Seven decades of history inLatin America, leading marketshares and considerable posi-tive momentum should standColgate in good stead in theface of current economic uncer-
tainty in Brazil. In Latin Amer-ica’s other large country, Mex-ico, Colgate market shares arehealthy, and sales and operat-ing profits continue to rise.New product activity and con-sumption building are alsostrong, as they are throughoutall of Latin America.
Colgate-Latin America
Mexico
Latin America
contributed 27% of sales,
or $2.4 billion, in 1998. Unit
volume grew 7% and
sales increased 2%,
affected by currency
translation. The region
includes Mexico, Central
America, South America
and the Caribbean.
16Colgate’s Growing Success
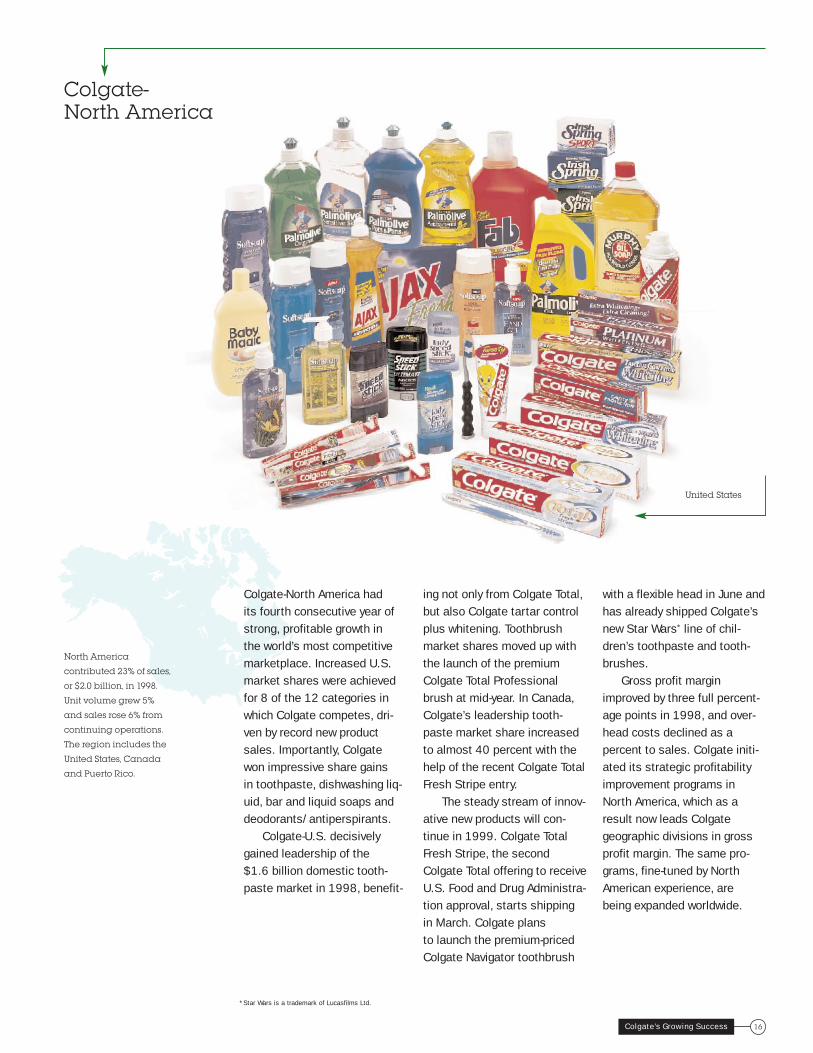
Colgate-North America hadits fourth consecutive year ofstrong, profitable growth inthe world’s most competitivemarketplace. Increased U.S.market shares were achievedfor 8 of the 12 categories inwhich Colgate competes, dri-ven by record new productsales. Importantly, Colgatewon impressive share gainsin toothpaste, dishwashing liq-uid, bar and liquid soaps anddeodorants/antiperspirants.
Colgate-U.S. decisivelygained leadership of the$1.6 billion domestic tooth-paste market in 1998, benefit-
ing not only from Colgate Total,but also Colgate tartar controlplus whitening. Toothbrushmarket shares moved up withthe launch of the premiumColgate Total Professionalbrush at mid-year. In Canada,Colgate’s leadership tooth-paste market share increasedto almost 40 percent with thehelp of the recent Colgate TotalFresh Stripe entry.
The steady stream of innov-ative new products will con-tinue in 1999. Colgate TotalFresh Stripe, the secondColgate Total offering to receiveU.S. Food and Drug Administra-tion approval, starts shippingin March. Colgate plansto launch the premium-pricedColgate Navigator toothbrush
with a flexible head in June andhas already shipped Colgate’snew Star Wars* line of chil-dren’s toothpaste and tooth-brushes.
Gross profit marginimproved by three full percent-age points in 1998, and over-head costs declined as apercent to sales. Colgate initi-ated its strategic profitabilityimprovement programs inNorth America, which as aresult now leads Colgate geographic divisions in grossprofit margin. The same pro-grams, fine-tuned by NorthAmerican experience, are being expanded worldwide.
United States
North America
contributed 23% of sales,
or $2.0 billion, in 1998.
Unit volume grew 5%
and sales rose 6% from
continuing operations.
The region includes the
United States, Canada
and Puerto Rico.
Colgate-North America
*Star Wars is a trademark of Lucasfilms Ltd.

Colgate’s Growing Success17
New product activity strength-ened Colgate’s Europeanmarket shares and leadingpositions, especially in thehigher margin segments ofOral, Personal and HouseholdCare. A relaunch of ColgateTotal toothpaste, advertisedwith new clinical support, hasadded market share to thebrand following its introduc-tion. Colgate Sensation whiten-ing toothpaste also had a verystrong year.
In other categories, AjaxFête des Fleurs liquid cleaner,Palmolive shower gels, Palm-olive dishwashing productsand Soupline peach fabric
softener all performed well.In Germany, the launch ofPalmolive Pots & Pans helpedput Colgate in the NumberOne position in dishwashingliquids.
In the U.K., the additionof three Palmolive showergel variants strengthenedColgate’s market position. Theline also succeeded especiallywell in Italy, Belgium, Portugaland Germany.
All categories contributedto the outstanding increasein operating profits. Colgatecontinues to make improve-ments throughout its Europeansupply chain with the imple-mentation of SAP integratedsoftware.
Efficiencies from regionalmanufacturing and purchasing,as well as lower distributioncosts should provide savingswell into the future.
Colgate-Asia/Africa
Colgate continues to buildconsumption in Asia/Africa,protect strong franchises andfocus activities in areas ofstrength. The very stronggrowth Colgate is achieving inChina helped in 1998 to par-tially offset economic weak-ness in the ASEAN countriesof Malaysia, the Philippinesand Thailand. Already theleading Western marketer oftoothpaste and toothbrushes,Colgate-China plans to
Colgate-Europe
Malaysia
Europe contributed 23% of sales, or
$2.1 billion, in 1998. Sales were
unchanged and would have
grown 1% without the effect of
currency translation and Russian
economic collapse. Unit volume
for Western Europe rose 2%.
Asia/Africa contributed 16% of
sales, or $1.5 billion, in 1998. Unit
volume decreased 1% on 12%
lower sales, reflecting currency
translation. This region covers
Asia, the South Pacific, Africa
and the Mid-East.
France

Hill’s had an excellent year.Record new product activity,increased advertising and geo-graphic expansion all fueledgrowth. A global leader in petnutrition, Hill’s continues tostrengthen its ties to veterinari-ans. Efficiency and customerservice improved, reflectinggreater productivity at the Hill’s-Europe factory and the benefitsof SAP, especially in inventorymanagement.
Record levels of advertisingsupported a U.S. campaignfor Science Diet, themed “WhatVets Feed Their Pets.” NewScience Diet products includedry varieties for cats, newcanned varieties in chunkand gravy form for cats, anddry varieties for dogs. A newproduct, Prescription Diet n/dfor dogs undergoing cancertreatment, received tremen-dous veterinarian acceptance.
The Prescription Diet pet foodline was also expanded toinclude new nutritional prod-ucts for pets with allergy andgastrointestinal problems.
Outside the U.S., Hill’s hadexcellent market share growthin Europe and Japan and bene-fited from continued extensionof Science Diet in Australiaand New Zealand. Expansion oftelevision advertising and newproducts tailored specificallyfor the Japanese market arestrengthening Hill’s leadershipposition. Hill’s has the NumberOne dry dog food market sharein Japan.
18Colgate’s Growing Success
Hill’s Pet Nutrition
increase its distribution areafrom the current 250 citiesto 400 in 1999. The ColgateSensation whitening tooth-paste and toothbrush werelaunched late in 1998.
Consumption in the ASEANcountries showed signs ofrecovery towards year-end.Colgate has taken steps tofurther enhance its strong mar-ket shares and improve effi-
ciency in this area. A regionalresearch center opened inthe Philippines in December.Regional sourcing of tooth-paste and soap begins inspring 1999. Market sharesare generally healthy. In thePhilippines, Colgate has addedmarket share in shampoo andtoothpaste. Malaysian sharesare up in toothpaste, laundrybars and liquid soaps.
In the South Pacific, as aresult of new product activity,Colgate-Australia increased keymarket shares in all major cat-egories. Palmolive Naturalsbecame the leading showergel brand, and Colgate-Australia became Number
One overall in body cleaningproducts. Toothbrush marketshare moved up five percent-age points, making ColgateNumber One.
Senegal is a good exampleof the Company’s consumption-building programs throughoutAfrica. Colgate has developeda unique indirect distributionsystem to assure that 8,000retail shops get a visit from asalesperson at least weekly.Both sales and key marketshares improved stronglyin 1998.
Senegal
Hill’s -Japan
The Hill’s business contributed 11%
of sales, or $1.0 billion, in 1998. Unit
volume grew 4% and sales rose 3%.
Selling its products in 68 countries,
Hill’s has almost all its sales in the
developed world.

Global Financial Review
Results of Operations
Reports of Management and
Independent Public Accountants
Consolidated Statements of Income
Consolidated Balance Sheets
Consolidated Statements of Retained
Earnings, Comprehensive Income
and Changes in Capital Accounts
Consolidated Statements of Cash Flows
Notes to Consolidated Financial Statements
Eleven-Year Financial Summary
Financial Contents Speed Stick Ultimate odor-fighting antiperspirant and Lady SpeedStick gel. Adding new market shares were Palmolive lemondishwashing liquid & antibacterial hand soap.
Sales in Latin America increased 2% on 7% volume growth.The largest increases were achieved in Mexico, Brazil, Venezuelaand Central America. Contributing to the strong growth in theregion were Oral and Personal Care sales. Increased Oral Caresales were driven by Colgate great regular flavor and Colgate Dou-ble Cool Stripe toothpastes. Personal Care sales were increasedby Palmolive Botanicals shampoo, Palmolive soap and ProtexFresh soap.
Sales in Europe remained flat in 1998 due to the effects ofweak economic conditions in Russia, while volume grew 1%. TheUnited Kingdom, Italy, Belgium and Greece achieved the strongestsales growth and volume increases in the region. Sales in theUnited Kingdom and other countries were helped by strong salesof Palmolive shower gels and Colgate Sensation whitening tooth-paste. The continued success of products such as Ajax Fêtes desFleurs, in three different fragrances, and the introduction of twonew dishwashing products also contributed to the volume increasein this highly competitive market.
Sales in the Asia/Africa region decreased 12% as volumedecreased 1%, reflecting weaker ASEAN currencies. Volumedeclined in the ASEAN countries of Malaysia, the Philippines andThailand, reflecting continued economic difficulties, and in Indiaas a result of aggressive competition. Partially offsetting declinesin the ASEAN countries were strong growth in China and increasesin Australia, Taiwan and Vietnam.
Sales for Hill’s Pet Nutrition increased 3% on 4% volumegrowth. Within the United States, sales of Prescription Diet prod-ucts increased due to the introduction of new products includingPrescription Diet n/d, the first product clinically proven to improvethe quality and life expectancy of dogs undergoing cancer treat-ment. Strongest growth occurred in Japan and Europe, whereintroduction of new products and increased advertising fueledthat growth.
In 1997, worldwide net sales increased 4% to $9,056.7 onvolume growth of 7%, reflecting volume increases by all divisions.North America posted overall sales and volume growth of 7%.In Europe, sales decreased 4% in 1997 on 5% higher volume,due primarily to weaker European currencies. Latin America ledthe Oral, Personal and Household Care segment with an 11%increase in sales on 10% volume growth. Sales in the Asia/Africaregion decreased 3%. Excluding divested businesses, sales in
Results of OperationsWorldwide Net Sales by Business Segment and Geographic Region 1998 1997 1996
Oral, Personal and Household CareNorth America (1) $2,047.5 $1,992.5 $1,869.0Latin America 2,407.9 2,363.8 2,124.8Europe 2,067.7 2,078.8 2,173.4Asia/Africa 1,452.6 1,656.3 1,713.1
Total Oral, Personal and Household Care 7,975.7 8,091.4 7,880.3Total Pet Nutrition (2) 995.9 965.3 868.7
Total Net Sales $8,971.6 $9,056.7 $8,749.0
(1) Sales in the United States for Oral, Personal and Household Care were$1,799.6, $1,756.1 and $1,610.4 in 1998, 1997 and 1996, respectively.
(2) Sales in the United States for Pet Nutrition were $688.6, $689.4 and $630.1in 1998, 1997 and 1996, respectively.
Net SalesWorldwide net sales decreased 1% to $8,971.6 in 1998 on vol-ume growth of 3.5%. Sales would have grown 6%, excluding theeffect of foreign exchange declines and divestments. Sales in theOral, Personal and Household Care segment decreased 1% on 3%volume growth, while sales in Pet Nutrition increased 3% on 4%volume growth.
In 1998, sales from continuing businesses in North Americaincreased 6% as unit volume rose 5%. Included in the stronggrowth in Oral Care were launches of new products such asColgate Total toothpaste, which was launched in late 1997.Success in Personal Care resulted from the launch of three newfragrance varieties of Softsoap body wash, Softsoap hand gel,
1
6
7
8
9
10
11
21
Colgate’s Growing Success1
Dollars in Millions Except Per Share Amounts

2Colgate’s Growing Success
Asia/Africa declined 2% on 5% volume growth. The Pet Nutritionsegment increased sales 11% on 9% volume gains.
Gross ProfitGross profit margin increased to 52.2%, above both the 1997level of 50.7% and the 1996 level of 49.1%. This favorable trendreflects the Company’s financial strategy to improve all aspectsof its supply chain through global sourcing, restructuring andother cost reduction initiatives, as well as its emphasis on highermargin products.
Selling, General and Administrative ExpensesSelling, general and administrative expenses as a percentage ofsales were generally level: 36% in 1998, 36% in 1997 and 35% in1996, reflecting higher advertising costs offset by the Company’scontinued focus on expense containment.
Other Expense, NetOther expense, net, consists principally of amortization of good-will and other intangible assets, minority interest in earnings ofless-than-100%-owned consolidated subsidiaries, earnings fromequity investments and other miscellaneous gains and losses.Other expense, net, decreased in 1998 from $72.4 to $61.2,primarily due to lower amortization expense and gains from salesof non-core product lines and other assets.
During the third quarter of 1998, the Company divested certainnon-core brands and recorded a one-time pretax gain of $42.4($26.0 aftertax) on the sale of the U.S. HandiWipes brand, whichwas offset by one-time charges, primarily to cover a decision tosubstantially reduce the Company’s operations in Russia, follow-ing the severe contraction of the Russian economy, as well as theCompany’s continuing program of product standardization andorganization redesign. The pretax charge for Russia was $25.0,which covered a write-down of assets, employee terminationcosts and the settlement of contractual obligations, which weresubstantially implemented before year-end.
Worldwide Earnings by Business Segment and Geographic Region 1998 1997 1996
Oral, Personal and Household CareNorth America $ 395.5 $ 312.6 $ 258.2Latin America 502.0 483.0 410.7Europe 317.5 283.5 280.7Asia/Africa 158.6 178.3 215.3
Total Oral, Personal and Household Care 1,373.6 1,257.4 1,164.9Total Pet Nutrition 173.8 162.5 127.3Corporate (124.4) (134.1) (140.2)
Earnings Before Interest and Taxes 1,423.0 1,285.8 1,152.0Interest Expense, Net (172.9) (183.5) (197.4)
Income Before Income Taxes $1,250.1 $1,102.3 $ 954.6
Earnings Before Interest and Taxes (EBIT)EBIT increased 11% in 1998 to $1,423.0 compared with$1,285.8 in 1997. EBIT for the Oral, Personal and HouseholdCare segment was up 9%, with North America, Latin America and
Europe posting gains of 27%, 4% and 12%, respectively. TheNorth America and Europe profitability increase includes theeffect of higher margins on higher volumes. In Latin America, theincrease in profitability was 3% less than the increase in volume,primarily due to the impact of foreign exchange. EBIT in Asia/Africa decreased 11%, reflecting weakened economies in theASEAN countries and increased competition in India. EBIT in thePet Nutrition segment increased 7% on both higher volumes andgross profit margins.
Interest Expense, NetInterest expense, net, was $172.9 compared with $183.5 in 1997and $197.4 in 1996. The decline in interest expense is primarilythe result of lower average debt levels during the year comparedwith 1997 and a decrease in interest rates.
Income TaxesThe effective tax rate on income was 32.1% in 1998 versus32.8% in 1997 and 33.5% in 1996. Global tax planning strate-gies, including the realization of tax credits, benefited theeffective tax rate in all three years presented.
Net IncomeNet income was $848.6 in 1998 or $2.81 per share comparedwith $740.4 in 1997 or $2.44 per share and $635.0 in 1996 or$2.09 per share.
1998 1997 1996
Identifiable AssetsOral, Personal and Household Care
North America $2,591.0 $2,553.2 $2,531.4Latin America 2,128.3 2,204.8 2,365.1Europe 1,329.9 1,201.5 1,236.3Asia/Africa 952.4 891.9 1,001.5
Total Oral, Personal and Household Care 7,001.6 6,851.4 7,134.3Total Pet Nutrition 502.6 517.3 578.6Total Corporate 181.0 170.0 188.6
Total Identifiable Assets (1) $7,685.2 $7,538.7 $7,901.5
(1) Long-lived assets in the United States, primarily fixed assets and goodwill,represented approximately one-third of total long-lived assets of $5,330.0,$5,234.9 and $5,415.6 in 1998, 1997 and 1996, respectively.
Liquidity and Capital ResourcesNet cash provided by operations increased 7.4% to $1,178.8 com-pared with $1,097.8 in 1997 and $917.4 in 1996. The increasesreflect the Company’s improved profitability, lower cash taxes andworking capital management. Cash generated from operationswas used to fund capital spending, repurchase stock andincrease dividends.
During 1998, long-term debt increased from $2,518.6 to$2,582.2 and total debt increased from $2,677.1 to $2,757.5.The increase includes additional net issuances of medium-termnotes of approximately $210 partially offset by lower commercialpaper borrowings.
2Colgate’s Growing Success
Dollars in Millions Except Per Share Amounts

Colgate’s Growing Success3
As of December 31, 1998,$461.2 of domestic and foreigncommercial paper was outstand-ing. These borrowings carry a Stan-dard & Poor’s rating of A1 and aMoody’s rating of P1. The commer-cial paper as well as other short-term borrowings are classified aslong-term debt at December 31,1998, as it is the Company’s intentand ability to refinance such obliga-tions on a long-term basis. The Com-pany has additional sources ofliquidity available in the form of linesof credit maintained with various banks. At December 31, 1998,such unused lines of credit amounted to $1,670.9. In addition, atDecember 31, 1998, the Company had $203.8 available underpreviously filed shelf registrations.
As of December 31, 1997, $607.5 of domestic and foreigncommercial paper was outstanding. An unused line of credit ofapproximately $1,586.4 was available in addition to $697.8 avail-able under previously filed shelf registrations.
In 1996, the Company entered into a $496.3 loan agreementand obtained a $406.0 term loan with foreign commercial banks.In addition, the Company issued $100.0 of notes in a privateplacement and issued $75.0 medium-term notes under previ-ously filed shelf registrations.
The ratio of net debt to total capitalization (defined as the ratioof the book values of debt less cash and marketable securities[“net debt”] to net debt plus equity) increased to 55% during1998 from 53% in 1997. The ratio had decreased in 1997 from58% in 1996. The increase in 1998 was primarily the result ofincreased borrowings related to stock repurchases offset partiallyby operating cash flow.
1998 1997 1996
Capital ExpendituresNorth America $ 90.1 $114.2 $119.8Latin America 99.2 105.2 86.1Europe 83.7 104.6 107.3Asia/Africa 80.5 104.9 85.6
Total Oral, Personal and Household Care 353.5 428.9 398.8
Total Pet Nutrition 20.7 29.8 45.4Total Corporate 15.4 19.8 14.8
Total Capital Expenditures $389.6 $478.5 $459.0
Depreciation and AmortizationNorth America $ 95.6 $ 87.1 $ 77.1Latin America 75.6 70.2 77.4Europe 67.9 68.0 71.0Asia/Africa 42.1 45.4 43.8
Total Oral, Personal and Household Care 281.2 270.7 269.3
Total Pet Nutrition 32.5 32.1 30.1Total Corporate 16.6 17.1 16.9
Total Depreciation and Amortization $330.3 $319.9 $316.3
Capital expenditures were 4%, 5% and 5% of net sales for 1998,1997 and 1996, respectively. Capital spending continues to befocused primarily on projects that yield high aftertax returns,thereby reducing the Company’s cost structure. The higher levelsin 1997 and 1996 primarily reflect capital spending relating tothe Company’s restructuring programs. Capital expenditures for1999 are expected to continue at the current rate of approxi-mately 4% of net sales.
Other investing activities in 1998, 1997 and 1996 includedstrategic acquisitions and divestitures around the world. Theaggregate purchase price of all 1998, 1997 and 1996 acquisi-tions was $22.6, $20.3 and $38.5, respectively. The HandiWipesbrand was sold in 1998, and the Sterno fuel brand was sold in1997. The aggregate sale price of all 1998, 1997 and 1996 salesof brands was $57.4, $101.4 and $25.1, respectively.
The Company repurchases com-mon shares in the open market andprivate transactions to provide foremployee benefit plans and tomaintain its targeted capital struc-ture. Aggregate repurchases for1998 were 7.1 million shares, witha total purchase price of $542.5.In 1997, 2.8 million shares wererepurchased with a total purchaseprice of $175.1.
Dividend payments were $345.6,up from $333.4 in 1997 and $296.2in 1996. Common stock dividendpayments increased to $1.10 pershare in 1998 from $1.06 per sharein 1997 and $.94 per share in 1996. The Series B PreferenceStock dividends were declared and paid at the stated rate of$4.88 per share in all three years.
Internally generated cash flows appear to be adequate to sup-port currently planned business operations, acquisitions andcapital expenditures. Significant acquisitions would require externalfinancing.
The Company is a party to various superfund and other envi-ronmental matters and is contingently liable with respect to law-suits, taxes and other matters arising out of the normal course ofbusiness. Management proactively reviews and manages its expo-sure to, and the impact of, environmental matters. While it is pos-sible that the Company’s cash flows and results of operations inparticular quarterly or annual periods could be affected by theone-time impacts of the resolution of such contingencies, it is theopinion of management that the ultimate disposition of these mat-ters, to the extent not previously provided for, will not have a mate-rial impact on the Company’s financial condition or ongoing cashflows and results of operations.
Dollars in Millions Except Per Share Amounts
0
12
16
20
24
989796
%
15.8%18.0%
20.4%
Aftertax Return on Capital
Chart: Colgate’s return
on capital increased by
2.4 percentage points to
20.4% in 1998, reflecting
improved profitability as
well as effectiveness in
managing capital.
0
600
800
1,000
$1,200
989796
$917.4
$1,097.8$1,178.0
Cash Flow from Operations
($ millions)
Chart: Colgate’s improved
profitability helped increase
cash flow to a record
$1,178.0 in 1998.

4Colgate’s Growing Success
market risk of such instruments should not be construed as anendorsement of their accuracy or the accuracy of the relatedassumptions. The Company utilizes a Value-at-Risk (VAR) modeland an Earnings-at-Risk (EAR) model that are intended to measurethe maximum potential loss in its interest rate and foreignexchange financial instruments assuming adverse market condi-tions occur, given a 95% confidence level. The models utilize a vari-ance/covariance modeling technique. Historical interest rates andforeign exchange rates from the preceding year are used to esti-mate the volatility and correlation of future rates. The estimatedmaximum potential one-day loss in fair value of interest rate or for-eign exchange rate instruments, calculated using the VAR model,is not material to the consolidated financial position, results ofoperations or cash flows of the Company. The estimated maximumyearly loss in earnings due to interest rate or foreign exchange rateinstruments, calculated utilizing the EAR model, is not material tothe Company’s results of operations. Actual results in the futuremay differ materially from these projected results due to actualdevelopments in the global financial markets.
A discussion of the Company’s accounting policies for financialinstruments is included in the Summary of Significant AccountingPolicies in the Notes to the Consolidated Financial Statements,and further disclosure relating to financial instruments is includedin the Fair Value of Financial Instruments note.
Year 2000 UpdateThe Company has developed plans to address the possible expo-sures related to the year 2000 on the Company’s internal systemsand equipment. In the critical area of internal operating systems,in 1994 the Company decided to convert its worldwide businesssystems to SAP, which is year 2000 compliant. The Company’sconversion to SAP is progressing on schedule, with conversion inoperations representing over 70% of the Company’s global busi-ness to be complete by mid-year 1999. When completed, theCompany’s investment in SAP systems will cumulatively totalapproximately $430, half of which will be capitalized and theremainder expensed as incurred. The computer systems andembedded microprocessors and control systems in all operationsare planned to be made compliant by June 30, 1999.
The Company is also in discussions with suppliers and cus-tomers to assess the potential impact on operations in the eventtheir systems are not made compliant.
The first two phases of the year 2000 project plan —formingteams at the corporate, division and subsidiary levels worldwide,and the inventory of systems and equipment —were complete atJuly 31, 1998. The third phase, risk assessment and contingencyplanning, is substantially complete with respect to all internalcomputing systems and embedded chips and is under way with respect to critical external business partners.
The fourth phase, planned to be substantially completed by the end of the first quarter of 1999, will be to accomplish systems testing, remediation and contingency plans regardingcritical systems and equipment with a high risk assessment. Contingency planning for suppliers includes backup proceduresand processes, alternative suppliers and increases in inventory
Status of Restructuring ReserveIn September 1995, a reserve of $460.5 was established tocover a worldwide restructuring of manufacturing and administra-tive operations. The primary elements of the reserve related toemployee termination costs and expenses associated with therealignment of the Company’s global manufacturing operations,as well as settlement of contractual obligations. The costs ofcompleting the restructuring activities to date approximated theoriginal estimate. As planned, the restructuring has produced savings that increase pretax earnings by over $150 annually.
The planned restructuring projects, primarily in North Americaand Europe but also affecting Hill’s Pet Nutrition and Colgate loca-tions in Asia/Africa and certain Latin America locations, are sub-stantially completed. The remaining reserve amount of $39.6primarily covers the reconfiguring of two factories in Asia/Africaand the consolidation of administrative operations following theimplementation of SAP computer systems and related processchanges in Europe and Asia/Africa. All remaining projects will becompleted in 1999. The financing for remaining cash require-ments will come from operations.
Managing Foreign Currency and Interest Rate ExposureThe Company is exposed to market risk from foreign currencyexchange rate fluctuations and interest rates. To manage thevolatility relating to foreign currency exposures on a consolidatedbasis, the Company utilizes a number of techniques, includingselective borrowings in local currencies, purchases of forward for-eign currency exchange contracts, balance sheet managementand increases in selling prices.
The Company operates in over 200 countries and territoriesand is exposed to currency fluctuation related to manufacturingand selling its products in currencies other than the U.S. dollar.The major foreign currency exposures involve the markets inMexico, Brazil and France, each of which represents individually6% to 8% of worldwide sales. Each of the other countries’ opera-tions represent less than 4% of worldwide sales. In the countriesof Mexico, Brazil and France during the three-year period from1996 to 1998, the combination of selling price increases andcost containment measures have more than offset the impact offoreign currency rate movements resulting in increased grossprofit margins during the periods presented.
The Company utilizes simple instruments such as interest rateswaps to manage the Company’s mix of fixed and floating ratedebt. The Company’s target floating rate obligations as a percent-age of the Company’s global debt is set by policy. As a matter ofpolicy, the Company does not speculate in financial markets andtherefore does not hold or issue derivative financial instrumentsfor trading purposes.
Value at RiskThe Company’s risk management procedures include the monitor-ing of interest rate and foreign exchange exposures and the Com-pany’s offsetting hedge positions utilizing analytical analysis ofcash flows, market value, sensitivity analysis and value-at-riskestimations. However, the use of these techniques to quantify the
Dollars in Millions Except Per Share Amounts

Colgate’s Growing Success5
Dollars in Millions Except Per Share Amounts
levels. Review of data interface capability of key business part-ners and all remaining internal testing and plan implementationare scheduled to be substantially completed by mid-year 1999 inthe fifth phase of the project. Progress against project plan time-lines is monitored through a system of internal reporting and ispresented to senior management and the Audit Committee of the Board of Directors or the full Board on a frequent basis.
The Company currently estimates that the total incrementalcost, including external contractor costs, costs to modify existingsystems and costs of internal resources dedicated to preparingfor the year 2000, to be approximately $30, of which 40% hasbeen spent to date. These costs are charged to expense asincurred and are incremental to the above noted investment inSAP systems which were previously planned and in the processof being implemented.
The Company is taking steps to prevent major interruptions inthe business related to year 2000 issues. The effect, if any, if theCompany, its suppliers or the public sector is not fully year 2000compliant is not reasonably estimable. The Company believes,however, that the successful completion of its year 2000 projectwill significantly reduce the risk of a major business interruptiondue to year 2000 failures.
Conversion to the Euro CurrencyOn January 1, 1999, certain member countries of the EuropeanUnion established fixed conversion rates between their existingcurrencies and adopted the euro as their new common legalcurrency. As of that date, the euro began trading on currencyexchanges and the legacy currencies were to remain legal tenderin the participating countries for a transition period betweenJanuary 1, 1999 and January 1, 2002.
The Company is addressing most of the issues involved withthe introduction of the euro through its worldwide conversion tothe SAP system. The more important issues facing the Companyinclude reassessing currency risk and processing tax andaccounting records.
Based upon progress to date, the Company believes that useof the euro will not have a significant impact on the manner inwhich it conducts its business affairs and processes its businessand accounting records. Accordingly, conversion to the euro is notexpected to have a material effect on the Company’s financialcondition, cash flows or results of operations.
OutlookLooking forward into 1999, the Company is well positioned forstrong growth in most of its markets, particularly North Americaand Western Europe. However, movements in foreign currencyexchange rates can impact future operating results as measuredin U.S. dollars. In particular, recent economic turmoil in Brazil andcontinued economic uncertainty in Asia may impact the overallresults of Latin America and Asia/Africa. Projected growth inthese parts of the world may be tempered until these economiesbecome more stable.
During 1998, as required by generally accepted accountingprinciples, the Company ceased to account for its Brazilianoperations as highly inflationary as historical inflation levels hadfallen sharply. However, since the close of 1998, the Braziliancurrency has devalued sharply. Based on management’s best esti-mates and events to date, this devaluation will result in a chargeto cumulative translation adjustments of approximately $250 tobe recognized in 1999 which will be, in effect, a write-down of ourforeign-currency-denominated assets (primarily goodwill and prop-erty, plant and equipment). This will be accompanied by loweramortization and depreciation expense in future periods. TheCompany remains cautious on the outlook for operations in Brazilin 1999. Management expects that the net impact on 1999results of operations will be a reduction of net income of approxi-mately $20 to $25, primarily in the first quarter. In addition, effec-tive January 1999, the Company’s operations in Mexico will nolonger be accounted for as highly inflationary. The effect of thischange on future results of operations is not determinable.
The Company expects the continued success of Colgate Totaltoothpaste, using patented proprietary technology, to bolsterworldwide Oral Care leadership and expects new products in allother categories to add potential for further growth. Overall, sub-ject to global economic conditions, the Company does not expectthe 1999 market conditions to be materially different from thoseexperienced in 1998 and the Company expects its positivemomentum to continue. Historically, the consumer productsindustry has been less susceptible to changes in economicgrowth than many other industries, and therefore the Companyconstantly evaluates projects that will focus operations on opportunities for enhanced growth potential. Over the long term,Colgate’s continued focus on its consumer products business andthe strength of its global brand names, its broad internationalpresence in both developed and developing markets, and itsstrong capital base all position the Company to take advantage of growth opportunities and to continue to increase profitabilityand shareholder value.
Forward-Looking StatementsReaders are cautioned that the Results of Operations and othersections of this report contain forward-looking statements thatare based on management’s estimates, assumptions and projec-tions. A description of some of the factors that could cause actualresults to differ materially from expectations expressed in theCompany’s forward-looking statements set forth in the Company’sForm 8-K filed with the Securities and Exchange Commission onNovember 13, 1998 under the caption “Cautionary Statement onForward-Looking Statements,” is incorporated herein by reference.These factors include, but are not limited to, the risks associatedwith international operations, the activities of competitors, retailtrade practices, the success of new product introductions, costpressures, manufacturing and environmental matters.

Colgate’s Growing Success
To the Board of Directors and Shareholders of Colgate-Palmolive Company:
We have audited the accompanying consolidated balance sheetsof Colgate-Palmolive Company (a Delaware corporation) and sub-sidiaries as of December 31, 1998 and 1997, and the relatedconsolidated statements of income, retained earnings, compre-hensive income and changes in capital accounts, and cash flowsfor each of the three years in the period ended December 31,1998. These financial statements and the schedules referred tobelow are the responsibility of the Company’s management. Ourresponsibility is to express an opinion on these financial state-ments and schedules based on our audits.
We conducted our audits in accordance with generallyaccepted auditing standards. Those standards require that weplan and perform the audit to obtain reasonable assurance aboutwhether the financial statements are free of material misstate-ment. An audit includes examining, on a test basis, evidence sup-porting the amounts and disclosures in the financial statements.An audit also includes assessing the accounting principles usedand significant estimates made by management, as well as evalu-ating the overall financial statement presentation. We believe thatour audits provide a reasonable basis for our opinion.
In our opinion, the financial statements referred to above pre-sent fairly, in all material respects, the financial position of Colgate-Palmolive Company and subsidiaries as of December 31, 1998and 1997, and the results of their operations and their cash flowsfor each of the three years in the period ended December 31,1998, in conformity with generally accepted accounting principles.
Our audit was made for the purpose of forming an opinion onthe basic financial statements taken as a whole. The scheduleslisted in the index to financial statements are presented for pur-poses of complying with the Securities and Exchange Commis-sion’s rules and are not part of the basic financial statements.These schedules have been subjected to the auditing proceduresapplied in the audit of the basic financial statements and, in ouropinion, fairly state in all material respects the financial datarequired to be set forth therein in relation to the basic financialstatements taken as a whole.
New York, New YorkFebruary 2, 1999
The management of Colgate-Palmolive Company has prepared theaccompanying consolidated financial statements and is responsi-ble for their content as well as other information contained in thisannual report. These financial statements have been prepared inaccordance with generally accepted accounting principles andnecessarily include amounts which are based on management’sbest estimates and judgments.
The Company maintains a system of internal accounting con-trol designed to be cost-effective while providing reasonableassurance that assets are safeguarded and that transactions areexecuted in accordance with management’s authorization and areproperly recorded in the financial records. Internal control effec-tiveness is supported through written communication of policiesand procedures, careful selection and training of personnel, andaudits by a professional staff of internal auditors. The Company’scontrol environment is further enhanced through a formal Code ofConduct which sets standards of professionalism and integrity foremployees worldwide.
The Company has retained Arthur Andersen LLP, independentpublic accountants, to examine the financial statements. Theiraccompanying report is based on an examination conducted inaccordance with generally accepted auditing standards, whichincludes a review of the Company’s systems of internal control aswell as tests of accounting records and procedures sufficient toenable them to render an opinion on the Company’s financialstatements.
The Audit Committee of the Board of Directors is composedentirely of non-employee directors. The Committee meets periodi-cally and independently throughout the year with management,internal auditors and the independent accountants to discuss theCompany’s internal accounting controls, auditing and financialreporting matters. The internal auditors and independent accoun-tants have unrestricted access to the Audit Committee.
Reuben Mark Stephen C. PatrickChairman and Chief Financial OfficerChief Executive Officer
Report of Independent Public Accountants
6Colgate’s Growing Success
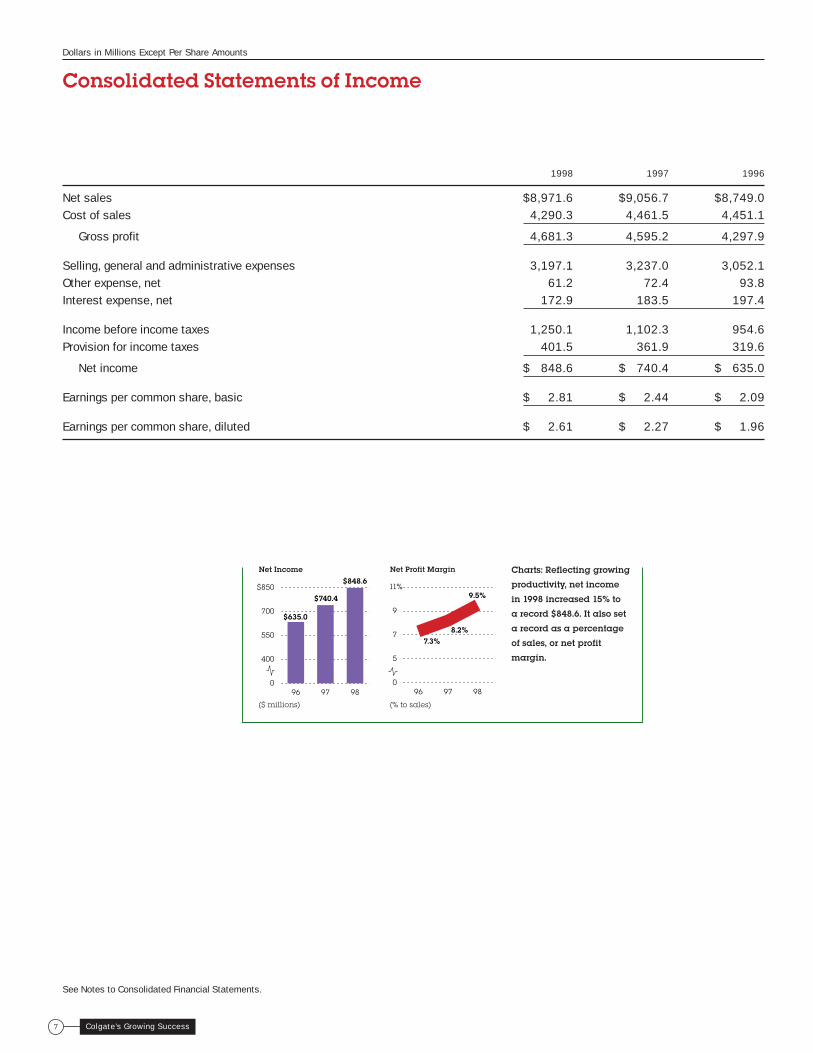
Colgate’s Growing Success7
See Notes to Consolidated Financial Statements.
1998 1997 1996
Net sales $8,971.6 $9,056.7 $8,749.0Cost of sales 4,290.3 4,461.5 4,451.1
Gross profit 4,681.3 4,595.2 4,297.9
Selling, general and administrative expenses 3,197.1 3,237.0 3,052.1Other expense, net 61.2 72.4 93.8Interest expense, net 172.9 183.5 197.4
Income before income taxes 1,250.1 1,102.3 954.6Provision for income taxes 401.5 361.9 319.6
Net income $ 848.6 $ 740.4 $ 635.0
Earnings per common share, basic $ 2.81 $ 2.44 $ 2.09
Earnings per common share, diluted $ 2.61 $ 2.27 $ 1.96
Dollars in Millions Except Per Share Amounts
Consolidated Statements of Income
0
400
550
700
$850
989796
$635.0
$740.4
$848.6Net Income
0
5
7
9
11
989796
%
7.3%8.2%
9.5%
Net Profit Margin
(% to sales)
Charts: Reflecting growing
productivity, net income
in 1998 increased 15% to
a record $848.6. It also set
a record as a percentage
of sales, or net profit
margin.
($ millions)

8Colgate’s Growing Success
Dollars in Millions Except Per Share Amounts
Consolidated Balance Sheets
See Notes to Consolidated Financial Statements.
1998 1997
AssetsCurrent Assets
Cash and cash equivalents $ 181.7 $ 183.1Marketable securities 12.8 22.2Receivables (less allowances of $35.9 and $35.8, respectively) 1,085.6 1,037.4Inventories 746.0 728.4Other current assets 218.8 225.4
Total current assets 2,244.9 2,196.5
Property, plant and equipment, net 2,589.2 2,441.0Goodwill and other intangibles, net 2,524.1 2,585.3Other assets 327.0 315.9
$7,685.2 $7,538.7
Liabilities and Shareholders’ EquityCurrent Liabilities
Notes and loans payable $ 175.3 $ 158.4Current portion of long-term debt 281.6 178.3Accounts payable 726.1 716.9Accrued income taxes 74.2 67.0Other accruals 857.2 838.9
Total current liabilities 2,114.4 1,959.5
Long-term debt 2,300.6 2,340.3Deferred income taxes 448.0 284.5Other liabilities 736.6 775.8
Shareholders’ EquityPreferred stock 376.2 385.3Common stock, $1 par value (1,000,000,000 shares authorized, 366,426,590 shares issued) 366.4 366.4Additional paid-in capital 1,191.1 1,027.4Retained earnings 3,641.0 3,138.0Cumulative translation adjustments (799.8) (693.7)
4,774.9 4,223.4Unearned compensation (355.5) (364.5)Treasury stock, at cost (2,333.8) (1,680.3)
Total shareholders’ equity 2,085.6 2,178.6
$7,685.2 $7,538.7
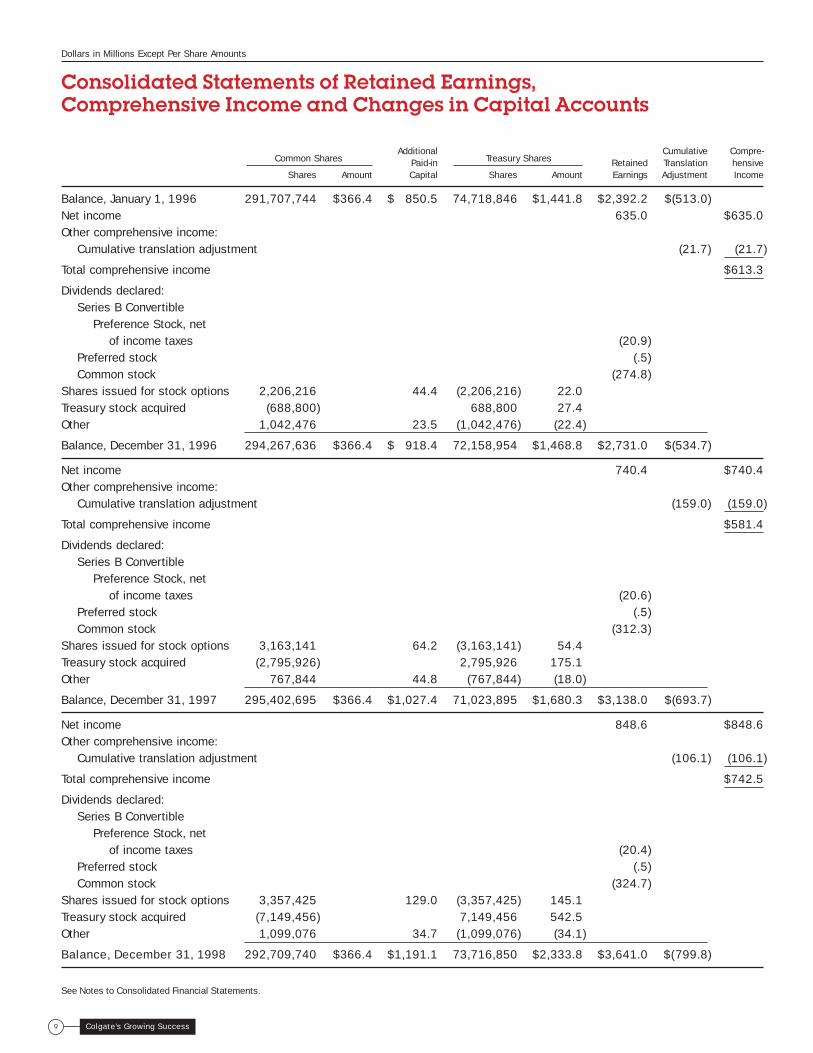
Colgate’s Growing Success9
See Notes to Consolidated Financial Statements.
Common SharesAdditional
Treasury SharesCumulative Compre-
Paid-in Retained Translation hensiveShares Amount Capital Shares Amount Earnings Adjustment Income
Balance, January 1, 1996 291,707,744 $366.4 $ 850.5 74,718,846 $1,441.8 $2,392.2 $(513.0)Net income 635.0 $635.0Other comprehensive income:
Cumulative translation adjustment (21.7) (21.7)
Total comprehensive income $613.3
Dividends declared:Series B Convertible
Preference Stock, net of income taxes (20.9)
Preferred stock (.5)Common stock (274.8)
Shares issued for stock options 2,206,216 44.4 (2,206,216) 22.0Treasury stock acquired (688,800) 688,800 27.4Other 1,042,476 23.5 (1,042,476) (22.4)
Balance, December 31, 1996 294,267,636 $366.4 $ 918.4 72,158,954 $1,468.8 $2,731.0 $(534.7)
Net income 740.4 $740.4Other comprehensive income:
Cumulative translation adjustment (159.0) (159.0)
Total comprehensive income $581.4
Dividends declared:Series B Convertible
Preference Stock, net of income taxes (20.6)
Preferred stock (.5)Common stock (312.3)
Shares issued for stock options 3,163,141 64.2 (3,163,141) 54.4Treasury stock acquired (2,795,926) 2,795,926 175.1Other 767,844 44.8 (767,844) (18.0)
Balance, December 31, 1997 295,402,695 $366.4 $1,027.4 71,023,895 $1,680.3 $3,138.0 $(693.7)
Net income 848.6 $848.6Other comprehensive income:
Cumulative translation adjustment (106.1) (106.1)
Total comprehensive income $742.5
Dividends declared:Series B Convertible
Preference Stock, net of income taxes (20.4)
Preferred stock (.5)Common stock (324.7)
Shares issued for stock options 3,357,425 129.0 (3,357,425) 145.1Treasury stock acquired (7,149,456) 7,149,456 542.5Other 1,099,076 34.7 (1,099,076) (34.1)
Balance, December 31, 1998 292,709,740 $366.4 $1,191.1 73,716,850 $2,333.8 $3,641.0 $(799.8)
Dollars in Millions Except Per Share Amounts
Consolidated Statements of Retained Earnings, Comprehensive Income and Changes in Capital Accounts

Dollars in Millions Except Per Share Amounts
1998 1997 1996
Operating ActivitiesNet income $ 848.6 $ 740.4 $ 635.0Adjustments to reconcile net income to net cash provided by operations:
Restructured operations (34.8) (48.5) (105.6)Depreciation and amortization 330.3 319.9 316.3Income taxes and other, net 60.7 18.5 13.2Cash effects of changes in:
Receivables (15.2) (61.6) (15.4)Inventories (19.5) (50.9) (1.2)Payables and accruals 8.7 180.0 75.1
Net cash provided by operations 1,178.8 1,097.8 917.4
Investing ActivitiesCapital expenditures (389.6) (478.5) (459.0)Payment for acquisitions, net of cash acquired (22.6) (31.5) (59.3)Sale of non-core product lines 57.4 96.4 25.1Sale of marketable securities and investments 18.7 68.5 1.2Other (15.8) 7.7 (12.0)
Net cash used for investing activities (351.9) (337.4) (504.0)
Financing ActivitiesPrincipal payments on debt (677.5) (670.7) (1,164.6)Proceeds from issuance of debt 762.9 350.4 1,077.4Dividends paid (345.6) (333.4) (296.2)Purchase of common stock (542.5) (175.1) (27.4)Other (27.3) 15.8 39.2
Net cash used for financing activities (830.0) (813.0) (371.6)
Effect of exchange rate changes on cash and cash equivalents 1.7 (12.5) (2.4)
Net (decrease) increase in cash and cash equivalents (1.4) (65.1) 39.4
Cash and cash equivalents at beginning of year 183.1 248.2 208.8
Cash and cash equivalents at end of year $ 181.7 $ 183.1 $ 248.2
Supplemental Cash Flow InformationIncome taxes paid $ 273.8 $ 261.3 $ 273.0Interest paid 202.8 230.6 229.1Principal payments on ESOP debt, guaranteed by the Company 6.1 5.5 5.0
Consolidated Statements of Cash Flows
See Notes to Consolidated Financial Statements.
10Colgate’s Growing Success

Colgate’s Growing Success11
1. Nature of OperationsThe Company manufactures and markets a wide variety of prod-ucts in the U.S. and around the world in two distinct businesssegments: Oral, Personal and Household Care, and Pet Nutrition.Oral, Personal and Household Care products include toothpaste,oral rinses and toothbrushes, bar and liquid soaps, shampoos,conditioners, deodorants and antiperspirants, baby and shaveproducts, laundry and dishwashing detergents, fabric softeners,cleansers and cleaners, bleaches and other similar items. Theseproducts are sold primarily to wholesale and retail distributorsworldwide. Pet Nutrition products include pet food products manu-factured and marketed by Hill’s Pet Nutrition. The principal cus-tomers for Pet Nutrition products are veterinarians and specialtypet retailers. Principal global trademarks include Colgate, Palmo-live, Mennen, Protex, Ajax, Soupline, Suavitel, Fab, Science Dietand Prescription Diet in addition to various regional trademarks.
The Company’s principal classes of products accounted for thefollowing percentages of worldwide sales for the past three years:
2. Summary of Significant Accounting PoliciesPrinciples of ConsolidationThe Consolidated Financial Statements include the accounts ofColgate-Palmolive Company and its majority-owned subsidiaries.Intercompany transactions and balances have been eliminated.Investments in companies in which the Company’s interest isbetween 20% and 50% are accounted for using the equitymethod. The Company’s share of the net income from such invest-ments is recorded as equity earnings and is classified as Otherexpense, net in the Consolidated Statements of Income.
Revenue RecognitionSales are recorded at the time products are shipped to trade customers. Net sales reflect units shipped at selling list pricesreduced by promotion allowances.
Notes to Consolidated Financial Statements
Dollars in Millions Except Per Share Amounts
15%
32%
1998
16%
24%
11%
11%
16%
31%
1997
16%
23%
11%18%
30%
1996
16%
22%
10%
Oral CarePersonal CareHousehold Surface CareFabric CarePet NutritionOther
Use of EstimatesThe preparation of financial statements in conformity with gener-ally accepted accounting principles requires management tomake estimates and assumptions that affect the reportedamounts of assets and liabilities and disclosure of contingentgains and losses at the date of the financial statements and thereported amounts of revenues and expenses during the reportingperiod. Actual results could differ from those estimates.
Accounting ChangesIn 1997, the Financial Accounting Standards Board (FASB)issued Statement No. 130, “Reporting Comprehensive Income.”The Company adopted this statement as of January 1, 1998,and, accordingly, disclosures were expanded to include theConsolidated Statement of Retained Earnings, ComprehensiveIncome and Changes in Capital Accounts. There was no impacton the Company’s financial position, results of operations orcash flows.
The Company also adopted FASB Statements No. 131 andNo. 132, which revised reporting and disclosures as to operatingsegments, pension and other postretirement benefits. Prior years’information has been restated to conform to the requirements ofthe new statements.
In June 1998, the FASB issued Statement No. 133, “Account-ing for Derivative Instruments and Hedging Activities.” The state-ment establishes accounting and reporting standards requiringthat every derivative instrument be recorded in the balance sheetas either an asset or liability measured at its fair value. The state-ment requires that changes in the derivative’s fair value be recog-nized currently in earnings unless specific hedge accountingcriteria are met. Statement No. 133 will be effective, prospec-tively, for the Company’s financial statements in the year 2000.The statement is not expected to have a material impact on theCompany’s financial position, results of operations or cash flows.
During 1998, as required by generally accepted accountingprinciples, the Company ceased to account for its Brazilian opera-tions as highly inflationary as historical inflation levels had fallensharply. The effect of this change was to reduce shareholders’equity by $98.4, primarily related to the recognition of deferredtax benefits expected to be realized in the future. However, sincethe close of 1998, the Brazilian currency has devalued sharply.Based on management’s best estimates and events to date, thisdevaluation will result in a charge to cumulative translation adjust-ments of approximately $250 to be recognized in 1999 which willbe, in effect, a write-down of our foreign-currency-denominatedassets (primarily goodwill and property, plant and equipment).This will be accompanied by lower amortization and depreciationexpense in future periods. The Company remains cautious on theoutlook for operations in Brazil in 1999.
12Colgate’s Growing Success
Dollars in Millions Except Per Share Amounts
Cash and Cash EquivalentsThe Company considers all highly liquid investments with matur-ities of three months or less when purchased to be cash equiva-lents. Investments in short-term securities that do not meetthe definition of cash equivalents are classified as marketablesecurities. Marketable securities are reported at cost, whichapproximates market.
InventoriesInventories are valued at the lower of cost or market. The first-in,first-out (FIFO) method is used to value most inventories. Theremaining inventories are valued using the last-in, first-out (LIFO)method.
Property, Plant and EquipmentLand, buildings, and machinery and equipment are stated at cost.Depreciation is provided, primarily using the straight-line method,over estimated useful lives ranging from 3 to 40 years.
Goodwill and Other IntangiblesIntangible assets principally consist of goodwill, which is amor-tized on the straight-line method, generally over a period of 40years. Other intangible assets, principally non-compete agree-ments and customer lists, are amortized on the straight-linemethod over periods ranging from 5 to 20 years depending ontheir useful lives.
The recoverability of the carrying values of intangible assets isevaluated periodically based on a review of forecasted operatingcash flows and the profitability of the related business. For thethree-year period ended December 31, 1998, there were no mate-rial adjustments to the carrying values of intangible assets result-ing from these evaluations.
AdvertisingAdvertising costs are expensed in the year incurred.
Income TaxesDeferred taxes are recognized for the expected future tax conse-quences of temporary differences between the amounts carriedfor financial reporting and tax purposes. Provision is made cur-rently for taxes payable on remittances of overseas earnings; noprovision is made for taxes on overseas retained earnings thatare deemed to be permanently reinvested.
Translation of Overseas CurrenciesThe assets and liabilities of subsidiaries, other than thoseoperating in highly inflationary environments, are translated intoU.S. dollars at year-end exchange rates, with resulting translationgains and losses accumulated in a separate component ofshareholders’ equity. Income and expense items are converted
into U.S. dollars at average rates of exchange prevailing duringthe year.
For subsidiaries operating in highly inflationary environments,inventories, goodwill, and property, plant and equipment aretranslated at the rate of exchange on the date the assets wereacquired, while other assets and liabilities are translated at year-end exchange rates. Translation adjustments for these operationsare included in net income.
Financial InstrumentsThe net effective cash payment of the interest rate swap con-tracts combined with the related interest payments on the debtthat they hedge are accounted for as interest expense. Thoseinterest rate instruments that do not qualify as hedge instru-ments for accounting purposes are marked to market andrecorded at fair value.
Gains and losses from foreign exchange contracts that hedgethe Company’s investments in its foreign subsidiaries are shownin the cumulative translation adjustments account included inshareholders’ equity. Gains and losses from contracts that hedgefirm commitments are recorded in the balance sheets as a com-ponent of the related receivable or payable until realized, at whichtime they are recognized in the statements of income. The con-tracts that hedge anticipated sales and purchases do not qualifyas hedges for accounting purposes. Accordingly, the related gainsand losses are calculated using the current forward rates and arerecorded in the Consolidated Statements of Income as Otherexpense, net.
Segment InformationThe Company operates in two product segments: Oral, Personaland Household Care, and Pet Nutrition. The operations of the Oral,Personal and Household Care segment are managed geographi-cally in four reportable operating segments: North America, LatinAmerica, Europe and Asia/Africa.
Management measures segment profit as operating income,which is defined as income before interest expense and incometaxes. The accounting policies of the operating segments are thesame as those described in the summary of significant account-ing policies. Corporate operations include research and develop-ment costs, unallocated overhead costs, and gains and losseson sales of non-strategic brands and assets. Corporate assetsinclude primarily real estate and benefit plan assets.
The financial and descriptive information on the Company’sgeographic area and industry segment data, appearing in thetables contained in the Results of Operations, is an integral partof these financial statements.

Colgate’s Growing Success13
Dollars in Millions Except Per Share Amounts
ReclassificationsCertain prior year balances have been reclassified to conformwith current year presentation.
3. Acquisitions and DivestituresDuring 1998, 1997 and 1996, the Company made several acqui-sitions totaling $22.6, $20.3 and $38.5, respectively. Individually,none of these acquisitions were significant.
The acquisitions were accounted for as purchases, and,accordingly, the purchase prices were allocated to the net tangibleand intangible assets acquired based on estimated fair valuesat the dates the acquisitions were consummated. The results ofoperations of the acquired businesses have been included in theConsolidated Financial Statements since the respective acquisi-tion dates. The inclusion of pro forma financial data for all acquisi-tions would not have materially affected the financial informationincluded herein.
The aggregate sale price of all 1998, 1997 and 1996 divesti-tures was $57.4, $101.4 and $25.1, respectively. In 1998, theHandiWipes brand and related assets were sold for $53.0, and in1997, the Sterno fuel brand and related assets were sold for $70.0.
4. Long-Term Debt and Credit FacilitiesLong-term debt consists of the following at December 31:
Weighted AverageInterest Rate Maturities 1998 1997
Notes 7.1% 1999-2030 $1,382.4 $1,186.6Commercial paper and
other short-term borrowings, reclassified 5.2 1999 461.2 607.5
ESOP notes, guaranteed by the Company 8.7 2001-2009 373.6 379.7
Payable to banks 5.5 2000-2004 361.8 339.2Capitalized leases 3.2 5.6
2,582.2 2,518.6Less: current portion of
long-term debt 281.6 178.3
$2,300.6 $2,340.3
Commercial paper and certain other short-term borrowings areclassified as long-term debt as it is the Company’s intent and abil-ity to refinance such obligations on a long-term basis. Scheduledmaturities of debt outstanding at December 31, 1998, excludingshort-term borrowings reclassified, are as follows: 1999— $281.6;2000—$411.8; 2001—$109.5; 2002—$159.7; 2003—$266.5,and $891.9 thereafter. The Company has entered into interestrate swap agreements and foreign exchange contracts related tocertain of these debt instruments (see Note 11).
At December 31, 1998, the Company had unused credit facili-ties amounting to $1,670.9. Commitment fees related to creditfacilities are not material. The weighted average interest rate on
short-term borrowings, excluding amounts reclassified, as ofDecember 31, 1998 and 1997, was 6.2% and 8.5%, respectively.
The Company’s long-term debt agreements include variousrestrictive covenants and require the maintenance of certaindefined financial ratios with which the Company is in compliance.
5. Capital Stock and Stock Compensation PlansPreferred StockPreferred Stock consists of 250,000 authorized shares withoutpar value. It is issuable in series, of which one series of 122,620shares, designated $4.25 Preferred Stock, with a stated andredeemable value of $100 per share, has been issued and isoutstanding. The $4.25 Preferred Stock is redeemable only atthe option of the Company.
Preference StockIn 1988, the Company authorized the issuance of 50,000,000shares of Preference Stock, without par value. The Series B Con-vertible Preference Stock, which is convertible into four sharesof common stock, ranks junior to all series of the Preferred Stock.At December 31, 1998 and 1997, 5,598,808 and 5,734,940shares of Series B Convertible Preference Stock, respectively,were outstanding and issued to the Company’s Employee StockOwnership Plan.
Shareholder Rights PlanOn October 23, 1998, the Board of Directors adopted a newShareholder Rights Plan to replace its previous plan, whichexpired October 24, 1998, with a comparable plan. Under thePlan each share of the Company’s common stock carries with itone Preference Share Purchase Right (“Rights”). The Rights them-selves will at no time have voting power or pay dividends. TheRights become exercisable only if a person or group acquires 15%or more of the Company’s common stock or announces a tenderoffer, the consummation of which would result in ownership by aperson or group of 15% or more of the common stock. When exer-cisable, each Right entitles a holder to buy one one-hundredth ofa share of a new series of preference stock at an exercise priceof $440.00, subject to adjustment.
If the Company is acquired in a merger or other business com-bination, each Right will entitle a holder to buy, at the Right’sthen current exercise price, a number of the acquiring company’scommon shares having a market value of twice such price. Inaddition, if a person or group acquires 15% or more of the Com-pany’s common stock, each Right will entitle its holder (otherthan such person or members of such group) to purchase, at theRight’s then current exercise price, a number of shares of theCompany’s common stock having a market value of twice theRight’s exercise price.

14Colgate’s Growing Success
Dollars in Millions Except Per Share Amounts
Further, at any time after a person or group acquires 15% ormore (but less than 50%) of the Company’s common stock, theBoard of Directors may, at its option, exchange part or all of theRights (other than Rights held by the acquiring person or group)for shares of the Company’s common stock on a one-for-onebasis.
The Company, at the option of its Board of Directors, mayamend the Rights or redeem the Rights for $.01 at any timebefore the acquisition by a person or group of beneficial owner-ship of 15% or more of its common stock. The Board of Directorsis also authorized to reduce the 15% threshold to not less than10%. Unless redeemed earlier, the Rights will expire on October31, 2008.
Stock RepurchasesDuring 1998, the Company entered into a series of forward pur-chase agreements on its common stock. These agreements aresettled on a net basis in shares of the Company’s common stock.To the extent that the market price of the Company’s commonstock on a settlement date is higher (lower) than the forward pur-chase price, the net differential is received (paid) by the Company.As of December 31, 1998, agreements were in place coveringapproximately $458.6 of the Company’s common stock (5.0million shares) that had forward prices averaging $91.68 pershare. If these agreements were settled based on the December31, 1998 market price of the Company’s common stock ($92.88per share), the Company would be entitled to receive approxi-mately 64,000 shares. During 1998, settlements resulted in
the Company receiving 321,331 shares, which were recorded astreasury stock.
Incentive Stock PlanThe Company has a plan which provides for grants of restrictedstock awards for officers and other executives of the Companyand its major subsidiaries. A committee of non-employeemembers of the Board of Directors administers the plan. During1998 and 1997, 285,077 and 335,270 shares, respectively,were awarded to employees in accordance with the provisionsof the plan.
Stock Option PlansThe Company’s Stock Option Plans (“Plans”) provide for theissuance of non-qualified stock options to officers and keyemployees. Options are granted at prices not less than the fairmarket value on the date of grant. At 1998 year-end, 17,286,622shares of common stock were available for future grants.
The Plans contain an accelerated ownership feature which pro-vides for the grant of new options when previously owned sharesof Company stock are used to exercise existing options. The num-ber of new options granted under this feature is equal to thenumber of shares of previously owned Company stock used toexercise the original options and to pay the related required U.S.income tax. The new options are granted at a price equal to thefair market value on the date of the new grant and have the sameexpiration date as the original options exercised.
Stock option plan activity is summarized below:
1998 1997 1996
Weighted Average Weighted Average Weighted AverageShares Exercise Price Shares Exercise Price Shares Exercise Price
Options outstanding, January 1 22,767,392 $46 21,415,198 $32 20,991,790 $29Granted 6,268,644 78 7,703,057 73 5,709,222 41Exercised (7,458,754) 44 (6,095,277) 32 (5,114,564) 29Canceled or expired (184,159) 42 (255,586) 38 (171,250) 31
Options outstanding, December 31 21,393,123 56 22,767,392 46 21,415,198 32
13,344,382 $46 14,683,179 $38 13,983,844 $29
The following table summarizes information relating to currently outstanding and exercisable options as of December 31, 1998:
Weighted Average Range of Remaining Contractual Options Weighted Average Options Weighted AverageExercise Prices Life In Years Outstanding Exercise Price Exercisable Exercise Price
$11.44–$ 21.28 1 1,163,047 $15 1,163,047 $15$25.03–$ 34.34 5 4,771,853 31 4,771,853 31$34.38–$ 44.47 6 3,655,279 40 2,731,609 40$44.56–$ 62.16 7 3,503,605 58 1,871,727 54$62.44–$ 79.38 9 4,009,582 70 1,138,721 73$79.47–$106.04 6 4,289,757 94 1,667,425 94
6 21,393,123 $56 13,344,382 $46

Colgate’s Growing Success15
Dollars in Millions Except Per Share Amounts
The Company applies Accounting Principles Board OpinionNo. 25, “Accounting for Stock Issued to Employees,” and relatedinterpretations in accounting for options granted under the Plans.Accordingly, no compensation expense has been recognized. Hadcompensation expense been determined based on the Black-Scholes option pricing model value at the grant date for awardsin 1998, 1997 and 1996 consistent with the provisions of State-ment of Financial Accounting Standards No. 123, “Accounting forStock-Based Compensation” (SFAS 123), the Company’s netincome, basic earnings per common share and diluted earningsper common share would have been $803.5, $2.65 per shareand $2.49 per share, respectively, in 1998; $716.1, $2.35 pershare and $2.19 per share, respectively, in 1997; and $621.7,$2.05 per share and $1.92 per share, respectively, in 1996.
The weighted average Black-Scholes value of grants issuedin 1998, 1997 and 1996 was $12.47, $7.85 and $5.40, respec-tively. The Black-Scholes value of each option granted is esti-mated using the Black-Scholes option pricing model with thefollowing assumptions: option term until exercise ranging from 2to 7 years, volatility ranging from 17% to 30%, risk-free interestrate ranging from 5.0% to 6.2% and an expected dividend yieldof 2.5%. The Black-Scholes model used to determine the optionvalues shown above was developed to estimate the fair value ofshort-term freely tradable, fully transferable options without vest-ing restrictions and was not designed to value reloads, all ofwhich significantly differ from the Company’s stock option awards.The value of this model is also limited by the inclusion of highlysubjective assumptions which greatly affect calculated values.
6. Employee Stock Ownership PlanIn 1989, the Company expanded its Employee Stock OwnershipPlan (“ESOP”) through the introduction of a leveraged ESOP cover-ing certain employees who have met certain eligibility require-ments. The ESOP issued $410.0 of long-term notes due through2009 bearing an average interest rate of 8.6%. The long-termnotes, which are guaranteed by the Company, are reflected in theaccompanying Consolidated Balance Sheets. The ESOP used theproceeds of the notes to purchase 6.3 million shares of Series BConvertible Preference Stock from the Company. The Stock has aminimum redemption price of $65 per share and pays semiannualdividends equal to the higher of $2.44 or the current dividendpaid on four common shares for the comparable six-month period.
Dividends on these preferred shares, as well as commonshares also held by the ESOP, are paid to the ESOP trust and,together with contributions, are used by the ESOP to repay princi-pal and interest on the outstanding notes. Preferred shares arereleased for allocation to participants based upon the ratio of thecurrent year’s debt service to the sum of total principal and inter-est payments over the life of the loan. At December 31, 1998,
1,528,450 shares were allocated to participant accounts. Eachallocated share may be converted by the trustee into four com-mon shares but preferred shares generally convert only after theemployee ceases to work for the Company.
Dividends on these preferred shares are deductible forincome tax purposes and, accordingly, are reflected net of theirtax benefit in the Consolidated Statements of Retained Earnings,Comprehensive Income and Changes in Capital Accounts.
Annual expense related to the leveraged ESOP, determined as interest incurred on the notes, less employee contributionsand dividends received on the shares held by the ESOP, plus thehigher of either principal repayments on the notes or the cost ofshares allocated, was $2.4 in 1998, $3.0 in 1997 and $3.9 in1996. Similarly, unearned compensation, shown as a reductionin shareholders’ equity, is reduced by the higher of principal payments or the cost of shares allocated.
Interest incurred on the ESOP’s notes amounted to $32.5 in1998, $33.0 in 1997 and $33.5 in 1996. The Company paid dividends on the stock held by the ESOP of $29.3 in 1998, $29.8in 1997 and $31.1 in 1996. Company contributions to the ESOPwere $0 in 1998, $1.0 in 1997 and $4.1 in 1996. Employeecontributions to the ESOP were $9.4 in 1998, $8.2 in 1997 and$5.9 in 1996.
7. Retirement Plans and Other Retiree BenefitsRetirement PlansThe Company, its U.S. subsidiaries and some of its overseas subsidiaries maintain defined benefit retirement plans coveringsubstantially all of their employees. Benefits are based primarilyon years of service and employees’ career earnings. In the Com-pany’s principal U.S. plans, funds are contributed to the trusts inaccordance with regulatory limits to provide for current serviceand for any unfunded projected benefit obligation over a reason-able period. To the extent these requirements are exceeded byplan assets, a contribution may not be made in a particular year.Assets of the plans consist principally of common stocks, guaran-teed investment contracts with insurance companies, invest-ments in real estate funds and U.S. Government obligations.Domestic plan assets also include investments in the Company’scommon stock representing 7% and 6% of plan assets at Decem-ber 31, 1998 and 1997, respectively.
Other Retiree BenefitsThe Company and certain of its subsidiaries provide health careand life insurance benefits for retired employees to the extent notprovided by government-sponsored plans. The Company utilizes aportion of its leveraged ESOP, in the form of future retiree contri-butions, to reduce its obligation to provide these postretirementbenefits and offset its current service costs. Postretirement bene-fits otherwise are not currently funded.

16Colgate’s Growing Success
Dollars in Millions Except Per Share Amounts
Summarized information of the Company’s defined benefit retirement plans and postretirement plans are as follows:
Pension Benefits Other Retiree Benefits
1998 1997 1998 1997 1998 1997
North America International
Change in Benefit ObligationBenefit obligation at beginning of year $976.6 $925.7 $ 278.8 $ 271.9 $ 143.7 $ 152.7Service cost 28.1 24.9 17.7 16.6 (11.0) (7.8)Interest cost 68.9 67.6 18.2 17.6 14.7 13.4Participant’s contribution 3.3 3.1 9.7 2.3 — —Acquisitions/plan amendments 1.5 .1 4.0 9.4 (3.7) —Actuarial loss/(gain) 7.9 40.8 14.1 13.6 20.0 (6.0)Foreign exchange impact (2.6) (1.6) 4.4 (38.4) — (.2)Benefits paid (85.4) (84.0) (17.3) (14.2) (10.7) (8.4)
Benefit obligation at end of year $998.3 $976.6 $ 329.6 $ 278.8 $ 153.0 $ 143.7
Change in Plan AssetsFair value of plan assets at beginning of year $907.3 $842.8 $ 193.4 $ 171.2 $ — $ —Actual return on plan assets 133.1 134.5 18.5 22.7 — —Company contributions 6.9 13.6 16.6 11.9 10.7 8.4Plan participant contributions 3.3 3.1 9.7 2.3 — —Foreign exchange impact (2.4) (2.7) (10.9) (10.4) — —Acquisitions/plan amendments — — 5.0 9.9 — —Benefits paid (85.4) (84.0) (17.3) (14.2) (10.7) (8.4)
Fair value of plan assets at end of year $962.8 $907.3 $ 215.0 $ 193.4 $ — $ —
Funded StatusFunded status at end of year $ (35.5) $ (69.3) $(114.6) $ (85.4) $(153.0) $(143.7)Unrecognized net transition asset (6.6) (13.6) (2.5) (2.2) — —Unrecognized net actuarial loss/(gain) 19.0 58.7 16.4 1.7 (22.5) (44.3)Unrecognized prior service costs 39.9 44.6 3.9 4.5 (8.3) (2.6)
Net amount recognized $ 16.8 $ 20.4 $ (96.8) $ (81.4) $(183.8) $(190.6)
Amounts Recognized in Balance SheetOther assets $ 93.3 $ 83.4 $ 40.9 $ 30.1 $ — $ —Other liabilities (76.5) (63.0) (137.7) (111.5) (183.8) (190.6)
Net amount recognized $ 16.8 $ 20.4 $ (96.8) $ (81.4) $(183.8) $(190.6)
Weighted Average AssumptionsDiscount rate 7.25% 7.25% 6.82% 7.47% 7.25% 7.25%Long-term rate of return on plan assets 9.25% 9.25% 8.92% 10.21% — —Long-term rate of compensation increase 5.00% 5.50% 4.44% 4.83% — —ESOP growth rate — — — — 10.00% 10.00%
Pension Benefits Other Retiree Benefits
1998 1997 1996 1998 1997 1996 1998 1997 1996
North America International
Components of Net Periodic Benefit CostsService cost $ 28.1 $ 24.9 $ 24.5 $ 17.7 $ 16.6 $ 15.1 $ 4.0 $ 2.3 $ 1.7Interest cost 68.9 67.6 64.4 18.2 17.6 17.5 14.7 13.4 12.6Annual ESOP allocation — — — — — — (15.0) (10.1) (5.0)Expected return on plan assets (80.8) (77.0) (73.1) (13.9) (14.2) (13.6) — — —Amortization of transition/prior service costs (.9) 1.3 (1.5) .1 .8 3.3 (.6) (.3) (.2)Amortization of actuarial loss/(gain) 1.5 .7 3.8 .5 .4 .7 (1.0) (1.8) (2.0)
Net periodic benefit cost $ 16.8 $ 17.5 $ 18.1 $ 22.6 $ 21.2 $ 23.0 $ 2.1 $ 3.5 $ 7.1

Colgate’s Growing Success17
Dollars in Millions Except Per Share Amounts
The accumulated benefit obligation and fair value of planassets for the pension plans with accumulated benefit obligtionsin excess of plan assets were $206.9 and $8.5, respectively, asof December 31, 1998, and $185.6 and $7.2, respectively, as ofDecember 31, 1997. These amounts represent non-qualifieddomestic plans and plans at foreign locations that are primarilyunfunded, as such book reserves equal to the unfunded amounthave been recorded.
The projected benefit obligation and fair value of plan assetsfor the pension plans with projected benefit obligations in excessof plan assets were $360.0 and $110.1, respectively, as ofDecember 31, 1998, and $311.0 and $98.4, respectively, asof December 31, 1997.
The assumed medical cost trend rate used in measuring thepostretirement benefit obligation was 4.75% for 1999 and yearsthereafter. Changes in this rate can have a significant effect onamounts reported. The effect of a 1% increase/decrease in theassumed medical cost trend rate would change the accumulatedpostretirement benefit obligation by approximately $14.5; annualexpense would change by approximately $2.3.
8. Income TaxesThe provision for income taxes consists of the following for theyears ended December 31:
1998 1997 1996
United States $122.6 $ 91.0 $ 67.2International 278.9 270.9 252.4
$401.5 $361.9 $319.6
The components of income before income taxes are as followsfor the three years ended December 31:
1998 1997 1996
United States $ 362.0 $ 271.8 $171.3International 888.1 830.5 783.3
$1,250.1 $1,102.3 $954.6
The difference between the statutory United States federalincome tax rate and the Company’s global effective tax rate asreflected in the Consolidated Statements of Income is as follows:
Percentage of Income Before Tax 1998 1997 1996
Tax at U.S. statutory rate 35.0% 35.0% 35.0%State income taxes, net of federal benefit .7 .6 .3Earnings taxed at other than
U.S. statutory rate (2.6) (1.8) (1.4)Reversal of valuation allowance (2.7) (1.5) —Other, net 1.7 .5 (.4)
Effective tax rate 32.1% 32.8% 33.5%
In addition, net tax (cost) benefit of $(18.5) in 1998 and $49.2 in1997 were recorded directly through equity.
Differences between accounting for financial statement pur-poses and accounting for tax purposes result in taxes currentlypayable being (lower) higher than the total provision for incometaxes as follows:
1998 1997 1996
Excess of tax over book depreciation $ (40.0) $(12.7) $(15.9)Net restructuring spending (13.6) (47.5) (26.3)Tax credit utilization (10.2) (11.5) —Other, net (37.0) 16.7 21.5
$(100.8) $(55.0) $(20.7)
The components of deferred tax assets (liabilities) are as follows atDecember 31:
1998 1997
Deferred Taxes — Current:Accrued liabilities $ 73.8 $ 78.8Restructuring 14.1 27.7Other, net 22.5 17.9
Total deferred taxes current 110.4 124.4
Deferred Taxes — Long-term:Intangible assets (328.5) (251.6)Property, plant and equipment (251.1) (188.4)Postretirement benefits 62.6 65.6Tax loss and tax credit carryforwards 176.9 159.5Other, net 14.9 54.7Valuation allowance (122.8) (124.3)
Total deferred taxes long-term (448.0) (284.5)
Net deferred taxes $(337.6) $(160.1)
The major component of the 1998 and 1997 valuation allowancerelates to tax benefits in certain jurisdictions not expected tobe realized. The increase in deferred taxes — long-term primarilyrelates to deferred taxes recognized in Brazil subsequent to theirchange from a highly inflationary economy.
Applicable U.S. income and foreign withholding taxes have notbeen provided on approximately $661 of undistributed earnings offoreign subsidiaries at December 31, 1998. These earnings arecurrently considered to be permanently invested and are not sub-ject to such taxes. Determining the tax liability that would arise ifthese earnings were remitted is not practicable.

18Colgate’s Growing Success
Dollars in Millions Except Per Share Amounts
9. Supplemental Income Statement Information
Other Expense, Net 1998 1997 1996
Amortization of intangibles $ 81.7 $ 86.5 $ 91.7Earnings from equity investments (5.3) (5.6) (7.8)Minority interest 28.1 29.1 33.4Other (43.3) (37.6) (23.5)
$ 61.2 $ 72.4 $ 93.8
Interest Expense, Net 1998 1997 1996
Interest incurred $216.8 $241.6 $244.4Interest capitalized (12.3) (10.0) (12.7)Interest income (31.6) (48.1) (34.3)
$172.9 $183.5 $197.4
Research and development $166.0 $166.3 $159.7Maintenance and repairs 109.7 113.6 107.1Media advertising 592.2 637.0 565.9
10. Supplemental Balance Sheet Information
Inventories 1998 1997
Raw materials and supplies $257.9 $261.0Work-in-process 32.9 33.5Finished goods 455.2 433.9
$746.0 $728.4
Inventories valued under LIFO amounted to $162.2 and $157.9at December 31, 1998 and 1997, respectively. The excess ofcurrent cost over LIFO cost at the end of each year was $39.8 and$46.7, respectively. The liquidations of LIFO inventory quantitiesincreased income by $1.3, $0 and $1.4 in 1998, 1997 and1996, respectively.
Property, Plant and Equipment, Net 1998 1997
Land $ 122.6 $ 120.6Buildings 705.0 653.0Machinery and equipment 3,299.7 3,024.8
4,127.3 3,798.4Accumulated depreciation (1,538.1) (1,357.4)
$ 2,589.2 $ 2,441.0
Goodwill and Other Intangible Assets, Net 1998 1997
Goodwill and other intangibles $3,080.8 $3,060.3Accumulated amortization (556.7) (475.0)
$2,524.1 $2,585.3
Other Accruals 1998 1997
Accrued payroll and employee benefits $312.4 $331.7Accrued advertising 232.6 170.1Accrued interest 51.2 49.5Accrued taxes other than income taxes 72.0 46.7Restructuring accrual 39.6 79.0Other 149.4 161.9
$857.2 $838.9
Other Liabilities 1998 1997
Minority interest $230.5 $227.0Pension and other benefits 398.0 365.1Other 108.1 183.7
$736.6 $775.8
11. Fair Value of Financial InstrumentsThe Company utilizes interest rate swap contracts and foreigncurrency exchange contracts to manage interest rate and foreigncurrency exposures. (See the Results of Operations — ManagingForeign Currency and Interest Rate Exposure for further discus-sion.) In assessing the fair value of financial instruments atDecember 31, 1998 and 1997, the Company has used availablemarket information and other valuation methodologies. Somejudgment is necessarily required in interpreting market data todevelop the estimates of fair value, and, accordingly, the esti-mates are not necessarily indicative of the amounts that theCompany could realize in a current market exchange.
The carrying amounts of cash and cash equivalents, mar-ketable securities, long-term investments and short-term debtapproximated fair value as of December 31, 1998 and 1997. Theestimated fair value of the Company’s remaining financial instru-ments at December 31 are summarized as follows:
1998 1997
Carrying Fair Carrying FairAmount Value Amount Value
(Liabilities)/AssetsLong-term debt, including
current portion (including foreign exchange contracts) $(2,582.2) $(2,800.0) $(2,518.6) $(2,665.6)
Other liabilities:Interest rate contracts (2.4) (3.6) (7.1) (18.4)Foreign exchange
contracts (8.7) (13.0) 10.3 9.0Equity:
Foreign exchange contracts (to hedge investment in subsidiaries) (2.9) (2.7) 1.4 6.6
As of December 31, 1998 and 1997, the Company had interestrate agreements outstanding with an aggregate notional amount

Colgate’s Growing Success19
Dollars in Millions Except Per Share Amounts
As of December 31, 1998 and 1997, the Company had interestrate agreements outstanding with an aggregate notional amountof $825.0 and $929.8, respectively, with maturities through 2018.
As of December 31, 1998 and 1997, the Company hadapproximately $411.1 and $657.2, respectively, of outstandingforeign exchange contracts. At December 31, 1998, approxi-mately 8% of outstanding foreign exchange contracts served to hedge net investments in foreign subsidiaries, 15% hedgedintercompany loans and 77% hedged third-party debt and otherfirm commitments.
The Company is exposed to credit loss in the event of nonper-formance by counterparties on interest rate agreements and for-eign exchange contracts; however, nonperformance by thesecounterparties is considered remote as it is the Company’s policyto contract with diversified counterparties that have a long-termdebt rating of A or higher. The amount of any such exposure isgenerally the unrealized gain on such contracts, which at Decem-ber 31, 1998 was not significant.
12. Restructured OperationsIn September 1995, a reserve of $460.5 was established tocover a worldwide restructuring of manufacturing and administra-tive operations. The primary elements of the reserve related toemployee termination costs and expenses associated with therealignment of the Company’s global manufacturing operations,as well as settlement of contractual obligations. As planned, therestructuring has produced savings that increase pretax earningsby over $150 annually.
The planned restructuring projects, primarily in North Americaand Europe but also affecting Hill’s Pet Nutrition and Colgate loca-tions in Asia/Africa and certain Latin America locations, are sub-stantially completed. The remaining reserve amount of $39.6primarily covers the reconfiguring of two factories in Asia/Africa
and the consolidation of administrative operations following theimplementation of SAP and related process changes in Europeand Asia/Africa. All remaining projects will be completed in 1999.The financing for remaining cash requirements will come fromoperations.
A summary of the changes in the restructuring reserve isas follows:
Manufacturing ContractualWorkforce Plants Settlements Total
Original reserve $210.0 $ 204.1 $ 46.4 $ 460.51995 activity (4.2) (7.2) (13.5) (24.9)1996 activity (93.4) (118.6) (20.4) (232.4)1997 activity (45.0) (48.0) (11.0) (104.0)
Balance at December 31, 1997 67.4 30.3 1.5 99.2
1998 activity (37.1) (22.5) — (59.6)
Balance at December 31, 1998 $ 30.3 $ 7.8 $ 1.5 $ 39.6
In total, the headcount reductions resulting from the restructuringprojects are 4,655. The cumulative headcount reductions as of1996, 1997 and 1998 were 2,275, 3,133 and 3,986, respec-tively. Factory closures and/or reconfigurations will total 25. Thecumulative factory closures and/or reconfigurations as of 1996,1997 and 1998 were 14, 20 and 23, respectively. The costs ofcompleting the restructuring activities to date approximated theoriginal reserve. The headcount and factory totals were increasedby 513 and 1, respectively, as a result of refinements of originalestimates.
Of the restructuring reserve remaining as of December 31,1998 and 1997, $39.6 and $79.0, respectively, is classified as acurrent liability, and $0 and $20.2, respectively, as a reduction offixed assets.
13. Quarterly Financial Data (Unaudited)
First Second Third FourthQuarter Quarter Quarter Quarter
1998Net sales $2,159.5 $2,256.5 $2,265.4 $2,290.2Gross profit 1,123.5 1,172.6 1,192.6 1,192.6Net income 196.0 203.5 214.9 234.2Earnings per common share:
Basic .65 .67 .71 .78Diluted .60 .62 .66 .73
1997Net sales $2,147.1 $2,300.9 $2,297.2 $2,311.5Gross profit 1,080.6 1,168.1 1,166.7 1,179.8Net income 169.6 175.8 188.6 206.4Earnings per common share:
Basic .56 .58 .62 .68Diluted .52 .54 .58 .63

Colgate’s Growing Success19
Audit CommitteeRonald E. Ferguson, ChairJill K. ConwayEllen M. HancockJohn P. KendallHoward B. Wentz, Jr.
Committee on DirectorsDelano E. Lewis, ChairJill K. ConwayDavid W. JohnsonJohn P. KendallHoward B. Wentz, Jr.
Finance CommitteeHoward B. Wentz, Jr., ChairRonald E. FergusonEllen M. HancockJohn P. KendallRichard J. KoganReuben Mark
Personnel andOrganization CommitteeJill K. Conway, ChairRonald E. FergusonDavid W. JohnsonJohn P. KendallDelano E. Lewis
Corporate OfficersReuben Mark, 60Chairman of the Board andChief Executive Officer
See biographicalinformation above.
William S. Shanahan, 58President and ChiefOperating Officer
Mr. Shanahan joinedColgate in 1965 and helda series of importantpositions in the UnitedStates and abroad. Theseinclude Vice President-General Manager for theWestern Hemisphere, andGroup Vice President forEurope/Africa, Colgate-U.S.and other countries. Hewas elected Chief OperatingOfficer in 1989 andPresident in 1992.
Lois D. Juliber, 50Executive Vice President,Chief of Operations,Developed Markets
Ms. Juliber joined Colgatein 1988 from GeneralFoods, where she was VicePresident. Before beingpromoted to her currentposition in 1997, she hadbeen President of the FarEast/Canada division, ChiefTechnological Officer andPresident of Colgate-NorthAmerica.
David A. Metzler, 56Executive Vice President,Chief of Operations,High Growth Markets
Mr. Metzler joined Colgate in 1965. Before beingnamed to his currentposition in 1997, he wasPresident of Colgate-Europeand previously President of Colgate-Latin America.Earlier, he had responsi-bilities for operationsin Canada, South Pacific,Africa and India.
Stephen C. Patrick, 49Chief Financial Officer
Joined Colgate in 1982after having been a Managerat Price Waterhouse.Before being named CFOin 1996, Mr. Patrick helda series of key financialpositions, including VicePresident and CorporateController and VicePresident-Finance forColgate-Latin America.
John T. Reid, 58Chief Technological Officer
Joined Colgate in 1982 asVice President of StrategicPlanning from PfizerCorporation, where heworked on that company’sstrategic plan. Before beingnamed to his currentposition in 1997, Dr. Reidhad also served as GeneralManager of Colgate-Greece,Vice President and GeneralManager of Colgate-UnitedKingdom and Vice Presidentof the South Pacific region.
Andrew D. Hendry, 51Senior Vice President,General Counseland Secretary
Joined Colgate in 1991from Unisys, where he wasVice President and GeneralCounsel. A graduate ofGeorgetown University andNYU Law School, Mr. Hendryhas also been a corporateattorney at the Battle &Fowler law firm in NewYork City and at ReynoldsMetals Company.
Robert J. JoyVice President Global Human Resources
Dennis J. HickeyVice President andCorporate Controller
Ian M. CookPresidentColgate-North America
Michael J. TangneyPresident Colgate-Latin America
Javier G. TeruelPresident Colgate-Europe
Robert C. WheelerChief Executive OfficerHill’s Pet Nutrition, Inc.
Steven R. BelascoVice PresidentTaxation and Real Estate
Brian J. HeidtkeVice President, Financeand Corporate Treasurer
Peter D. McLeodVice President,ManufacturingEngineering Technology
John H. TietjenVice PresidentGlobal BusinessDevelopment
Michael S. RoskothenRetiring PresidentGlobal Oral Care
Barrie M. SpellingPresidentGlobal Oral Care
Michele C. MayesVice PresidentDeputy General CounselInternational and CorporateAssistant Secretary
James SerafinoVice PresidentDeputy General CounselTechnology and MarketingAssistant Secretary
Global ExecutivesEmilio Alvarez-RecioVP-Global Advertising
Keith W. BatesVP-MET, PSC 2000Project Management
Charles W. BeckVP-Global Materials,Logistics and Sourcing
Robert E. BlanchardVP-General Manager,Global Toothbrush Division
Antonio CaroVP-Worldwide Sales
Edward C. Davis VP-Budgets and Planning
Herbert L. DavisVP-Business Simplification-Quality
Hector I. ErezumaVP-International Taxes
James E. Farrell, Jr.VP-AssistantGeneral Counsel
Edward FiluschVP-Assistant Treasurer
Abdul GaffarVP-Advanced TechnologyOral Care
Nina GillmanVP-AssistantGeneral Counsel
Stefan S. GorkinVP-Global Labor Relations
Stuart A. HulkeVP-MET-CategoryEngineering
John J. HustonVP-Office of the Chairman
Jules P. KaufmanVP-Assistant GeneralCounsel
Leo LaitemVP-Research andDevelopment, HouseholdSurface Care
Robert R. MartinVP-Compliance 2000
Ronald T. MartinVP-Global EmployeeRelations and Staffing Business Practices
Francis A. MorelliVP-Information Technologyand Customer Service
Robert A. MurrayVP-CorporateCommunications
James NorfleetVP-Oral Care ProductDevelopment
Robert C. PierceVP-Research andDevelopment Personal Care
Hans L. PohlschroederVP-Assistant Treasurer
David I. RichardsonVP-Product SafetyRegulatory andInformation Technology
Grace E. RichardsonVP-Global Consumer Affairs
Clarence RobbinsVP-Technology, BusinessSimplification, Surfactants
Jill H. RothmanVP-Global Compensation
Reuven M. SacherVP-Research andDevelopment, Oral Care
Richard TheilerVP-Research andDevelopment, Fabric Care
Bina H. ThompsonVP-Investor Relations
Scott E. ThompsonVP-Associate GeneralCounsel, Trademarks
Kathleen A. ThornhillVP-Global Business Insightsand Consumer Research
Heiko TietkeVP-Global BusinessDevelopment, Personal Care
Edmund D. TobenVP-GlobalInformation Technology
Reuben Mark, 60Chairman of the Boardand Chief ExecutiveOfficer of Colgate-Palmolive Company.Mr. Mark joined Colgatein 1963 and held aseries of significantpositions in the UnitedStates and abroadbefore being electedCEO in 1984. Electeddirector in 1983.
Jill K. Conway, 64Visiting Scholar, Programin Science, Technologyand Society atMassachusetts Instituteof Technology since1985. Mrs. Conwaywas President of SmithCollege from 1975 to1985. Elected directorin 1984.
Your Management Team
Board of Directors (Letters indicate positions in photo)
Ronald E. Ferguson, 57Chairman and ChiefExecutive Officer ofGeneral Re Corporationsince 1987. Mr.Ferguson has been withGeneral Re since 1969.Elected director in 1987.
Ellen M. Hancock, 55President and ChiefExecutive Officer, ExodusCommunications, Inc.Mrs. Hancock previouslywas Executive VicePresident of Researchand Development andChief Technology Officerat Apple Computer Inc.,1996-1997, ExecutiveVice President and ChiefOperating Officer at
National Semiconductor,1995-1996, and SeniorVice President at IBM.Elected director in 1988.
David W. Johnson, 66Chairman of CampbellSoup Company since1993. Mr. Johnson wasCampbell President andChief Executive Officer,1990-1997. From 1987to 1990, he served asChairman and ChiefExecutive Officer ofGerber ProductsCompany. Electeddirector in 1991.
John P. Kendall, 70Officer, Faneuil HallAssociates, Inc., aprivate investmentcompany, since 1973.Mr. Kendall is a formerChairman of The KendallCompany. He joinedthat company in 1956and held a series ofsignificant positions.Elected director in 1972.
Richard J. Kogan, 57Chairman and ChiefExecutive Officerof Schering-PloughCorporation since 1998.Mr. Kogan joinedSchering-Plough asExecutive Vice President,Pharmaceutical Opera-tions, in 1982 and thenbecame President andChief Operating Officer ofthat company in 1986and President and ChiefExecutive Officer in1996. Elected directorin 1996.
Delano E. Lewis, 60President and ChiefExecutive Officer ofNational Public Radio,1993-1998. Mr. Lewiswas President and ChiefExecutive Officer ofChesapeake & PotomacTelephone Company from1988 to 1993, havingjoined that company in1973, and held positionsof increasing responsi-bility. Elected directorin 1991.
Howard B. Wentz, Jr., 69Chairman of Tambrands,Inc., 1993-1996. Mr.Wentz was Chairman ofESSTAR Incorporated,1989-1995, andChairman, President andChief Executive Officer ofAmstar Company, 1983-1989. Elected directorin 1982.
C A
G
I
F D
B
H
E

20COLGATE’S GROWING
Dollars in Millions Except Per Share Amounts
Colgate’s Growing Success
Common Stock $4.25 Preferred Stock
Market Price 1998 1997 1998 1997
Quarter Ended High Low High Low High Low High Low
March 31 $87.81 $67.88 $56.88 $45.44 $79.50 $72.50 $72.50 $67.00June 30 91.44 82.44 66.50 49.75 81.00 76.50 73.00 70.50September 30 96.94 65.56 77.13 61.81 87.00 80.50 74.50 68.94December 31 94.75 68.00 74.50 62.25 88.00 85.00 78.00 69.50Closing Price $92.88 $73.50 $88.00 $76.50
Dividends Paid Per Share
Quarter Ended 1998 1997 1998 1997
March 31 $ .275 $ .235 $1.0625 $1.0625June 30 .275 .275 1.0625 1.0625September 30 .275 .275 1.0625 1.0625December 31 .275 .275 1.0625 1.0625
Total $1.10 $1.06 $4.25 $4.25
15. Earnings Per Share
For the Year Ended 1998 For the Year Ended 1997 For the Year Ended 1996
Income Shares Per Share Income Shares Per Share Income Shares Per Share
Net income $848.6 $740.4 $635.0Preferred dividends (20.9) (21.1) (21.4)Basic EPS 827.7 295.0 $2.81 719.3 295.3 $2.44 613.6 293.3 $2.09Stock options 6.8 6.9 5.1ESOP conversion 18.4 22.4 17.9 22.9 16.1 23.3
Diluted EPS $846.1 324.2 $2.61 $737.2 325.1 $2.27 $629.7 321.7 $1.96
14. Market and Dividend Information (Unaudited)
The Company’s common stock and $4.25 Preferred Stock arelisted on the New York Stock Exchange. The trading symbol for
common stock is CL. Dividends on the common stock have beenpaid every year since 1895, and the amount of dividends paid pershare has increased for 36 consecutive years.
16. Commitments and ContingenciesMinimum rental commitments under noncancellable operatingleases, primarily for office and warehouse facilities, are $67.3in 1999, $63.5 in 2000, $56.2 in 2001, $51.0 in 2002, $48.9in 2003 and $122.6 thereafter. Rental expense amounted to$102.7 in 1998, $94.4 in 1997 and $93.3 in 1996. Contingentrentals, sublease income and capital leases, which are includedin fixed assets, are not significant.
The Company has various contractual commitments to pur-chase raw materials, products and services totaling $60.6 thatexpire through 2001.
The Company is a party to various superfund and other envi-ronmental matters and is contingently liable with respect to law-suits, taxes and other matters arising out of the normal courseof business. Management proactively reviews and manages itsexposure to, and the impact of, environmental matters and othercontingencies.
On September 8, 1998, one of the Company’s Brazilian sub-sidiaries, Kolynos do Brasil Ltda. (“Kolynos”), received notice ofan administrative proceeding from the Central Bank of Brazil. Thenotice primarily takes issue with certain filings made with the Cen-tral Bank in connection with financing arrangements related to theacquisition of Kolynos in January 1995. The Central Bank seeks to impose fines prescribed by statute, and it, in no way, chal-lenges or seeks to unwind the acquisition. Management believes,based on the opinion of its Brazilian legal counsel, that the filingschallenged by the Central Bank fully complied with Brazilian lawand that the issues raised in the notice are without merit.
While it is possible that the Company’s cash flows and resultsof operations in particular quarterly or annual periods could beaffected by the one-time impacts of the resolution of the abovecontingencies, it is the opinion of management that the ultimatedisposition of these matters, to the extent not previously providedfor, will not have a material impact on the Company’s financial condition or ongoing cash flows and results of operations.

20Colgate’s Growing Success
Joseph A. UzzolinaVP-Global BusinessDevelopment, HouseholdSurface Care
Robert T. ValleauVP-Global BusinessDevelopmentPersonal Cleaning and Hair Care
J. Nicholas VinkeVP-General Manager Colgate OralPharmaceuticals
Anthony R. VolpeVP-Clinical Dental Research
Gregory WoodsonVP-Global BusinessDevelopment Fabric Care
Douglas R. WrightVP-Environmental Affairs,Occupational Healthand Safety
John E. ZoogVP-Human ResourcesServices
OperatingExecutivesColgate-International
S. Peter DamPresidentAsia Pacific
David P. BenczeVP-Manufacturing Europe
Philip A. BerryVP-Human ResourcesEurope
Jose-Maria CastroVP-Finance andStrategic Planning Europe
Peter C. ChaseVP-Marketing Latin America
Alec de GuillenchmidtVP-Benelux Operationsand ECR-Europe
Coloman de HegedusPresidentAfrica/Middle East
Dale DvorakVP-ManufacturingLatin America
Stephen J. FogartyVP-MarketingAsia
Jill GarrityVP-Marketing Europe
James GerchowVP-ManufacturingAfrica/Middle East
Walter H. GolembeskiVP-Manufacturingand Technology Asia Pacific
Jean-Mathieu HellichVP-Legal Director-EuropeAssociate General Counsel
Richard MenerVP-General ManagerGlobal Export/Middle East
Franck MoisonPresident Central Europe and Russia
Jean-Marc NavezVP-Finance andStrategic PlanningAsia Pacific
Morgan J. O’BrienVP-Financial DirectorCentral Europe and Russia
Leonard D. SmithVP-Finance Africa/Middle East
Karel van BrinkVP-Managing DirectorNew Geographiesand AcquisitionsCentral Europe and Russia
Francis M. WilliamsonVP-Finance and StrategicPlanning Latin America
Johannes BrouwerVP-Managing DirectorTurkiye
Andreas BrouzosVP-General Manager Greece
Nigel B. BurtonVP-General Manager Spain
David ConnVP-General Manager South Africa
Graeme DalzielVP-General ManagerPortugal
Steven E. ElliottVP-General ManagerThailand
Guillermo FernandezVP-President andGeneral Manager Mexico
Chester FongVP-General ManagerGreater China
Robert GalanVP-General ManagerPhilippines
Karen GuerraVP-General ManagerUnited Kingdom & Ireland
Luis GutierrezVP-General ManagerCentral America
William A. HoulzetVP-General Manager France
N. Jay JayaramanVP-General Manager India
Scott W. Jeffrey, Jr.VP-General ManagerColombia
Seamus E. McBrideVP-General Manager Italy
Graeme B. MurrayVP-General Manager Canada
Chris E. PedersenVP-General ManagerNordic Group
Roger PrattVP-General Manager Brazil
Friedrich ReinshagenVP-General ManagerGermanic Countries
Derrick SamuelVP-General ManagerSouth Pacific Region
Raffy SantosVP-General ManagerHawley & Hazel Taiwan
James H. ShoultzVP-General ManagerVenezuela
Malcolm StokoeVP-General ManagerCaricom Region
Daniel VettorettiVP-General ManagerPoland/Hungary/CzechRepublic/Baltic States
Paul WitmondVP-General ManagerDominican Republic
Seng Aun YeohVP-General ManagerMalaysia
Colgate-U.S.
John BourneVP-Financial BusinessDevelopment North America
Richard J. CotéVP-Finance
James S. FiguraVP-Consumer Research
David R. GroenerVP-Manufacturing andProduct Supply Chain North America
Jack HaberVP-General ManagerOral Care
Tarek HallabaVP-Marketing
Suzan HarrisonVP-General ManagerHousehold Surface Care
Sheila HopkinsVP-General ManagerPersonal Care
Robert F. MaruskaVP-Financial Planning
Louis MignoneVP-Sales
Hill’s Pet Nutrition
P. Dorset SuttonPresident and ChiefOperating Officer
Richard F. HawkinsPresidentHill’s-International
Joseph A. DouglasSenior Vice PresidentGlobal ProductSupply/MET/ManufacturingEffectiveness
Virginia M. DotzauerVP-General Manager Hill’s-Domestic Diets
James W. SparksVP-Human Resources
Richard J. WienckowskiVP-Finance Chief Financial Officer
A B C D E F G H I
VisitingGlobal Plantin Morristown, New JerseyFollowing a review of
the business at a board
meeting held at
Colgate’s personal care
factory in Morristown,
NJ, Colgate directors
toured the state-of-the-
art facility. As they
viewed the automated
equipment, they wore
“CP Morristown” caps, in
compliance with good
manufacturing prac-
tices to assure product
purity.

Colgate’s Growing Success21
Shareholder Information
Corporate OfficesColgate-Palmolive Company300 Park AvenueNew York, New York 10022-7499(212) 310-2000
Annual Meeting on Wednesday:Note ChangeColgate shareholders are invited to attend ourannual meeting. It will be Wednesday, May 5,1999 at 10:00 a.m. in the Broadway Ballroomof the Marriott Marquis Hotel, Sixth Floor, Broad-way at 45th Street, New York, NY. Even if youplan to attend the meeting, please sign andreturn your proxy promptly.
Stock ExchangesThe common stock of Colgate-Palmolive Com-pany is listed and traded on The New York StockExchange under the symbol CL and on otherworld exchanges including those in Amsterdam, Frankfurt, London, Paris and Zurich.
Financial Information at Internet Sitehttp://www.colgate.com and by1-800-850-2654Financial results, dividend news and other infor-mation are available on Colgate’s site on theInternet, at the address above.
Colgate also offers earnings information, thestock price, dividend news and other corporateannouncements toll-free at 1-800-850-2654.The information can be read to the caller andcan also be received by mail or fax.
Transfer Agent and RegistrarOur transfer agent can assist you with a varietyof shareholder services, including change ofaddress, transfer of stock to another person,questions about dividend checks or Colgate’sDividend Reinvestment Plan.
Attn: Colgate-Palmolive CompanyFirst Chicago Trust Company of New York,a division of EquiServeP.O. Box 2500Jersey City, NJ 07303-2500TOLL-FREE: 1-800-756-8700FAX: (201) 222-4842e-mail: [email protected] address: http://www.equiserve.comHearing Impaired: TDD: (201) 222-4955
Registered shareholders can view theiraccounts on the Internet by calling toll-free 1-877-843-9327 to request a password andsign-on ID be sent to them.
(1) All share and per share amounts have beenrestated to reflect both the 1997 and the 1991two-for-one stock splits.
(2) Income in 1995 includes a net provision forrestructured operations of $369.2. (Excludingthe charge, earnings per share would have been$1.79, basic and $1.67, diluted.)
(3) Income in 1994 includes a one-time charge of$5.2 for the sale of a non-core business,Princess House.
(4) Income in 1993 includes a one-time impact ofadopting new mandated accounting standards,effective in the first quarter of 1993, of $358.2.(Excluding this charge, earnings per share wouldhave been $1.69, basic and $1.58, diluted.)
(5) Income in 1991 includes a net provision forrestructured operations of $243.0. (Excluding thischarge, earnings per share would have been$1.28, basic and $1.20, diluted.)
(6) Income in 1988 includes Hill’s service agreementrenegotiation net charge of $42.0. (Excluding thischarge, earnings per share would have been $.71,basic and $.70, diluted.)
(7) Due to timing differences, 1988 includes three divi-dend declarations totaling $.28 per share and fourpayments totaling $.37 per share while all otheryears include four dividend declarations.
Dollars In Millions Except Per Share Amounts
Continuing Operations Net salesResults of operations:
Net incomePer share, basicPer share, diluted
Depreciation and amortization expense
Financial PositionCurrent ratioProperty, plant and equipment, netCapital expendituresTotal assetsLong-term debtShareholders’ equity
Share and OtherBook value per common shareCash dividends declared and paid per
common shareClosing priceNumber of common shares outstanding
(in millions)Number of shareholders of record:
$4.25 PreferredCommon
Average number of employees
Eleven-Year Financial Summary
(1)Dividend Reinvestment PlanColgate offers an automatic DividendReinvestment Plan for common and $4.25preferred shareholders and a voluntary cashfeature. Any brokers’ commissions or servicecharges for stock purchases under the Planare paid by Colgate-Palmolive. Shareholderscan sign up for this Plan by contacting ourtransfer agent, below left.
Independent Public AccountantsArthur Andersen LLP
Investor Relations/ReportsCopies of annual or interim reports, productbrochures, Form 10-K and other publicationsare available from the Investor RelationsDepartment:
by mail directed to the corporate addressby e-mail, [email protected] calling 1-800-850-2654 or by callingInvestor Relations at (212) 310-3207
Individual investors with other requests:please write Investor Relations at thecorporate address or call (212) 310-2575
Institutional investors:call Bina Thompson at (212) 310-3072
Other ReportsYou can obtain a copy of Colgate’s Environmen-tal Policy Statement, Code of Conduct, Advertis-ing Placement Policy Statement, ProductSafety Research Policy or our 1998 Report ofLaboratory Research with Animals by writing toConsumer Affairs at Colgate-Palmolive.
Corporate ResponsibilityColgate-Palmolive does business in over 200countries and territories worldwide, affectingthe lives of a highly diverse population ofemployees, consumers, shareholders, businessassociates and friends. We are committed tothe highest standard of ethics, fairness andhumanity in all our activities and operations. Allemployees are guided by a worldwide Code ofConduct, which sets forth Colgate policies onimportant issues such as nondiscriminatoryemployment, involvement in community andeducational programs, care for the environment,employee safety, and our relationship with con-sumers, shareholders and government.
Environmental PolicyColgate-Palmolive is committed to the protec-tion of the environment everywhere. Our commit-ment is an integral part of Colgate’s mission tobecome the best truly global consumer productscompany. We continue to work on developinginnovative environmental solutions in all areasof our business around the world. The healthand safety of our customers, our people and thecommunities in which we live and operate isparamount in all that we do. Colgate-Palmolive’sconcern has been translated into many variedprograms dealing with employee safety and withour products, packaging, facilities and businessdecisions. Extensive worker training programs,a comprehensive audit program, and projectssuch as concentrated cleaners and detergents,refill packages, recycled and recyclable bottlesand packaging materials are all part of our com-mitment behind this important endeavor.

1998 1997 1996 1995 1994 1993 1992 1991 1990 1989 1988
$8,971.6 $9,056.7 $8,749.0 $8,358.2(2) $7,587.9 $7,141.3 $7,007.2 $6,060.3 $5,691.3 $5,038.8 $4,734.3
848.6 740.4 635.0 172.0(2) 580.2(3) 189.9(4) 477.0 124.9(5) 321.0 280.0 152.7(6)
2.81 2.44 2.09 .52(2) 1.91(3) .54(4) 1.46 .38(5) 1.14 .99 .56(6)
2.61 2.27 1.96 .51(2) 1.78(3) .53(4) 1.37 .38(5) 1.06 .95 .55(6)
330.3 319.9 316.3 300.3 235.1 209.6 192.5 146.2 126.2 97.0 82.0
1.1 1.1 1.2 1.3 1.4 1.5 1.5 1.5 1.4 1.9 1.72,589.2 2,441.0 2,428.9 2,155.2 1,988.1 1,766.3 1,596.8 1,394.9 1,362.4 1,105.4 1,021.6
389.6 478.5 459.0 431.8 400.8 364.3 318.5 260.7 296.8 210.0 238.77,685.2 7,538.7 7,901.5 7,642.3 6,142.4 5,761.2 5,434.1 4,510.6 4,157.9 3,536.5 3,217.62,300.6 2,340.3 2,786.8 2,992.0 1,751.5 1,532.4 946.5 850.8 1,068.4 1,059.5 674.32,085.6 2,178.6 2,034.1 1,679.8 1,822.9 1,875.0 2,619.8 1,866.3 1,363.6 1,123.2 1,150.6
7.05 7.30 6.84 5.67 6.23 6.20 8.10 6.27 5.06 4.20 4.12
1.10 1.06 .94 .88 .77 .67 .58 .51 .45 .39 .37(7)
92.88 73.50 46.13 35.13 31.69 31.19 27.88 24.44 18.44 15.88 11.75
292.7 295.4 294.3 291.7 288.8 298.5 320.5 294.7 266.4 264.4 276.3
296 320 350 380 400 450 470 460 500 500 55045,800 46,800 45,500 46,600 44,100 40,300 36,800 34,100 32,000 32,400 33,20038,300 37,800 37,900 38,400 32,800 28,000 28,800 24,900 24,800 24,100 24,700
22Colgate’s Growing Success
E Printed entirely on recycled paper.© 1999 Colgate-Palmolive Company
Design by Robert Webster Inc.Major photography by Richard AlcornCover photo by Richard LordOther photos by Tom Ferraro,John Abbott and Richard LordPrinting by Acme Printing CompanyTypography by Grid Typographic Services, Inc.
Promoting NewToothbrushes toConsumersProduct sampling and eye-level
displays win new customers for
Colgate toothbrushes. Top left,
new Colgate toothbrushes across
the world for all price points and
ages, from youngsters on up. Below
left, the new Colgate Sensation
toothbrush got off to a fast start
in Venezuela in 1998.