“collaborating to success”: an experimental study of group idea ...€¦ · “collaborating to...
TRANSCRIPT
Proceedings of IDETC/CIE 2005 ASME 2005 International Design Engineering Technical Conferences & Computers and Information in
Engineering Conference September 24-28, 2005, Long Beach, California, USA
DETC2005-85351 “COLLABORATING TO SUCCESS”:
AN EXPERIMENTAL STUDY OF GROUP IDEA GENERATION TECHNIQUES
J. S. Linsey1 [email protected]
M. G. Green [email protected]
J. T. Murphy [email protected]
K. L. Wood [email protected]
Manufacturing and Design Research Laboratory
Department of Mechanical Engineering The University of Texas
Austin, Texas
A. B. Markman
The Similarity and Cognition Lab Department of Psychology
The University of Texas Austin, Texas
1 Corresponding Author
ABSTRACT Numerous concept generation methods have been developed that can assist an engineer in the initial phases of design. Unfortunately, limited empirical data is available to guide users in selecting preferred techniques. This study systematically investigates underlying factors of four well-used and documented techniques: Brainsketching, Gallery, 6-3-5, and C-Sketch. These techniques are resolved into their key parameters and a factorial experiment is performed to understand how the key parameters affect the outcomes of the techniques. The factors chosen for this study include: how ideas are displayed to participants (all are viewed at once or exchanged between participants, “rotational viewing”) and the mode used to communicate ideas (written words only, sketches only, or a combination of written words and sketches). This study also provides a method for measuring the quantity of ideas generated when the ideas are represented in the form of both sketches and words.
A number of interesting findings are produced from the study. First, the study shows that individuals gain a significant number of ideas from their teammates. Ideas when shared, can foster new idea tracks, more complete layouts, and diverse synthesis. Second, the systematic exchange of a set of ideas between participants produces a greater quantity of ideas than having all ideas displayed in a gallery form. This result shows that techniques like 6-3-5 or C-Sketch, where each person views only a subset of all the team’s ideas at any given time, are more likely to produce a larger quantity of ideas than techniques where individuals can continuously view all the ideas the team has generated. Finally, as teams developed ideas, the quality improved. This result is a consequence of the team-
sharing environment and, in conjunction with quantity of concepts, validates the effectiveness of group idea generation.
KEY WORDS:
Idea generation, Empirical study, Brainsketching, Method 6-3-5, C-Sketch, Gallery
1. INTRODUCTION The ability to invent, create, and innovate is at the very core of engineering and product development. The initial phases of design, which include conceptual design, have been shown to have the most significant impact on the cost of a product [1]. Numerous idea generation techniques are available to assist the engineer in this process. Over one hundred formal idea generation techniques have been developed in areas such as psychology, business, and engineering [2,3,4]. Techniques range from the well-known Brainstorming method developed by Osborn [5] to engineering specific methods such as the Theory of Inventive Problem Solving (TIPS) [6]. Unfortunately little empirical data on the use of the methods for engineering design exists to guide the engineer to preferred idea generation techniques.
One of the first studies using Osborn’s Brainstorming method in engineering design was carried out in 1975. This study included engineering professionals working on a realistic engineering problem and showed that groups were less effective than the combined efforts of individuals [7]. This result is consistent with the vast majority of studies on variations of Osborn’s Brainstorming [8].
Based on associative memory models in cognitive psychology [9,10,11], groups should produce more ideas than
2 Copyright © 2005 by ASME
the combined non-redundant efforts of individuals. Associative memory models treat memory as a network of concepts. Closely related concepts are more strongly connected than less related concepts. As one concept is activated in memory, concepts that are strongly connected to it have a higher probability of being retrieved than concepts with weaker connections. Ideas provided by other group members can activate and facilitate the retrieval of concepts that would not have been otherwise retrieved, thus producing more ideas overall.
For other group idea generation techniques, such as brainwriting (any technique that uses written communication as opposed to spoken), groups have been shown to be more effective than the combined individual efforts [15,16]. Recently there has been growing interest in engineering and design related fields, including industrial design and architecture, on evaluating and developing better methods for idea generation [17,18,19,20,21]. These studies have used a mixture of sketches, verbal descriptions of ideas, and physical models in the idea generation process. It has been recognized that the vast majority of idea generation techniques focus on the sentential expression of ideas whereas designers rely heavily on sketches to express their ideas during the conceptual phase of design [1].
Many cognitive models of memory theorize two types of knowledge being stored, perceptual (non-verbal) and conceptual (verbal) [22,23,24,25]. There is a possibility during idea generation of an effect on the individual’s cognitive processes due to verbal expression [26]. The verbalization of perceptual information can interfere with the retrieval of perceptual information from memory. This effect is known as verbal overshadowing. Verbal idea generation techniques may suppress some of the perceptual information in memory thus giving sketching based techniques a possible advantage.
Due to the vastness of available idea generation techniques, a systematic comparison of complete techniques is not feasible nor an efficient approach. This study uses a systematic method to efficiently study a number of idea generation techniques by dissecting a set of methods into key factors or parameters and using a design of experiments (DOE) approach to quickly identify the effects of these key factors. By understanding the factors or parameters that can be varied to create idea generation methods, new and better methods can be developed. This type of approach has been recommended previously [19].
This study focuses on four idea generation methods, three of which include a sketching basis: Brainsketching, C-Sketch, 6-3-5, and the first phase of the Gallery method. These methods are dissected into two important factors (1) how a groups’ ideas are displayed to other members (“rotational viewing” or all are posted in gallery style) and (2) the form of communication between group members (written words only, sketches only, or a combination of words and sketches). This experiment focuses on the communication and sharing of ideas because once an effective method of exchanging ideas is found, this method can then be combined with other parameters, or with “tackles and promoters” [27], such as design analogies to further enhance the process. Other parameters of the idea generation techniques, such as quantity of time for idea generation, whether the originator of ideas is identifiable to other participants, and the suspension of judgment, are kept constant throughout all conditions.
2. OVERVIEW AND PREVIOUS WORK 2.1 Osborn’s Brainstorming
The term brainstorming is frequently applied to any idea generation technique and not just the technique developed and named by Osborn. Osborn’s Brainstorming is a familiar group idea generation technique. Osborn’s Brainstorming starts with the problem being explained by a facilitator to the group. Then the group verbally exchanges ideas following four basic rules: (1) criticism is not allowed, (2) “wild ideas” are welcomed, (3) build off each others’ ideas, and (4) a large quantity of ideas is sought. This technique has been shown to be less effective for generating a larger quantity or higher quality ideas when compared with what is called nominal groups, which are the combined non-redundant efforts of an equal number of individuals working alone using the rules of Brainstorming [8]. Theories for this productivity loss in interacting Brainstorming groups include the following [28]: 1. Production blocking: Only one member can speak at a
time, and group members may forget their ideas while someone else is speaking, their ideas may seem less important, or listening interferes with developing more ideas.
2. Evaluation apprehension: Individuals do not state their ideas for fear of being judged by other group members.
3. Social Loafing: Individuals tend to devote less effort when the individual contribution is less identifiable.
Due to the shortcomings of Osborn’s Brainstorming and the potential for other idea generation techniques, this study focuses on a series of brainwriting techniques, as described in the following sections. 2.2 Brainsketching In Brainsketching, individuals begin by silently sketching their ideas on large sheets of paper including brief annotations to further explain the sketches if needed. Individuals switch drawings, and silent sketching continues for another period [3]. Van der Lugt compared a variant of Brainsketching, that included individuals explaining their ideas between exchanges, to Brainstorming [18]. Brainstorming produced more ideas, but the Brainsketching variant had significantly more connections with earlier ideas.
2.3 Gallery In the Gallery method individuals begin by sketching their ideas silently on large sheets of paper. After a set amount of time, participants discuss their ideas and move about the room studying others’ ideas. This review phase is followed by a second stage of silent sketching [3,29]. 2.4 C-Sketch/6-3-5 For 6-3-5 [30,29,17] and C-Sketch [17], six participants are seated around a table, and each silently describes three ideas in a fixed amount of time on a large sheet of paper. The ideas are then passed to another participant. The “5” in 6-3-5 represents a total of five passes or rounds. For 6-3-5 individuals, ideas are described through the use of words only in contrast to C-Sketch, which requires individuals to use sketches only. Other variations of 6-3-5 exist [3,31]. One variation combines the use of sketches with short annotations [31]. C-Sketch, Gallery, and
3 Copyright © 2005 by ASME
6-3-5 have been compared. C-Sketch and Gallery outperformed 6-3-5 (words only) for variety, quality, and novelty [27]. Quantity results were not shown in this study.
Table 1: Summary of Formal Idea Generation Techniques
Formal technique
Forms of communication
How ideas are displayed
Osborn’s Brainstorming
Spoken Word
6-3-5 Written Word Rotational ViewingC-Sketch Sketches Only Rotational ViewingGallery Sketches & Written
Word followed by Spoken Word
All are viewed at the same time
Brainsketching Sketches & Written Word
Rotational Viewing
2.5 Experimental Approach From previous studies, it is not clear which parameters of the concept generation methods are responsible for improving the outcomes nor how the overall quantity of ideas is influenced. Generating a large quantity of ideas is important in the engineering design process [32]. Previous studies have not fully explored this [15,18,27]. Both Brainsketching and Galley allow participants to view all of the ideas simultaneously, whereas, in 6-3-5 and C-Sketch, only a subset of all ideas is visible to each individual. C-Sketch allows participants to communicate by the use of sketches only and 6-3-5 with written sentential expression only. In contrast, Brainsketching and Galley use a combination of sketches and words. This study focuses on the communication aspects of this set of techniques through the use of a factorial experimental design. The experiment focuses on the type of representation used to communicate ideas and how the ideas are displayed to individuals. We seek to answer the following research questions (hypotheses), addressing both the underpinnings of the concept generation techniques and the supporting psychological theories, such as associate memory models and verbal overshadowing: 1. What type of display method will result in the generation
of a greater quantity of ideas? Ward's path of least resistance model, for how new ideas are structured by information in memory [33] may apply to this question. As people begin to categorize the problem in a particular way (for example by seeing other people's ideas), the more that their memory of existing products will affect the new designs and fewer ideas will be generated.
2. Does there exist an interaction between the form of representation and how ideas are displayed? Does the representation method of ideas interplay with the display method or are they virtually independent?
3. What type of concept representation, words, sketches, or a combination will produce a higher quantity of results? Some information, particularly abstract concepts, is easier to convey in words, whereas other information such as geometry and configuration tends to be easier to convey with drawings. Most design problems involve a combination of these two types of information.
4. For methods such as 6-3-5, C-Sketch, and Gallery, how do the contributions of the individuals before the ideas are shared with the group compare with the number of ideas
the group generates by building from these initial ideas? Based on the associative memory model, it is hypothesized that the group should generate more ideas.
5. As individuals add and combine ideas, what effect is there on the quality of the concepts?
These research questions are addressed systematically in the following sections. We discuss our experimental method, metrics for evaluation, data analysis approach, and a summary of the results and findings.
3. EXPERIMENTAL METHOD To explore a set of the possible group idea generation techniques, a factorial experiment was conducted. A 2 (Display of ideas: view all, rotational viewing) X 3 (Representation: words only, sketches only, words combined with sketches) factorial design was used (Table 2). The first factor controlled how the participants viewed the ideas, either all ideas were posted via gallery (on the wall) or sets of ideas were rotated between participants. The second factor dealt with how the participants were allowed to represent their ideas. Participants either used written words only, sketches only, or written words and sketches to communicate their ideas to their teammates. This approach produced methods similar to 6-3-5 [29], C-Sketch [17], Brainsketching [3], or Gallery Method [29], Table 3.
Table 2: Summary of Experimental Conditions Factor 2: Representation
Words Only
Sketches Only
Words & Sketches
Factor 1: Display View All 1 3 5
Rotational Viewing 2 4 6
Table 3: Experimental Conditions and Similar
Formal Method Experimental Condition Similar Formal Idea
Generation Method 1 2 6-3-5 3 4 C-Sketch 5 Gallery 6 Brainsketching
The group factorial experiment was conducted over a two
week period, and students were asked to sign a confidentiality agreement to minimize students hearing about the problem and confounding the experiment. In addition, on a post-experiment survey, participants were asked if they had heard about the problem and if they had tried to generate ideas prior to the session. One participant in experimental condition 4 did note that they had heard about the experimental problem ahead of time and thought about the problem. This team’s data was reviewed and no significant or noticeable bias existed in the team’s or individual’s results.
3.1 Participants The participants were students from a required mechanical engineering senior design methods course at The University of Texas at Austin. The participants received extra credit for their
4 Copyright © 2005 by ASME
participation based on the number, quality, novelty, and variety of solutions they developed. The participants were informed of this extra credit set-up prior to participation.
In the senior design methods course, students work throughout the semester in teams of 4-6 members. The course traditionally assigns teams based on a strategy for improved team dynamics based on Myers-Briggs personality types, 6-hats, and analytical/fabrication skills [34,35,36,37,38]. Students learn a number of idea generation techniques as a part of the class including Brainstorming, TIPS, information gathering, patent searching, analogies, and a hybrid version of 6-3-5/C-sketch that emphasizes sketching with short annotations [31]. For the factorial experiment, participants were required to sign-on in their assigned teams. Fourteen of a possible fifteen teams chose to take part in the experiment. This level of participation implies that a selection bias is unlikely within the pool of mechanical engineering seniors.
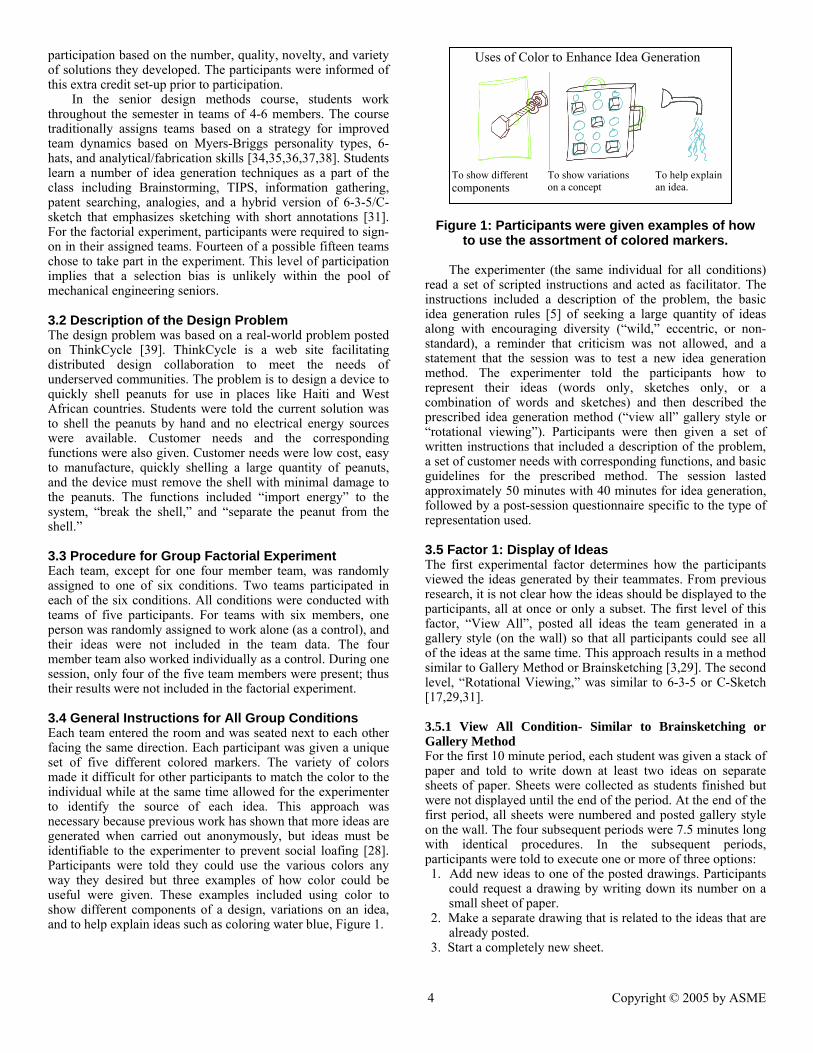
3.2 Description of the Design Problem The design problem was based on a real-world problem posted on ThinkCycle [39]. ThinkCycle is a web site facilitating distributed design collaboration to meet the needs of underserved communities. The problem is to design a device to quickly shell peanuts for use in places like Haiti and West African countries. Students were told the current solution was to shell the peanuts by hand and no electrical energy sources were available. Customer needs and the corresponding functions were also given. Customer needs were low cost, easy to manufacture, quickly shelling a large quantity of peanuts, and the device must remove the shell with minimal damage to the peanuts. The functions included “import energy” to the system, “break the shell,” and “separate the peanut from the shell.” 3.3 Procedure for Group Factorial Experiment Each team, except for one four member team, was randomly assigned to one of six conditions. Two teams participated in each of the six conditions. All conditions were conducted with teams of five participants. For teams with six members, one person was randomly assigned to work alone (as a control), and their ideas were not included in the team data. The four member team also worked individually as a control. During one session, only four of the five team members were present; thus their results were not included in the factorial experiment. 3.4 General Instructions for All Group Conditions Each team entered the room and was seated next to each other facing the same direction. Each participant was given a unique set of five different colored markers. The variety of colors made it difficult for other participants to match the color to the individual while at the same time allowed for the experimenter to identify the source of each idea. This approach was necessary because previous work has shown that more ideas are generated when carried out anonymously, but ideas must be identifiable to the experimenter to prevent social loafing [28]. Participants were told they could use the various colors any way they desired but three examples of how color could be useful were given. These examples included using color to show different components of a design, variations on an idea, and to help explain ideas such as coloring water blue, Figure 1.
Figure 1: Participants were given examples of how
to use the assortment of colored markers. The experimenter (the same individual for all conditions)
read a set of scripted instructions and acted as facilitator. The instructions included a description of the problem, the basic idea generation rules [5] of seeking a large quantity of ideas along with encouraging diversity (“wild,” eccentric, or non-standard), a reminder that criticism was not allowed, and a statement that the session was to test a new idea generation method. The experimenter told the participants how to represent their ideas (words only, sketches only, or a combination of words and sketches) and then described the prescribed idea generation method (“view all” gallery style or “rotational viewing”). Participants were then given a set of written instructions that included a description of the problem, a set of customer needs with corresponding functions, and basic guidelines for the prescribed method. The session lasted approximately 50 minutes with 40 minutes for idea generation, followed by a post-session questionnaire specific to the type of representation used. 3.5 Factor 1: Display of Ideas The first experimental factor determines how the participants viewed the ideas generated by their teammates. From previous research, it is not clear how the ideas should be displayed to the participants, all at once or only a subset. The first level of this factor, “View All”, posted all ideas the team generated in a gallery style (on the wall) so that all participants could see all of the ideas at the same time. This approach results in a method similar to Gallery Method or Brainsketching [3,29]. The second level, “Rotational Viewing,” was similar to 6-3-5 or C-Sketch [17,29,31].
3.5.1 View All Condition- Similar to Brainsketching or Gallery Method For the first 10 minute period, each student was given a stack of paper and told to write down at least two ideas on separate sheets of paper. Sheets were collected as students finished but were not displayed until the end of the period. At the end of the first period, all sheets were numbered and posted gallery style on the wall. The four subsequent periods were 7.5 minutes long with identical procedures. In the subsequent periods, participants were told to execute one or more of three options: 1. Add new ideas to one of the posted drawings. Participants
could request a drawing by writing down its number on a small sheet of paper.
2. Make a separate drawing that is related to the ideas that are already posted.
3. Start a completely new sheet.
To show different components
Uses of Color to Enhance Idea Generation
To show variations on a concept
To help explainan idea.
5 Copyright © 2005 by ASME
3.5.2 Rotational Viewing Condition- Similar to 6-3-5 or C-Sketch Similar to the “View All” condition, for the first 10 minute period, each student was given a stack of paper and told to write down at least two ideas on separate sheets of paper. At the end of the period, the experimenter collected all sheets and systematically redistributed them such that each participant saw each set of papers once and participants could not identify which one of their teammates had the sheets previously. In the four subsequent periods, lasting 7.5 minutes each, participants were told to build off each others’ ideas by adding their ideas to one of the sheets, to combine previous ideas, or to start a new sheet with a new concept.
3.6 Factor 2: Representation The second experimental factor determined how the students communicated their ideas to other participants. One of three forms of representation was used: words only, sketches only with no words, or a combination of words and sketches. At the end of the sessions, after completion of the surveys, participants in either of the sketches-only conditions labeled their sketches with brief descriptions of what was drawn.
4. METRICS FOR EVALUATION A critical aspect of an experiment is the quality of the measurements used. Design methods are no different but the measurements techniques are not as well developed to understand important aspects of engineering processes. A number of different metrics for design problems and areas outside engineering, have been used to evaluate idea generation techniques, including quantity of ideas, number of good ideas, practicality, novelty, and variety [40,41,27,15,18]. Commonly used metrics are the quantity of non-redundant ideas and a quality rating [8]. A recent study by Van der Lugt [18] used a technique called linkography [42,43] which uses the connection (links) between ideas as the base measure. Linkography can be used to evaluate how well participants build off each others’ ideas and the types of modifications made to previous ideas. Shah et al. [19] developed a set of metrics specifically for the evaluation of engineering idea generation techniques including quantity, quality, novelty, and variety of ideas.
There are other aspects of group idea generation process besides the design outcomes that need to be evaluated. For example, Osborn’s Brainstorming groups perceive their performance to be better and are more satisfied with the process than nominal groups (combined efforts of individuals) even though nominal groups produce more ideas [44]. Groups have also been shown to feel they had a better understanding of the ideas presented, more involvement, more responsibility, and more commitment than the nominal groups [45]. Even groups using brainwriting enjoyed the task more than individuals writing down their ideas alone, but all felt they would have done better with Osborn’s Brainstorming [16]. These results suggest a possible reason for the popularity of Osborn’s Brainstorming in spite of the evidence that suggests it is not as effective. Clearly the social aspects of group idea generation techniques are important. Some social aspects of the process are addressed in a post-session survey.
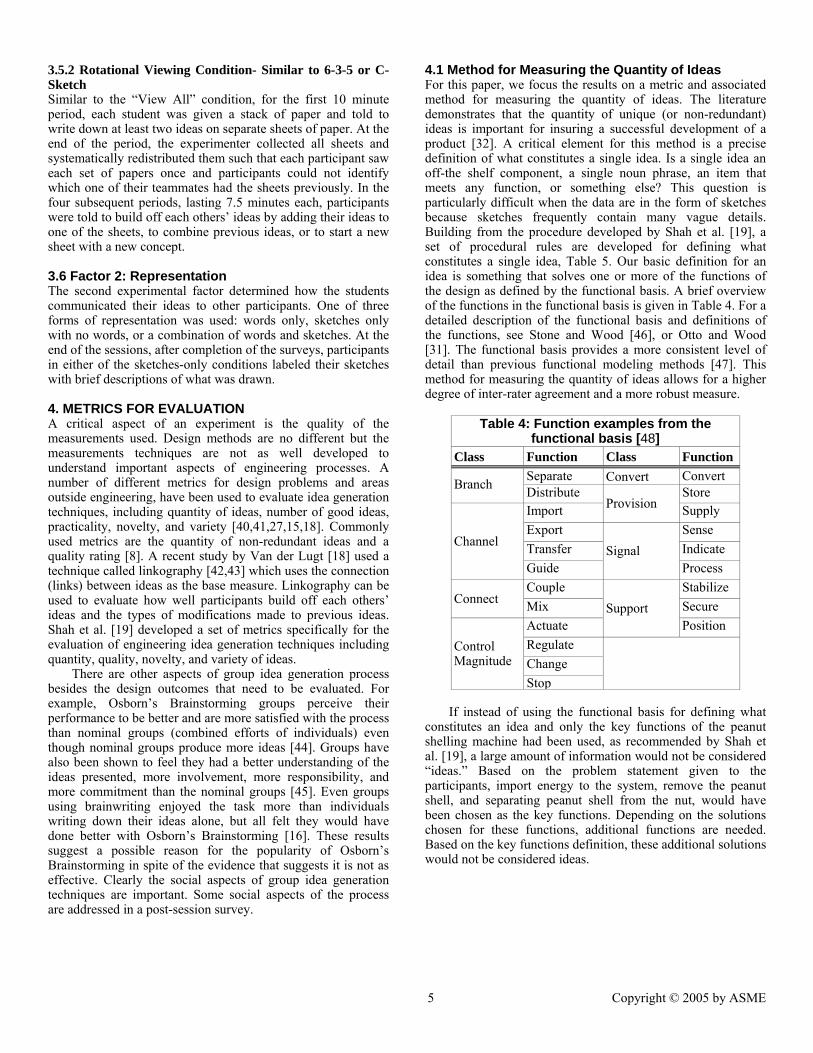
4.1 Method for Measuring the Quantity of Ideas For this paper, we focus the results on a metric and associated method for measuring the quantity of ideas. The literature demonstrates that the quantity of unique (or non-redundant) ideas is important for insuring a successful development of a product [32]. A critical element for this method is a precise definition of what constitutes a single idea. Is a single idea an off-the shelf component, a single noun phrase, an item that meets any function, or something else? This question is particularly difficult when the data are in the form of sketches because sketches frequently contain many vague details. Building from the procedure developed by Shah et al. [19], a set of procedural rules are developed for defining what constitutes a single idea, Table 5. Our basic definition for an idea is something that solves one or more of the functions of the design as defined by the functional basis. A brief overview of the functions in the functional basis is given in Table 4. For a detailed description of the functional basis and definitions of the functions, see Stone and Wood [46], or Otto and Wood [31]. The functional basis provides a more consistent level of detail than previous functional modeling methods [47]. This method for measuring the quantity of ideas allows for a higher degree of inter-rater agreement and a more robust measure.
Table 4: Function examples from the
functional basis [48] Class Function Class Function
Separate Convert Convert Branch Distribute Store Import Provision Supply Export Sense Transfer Indicate Channel
Guide Signal
Process Couple Stabilize
Connect Mix Secure Actuate
Support Position
Regulate Change
Control Magnitude
Stop
If instead of using the functional basis for defining what
constitutes an idea and only the key functions of the peanut shelling machine had been used, as recommended by Shah et al. [19], a large amount of information would not be considered “ideas.” Based on the problem statement given to the participants, import energy to the system, remove the peanut shell, and separating peanut shell from the nut, would have been chosen as the key functions. Depending on the solutions chosen for these functions, additional functions are needed. Based on the key functions definition, these additional solutions would not be considered ideas.
6 Copyright © 2005 by ASME
Table 5: Quantity Counting Rules Summary 1. An idea solves one or more of the functions in the functional basis (primary or secondary function). 2. The same idea (or component) being used in multiple places counts as one idea. 3. Each idea counts as only a single idea even if it solves more than one function. 4. New combinations of already-counted ideas are counted in a separate measure. 5. Categories of ideas only count as ideas when no subordinates are given2. 6. Ideas count even if they are not needed or cause the systems to not function. 7. Ideas must be shown and not just implied. 8. For ideas that reframe the problem such as producing a slightly different product or ways to reduce waste product, count
these in a category called “Problem Reframing.” These are ideas that do not specifically address the problem as describe but meet the higher level customer needs.
a. Ideas that reframe the problem usually do not fit a defined product function well. b. They must add something to the system. c. Count them if they are related to the situation such as
i. Environmental concerns relate to the situation ii. Reduction in waste products resulting from solutions to the problem
iii. Produces a different product that meets the customer needs
2 For example, if both a gear and bevel gear were given as ideas, only the bevel gear would count as an idea. If instead only a gear was given as an idea, then it
would count as one idea.
A second definition of what constitutes an idea was developed for when students developed ideas based on a more abstract view of the problem. This occurred more frequently when participants were forced to only use words to describe their ideas. These solutions were clearly ideas, but they did not fit defined functions of the functional basis for the stated problem well. For example, ideas in this category ranged from genetically engineering peanuts to not having shells to training squirrels to shell the peanuts.
Each idea was counted as a single idea even when it met more than one function. This choice was made because it provided greater consistency between judges since there is less room for different interpretations of the intended function. Clearly, function sharing is good design practice, but identifying intentional function sharing is difficult due to the vagueness of sketches. This quantity metric is biased toward a functional view, but this definition combined with the definition for “reframing” ideas covered virtually every solution encountered.
Three judges independently counted the number of ideas based on the standard guidelines, Table 5, and their scores were used to evaluate the reliability of the quantity metric. Two judges were blind to the conditions of the experiment and the hypothesis, one of whom counted all of the data. The other two judges each counted a non-overlapping subset. All judges were familiar with the functional basis and were given an initial set of functions from the functional basis but were allowed to add additional functions as they saw fit.
The inter-rate agreement and correlation between the judges varied with the type of representation. Similar data from a previous experiment using this quantity metric was also included to provide a better measure of correlation and reliability [49]. For data containing only words or words combined with sketches, Pearson’s Product Moment Correlation Coefficient was higher than for data that included sketches only, 99% and 95% respectively. The high degree of correlations shows the judges are evaluating the data in a similar manner, and the counting rules are being applied consistently by each judge. The inter-rater agreement on data containing only words or a combination of words and sketches
was 80% whereas for sketches only the inter-rater agreement was 65%. The quantity metric provides an acceptable level of inter-rater agreement for the data containing words only or words and sketches but is lower than desired for the sketches only data. The reason for the lower sketches only inter-rater agreement is that sketches leave more room for interpretation than verbal descriptions. The sketch quality was low in most cases. The participants in the sketches only condition did add verbal descriptions of their ideas after completion of the experiment, but these verbal descriptions tended to be shorter and less detailed than the descriptions contained within the sketches and words data. This required more interpretation on what was contained in the sketches and thus a lower lever of inter-rater agreement. Since the counting rules were being applied consistently by each judge and to minimize the variance due to using different judges, the analysis of the data was completed using only comprehensive judge’s results.
5. RESULTS AND DISCUSSION 5.1 Experiment Results This study has a number of interesting results. Judging the aggregate results qualitatively, the concepts generated by the participants have a high aggregate quantity, novelty, and quality. Participants obviously committed their time seriously to a real-world problem that seeks an innovative solution. Building on this general assessment, the discussion presents the results, following the order of our basic research questions.
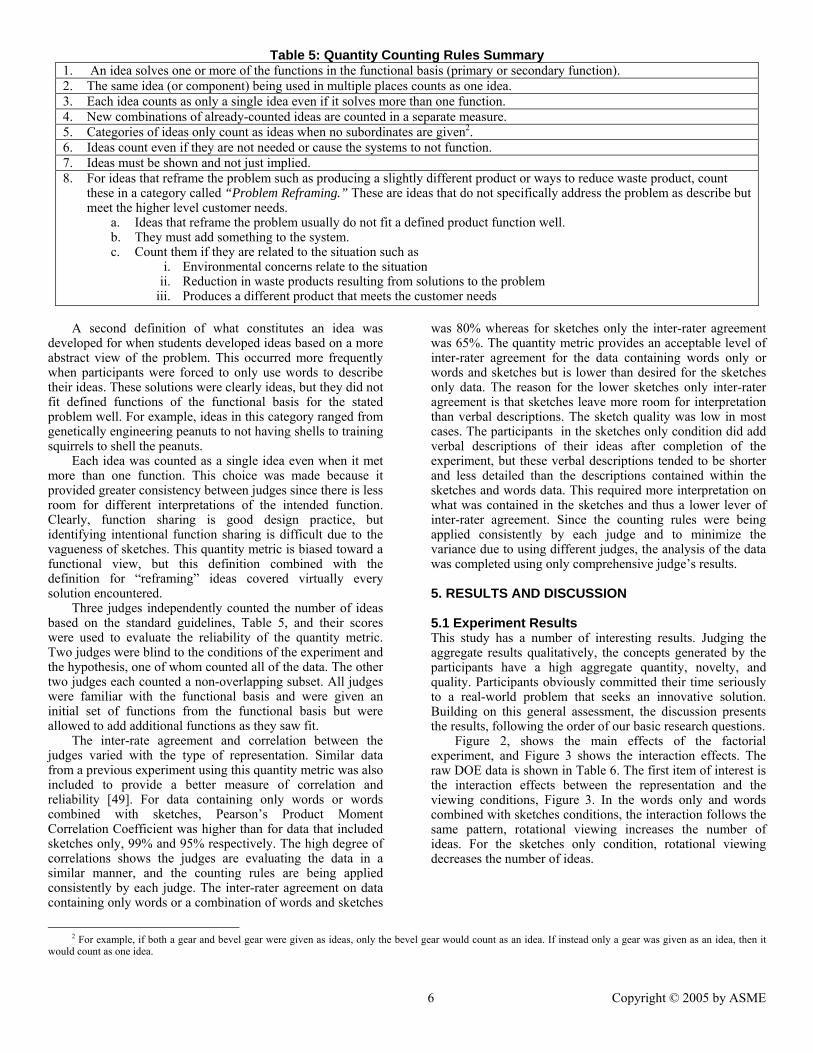
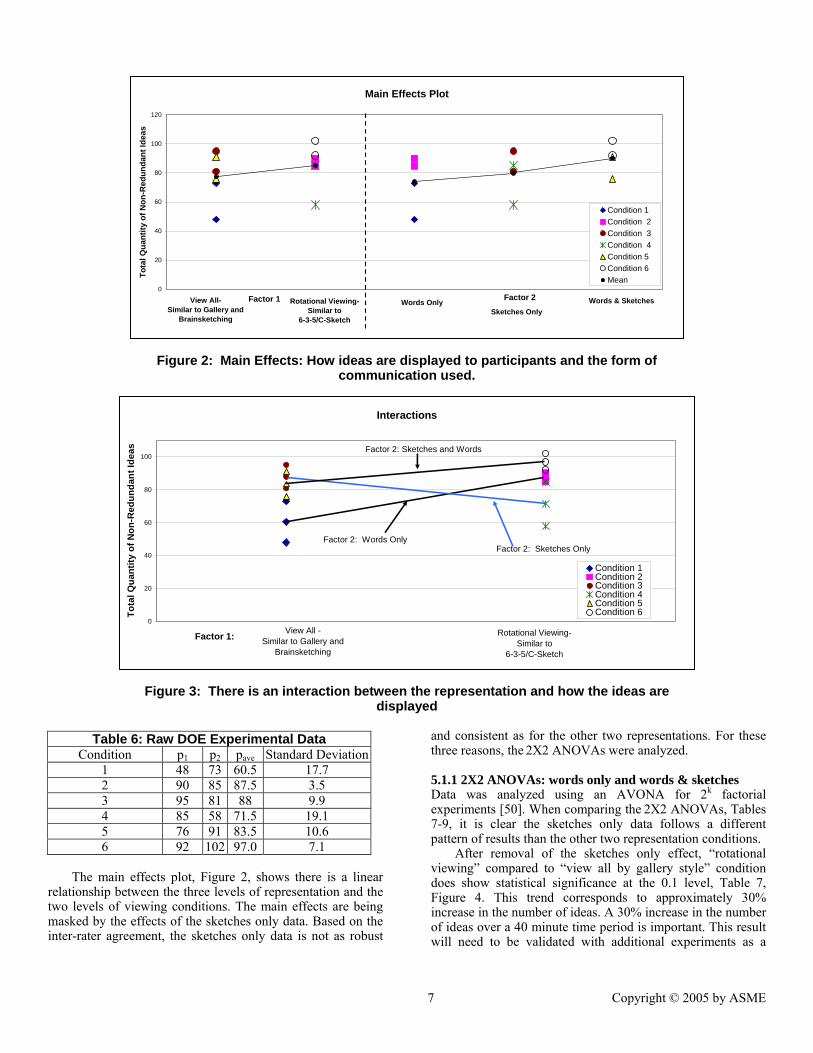
Figure 2, shows the main effects of the factorial experiment, and Figure 3 shows the interaction effects. The raw DOE data is shown in Table 6. The first item of interest is the interaction effects between the representation and the viewing conditions, Figure 3. In the words only and words combined with sketches conditions, the interaction follows the same pattern, rotational viewing increases the number of ideas. For the sketches only condition, rotational viewing decreases the number of ideas.
7 Copyright © 2005 by ASME
Figure 2: Main Effects: How ideas are displayed to participants and the form of
communication used.
Figure 3: There is an interaction between the representation and how the ideas are
displayed
The main effects plot, Figure 2, shows there is a linear
relationship between the three levels of representation and the two levels of viewing conditions. The main effects are being masked by the effects of the sketches only data. Based on the inter-rater agreement, the sketches only data is not as robust
and consistent as for the other two representations. For these three reasons, the 2X2 ANOVAs were analyzed.
5.1.1 2X2 ANOVAs: words only and words & sketches Data was analyzed using an AVONA for 2k factorial experiments [50]. When comparing the 2X2 ANOVAs, Tables 7-9, it is clear the sketches only data follows a different pattern of results than the other two representation conditions.
After removal of the sketches only effect, “rotational viewing” compared to “view all by gallery style” condition does show statistical significance at the 0.1 level, Table 7, Figure 4. This trend corresponds to approximately 30% increase in the number of ideas. A 30% increase in the number of ideas over a 40 minute time period is important. This result will need to be validated with additional experiments as a
Table 6: Raw DOE Experimental Data Condition p1 p2 pave Standard Deviation
1 48 73 60.5 17.7 2 90 85 87.5 3.5 3 95 81 88 9.9 4 85 58 71.5 19.1 5 76 91 83.5 10.6 6 92 102 97.0 7.1
Main Effects Plot
0
20
40
60
80
100
120
Tota
l Qua
ntity
of N
on-R
edun
dant
Idea
s
Condition 1Condition 2Condition 3Condition 4Condition 5Condition 6Mean
View All- Similar to Gallery and
Brainsketching
Rotational Viewing- Similar to
6-3-5/C-Sketch
Factor 1 Factor 2Words Only Words & SketchesSketches Only
Interactions
0
20
40
60
80
100
Tota
l Qua
ntity
of N
on-R
edun
dant
Idea
s
Condition 1Condition 2Condition 3Condition 4Condition 5Condition 6
View All - Similar to Gallery and
Brainsketching
Factor 1: Rotational Viewing- Similar to
6-3-5/C-Sketch
Factor 2: Sketches and Words
Factor 2: Words OnlyFactor 2: Sketches Only
8 Copyright © 2005 by ASME
function of greater time periods. The combined use of sketches and words as compared to only words also increases the total number of ideas by about 20% but was not statistically significant.
Table 7: Summary of 2X2 ANOVA Results,
Words Only and Sketches & Words Conditions Sum of
Squares Degrees of Freedom
Mean Square
F
Display 820 1 820 6.73* Representation 528 1 528 4.33 Interaction 91 1 91 0.75 Error 488 4 121 Total 1927 7
*statically significant results at the 0.1 level
Figure 4: Main Effects not including the sketches only
conditions 5.1.2 2X2 ANOVAs: words only and sketches only
From Table 8, the interaction between the form of representation (words or sketches only) and how the ideas were displayed dominations the variation for this comparison.
Table 8: Summary of 2X2 ANOVA Results, Words Only and Sketches Only Conditions
Sum of Squares
Degrees of Freedom
Mean Square
F
Display 55 1 55 0.28 Representation 66 1 66 0.34 Interaction 946 1 946 4.8* Error 788 4 197 Total 1855 7
*statically significant results at the 0.1 level
5.1.3 2X2 ANOVAs: words & sketches and sketches only From Table 9, the interaction between the form of representation (words or sketches only) and how the ideas were displayed again dominations the variation for this comparison.
Table 9: Summary of 2X2 ANOVA Results,
Sketch & Words and Sketches Only Conditions Sum of
Squares Degrees of Freedom
Mean Square
F
Display 4.5 1 4.5 0.029 Representation 220 1 220 1.4 Interaction 450 1 450 2.88 Error 625 4 156 Total 1300 7
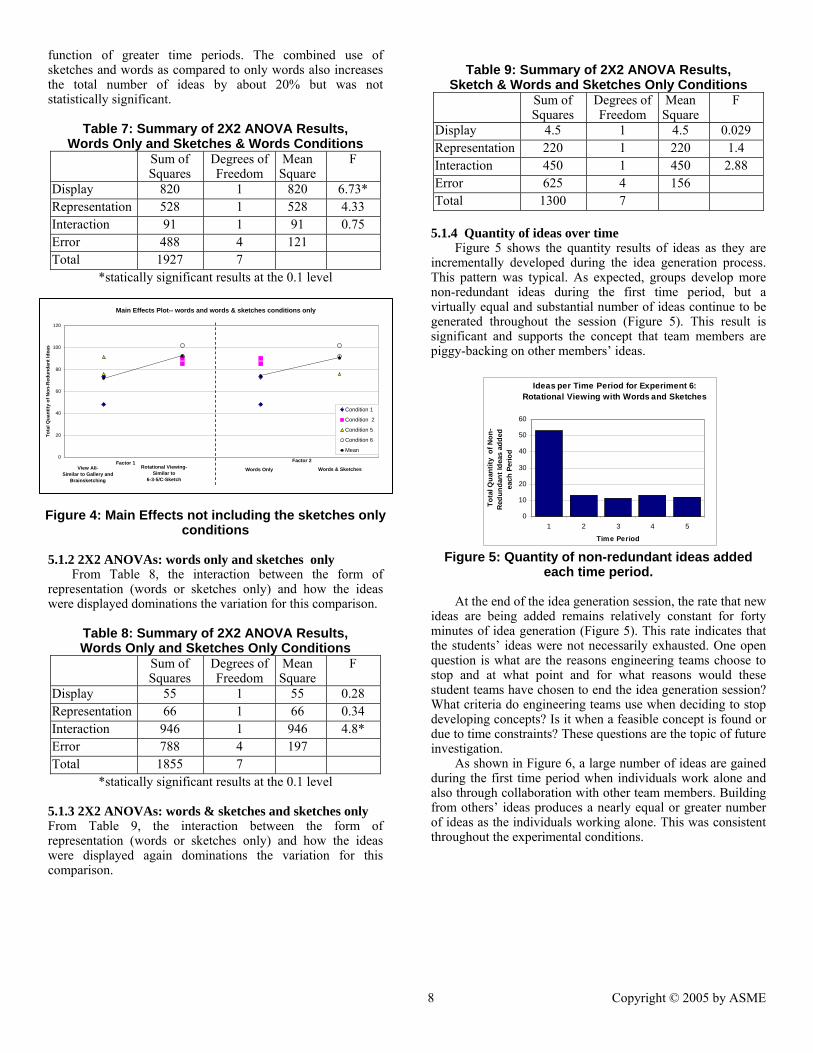
5.1.4 Quantity of ideas over time
Figure 5 shows the quantity results of ideas as they are incrementally developed during the idea generation process. This pattern was typical. As expected, groups develop more non-redundant ideas during the first time period, but a virtually equal and substantial number of ideas continue to be generated throughout the session (Figure 5). This result is significant and supports the concept that team members are piggy-backing on other members’ ideas.
Figure 5: Quantity of non-redundant ideas added each time period.
At the end of the idea generation session, the rate that new
ideas are being added remains relatively constant for forty minutes of idea generation (Figure 5). This rate indicates that the students’ ideas were not necessarily exhausted. One open question is what are the reasons engineering teams choose to stop and at what point and for what reasons would these student teams have chosen to end the idea generation session? What criteria do engineering teams use when deciding to stop developing concepts? Is it when a feasible concept is found or due to time constraints? These questions are the topic of future investigation.
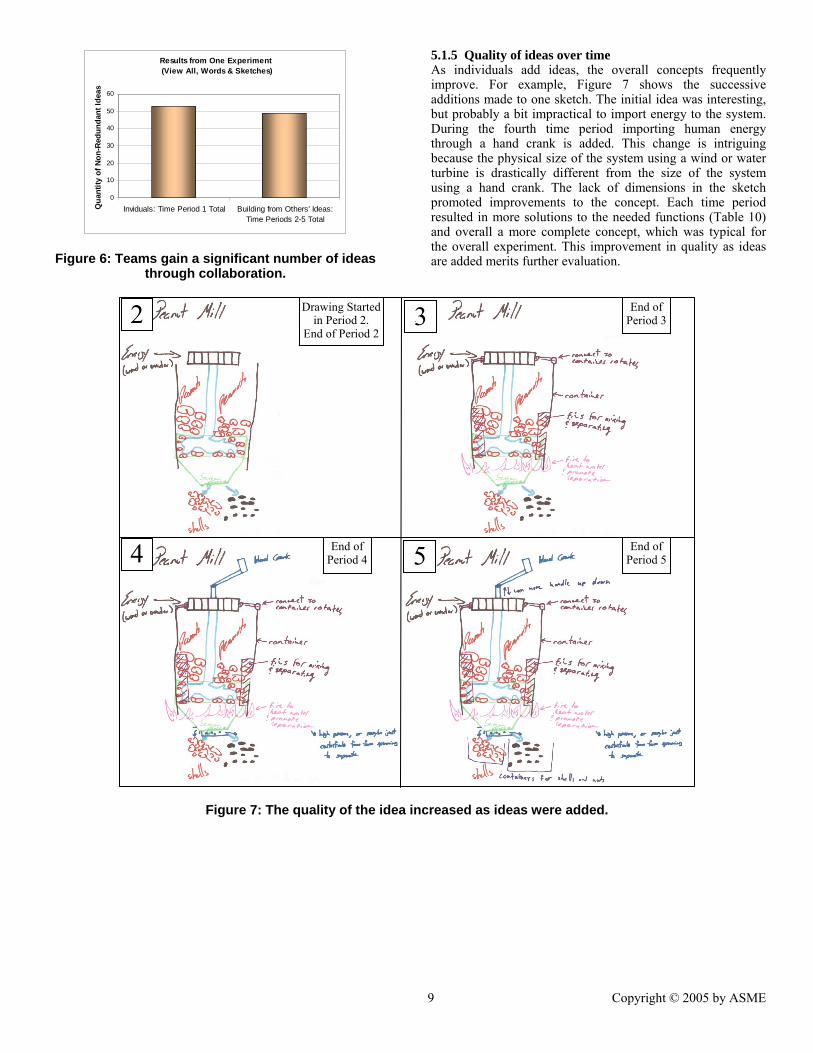
As shown in Figure 6, a large number of ideas are gained during the first time period when individuals work alone and also through collaboration with other team members. Building from others’ ideas produces a nearly equal or greater number of ideas as the individuals working alone. This was consistent throughout the experimental conditions.
Main Effects Plot-- words and words & sketches conditions only
0
20
40
60
80
100
120
Tota
l Qua
ntity
of N
on-R
edun
dant
Idea
s
Condition 1
Condition 2
Condition 5
Condition 6
Mean
View All- Similar to Gallery and
Brainsketching
Rotational Viewing- Similar to
6-3-5/C-Sketch
Factor 1 Factor 2
Words Only Words & Sketches
Ideas per Time Period for Experiment 6: Rotational Viewing with Words and Sketches
0
10
20
30
40
50
60
1 2 3 4 5
Time Period
Tota
l Qua
ntity
of N
on-
Red
unda
nt Id
eas
adde
d ea
ch P
erio
d
9 Copyright © 2005 by ASME
Figure 6: Teams gain a significant number of ideas
through collaboration.
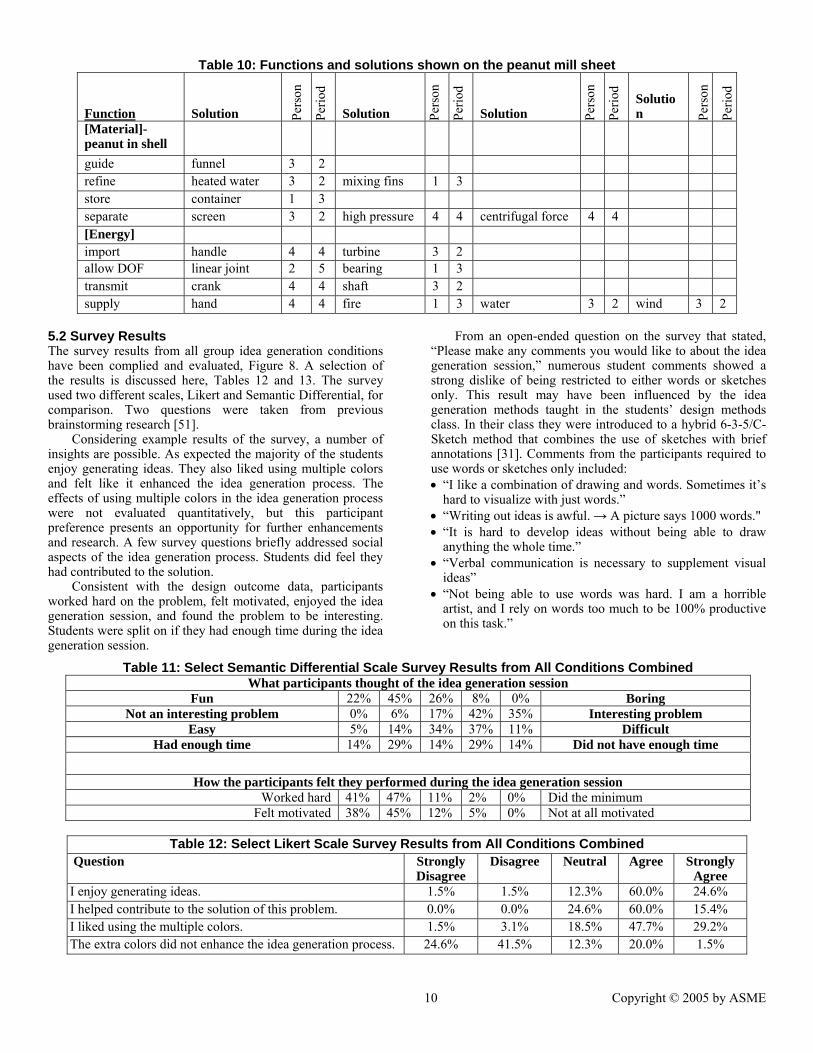
5.1.5 Quality of ideas over time As individuals add ideas, the overall concepts frequently improve. For example, Figure 7 shows the successive additions made to one sketch. The initial idea was interesting, but probably a bit impractical to import energy to the system. During the fourth time period importing human energy through a hand crank is added. This change is intriguing because the physical size of the system using a wind or water turbine is drastically different from the size of the system using a hand crank. The lack of dimensions in the sketch promoted improvements to the concept. Each time period resulted in more solutions to the needed functions (Table 10) and overall a more complete concept, which was typical for the overall experiment. This improvement in quality as ideas are added merits further evaluation.
Figure 7: The quality of the idea increased as ideas were added.
End of Period 4
End of Period 5
Drawing Started in Period 2.
End of Period 2
End of Period 32 3
4 5
Results from One Experiment (View All, Words & Sketches)
0
10
20
30
40
50
60
Inviduals: Time Period 1 Total Building from Others' Ideas:Time Periods 2-5 Total
Qua
ntity
of N
on-R
edun
dant
Idea
s
10 Copyright © 2005 by ASME
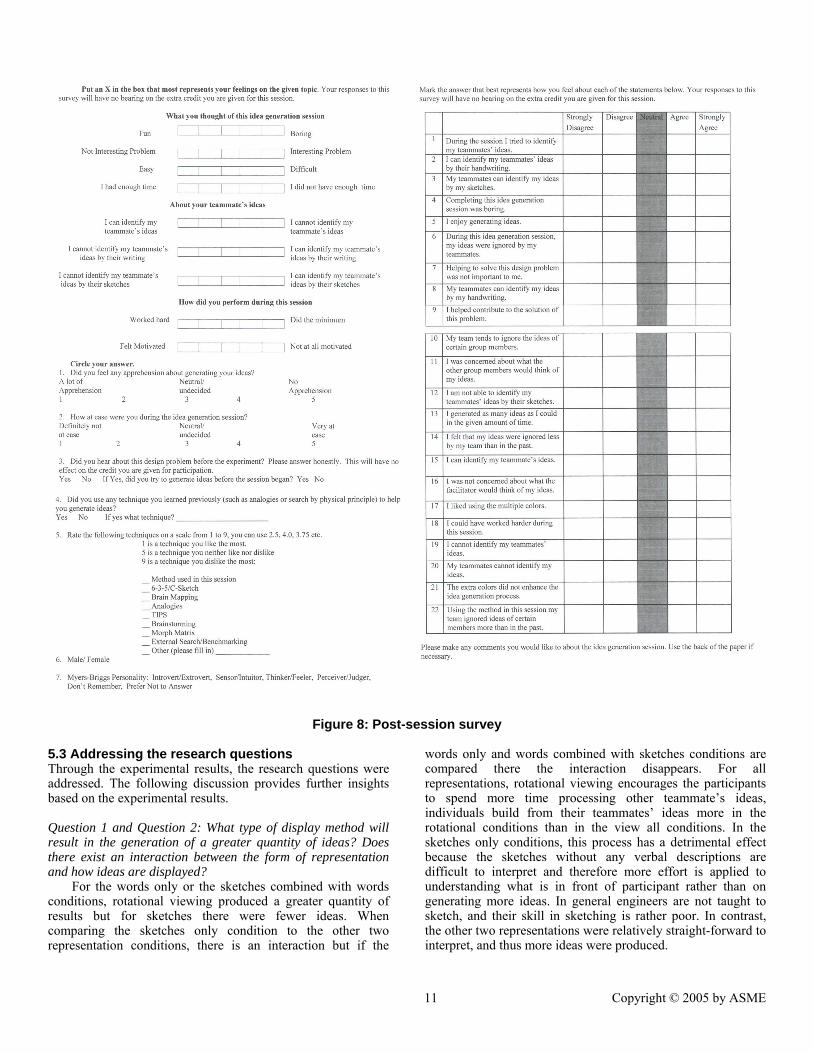
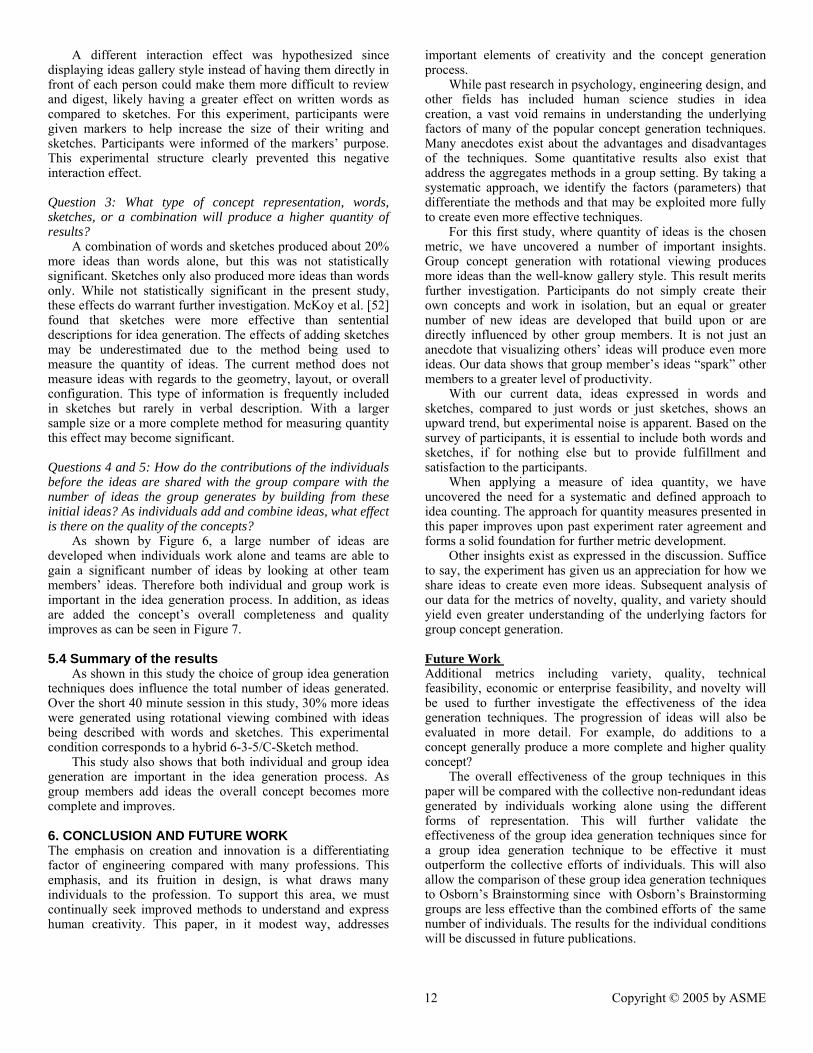
5.2 Survey Results The survey results from all group idea generation conditions have been complied and evaluated, Figure 8. A selection of the results is discussed here, Tables 12 and 13. The survey used two different scales, Likert and Semantic Differential, for comparison. Two questions were taken from previous brainstorming research [51].
Considering example results of the survey, a number of insights are possible. As expected the majority of the students enjoy generating ideas. They also liked using multiple colors and felt like it enhanced the idea generation process. The effects of using multiple colors in the idea generation process were not evaluated quantitatively, but this participant preference presents an opportunity for further enhancements and research. A few survey questions briefly addressed social aspects of the idea generation process. Students did feel they had contributed to the solution.
Consistent with the design outcome data, participants worked hard on the problem, felt motivated, enjoyed the idea generation session, and found the problem to be interesting. Students were split on if they had enough time during the idea generation session.
From an open-ended question on the survey that stated, “Please make any comments you would like to about the idea generation session,” numerous student comments showed a strong dislike of being restricted to either words or sketches only. This result may have been influenced by the idea generation methods taught in the students’ design methods class. In their class they were introduced to a hybrid 6-3-5/C-Sketch method that combines the use of sketches with brief annotations [31]. Comments from the participants required to use words or sketches only included: • “I like a combination of drawing and words. Sometimes it’s
hard to visualize with just words.” • “Writing out ideas is awful. → A picture says 1000 words." • “It is hard to develop ideas without being able to draw
anything the whole time.” • “Verbal communication is necessary to supplement visual
ideas” • “Not being able to use words was hard. I am a horrible
artist, and I rely on words too much to be 100% productive on this task.”
Table 11: Select Semantic Differential Scale Survey Results from All Conditions Combined What participants thought of the idea generation session
Fun 22% 45% 26% 8% 0% Boring Not an interesting problem 0% 6% 17% 42% 35% Interesting problem
Easy 5% 14% 34% 37% 11% Difficult Had enough time 14% 29% 14% 29% 14% Did not have enough time
How the participants felt they performed during the idea generation session Worked hard 41% 47% 11% 2% 0% Did the minimum
Felt motivated 38% 45% 12% 5% 0% Not at all motivated
Table 12: Select Likert Scale Survey Results from All Conditions Combined Question Strongly
Disagree Disagree Neutral Agree Strongly
Agree I enjoy generating ideas. 1.5% 1.5% 12.3% 60.0% 24.6% I helped contribute to the solution of this problem. 0.0% 0.0% 24.6% 60.0% 15.4% I liked using the multiple colors. 1.5% 3.1% 18.5% 47.7% 29.2% The extra colors did not enhance the idea generation process. 24.6% 41.5% 12.3% 20.0% 1.5%
Table 10: Functions and solutions shown on the peanut mill sheet
Function Solution Pers
on
Perio
d
Solution Pers
on
Perio
d
Solution Pers
on
Perio
d
Solution Pe
rson
Perio
d
[Material]- peanut in shell
guide funnel 3 2 refine heated water 3 2 mixing fins 1 3 store container 1 3 separate screen 3 2 high pressure 4 4 centrifugal force 4 4 [Energy] import handle 4 4 turbine 3 2 allow DOF linear joint 2 5 bearing 1 3 transmit crank 4 4 shaft 3 2 supply hand 4 4 fire 1 3 water 3 2 wind 3 2
11 Copyright © 2005 by ASME
Figure 8: Post-session survey
5.3 Addressing the research questions Through the experimental results, the research questions were addressed. The following discussion provides further insights based on the experimental results. Question 1 and Question 2: What type of display method will result in the generation of a greater quantity of ideas? Does there exist an interaction between the form of representation and how ideas are displayed?
For the words only or the sketches combined with words conditions, rotational viewing produced a greater quantity of results but for sketches there were fewer ideas. When comparing the sketches only condition to the other two representation conditions, there is an interaction but if the
words only and words combined with sketches conditions are compared there the interaction disappears. For all representations, rotational viewing encourages the participants to spend more time processing other teammate’s ideas, individuals build from their teammates’ ideas more in the rotational conditions than in the view all conditions. In the sketches only conditions, this process has a detrimental effect because the sketches without any verbal descriptions are difficult to interpret and therefore more effort is applied to understanding what is in front of participant rather than on generating more ideas. In general engineers are not taught to sketch, and their skill in sketching is rather poor. In contrast, the other two representations were relatively straight-forward to interpret, and thus more ideas were produced.
12 Copyright © 2005 by ASME
A different interaction effect was hypothesized since displaying ideas gallery style instead of having them directly in front of each person could make them more difficult to review and digest, likely having a greater effect on written words as compared to sketches. For this experiment, participants were given markers to help increase the size of their writing and sketches. Participants were informed of the markers’ purpose. This experimental structure clearly prevented this negative interaction effect. Question 3: What type of concept representation, words, sketches, or a combination will produce a higher quantity of results?
A combination of words and sketches produced about 20% more ideas than words alone, but this was not statistically significant. Sketches only also produced more ideas than words only. While not statistically significant in the present study, these effects do warrant further investigation. McKoy et al. [52] found that sketches were more effective than sentential descriptions for idea generation. The effects of adding sketches may be underestimated due to the method being used to measure the quantity of ideas. The current method does not measure ideas with regards to the geometry, layout, or overall configuration. This type of information is frequently included in sketches but rarely in verbal description. With a larger sample size or a more complete method for measuring quantity this effect may become significant. Questions 4 and 5: How do the contributions of the individuals before the ideas are shared with the group compare with the number of ideas the group generates by building from these initial ideas? As individuals add and combine ideas, what effect is there on the quality of the concepts?
As shown by Figure 6, a large number of ideas are developed when individuals work alone and teams are able to gain a significant number of ideas by looking at other team members’ ideas. Therefore both individual and group work is important in the idea generation process. In addition, as ideas are added the concept’s overall completeness and quality improves as can be seen in Figure 7. 5.4 Summary of the results
As shown in this study the choice of group idea generation techniques does influence the total number of ideas generated. Over the short 40 minute session in this study, 30% more ideas were generated using rotational viewing combined with ideas being described with words and sketches. This experimental condition corresponds to a hybrid 6-3-5/C-Sketch method.
This study also shows that both individual and group idea generation are important in the idea generation process. As group members add ideas the overall concept becomes more complete and improves. 6. CONCLUSION AND FUTURE WORK The emphasis on creation and innovation is a differentiating factor of engineering compared with many professions. This emphasis, and its fruition in design, is what draws many individuals to the profession. To support this area, we must continually seek improved methods to understand and express human creativity. This paper, in it modest way, addresses
important elements of creativity and the concept generation process.
While past research in psychology, engineering design, and other fields has included human science studies in idea creation, a vast void remains in understanding the underlying factors of many of the popular concept generation techniques. Many anecdotes exist about the advantages and disadvantages of the techniques. Some quantitative results also exist that address the aggregates methods in a group setting. By taking a systematic approach, we identify the factors (parameters) that differentiate the methods and that may be exploited more fully to create even more effective techniques.
For this first study, where quantity of ideas is the chosen metric, we have uncovered a number of important insights. Group concept generation with rotational viewing produces more ideas than the well-know gallery style. This result merits further investigation. Participants do not simply create their own concepts and work in isolation, but an equal or greater number of new ideas are developed that build upon or are directly influenced by other group members. It is not just an anecdote that visualizing others’ ideas will produce even more ideas. Our data shows that group member’s ideas “spark” other members to a greater level of productivity.
With our current data, ideas expressed in words and sketches, compared to just words or just sketches, shows an upward trend, but experimental noise is apparent. Based on the survey of participants, it is essential to include both words and sketches, if for nothing else but to provide fulfillment and satisfaction to the participants.
When applying a measure of idea quantity, we have uncovered the need for a systematic and defined approach to idea counting. The approach for quantity measures presented in this paper improves upon past experiment rater agreement and forms a solid foundation for further metric development.
Other insights exist as expressed in the discussion. Suffice to say, the experiment has given us an appreciation for how we share ideas to create even more ideas. Subsequent analysis of our data for the metrics of novelty, quality, and variety should yield even greater understanding of the underlying factors for group concept generation.
Future Work Additional metrics including variety, quality, technical feasibility, economic or enterprise feasibility, and novelty will be used to further investigate the effectiveness of the idea generation techniques. The progression of ideas will also be evaluated in more detail. For example, do additions to a concept generally produce a more complete and higher quality concept?
The overall effectiveness of the group techniques in this paper will be compared with the collective non-redundant ideas generated by individuals working alone using the different forms of representation. This will further validate the effectiveness of the group idea generation techniques since for a group idea generation technique to be effective it must outperform the collective efforts of individuals. This will also allow the comparison of these group idea generation techniques to Osborn’s Brainstorming since with Osborn’s Brainstorming groups are less effective than the combined efforts of the same number of individuals. The results for the individual conditions will be discussed in future publications.
13 Copyright © 2005 by ASME
The survey results will be further analyzed. The results for the groups will be compared with the results from individuals to evaluate any differences caused by the idea generation method. The Myers-Briggs personality results will also be analyzed.
The form used to represent ideas may cause biases in the metrics and needs to be evaluated. An investigation is needed to evaluate if judges tend to rate ideas higher in quantity based on the form of representation, the quality of the sketch or handwriting. A second bias could be due to student behavior. One reason that sketches combined with words may result in more ideas is students may tend to inherently include more support functions when sketching then when writing ideas in words. This may benefit the design process but could bias idea generation results. One possible test for this would be to ask students to make a sketch of an idea on one sheet of paper and then to write a verbal description of the same idea on a separate sheet of paper.
The use of design by analogy, analogous products, and design reuse is prolific but there is little understanding of what constitutes a good representation for a design analogy. Representation of ideas can be in many forms that extend beyond the simple categorization as being words or pictures, including various physical models. Some forms of representation intentionally exclude or highlight certain types of information while other forms attempt to include all important information. Numerous formal design and analytical methods use various diagrams, a type of pictures, to represent information. Diagrams range from bond graphs, to force flow diagrams, and function structures. Each representation (method and diagram) makes certain pieces of information more accessible while other information is hidden or absent. In a similar manner, physical models can contain different types of information and will have varying effects when used in the idea generation process. Physical models range from scale models that contain geometry information only to a full working product. A deeper understanding of how different forms of representation are used along with the benefits and drawbacks to the different forms must be sought. This will not only improve methods for concept generation but representations for other design methods as well.
ACKNOWLEDGMENTS The authors would like to acknowledge the support provided from the Cullen Endowed Professorship in Engineering, The University of Texas at Austin.
REFERENCES [1] Römer, A., Weißhahn, G. and Hacker, W., 2001, “Effort-
saving product representations in design –results of a questionnaire survey,” Design Studies, 22(6), pp. 473-490.
[2] Adams, J. L., 1986, Conceptual Blockbusting, Perseus Books, Cambridge, ME.
[3] VanGundy, A. B., 1988, Techniques of Structured Problem Solving, 2nd edition, Van Nostrand Reinhold Company, New York, NY
[4] Higgins, J. M., 1994, 101 Creative Problem Solving Techniques, The New Management Publishing Company, Winter Park, FL.
[5] Osborn, A., 1957, Applied Imagination. Scribner, New
York, NY. [6] Altshuller, G. S., 1984, Creativity as an Exact Science,
Gordon and Breach Publishers, Luxembourg. [7] Lewis, A. C., Sadosky, T. L. and Connolly, T., 1975, “The
Effectiveness of Group Brainstorming in Engineering Problem Solving,” IEEE Transactions on Engineering Management, EM-22 (3), pp. 119-127.
[8] Mullen, B., Johnson, C. and Salas, E., 1991, “Productivity Loss in Brainstorming Groups: A Meta-Analytic Integration,” Basic and Applied Social Psychology, 12(1), pp. 3-23.
[9] Collins, A. M., and Loftus, E. F., 1975, “A Spreading-Activation Theory of Semantic Priming,” Psychological Review, 82(6), pp. 407-428
[10] Anderson, J.R., 1983, “A Spreading Activation Theory of Memory,” Journal of Verbal Learning and Verbal Behavior, 22, pp. 261-295
[11] Raaijmakers, J. G. W., and Shiffrin, R. M., 1981, “Search of Associative Memory,” Psychological Review, 88(2), pp. 93-133
[15] Gryskiewicz, S. S., 1988, “Trial by Fire in an Industrial Setting: A Practical Evaluation of Three Creative Problem-Solving Techniques,” In K. Gronhaug, and G. Kaufmann (Eds.), Innovation: A Cross-Disciplinary Perspective, Norwegian University Press, Oslo, Norway, pp. 205-232.
[16] Paulus, P. B., and Yang, H. C., 2000, “Idea Generation in Groups: A Basis for Creativity in Organizations,” Organizational Behavior and Human Decision Processes, 82(1), pp. 76-87.
[17] Shah, J. J., 1998, “Experimental Investigation of Progressive Idea Generation Techniques in Engineering Design,” Proceedings of the DETC’98, 1998 ASME Design Engineering Technical Conferences, Atlanta, GA.
[18] Van der Lugt, R., 2002, “Brainsketching and How it Differs from Brainstorming,” Creativity and Innovation Management, 11(1), pp. 43-54.
[19] Shah, J. J., Kulkarni, S. V. and Vargas-Hernández, N., 2000, “Evaluation of Idea Generation Methods for Conceptual Design: Effectiveness Metrics and Design of Experiments,” Transactions of the ASME Journal of Mechanical Design, 122, pp. 377-384.
[20] Shah, J. J., Vargas-Hernández, N., and Smith, S. M., 2003, “Metrics for Measuring Ideation Effectiveness,” Design Studies, 24, pp. 111-134.
[21] Vidal, R., Mulet, E., and Gómez-Senent, E., 2004, “Effectiveness of the Means of Expression in Creative Problem-Solving in Design Groups,” Journal of Engineering Design, 15(3), pp. 285-298.
[22] Barrlett, J. C., Till, R. E., and Leavy, J. C., 1980, “Retrieval Characteristics of Complex Pictures: Effect of Verbal Encoding,” Journal of Verbal Learning and Verbal Behavior, 19, pp. 430-449
[23] Loftus, G. R., & Kallman, H. J., 1979, “Encoding and Use of Detail Information in Picture Recognition,” Journal of Experimental Psychology: Human Learning and Memory, 5, pp. 197-211
14 Copyright © 2005 by ASME
[24] Mandler, G., 1980, “Recognizing: The Judgment of
Previous Occurrence,” Psychological Review, 87, pp. 252-271
[25] Paivio, A., 1986, Mental Representations: A Dual Coding Approach. New York, Oxford University Press
[26] Schooler, J. W., Fiore, S. M., and Brandimonte, M. A., 1997, “At a Loss From Words: Verbal Overshadowing of Perceptual Memories,” In D. L. Medin (Ed), The Psychology of Learning and Motivation: Advances in Research and Theory, 37, Academic Press, San Diego
[27] Shah, J. J., Vargas-Hernández, N., Summers, J. S., and Kulkarni, S., 2001, “Collaborative Sketching (C-Sketch) – An Idea Generation Technique for Engineering Design.” Journal of Creative Behavior, 35(3), pp. 168-198.
[28] Diehl, M. and Stroebe, W., 1987, “Productivity Loss in Brainstorming Groups: Toward the Solution of a Riddle.” Journal of Personality and Social Psychology, 53(3), pp. 497-509.
[29] Pahl, G., and Beitz, W., 1996, Engineering Design—A Systematic Approach, 2nd edition, Springer, London.
[30] Rohrbach, B., 1969,“Kreativ nach Regeln – Methode 635, eine Neue Technik zum Lösen von Problemen,” Absatzwirtschaft, 12, pp. 73-75.
[31] Otto, K. and Wood, K., 2001, Product Design. Prentice Hall, Upper Saddle River, NJ.
[32] Ulrich, K. T., and Eppinger, S. D., 2004, Product Design and Development, McGraw Hill, Boston, MA.
[33] Ward, T. B., 1998, “Analogical Distance and Purpose in Creative Thought: Mental Leaps versus Mental Hops,” In K. Holyoak, D. Gentner, and B. Kokinov (Eds.), Advances in Analogy Research: Integration of Theory and Data from the Cognitive, Computational, and Neural Sciences, Sofia: New Bulgarian University.
[34] Jensen, D.D., Murphy, M.D., and Wood, K.L.,1998, “Evaluation and Refinement of a Restructured Introduction to Engineering Design Course Using Student Surveys and MBTI Data,” ASEE Annual Conference, Seattle, WA, CD-ROM, ASEE-1998-0206, Session 2666.
[35] Jensen, D., Bowe, M., 1999, “Hands-on Experiences to Enhance Learning of Design: Effectiveness in a Reverse Engineering / Redesign Context When Correlated with MBTI and VARK Types,” Proceedings of ASEE Annual Conf., Charlotte, NC.
[36] Jensen, D., Feland, J., Bowe, M., Self, B., 2000, “A 6-Hats Based Team Formation Strategy: Development and Comparison with an MBTI Based Approach”, Proceedings of the ASEE Annual Conference, St Louis.
[37] Jensen, D., Wood, K., 2000,“Incorporating Learning Styles to Enhance Mechanical Engineering Curricula by Restructuring Courses, Increasing Hands-on Activities, & Improving Team Dynamics”, ASME Publication & Presentation for the Award for the Most Innovative Curriculum for the year 2000, Presented at the ASME Annual Conference, Orlando, FL.
[38] Wood, K., Jensen, D., Bezdek, J., Otto, K., 2001,“Reverse Engineering and Redesign: Courses to Incrementally and Systematically Teach Design”, Journal of Engineering Education, July, pp. 363-374.
[39 ]“ThinkSpace: Peanut Sheller,” Accessed March 2004,
http://www.thinkcycle.org/tc-space/tspace?tspace_id=41963.
[40 ]Bouchard, T. J. Jr., 1969, “Personality, Problem-Solving Procedure, and Performance in Small Groups,” Journal of Applied Psychology Monograph, 53(1), pp. 1-29.
[41] Parnes, S. J., and Meadow, A., 1959, “Effects of “Brainstorming” Instructions on Creative Problem Solving by Trained and Untrained Subjects,” Journal of Educational Psychology, pp. 171-176.
[42] Goldschmidt, G., 1996, “The Designer as a Team of One,” in N. Cross, H. Christiaans, and K. Dorst (editors) Analyzing Design Activity, Wiley, Chichester, UK, pp. 65-92.
[43] Goldschmidt, G., 1998, “Contents and Structure in Design Reasoning,” Design Issues, 14(3), pp. 85-100.
[44] Paulus, P. B., Dzindolet, M. T., Poletes, G., and Camacho, L. M., 1993, “Perception of Performance in Group Brainstorming: The Illusion of Group Productivity,” Personality and Social Psychology Bulletin, 19(1), pp. 78-89.
[45] Fleming, G. P., 2000, The Effects of Brainstorming on Subsequent Problem Solving, Ph.D. thesis, Saint Louis University, St. Louis, MO.
[46] Stone, R. and Wood, K., 2000, "Development of a Functional Basis for Design," Journal of Mechanical Design, 122(4), pp. 359-370.
[47] Kurfman, M. A., Stock, M. E., and Stone, R. B., 2003, “Experimental Studies Assessing the Repeatability of a Functional Modeling Derivation Method,” Journal of Mechanical Design, 125, pp. 682-693.
[48] Hirtz, J., Stone, R. B., and McAdams, D. A., 2002, “A Functional Basis for Engineering Design: Reconciling and Evolving Previous Efforts,” Research in Engineering Design, 13, pp. 65-82.
[49] Linsey, J. S., Green, M. G., Van Wie, M., Wood, K. L., and Stone, R., 2005, “Functional Representations in Conceptual Design: A First Study in Experimental Design and Evaluation,” Proceedings of 2005 American Society for Engineering Education Annual Conference, Portland, Oregon, submitted for review.
[50]Montgomery, D. C., 1991, Design and Analysis of Experiments, 3rd ed., John Wiley & Sons, New York, NY.
[51] Dennis, A. R. and Valacich, J. S., 1993, “Computer Brainstorms: More Heads are Better than One.” Journal of Applied Psychology, 78(4), pp. 531-537
[52] McKoy, F. L., Vargas-Hernández, N., Summers, J. D., and Shah, J. J., 2001, “Influence of Design Representation on Effectiveness of Idea Generation,” Proceedings of the DETC’01, 2001 ASME Design Engineering Technical Conferences, Pittsburgh, PA.