collecting low balances: squeezing the toothpaste tube · collecting low balances: squeezing the...
TRANSCRIPT

www.colburnhill.com 0
Collecting Low Balances: Squeezing the Toothpaste Tube By Jeff Means and Peter Angerhofer Colburn Hill Group January, 2017
www.colburnhill.com 1
EXECUTIVE SUMMARY Difficulties in recruiting and managing expert PFS staff, combined with a focus on the highest ROI opportunities, have meant most hospitals have underinvested in working low balance claims. The result is as much as 1% of net revenue goes uncollected. An understanding of those claims can demonstrate there is a positive ROI to working them, and the use of technology can give the investment one of the highest returns of any opportunity in your organization.
www.colburnhill.com 2
Table of Contents
EXECUTIVE SUMMARY 1
INTRODUCTION 3
INDUSTRY CHALLENGES 4
HOW TO INTERPRET YOUR LOW BALANCES 6
WAYS TO SQUEEZE THE PAYER TUBE 9
THE LOW BALANCE SOLUTION (LBS) 11
CONCLUSION 13
FOR MORE INFORMATION 14
www.colburnhill.com 3
INTRODUCTION On an almost monthly basis, each one of us faces a difficult dilemma: How many more brushes can I get from the thin, crinkled end of the toothpaste tube. If you’ve ever forgotten to stop at the drugstore on the way home, you know there’s almost always one more squeeze or fold available to draw out enough for one last brush. Knowing there is always a little bit left, the decision becomes one of effort – should I unroll it, fold it back the other way, and squeeze it against the countertop to get the last dollop? Or is it time to throw it away, open the top on a new tube and get an easy helping of minty fresh toothpaste? For many years, hospitals have treated their AR like an old tube of toothpaste, attempting to squeeze the final bit of toothpaste out, but eventually determining that the effort to get the last dollop was too great and tossing the tube aside, often if the form of annual clean ups and mass write-offs. This dynamic is particularly obvious in the area of low balance claims, which have been generally viewed as worth only a cursory squeeze, and not given the full refolding treatment. Some organizations have consciously de-emphasized claims with payer balances as large as $5,000. Compared to the larger and fresher claims available in a brand new tube, individual low balance claims are small and costly to work. However, when taken collectively, they add up and likely hold as much as 1% of a hospital’s net revenue, yet often don’t receive the attention they deserve. To squeeze the maximum amount out of AR, it is vital to first understand the barriers to collecting these claims, then offer some suggestions about how to assess the scale of this problem in your organization, and finally review solutions to the problem.
www.colburnhill.com 4
INDUSTRY CHALLENGES The Innocent but Vicious Circle of Low Balance Claims It starts innocently enough. It might be when work queues are being configured or it might be due to a sick leave or it might be because a special project draws attention away from the regular routine work. For whatever reason, the total volume of work that presents itself to your follow up staff exceeds the total capacity, even for a short period. Management and staff, with a highly-tuned ROI focus, know that the highest dollar return is in working higher balance claims, so they spend their time creaming the AR, seeking the biggest “bang for the buck.” They aggressively work the high dollar claims, intending to get back to those low dollar claims sometime later. But to get back to those claims “later” means finding a time when demand is lower than capacity; and in an era where resources are constrained and management is looking hard at every FTE, there are few, if any, organizations with the staffing levels required to provide excess capacity. This pattern repeats itself, slowly building up a population of claims which haven’t been worked, which are progressively aging, and whose value – expected collection rate – keeps dropping. And the scale of the required capacity is daunting – it follows the 80/20 rule, but in the extreme. Every organization is different, but a good rule of thumb is that 97% of the balance of your AR is in claims above $2500, and those claims account for only 15% of the volume of claims in active AR. Focusing resources there has the highest ROI and is an entirely logical approach. But ignoring the 3% eventually creates a bubble of AR that continues to build up. Managers may notice and ask staff to start working those claims, usually as a special project. They find claims which haven’t been worked in months, some of which may have exceeded timely filing rates, and so for every 5 claims touched only 3 are collectible. (Our research shows that about 60% of low balance claims have collection opportunities.) Managers and staff are already nervous about working these low dollar claims – since resources are scarce, they know that for every low dollar claim they work, they are not working a high dollar claim. It is one thing to work two $500 claims at the expense of a $10,000 claim, but when roughly every other $500 claim is dead, the effort seems not only low or negative ROI, but feels like a waste of time. When cleanup efforts are
www.colburnhill.com 5
initiated, they tend to be truncated – as short and small as possible – so that staff can get back to those high dollar claims, the ones that “really matter.” As a result, the health or value of the low dollar population gets even worse. The next time around the ratio of dead claims is even less favorable, reinforcing the notion that it just isn’t worth working those low dollar claims. Ultimately, most managers will resort to mass cleanups, adjusting thousands of claims all at once, which eliminates the dead claims, but washes out many viable ones with them. A few small balance claims being lost won’t make or break anyone’s P&L, but when thousands get washed down the drain, more than 1% of your net revenue goes with them.
www.colburnhill.com 6
HOW TO INTERPRET YOUR LOW BALANCES How much toothpaste remains in my tube? With a few easily obtained facts about your organization and a little bit of analytic work, you can get a good sense of how much of a problem this is in your organization. First, you can measure the demand for follow up relative to the capacity, and then look at whether there has been a buildup in your AR. Demand/Capacity Analysis Required Data
Number of Registrations in your organization – you can use annual or monthly or any time frame, as long as you keep the data consistent
Initial Denial Rate – what percentage of claims on remittances are denied?
Total Staff Productivity – how many claims are touched by follow up staff in the selected time frame
First, calculate the follow up demand. Initial denials typically represent half of the follow up work required – the other half consists of paper correspondence, posting issues, secondary claim issues, and payer take-backs – so double your initial denial rate and then multiply that rate times the number of registrations. For example, an organization might have an initial denial rate of 10% and 50000 registrations in a month. 50,000 * (2 *.10) = 10,000. This example organization needs to follow up on 10,000 claims per month. Next, calculate effective follow up capacity. Staff productivity alone is not sufficient since what we want to measure is the resolution rate, not just the number of touches. While some claims are resolved in one or two touches, some require attention over and over again before being resolved. We suggest using an average of 3 or 4 touches per claim resolved, or a resolution rate of 25%-33%. Multiply your staff productivity by the resolution rate to calculate your effective follow up capacity. For example, if there are 15 FTEs doing an average of 48 claims per day 20 days per month, your productivity is 14,400, but your effective capacity is 14,400 * .25 = 3600. Finally, subtract your effective capacity from the follow up demand to determine the number of claims that are likely going unworked each month. 10,000 – 3,600 = 6,400 using the examples above.
www.colburnhill.com 7
This analysis can also give you a good sense of where the low balance line is drawn in your organization. If you sort the claims in your AR from highest to lowest, your low balance line is likely somewhere near the dollar value of the claim that corresponds to your effective follow up capacity. In other words, if the 3,600th claim in the example above has a balance of $2,800, the threshold for low balance claims – those that you are not effectively working – is likely below, but relatively close to $2,800. AR Buildup Analysis Required Data
Summary of AR volume by balance and aging buckets – use whatever aging categories you usually look at and set a few dollar buckets near the low balance threshold you calculated above.
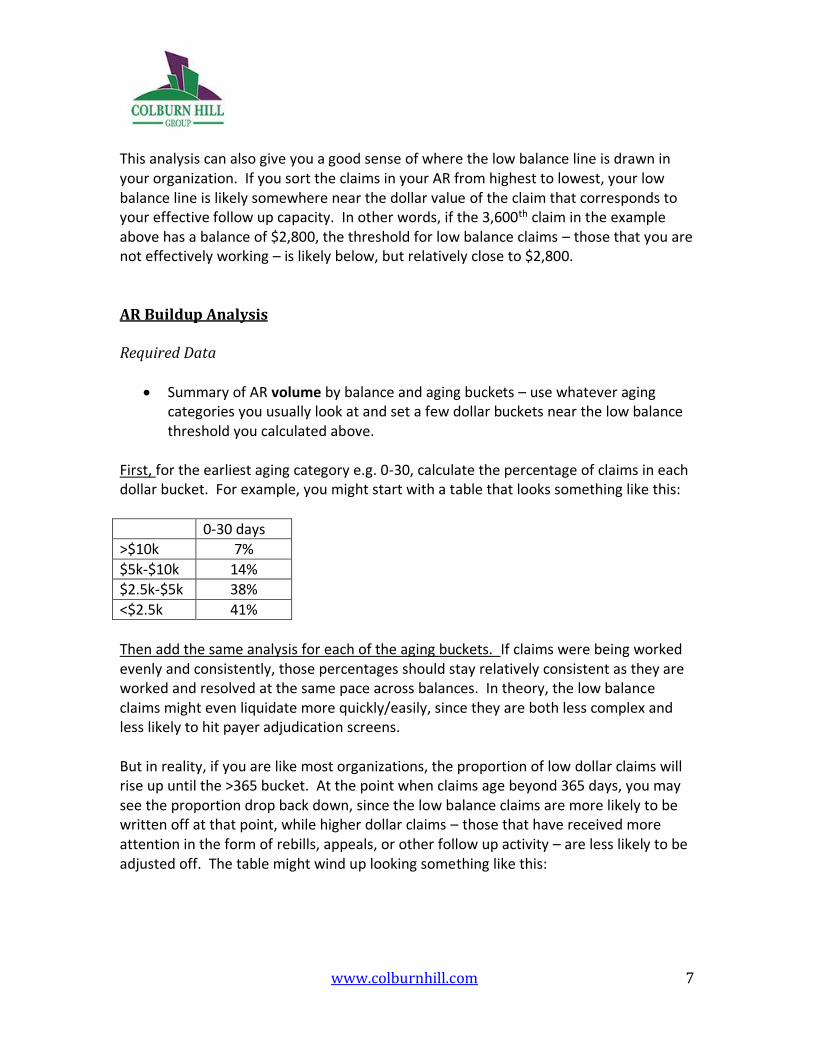
First, for the earliest aging category e.g. 0-30, calculate the percentage of claims in each dollar bucket. For example, you might start with a table that looks something like this:
0-30 days >$10k 7%
$5k-$10k 14%
$2.5k-$5k 38%
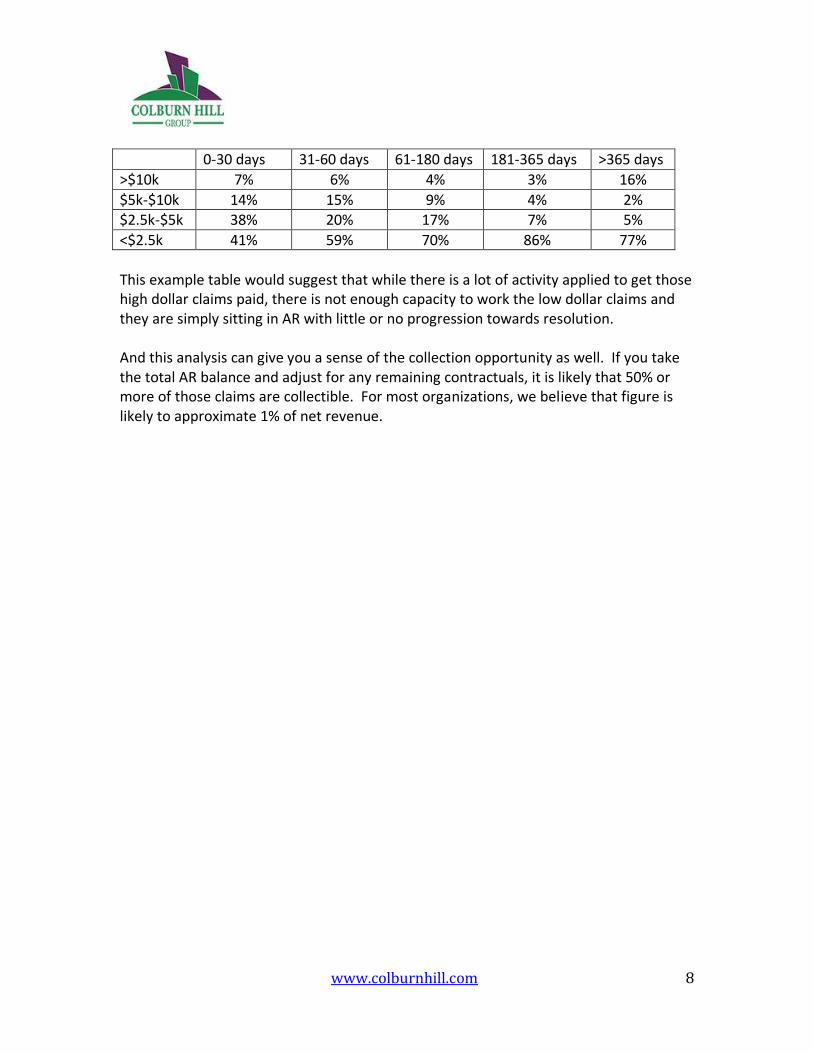
<$2.5k 41% Then add the same analysis for each of the aging buckets. If claims were being worked evenly and consistently, those percentages should stay relatively consistent as they are worked and resolved at the same pace across balances. In theory, the low balance claims might even liquidate more quickly/easily, since they are both less complex and less likely to hit payer adjudication screens. But in reality, if you are like most organizations, the proportion of low dollar claims will rise up until the >365 bucket. At the point when claims age beyond 365 days, you may see the proportion drop back down, since the low balance claims are more likely to be written off at that point, while higher dollar claims – those that have received more attention in the form of rebills, appeals, or other follow up activity – are less likely to be adjusted off. The table might wind up looking something like this:
www.colburnhill.com 8
0-30 days 31-60 days 61-180 days 181-365 days >365 days
>$10k 7% 6% 4% 3% 16%
$5k-$10k 14% 15% 9% 4% 2% $2.5k-$5k 38% 20% 17% 7% 5%
<$2.5k 41% 59% 70% 86% 77%
This example table would suggest that while there is a lot of activity applied to get those high dollar claims paid, there is not enough capacity to work the low dollar claims and they are simply sitting in AR with little or no progression towards resolution. And this analysis can give you a sense of the collection opportunity as well. If you take the total AR balance and adjust for any remaining contractuals, it is likely that 50% or more of those claims are collectible. For most organizations, we believe that figure is likely to approximate 1% of net revenue.
www.colburnhill.com 9
WAYS TO SQUEEZE THE PAYER TUBE A better toothpaste dispenser If something like 84% of your AR is going unworked you likely need to quintuple your follow up staff. (If 84% is unworked, that means only 16% is worked, or a little less than one-fifth of the total AR.) Some might find that statement shocking, but we are convinced there is a positive ROI to working claims down to a shockingly low level. That ROI has been largely ignored in the industry because it is a lower ROI than working high dollar claims, but it is nonetheless a positive ROI. ROI on expanding your staff If your fully loaded cost of labor is $30/hour, a minute of activity costs $.50 and working a claim for 10 minutes costs $5. Since a claim might need to be worked 4 times before it pays, that means it would cost $20 to get a claim paid. Therefore, any claim with an expected reimbursement (balance less contractuals) greater than $20 should be worked. That’s below the automatic write-off thresholds at many organizations! To be slightly more practical about it, we know that a large portion of low balance claims won’t pay due to aging, posting errors, etc. so we should raise that threshold a bit. If 60% pay and 40% don’t, working a given $20 claim will actually only yield $12, generating a negative ROI, so divide $20 by the 60% success ratio and you get a threshold of about $33. Add in some additional costs for management and infrastructure and let’s just round it up to $40. To put this more directly, if you were to hire enough PFS staff to work every claim down to $40 in balance, your organization would collect 1% or more in incremental revenue and materially improve the P&L. For most organizations, there are very few initiatives that result in a 1% improvement in collections and a low balance strategy should be high on their list, but there are a number of very reasonable barriers to achieving this improvement. Many PFS directors struggle to fill vacant positions with qualified staff, so quintupling (or even tripling) current staff would be a monumental effort, to say nothing of the logistical problems which would follow related to on-boarding, training, finding space, managing, etc.
www.colburnhill.com 10
Traditional Alternative One alternative is to engage a vendor in an outsourcing arrangement for these low balance claims, either on-shore or off-shore. Traditional outsourcing vendors will charge contingency rates of 10%-25% (depending on size and age of placements) but even off-shore vendors with very low costs structures face the same creaming incentives faced by the existing managers and staff. The lower the balance, the smaller the contingency payment, so they tend to focus on the higher dollar claims, performing the same 80/20 analysis within the low balance universe. To use the example above, a contingency vendor working the $40 claim above who collects 25% of every dollar collected, would receive 25% *$40 = $10, but on a $500 claim would receive $125. Assuming that the cost to work any given claim is roughly equal, the $500 claim could be worked 12 times and still provide a better return than working the $40 claim. And to be clear, these incentives are appropriate. Hospitals should want their higher dollar claims worked first and more thoroughly. But they need -- if they want to maximize their total return and not just their ROI -- to have the lower balance claims worked as well. Colburn Hill Group Alternative While most solutions in this area have focused on reducing the cost of the labor input, often by moving offshore, we decided to focus on reducing the amount of labor required to work the claims. To do so, we used a combination of business intelligence and automation that dramatically reduced the effort required to work low balance claims, and at the same time dramatically increased the return on the labor investment.
www.colburnhill.com 11
THE LOW BALANCE SOLUTION (LBS) Colburn Hill Group has developed a largely automated process which is able to effectively achieve a roughly 400% increase in productivity, allowing us to deliver quality work on low balance claims using combination of automation and a highly skilled staff at effective labor rates below those of even off-shore vendors. We apply four different solutions to the universe of low balance claims. First, utilizing a series of 600 proprietary algorithms, we triage the claims in the low balance category to identify those with no collection opportunity. These represent approximately 40% of claims and are commonly posting errors, denials with low likelihoods of collection, or those that have passed timely filing limits. For these claims we use automation software to apply appropriate adjustment or write-off codes directly into the patient accounting system. When these adjustments are taken by hospital staff as part of a periodic cleanup, the codes used are commonly very generic – something like “Too old to Bill” or “Mass write-off” – and therefore mask the underlying process failure which caused the loss of the claim. The failure is not identified so it cannot be corrected and it likely shows up again when the next cleanup occurs in 6 or 12 months. Because our algorithms provide clarity about the root cause of the write-off, we apply specific codes that detail why the claim was uncollectable and therefore offer insight that can be used for upstream process fixes. Second, the same algorithms identify claims that have simple fixes to improve collection opportunities. The most basic of these are claims where the posting process did not move the balance to the next payer or the patient. In other cases, the claim requires revisions or rebilling, but the actions are clear and discrete. As above, in these cases, we use a software interface to make the changes in the core system, transferring balances or rebilling claims to advance the collection process. These claims represent approximately 20% of the total population. In these first two cases, the process is entirely based on analytics and automation – in other words, we have addressed 60% of the population without any follow up labor. A hospital could (and many do!) achieve the same result by simply writing off those claims, but in doing so, they would be missing the opportunity to collect on the 20% of claims where there is a collection opportunity.
www.colburnhill.com 12
The third approach utilizes the analytics but not the automation. In some cases, the analytics suggest a next step, but automation is not an option. Before a triage category is automated, we require that it pass a 95% accuracy standard, tested through expert review and payer responses, to ensure that any automated activity taken on a claim is appropriate. About 25% of claims have a collection opportunity that is identified through our algorithms, but either the confidence rate for that category does not exceed 95% or the resolution steps are too complex for the automation. In these cases, we route the claims to our staff for manual review, but we also supply the triage category. By providing the “hint” that tells the staff where to look first, we are able to dramatically increase productivity. Finally, a relatively small percentage of claims – 15% -- do not fit into a triage category and require an entirely manual review. These claims are worked at benchmark productivity – about 40/day – to resolution by our staff. In sum, with 60% fully automated, 25% partially automated, and 15% manual, we achieve an eight-fold productivity increase, working far more claims, far more efficiently than traditional follow up or vendor processes. As a result, we can work 100% of claims without the 80/20 or creaming that is implicit in other models.
www.colburnhill.com 13
CONCLUSION While there is undeniably a positive ROI left in the tube of low balance claims, squeezing out those claims requires a significant effort. Increasing the existing staff by a multiple of current staffing levels would provide a positive return, but creates a number of practical barriers that most organizations cannot easily surmount. Traditional vendor solutions generally result in better returns, but because they employ similar strategies, they fail to maximize the total return. In any case, don’t be afraid to take on the extra work. With a little more exertion, you can squeeze another 1% collections out of that toothpaste tube. Both your dentist and your CFO will thank you.

www.colburnhill.com 14
FOR MORE INFORMATION
Please contact us with questions, comments, or for additional information. The Colburn Hill Group and authors of this paper can be reached through our website:
www.colburnhill.com/contact.html
or
by e-mailing [email protected]
We look forward to hearing from you!