collecting netflow with pmacct
TRANSCRIPT

SEE 3 mee'ng, Sofia – Apr 2014
Collec'ng NetFlow with pmacct
Paolo Lucente pmacct

Presenta'on history
§ 1.1: – MENOG 13 mee'ng, Kuwait City, Sep 2013
§ 1.2: – SEE 3 mee'ng, Sofia, Apr 2014

Agenda
o Introduction o pmacct architecture & benefits o example, data aggregation: traffic matrices
o example, logging micro-flows or events o tee: briefly on horizontal scalability
SEE 3 mee'ng, Sofia – Apr 2014
Collec'ng NetFlow with pmacct
whoami: Paolo
§ Been originally working for operators for a while § Been working for vendors for a liOle while aPer that § Been involved with IP accoun'ng for a while • Hence I stumbled upon NetFlow in the 90’s J
§ Within operators, network traffic telemetry is beneficial in several contexts, ie.: • Traffic engineering • Capacity planning • Peering • … • and also (ie. not only) security

libpcap
pmacct is open-‐source, free, GPL’ed soPware
sFlow
BGP
maps IGP
MySQL PgSQL SQLite
MongoDB BerkeleyDB
flat-files
RabbitMQ
memory tables
sFlow
tee
NetFlow IPFIX
NetFlow IPFIX
hOp://www.pmacct.net/
pmacct

Usage scenarios

Key pmacct non-‐technical facts
§ 10+ years old project § Can’t spell the name aPer the second drink § Free, open-‐source, independent § Under ac've development § Innova'on being introduced § Well deployed around, also large SPs § Aims to be the traffic accoun'ng tool closer to the SP community needs
Agenda
o Introduction
o pmacct architecture & benefits o example, data aggregation: traffic matrices
o example, logging micro-flows or events o tee: briefly on horizontal scalability
SEE 3 mee'ng, Sofia – Apr 2014
Collec'ng NetFlow with pmacct
Some technical facts (1/3)
§ Pluggable architecture • Straighborward to add support for new collec'on methods or backends
§ An abstrac'on layer allows out-‐of-‐the-‐box any collec'on method to interact with any backend
§ Both mul'-‐process and (coarse) mul'-‐threading • Mul'ple plugins (of same or different type) can be instan'ated at run'me, each with own config

Some technical facts (2/3)
BGP thread
NetFlow thread
Abstraction layer
Core Process
MySQL plugin
Print plugin (to flat-‐files)
Observed network Backends
Plugins
Pipe
Pipe
Some technical facts (3/3)
§ Pervasive data-‐reduc'on techniques, ie.: • Data aggrega'on • Tagging and filtering • Sampling
§ Ability to build mul'ple views out of the very same collected network traffic dataset , ie.: • Unaggregated to flat-‐files for security and forensic purposes
• Aggregated as [ <ingress router>, <ingress interface>, <BGP next-‐hop>, <peer des'na'on ASN> ] to build an internal traffic matrix for capacity planning purposes
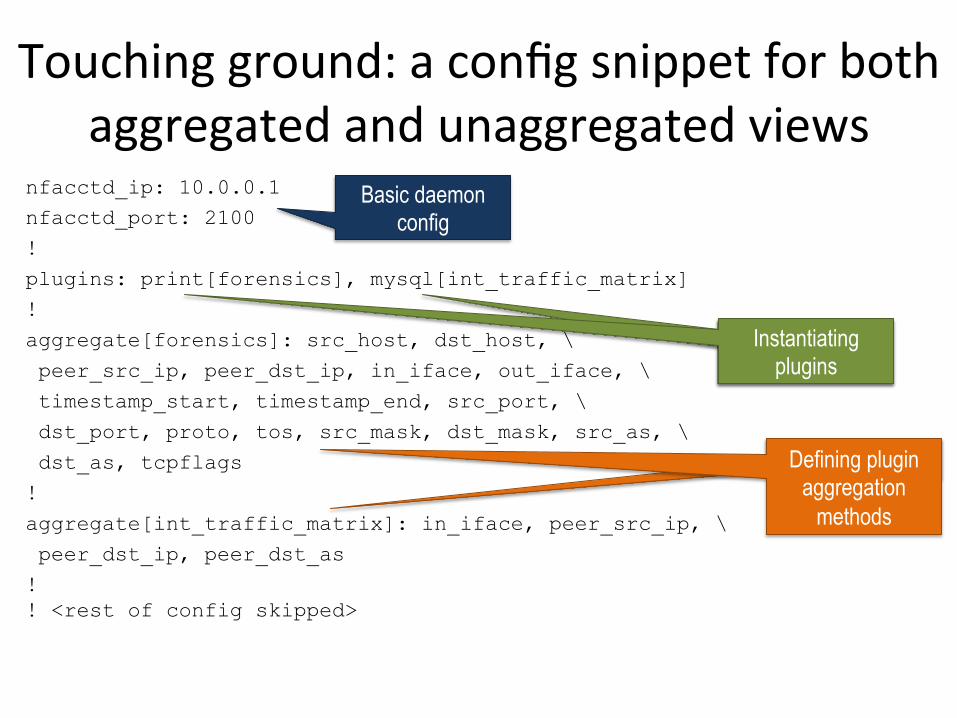
Touching ground: a config snippet for both aggregated and unaggregated views
nfacctd_ip: 10.0.0.1 nfacctd_port: 2100
!
plugins: print[forensics], mysql[int_traffic_matrix]
!
aggregate[forensics]: src_host, dst_host, \
peer_src_ip, peer_dst_ip, in_iface, out_iface, \
timestamp_start, timestamp_end, src_port, \
dst_port, proto, tos, src_mask, dst_mask, src_as, \
dst_as, tcpflags
!
aggregate[int_traffic_matrix]: in_iface, peer_src_ip, \
peer_dst_ip, peer_dst_as
! ! <rest of config skipped>
Basic daemon config
Instantiating plugins
Instantiating plugins
Defining plugin aggregation
methods

Touching ground: data aggrega'on & custom-‐defined primi'ves
§ Config file snippet: ! … aggregate[int_traffic_matrix]: peer_src_ip, \ mplsTopLabelIPv4Address
! aggregate_primitives: /path/to/primitives.lst
! …
§ Custom primi've defini'on: ! …
name=mplsTopLabelIPv4Address field_type=47 len=4 semantics=ip
! …
Node-to-node internal TM (egress NetFlow)
mplsTopLabelIPv4Address not supported natively, let’s
define it!
Primitive name, will be used for
everything
NetFlow field type, IPFIX Information Element NetFlow/IPFIX
field length
Data presentation: [ u_int, hex, ip, mac, str ]
BGP integra'on
§ pmacct introduced a Quagga-‐based BGP daemon • Implemented as a parallel thread within the collector • Doesn’t send UPDATEs and WITHDRAWs whatsoever • Behaves as a passive BGP neighbor • Maintains per-‐peer BGP RIBs • Supports 32-‐bit ASNs; IPv4, IPv6 and VPN families • Supports ADD-‐PATH: draP-‐ieb-‐idr-‐add-‐paths
§ Why BGP at the collector? • Telemetry reports on forwarding-‐plane, and a bit more • Extended visibility into control-‐plane informa'on
IGP (IS-‐IS) integra'on
§ A Quagga-‐based IS-‐IS daemon was introduced: • Implemented as a parallel thread within the collector • IS-‐IS neighborship over a GRE tunnel • Currently limited to single neighborhip, single level, single topology
• Useful to look up non BGP-‐routed networks • Promising, many plans:
§ Implement a non real-‐'me, IGP-‐protocol agnos'c version § Introduce IGP-‐specific primi'ves (ie. IGP distance) § Collec'ng feedback on interest around TRILL
Storing data persistently § Data need to be aggregated both in spa'al and temporal dimensions before being wriOen down: • Op'mal usage of system resources • Avoids expensive consolida'on of micro-‐flows • Suitable for project-‐driven data-‐sets
§ Open-‐source RDBMS appeared a natural choice • Able to handle large data-‐sets • Flexible and standardized query language • Solid and scalable (clustering, par''oning)
§ noSQL DBs picking up: between myth and bust ..
Storing data persisently: MongoDB
§ pmacct opening to noSQL databases § noSQL landscape difficult to move through, ie. fragmented and lacks of standardiza'on
§ MongoDB seemed interes'ng for: • Its na've grouping opera'on (more performing and less complex than map/reduce)
• Its horizontal scaling concept (called sharding) § Picking up among operators and being constantly improved (ie. batching inserts, na've support for indexing) for the past year!

Brokering data around: RabbitMQ message exchanges
§ pmacct opening to AMQP protocol § noSQL landscape difficult to move through, ie. fragmented and lacks of standardiza'on, am i repea'ng myself? J
§ Data can be picked up at the message exchange in the preferred programming/scrip'ng language
§ Data can be then easily inserted in the preferred backend, ie. not na'vely supported by pmacct

Agenda
o Introduction
o pmacct architecture & benefits o example, data aggregation: traffic matrices o example, logging micro-flows or events o tee: briefly on horizontal scalability
SEE 3 mee'ng, Sofia – Apr 2014
Collec'ng NetFlow with pmacct
Why speaking of traffic matrices?
§ So, aPer all, are traffic matrices useful to a network operator in the first place? Yes … • Capacity planning (build capacity where needed) • Traffic Engineering (steer traffic where capacity is available)
• BeOer understand traffic paOerns (what to expect, without a crystal ball)
• Support peering decisions (traffic insight, traffic engineering at the border, support what if scenarios)
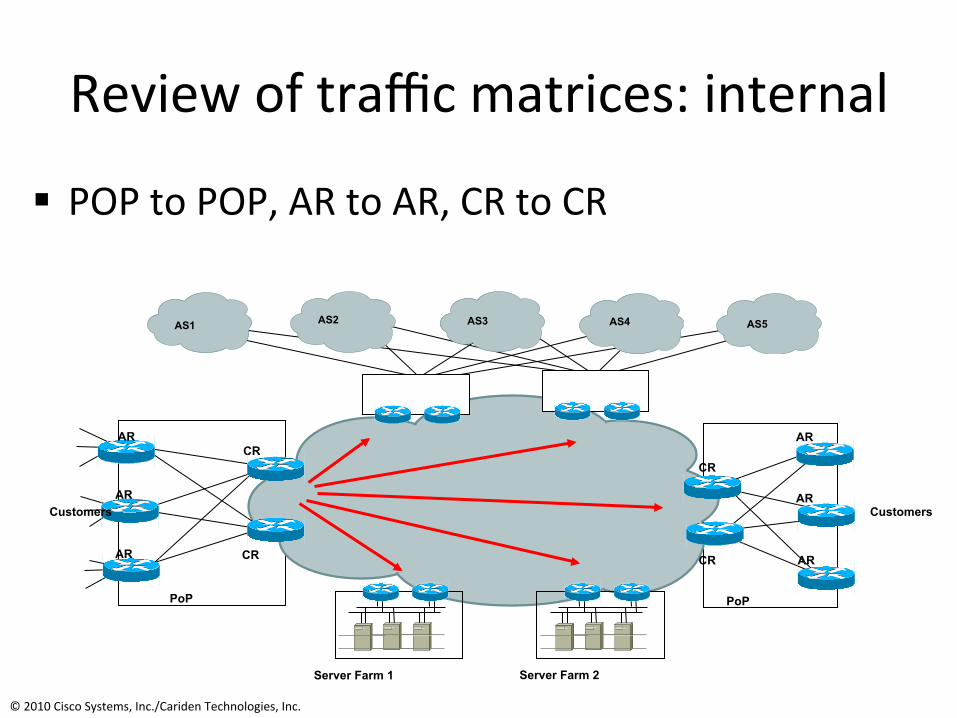
Review of traffic matrices: internal
§ POP to POP, AR to AR, CR to CR
CR
CR
CR
CR
PoP
AR
AR
AR
AR
AR
PoP
AR
Customers Customers
AS1 AS2 AS3 AS4 AS5
Server Farm 1 Server Farm 2
© 2010 Cisco Systems, Inc./Cariden Technologies, Inc.
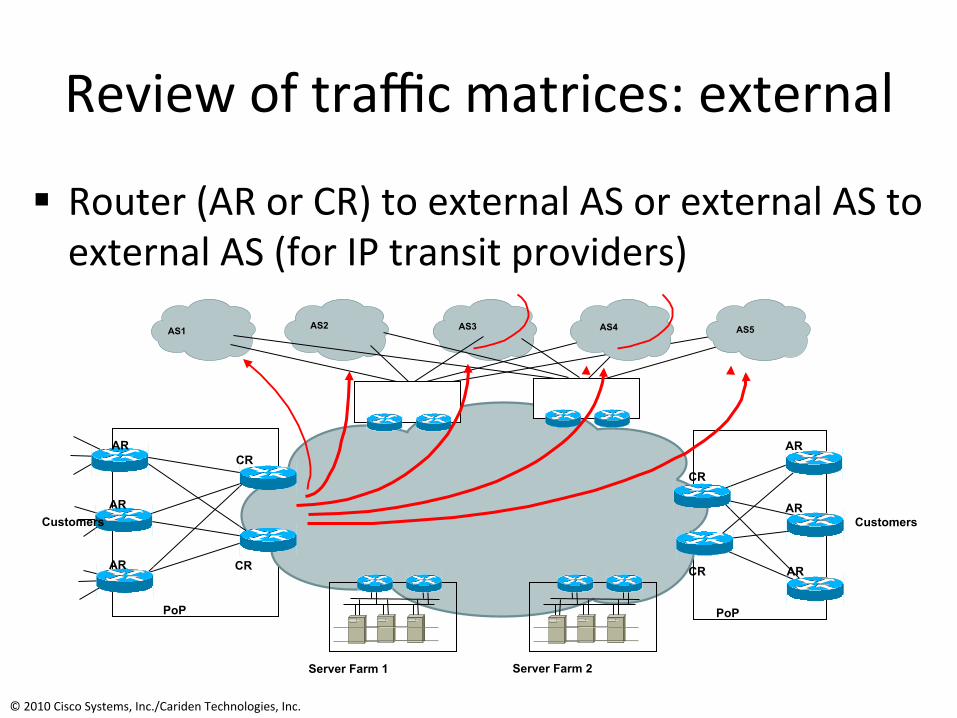
Review of traffic matrices: external
§ Router (AR or CR) to external AS or external AS to external AS (for IP transit providers)
CR
CR
CR
CR
PoP
AR
AR
AR
AR
AR
PoP
AR
Customers Customers
AS1 AS2 AS3 AS4 AS5
Server Farm 1 Server Farm 2
© 2010 Cisco Systems, Inc./Cariden Technologies, Inc.

Let’s focus on an external traffic matrix to support peering decisions
§ Analysis of exis'ng peers and interconnects: • Support policy and rou'ng changes • Fine-‐grained accoun'ng of traffic volumes and ra'os • Determine backbone costs associated to peering • Determine revenue leaks
§ Planning of new peers and interconnects: • Who to peer next • Where to place next interconnect • Modeling and forecas'ng

Our traffic matrix visualized
P P
P
PE A
PE D
PE C
PE B
P3
P1 P2
P4
BZ
A = { src_as, in_iface, peer_src_ip, peer_dst_ip, as_path, tstamp, bytes }
{ CZ, X (-‐> CY), PE C, PE A, AZ_AY, <'me>, <bytes> }
{ BX, Y (-‐> BY), PE B, PE C, CY_CX, <'me>, <bytes> }
{ AX, Z (-‐> AZ), PE A, PE B, BY_BZ, <'me>, <bytes> }

Ge{ng BGP to the collector (1/2) § Let the collector BGP peer with all PE devices: facing peers, transit and customers.
§ Determine memory footprint (below in MB/peer, using BGP best-‐path sessions)
44.03
22.73
19.97 18.59 18.12 17.89 17.76 17.57 17.48 17.39
50
0
10
20
30
40
50
60
0 200 400 600 800 1000 1200 1400
MB/peer >= 0.12.4
MB/peer < 0.12.4
Number of BGP peers
MB/pe
er
500K IPv4 routes, 50K IPv6 routes, 64-‐bit executable
~ 9GB total memory @ 500 peers
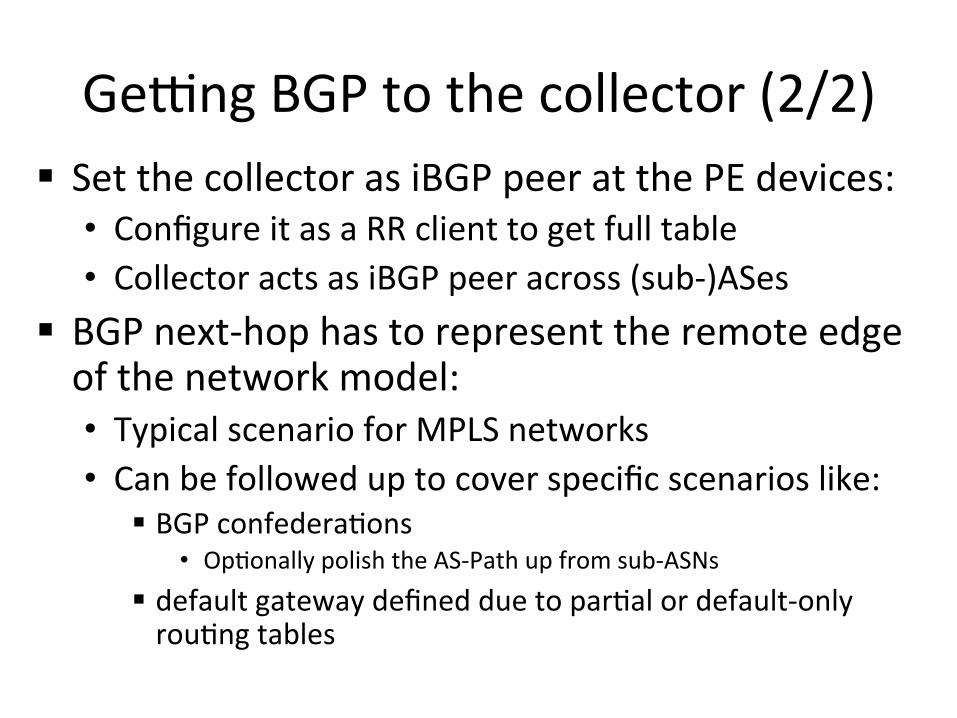
§ Set the collector as iBGP peer at the PE devices: • Configure it as a RR client to get full table • Collector acts as iBGP peer across (sub-‐)ASes
§ BGP next-‐hop has to represent the remote edge of the network model: • Typical scenario for MPLS networks • Can be followed up to cover specific scenarios like:
§ BGP confedera'ons • Op'onally polish the AS-‐Path up from sub-‐ASNs
§ default gateway defined due to par'al or default-‐only rou'ng tables
Ge{ng BGP to the collector (2/2)

Ge{ng telemetry to the collector
§ Export ingress-‐only measurements at all PE devices: facing peers, transit and customers. • Traffic is routed to des'na'on, so plenty of informa'on on where it is going to
• It is crucial instead to get as much as possible about where traffic is coming from
§ Leverage data reduc'on techniques at the PE: • Sampling • Aggrega'on (but be sure to carry IP prefixes!)

Telemetry data/BGP correla'on

Touching ground: a config snippet for traffic matrices
plugins: mysql[int_tm], mysql[ext_tm] !
aggregate[int_tm]: in_iface, peer_src_ip, \
peer_dst_ip, peer_dst_as
!
aggregate[ext_tm]: src_as, in_iface, peer_src_ip, \
peer_dst_ip, peer_dst_as, as_path, dst_as
!
sql_table[int_tm]: int_tm-%Y%m%d_%H%M
!
sql_table[ext_tm]: ext_tm-%Y%m%d_%H%M
sql_cache_entries[ext_tm]: 99991
!
sql_refresh_time: 300
sql_history: 5m
!
! <rest of config skipped>
Dynamic SQL table names, ie.: XXX_tm-20130803_1400
Build time bins of 5 mins
Insert data every 5 mins
AS-to-AS external TM
Port-to-port internal TM

Touching ground: how data would look like: internal traffic matrix example (1/2)
mysql> SHOW TABLES FROM pmacct; +----------------------+
| Tables_in_pmacct |
+----------------------+
| … |
| int_tm-20130803_1400 |
| int_tm-20130803_1405 |
| int_tm-20130803_1410 |
| … |
| ext_tm-20130803_1400 |
| ext_tm-20130803_1405 |
| ext_tm-20130803_1410 |
| … |
+----------------------+
Set of internal traffic matrices
Set of external traffic matrices
NOTE: sub-aggregation is expensive: we could also have had our traffic matrices over multiple temporal aggregations in parallel, ie. 5 mins (as above) but also hourly and daily.
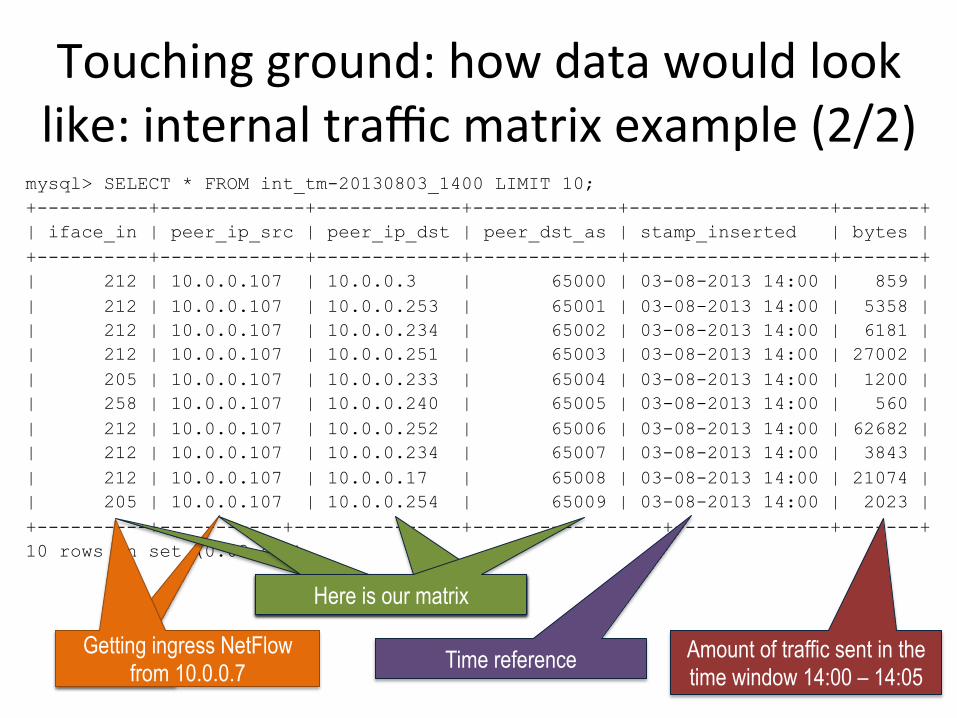
Touching ground: how data would look like: internal traffic matrix example (2/2)
mysql> SELECT * FROM int_tm-20130803_1400 LIMIT 10; +----------+-------------+-------------+-------------+------------------+-------+ | iface_in | peer_ip_src | peer_ip_dst | peer_dst_as | stamp_inserted | bytes | +----------+-------------+-------------+-------------+------------------+-------+ | 212 | 10.0.0.107 | 10.0.0.3 | 65000 | 03-08-2013 14:00 | 859 | | 212 | 10.0.0.107 | 10.0.0.253 | 65001 | 03-08-2013 14:00 | 5358 | | 212 | 10.0.0.107 | 10.0.0.234 | 65002 | 03-08-2013 14:00 | 6181 | | 212 | 10.0.0.107 | 10.0.0.251 | 65003 | 03-08-2013 14:00 | 27002 | | 205 | 10.0.0.107 | 10.0.0.233 | 65004 | 03-08-2013 14:00 | 1200 | | 258 | 10.0.0.107 | 10.0.0.240 | 65005 | 03-08-2013 14:00 | 560 | | 212 | 10.0.0.107 | 10.0.0.252 | 65006 | 03-08-2013 14:00 | 62682 | | 212 | 10.0.0.107 | 10.0.0.234 | 65007 | 03-08-2013 14:00 | 3843 | | 212 | 10.0.0.107 | 10.0.0.17 | 65008 | 03-08-2013 14:00 | 21074 | | 205 | 10.0.0.107 | 10.0.0.254 | 65009 | 03-08-2013 14:00 | 2023 | +----------+-----------+---------------+-----------------+--------------+-------+ 10 rows in set (0.03 sec)
Getting ingress NetFlow from 10.0.0.7 Time reference
Here is our matrix Here is our matrix Here is our matrix Here is our matrix
Amount of traffic sent in the time window 14:00 – 14:05

Case-‐study: peering at AS286 [year 2009]
Nego'a'on
Engineering
Produc'on
Op'miza'on
§ Peering as a cycle § NetFlow + BGP traffic matrix
steers peering op'miza'on: • Iden'fy new and “old” peers • Traffic analysis: backbone
costs, 95th percen'les, ra'os • Analysis of interconnec'on
density and traffic dispersion • Forecas'ng and trending • Ad-‐hoc queries from Design
& Engineering and indeed … the IPT Product Manager
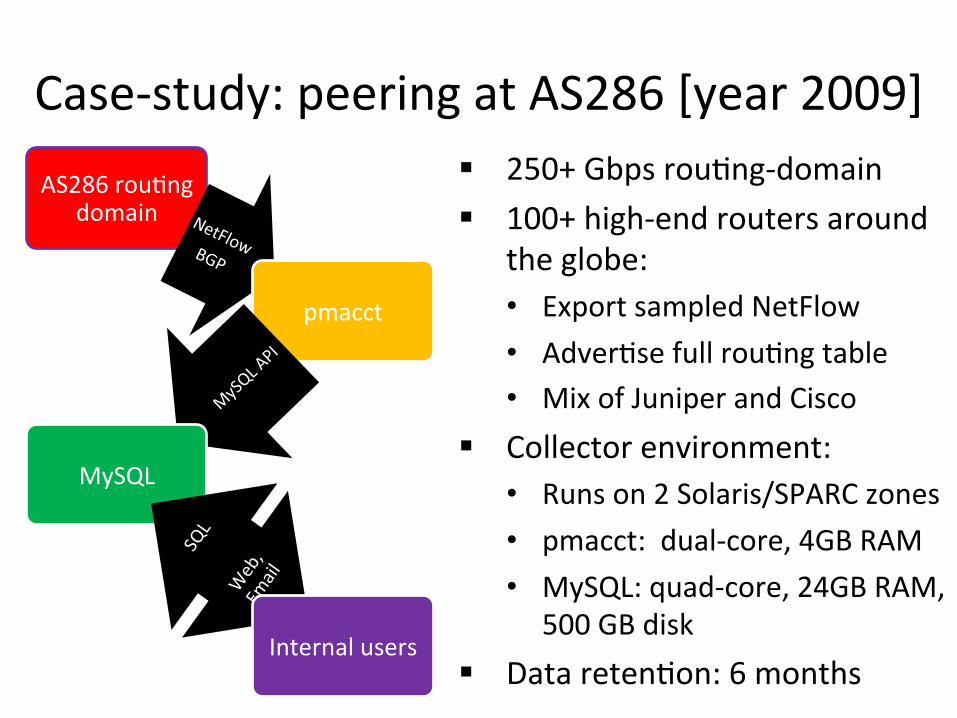
§ 250+ Gbps rou'ng-‐domain § 100+ high-‐end routers around
the globe: • Export sampled NetFlow • Adver'se full rou'ng table • Mix of Juniper and Cisco
§ Collector environment: • Runs on 2 Solaris/SPARC zones • pmacct: dual-‐core, 4GB RAM • MySQL: quad-‐core, 24GB RAM,
500 GB disk § Data reten'on: 6 months
AS286 rou'ng domain
pmacct
MySQL
Internal users
Case-‐study: peering at AS286 [year 2009]

§ AS286 backbone routers are first configured from templates: • NetFlow + BGP collector IP address defined over there • Enabler for auto-‐discovery of new devices
§ Edge interfaces are provisioned following service delivery manuals: • Relevant manuals and TSDs include NetFlow ac'va'on • Periodic checks NetFlow is ac've where it should
§ Maps, ie. source peer-‐AS to ingress interfaces, are re-‐built periodically
Case-‐study: peering at AS286 [year 2009]

Agenda
o Introduction
o pmacct architecture & benefits o example, data aggregation: traffic matrices
o example, logging micro-flows or events o tee: briefly on horizontal scalability
SEE 3 mee'ng, Sofia – Apr 2014
Collec'ng NetFlow with pmacct

pmacct, logging & flat-‐files: brief history (1/2)
§ Originally pmacct was about memory tables and RDBMS (no flat-‐files).
§ It was also about data aggrega'on (no logging micro-‐flows).
§ This is because there were already tools doing this – so why spending 'me in reinven'ng the wheel?
§ Much beOer invest 'me in filling the gaps and give room to innova've ideas

pmacct, logging & flat-‐files: brief history (2/2)
§ Recently the landscape is changing and NetFlow and IPFIX protocols are being generalized
§ No'ceably, they are entering in the Event Logging space, ie.: • Cisco NEL, ie. (CG)NAT events • Cisco NSEL, ie. security events
§ This is great 'me to review the strategy in this sense introducing support for both flat-‐files and logging (of events and, as a consequence, of micro-‐flows)

Logging use-‐cases
§ Micro-‐flows: • R&D, lab ac'vi'es • Security, DDoS detec'on, forensics • Related to data aggrega'on:
§ Analysis, temporary: elaborate aggrega'on methods § Back-‐up, permanent: keep raw data in case useful
§ Events: • NAT events: compliancy with local authori'es • FW events: security reports

Logging feature status (1/2)
§ Split data basing on 'me of the day: • Ie. 5 mins, hourly, daily files (fully customizable) • Not (yet?) possible to split content basing on file size
§ Can build a structure of directories basing on 'me of the day and (some) primi've values (ie. IP address of the telemetry exporter): • To facilitate archiving (files can be also further archived right away via triggers, print_trigger_exec)
• To control files/directory ra'o more fine-‐grained § Can append to an exis'ng file: ie. hourly files but refreshed with data every 5 mins.

Logging feature status (2/2)
§ Files in text-‐format only: tab-‐spaced, CSV and JSON formats: • no binary format (yet?) • Ideas behind this choice so far:
§ Why constraining users to capabili'es of a client tool? § If binary is really wanted, insert in a non-‐indexed noSQL database
• When both compressed, the file size ra'o, in CSV format, to an equivalent file from flow-‐tools is 4:1 (so four 'mes bigger). Worth direct access to data?
§ Will appreciate your feedback!

Touching ground: a config snippet for logging micro-‐flows
plugins: print[forensics] !
aggregate[forensics]: src_host, dst_host, \
peer_src_ip, peer_dst_ip, in_iface, out_iface, \
timestamp_start, timestamp_end, src_port, \
dst_port, proto, tos, src_mask, dst_mask, src_as, \
dst_as, tcpflags
!
print_output_file[forensics]: /path/to/forensics-%Y%m%d_%H%M.txt
print_output[forensics]: csv
print_refresh_time[forensics]: 300
print_history[forensics]: 5m
print_output_file_append[forensics]: true
!
print_latest_file[forensics]: /path/to/forensics-latest
! <rest of config skipped>
Micro-flow (de)aggregation
Dynamic file names, ie.: forensics-20130803_1400
[ formatted, csv, json ]
Insert data every 5 mins, append to file if exists
Insert data every 5 mins, append to file if exists
Pointer to latest file to become optional and explicitly configured
Insert data every 5 mins, append to file if exists
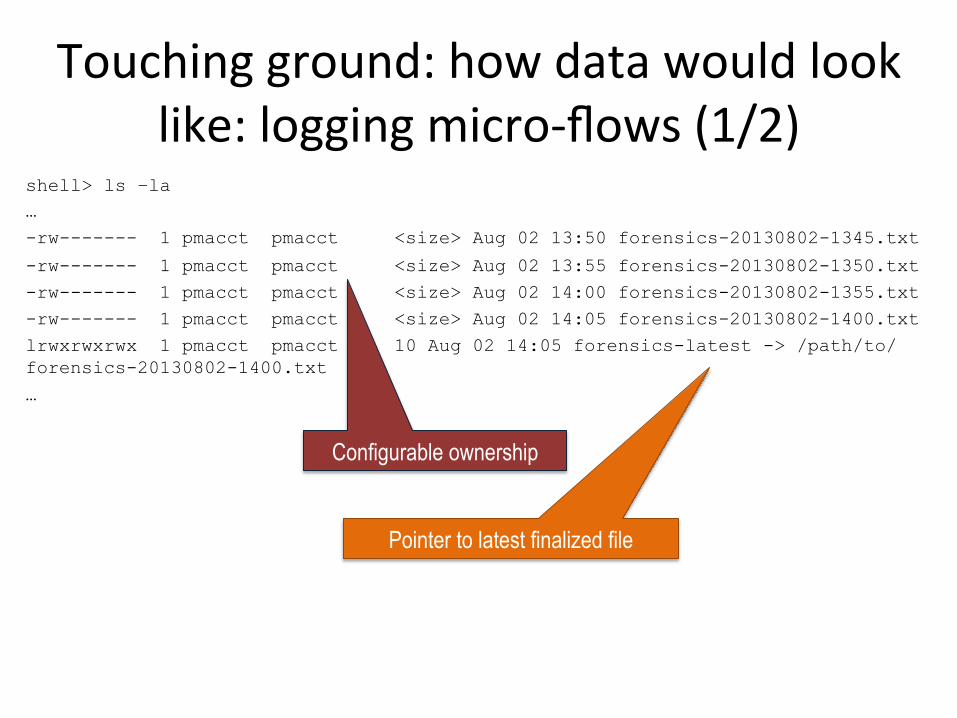
Touching ground: how data would look like: logging micro-‐flows (1/2)
shell> ls –la …
-rw------- 1 pmacct pmacct <size> Aug 02 13:50 forensics-20130802-1345.txt
-rw------- 1 pmacct pmacct <size> Aug 02 13:55 forensics-20130802-1350.txt
-rw------- 1 pmacct pmacct <size> Aug 02 14:00 forensics-20130802-1355.txt
-rw------- 1 pmacct pmacct <size> Aug 02 14:05 forensics-20130802-1400.txt
lrwxrwxrwx 1 pmacct pmacct 10 Aug 02 14:05 forensics-latest -> /path/to/forensics-20130802-1400.txt
…
Pointer to latest finalized file
Configurable ownership
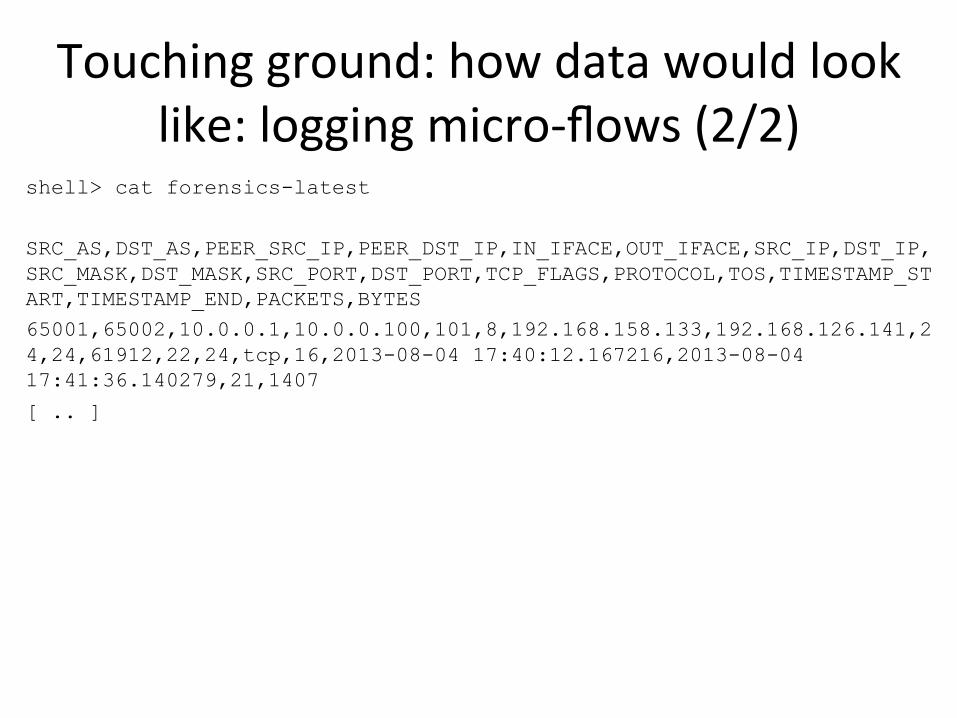
Touching ground: how data would look like: logging micro-‐flows (2/2)
shell> cat forensics-latest
SRC_AS,DST_AS,PEER_SRC_IP,PEER_DST_IP,IN_IFACE,OUT_IFACE,SRC_IP,DST_IP,SRC_MASK,DST_MASK,SRC_PORT,DST_PORT,TCP_FLAGS,PROTOCOL,TOS,TIMESTAMP_START,TIMESTAMP_END,PACKETS,BYTES 65001,65002,10.0.0.1,10.0.0.100,101,8,192.168.158.133,192.168.126.141,24,24,61912,22,24,tcp,16,2013-08-04 17:40:12.167216,2013-08-04 17:41:36.140279,21,1407
[ .. ]
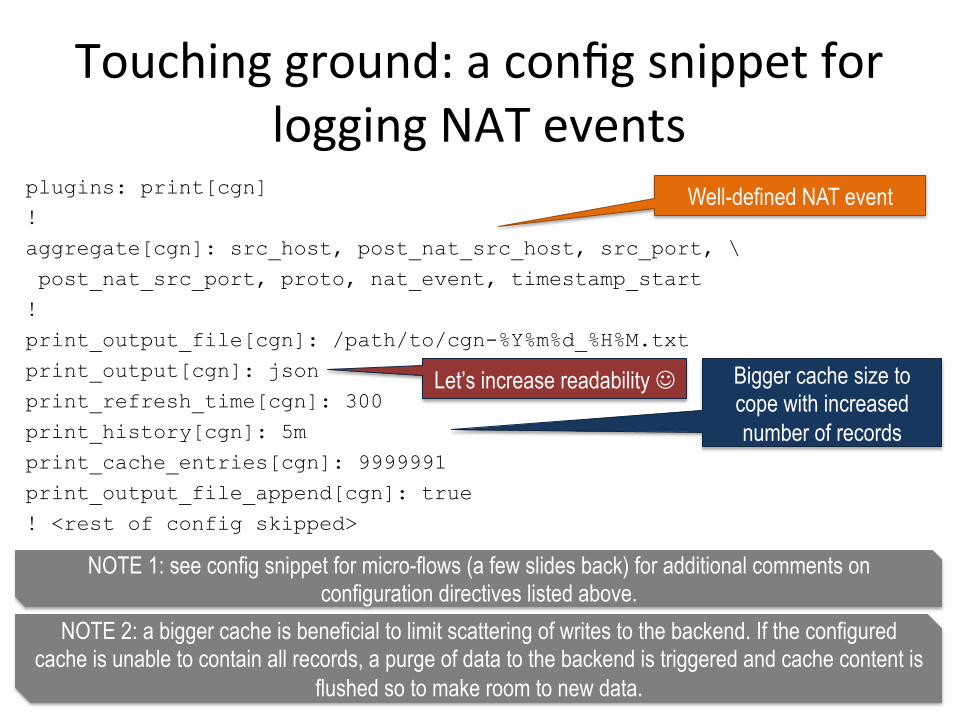
Touching ground: a config snippet for logging NAT events
plugins: print[cgn] !
aggregate[cgn]: src_host, post_nat_src_host, src_port, \
post_nat_src_port, proto, nat_event, timestamp_start
!
print_output_file[cgn]: /path/to/cgn-%Y%m%d_%H%M.txt
print_output[cgn]: json
print_refresh_time[cgn]: 300
print_history[cgn]: 5m
print_cache_entries[cgn]: 9999991
print_output_file_append[cgn]: true
! <rest of config skipped>
Well-defined NAT event
Bigger cache size to cope with increased number of records
NOTE 2: a bigger cache is beneficial to limit scattering of writes to the backend. If the configured cache is unable to contain all records, a purge of data to the backend is triggered and cache content is
flushed so to make room to new data.
NOTE 1: see config snippet for micro-flows (a few slides back) for additional comments on configuration directives listed above.
Let’s increase readability J

Touching ground: how data would look like: logging NAT events (1/2)
shell> ls –la …
-rw------- 1 pmacct pmacct <size> Aug 02 13:50 cgn-20130802-1345.txt
-rw------- 1 pmacct pmacct <size> Aug 02 13:55 cgn-20130802-1350.txt
-rw------- 1 pmacct pmacct <size> Aug 02 14:00 cgn-20130802-1355.txt
-rw------- 1 pmacct pmacct <size> Aug 02 14:05 cgn-20130802-1400.txt
lrwxrwxrwx 1 pmacct pmacct 10 Aug 02 14:05 cgn-latest -> /path/to/cgn-20130802-1400.txt
…

Touching ground: how data would look like: logging NAT events (2/2)
shell> cat cgn-latest
{"timestamp_start": "2013-02-21 16:56:33.518000000", "ip_proto": "tcp", "post_nat_ip_src": ”1.2.179.16", "ip_src": ”192.168.37.51", "port_src": 61020, "nat_event": 1, "post_nat_port_src": 31392} [ .. ]
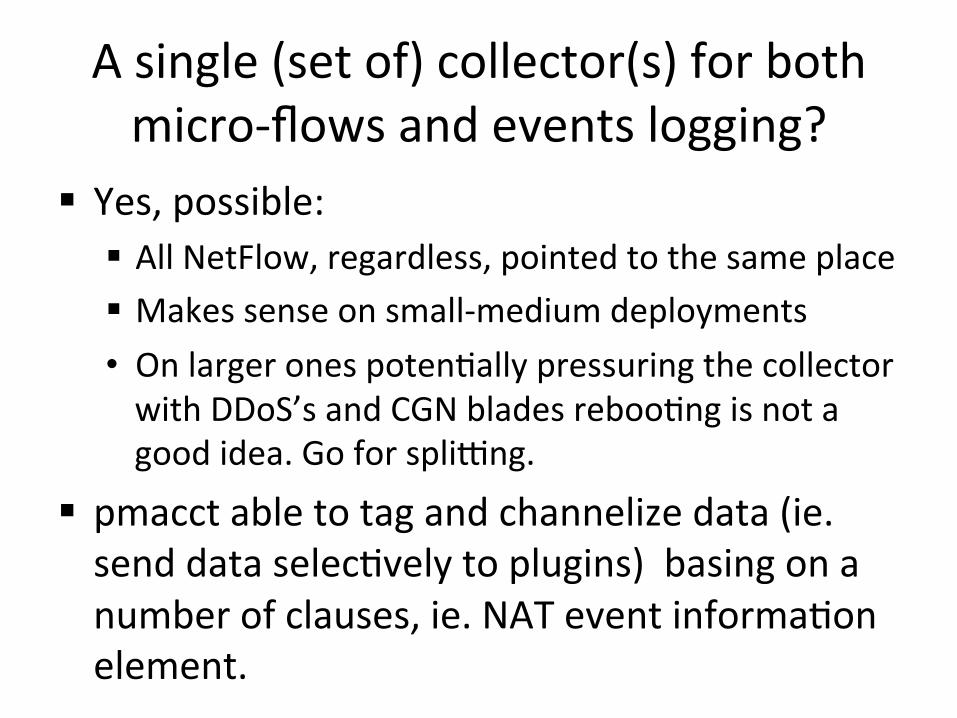
A single (set of) collector(s) for both micro-‐flows and events logging?
§ Yes, possible: § All NetFlow, regardless, pointed to the same place § Makes sense on small-‐medium deployments • On larger ones poten'ally pressuring the collector with DDoS’s and CGN blades reboo'ng is not a good idea. Go for spli{ng.
§ pmacct able to tag and channelize data (ie. send data selec'vely to plugins) basing on a number of clauses, ie. NAT event informa'on element.

Touching ground: a config snippet for both micro-‐flows and event logging (1/2) plugins: print[forensics], print[cgn] ! pre_tag_filter[forensics]: 10 aggregate[forensics]: <micro-flows aggregation method> print_output_file[forensics]: /path/to/forensics-%Y%m%d_%H%M.txt ! pre_tag_filter[cgn]: 20 aggregate[cgn]: <NAT events aggregation method> print_output_file[cgn]: /path/to/cgn-%Y%m%d_%H%M.txt print_cache_entries[cgn]: 9999991 ! print_output: csv print_refresh_time: 300 print_output_file_append: true ! pre_tag_map: /path/to/pretag.map ! <rest of config skipped>
NOTE: This configuration merely merges the micro-flows and event logging configurations seen before. Check them out (a few slides back) for additional comments on configuration directives listed above.
Enabler for channelizing data to the correct plugin
instance: map to assign tags to records
Allowing only flows through (see next slide)
Allowing only events through (see next slide)
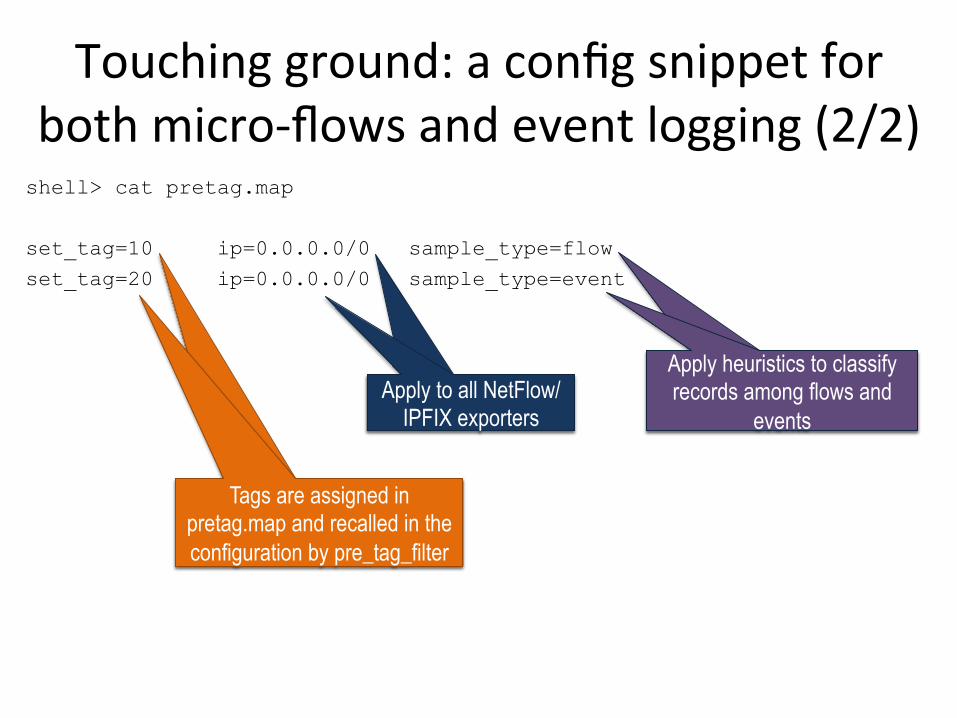
Touching ground: a config snippet for both micro-‐flows and event logging (2/2) shell> cat pretag.map
set_tag=10 ip=0.0.0.0/0 sample_type=flow
set_tag=20 ip=0.0.0.0/0 sample_type=event
Tags are assigned in pretag.map and recalled in the configuration by pre_tag_filter
Tags are assigned in pretag.map and recalled in the configuration by pre_tag_filter
Apply to all NetFlow/IPFIX exporters
Apply to all NetFlow/IPFIX exporters
Apply heuristics to classify records among flows and
events
Apply heuristics to classify records among flows and
events

Agenda
o Introduction
o pmacct architecture & benefits o example, data aggregation: traffic matrices
o example, logging micro-flows or events o tee: briefly on horizontal scalability
SEE 3 mee'ng, Sofia – Apr 2014
Collec'ng NetFlow with pmacct

Briefly on scalability § A single collector might not fit it all: • Memory: can’t store all BGP full rou'ng tables • CPU: can’t cope with the pace of telemetry export • Divide-‐et-‐impera approach is valid:
§ Assign PEs (both telemetry and BGP) to collectors § Assign collectors to databases; or cluster the database.
§ A traffic matrix can get big, but can be reduced: • Keep smaller routers out of the equa'on • Filter out specific services/customers on dense routers • Focus on relevant traffic direc'on (ie. upstream if CDN, downstream if ISP)
• Sample or put thresholds on traffic relevance

Need for horizontal scalability in a telemetry collector
§ Cope with increasing data rates: • 10G to 100G but, depending on the applica'on, sampling rates might stay the same
• Events logging: ie. NetFlow now challenges Syslog to log Carrier Grade NAT (CGN) and firewall events
§ Scale without super-‐compu'ng powers § Hashing can help coupling informa'on, ie. basing on the NetFlow exporter IP address
pmacct & horizontal scaling
§ Supports a ‘tee’ plugin • Receivers can be added/changed/removed on the fly • Load-‐balenced tee’ing (hashed or round-‐robin) • Selec've tee’ing (based on telemetry exporter)
§ Mul'ple pmacct instances can run in parallel • Coupling telemetry and rou'ng data from same PE
§ Supports mul'ple backend plugins • Build mul'ple views of the same traffic hence crea'ng project-‐oriented data-‐set

Touching ground: a config snippet for transparent hashing balancer (1/2)
plugins: tee[balancer] !
! In Linux: adjust /proc/sys/net/core/rmem_max to cope with this value
! nfacctd_pipe_size[default]: 1024000000
!
! plugin_pipe_size[balancer]: 2048000000
! plugin_buffer_size[balancer]: 10240000
!
tee_receivers[balancer]: /path/to/tee_receivers.lst
tee_transparent: true
Instantiating a tee plugin
Buffering: to handle sustained packet rates. Here commented out.
File containing receivers definitions
Transparent balancing enabled. Disabling it acts as
a proxy
Buffering: to handle sustained packet rates. Here commented out.
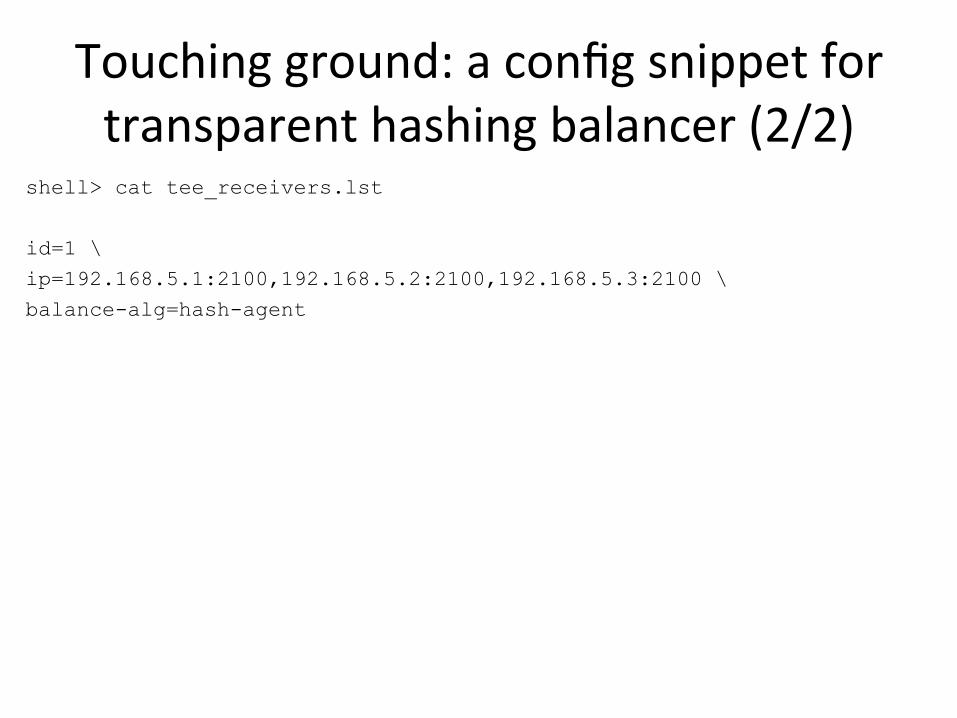
Touching ground: a config snippet for transparent hashing balancer (2/2)
shell> cat tee_receivers.lst
id=1 \
ip=192.168.5.1:2100,192.168.5.2:2100,192.168.5.3:2100 \
balance-alg=hash-agent
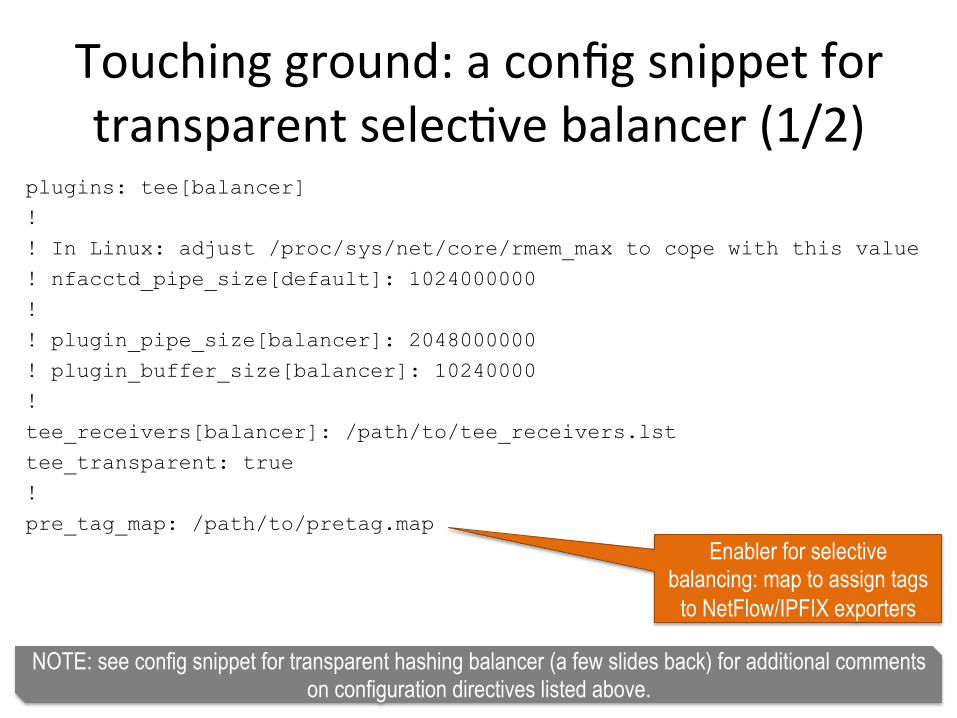
Touching ground: a config snippet for transparent selec've balancer (1/2)
plugins: tee[balancer] !
! In Linux: adjust /proc/sys/net/core/rmem_max to cope with this value
! nfacctd_pipe_size[default]: 1024000000
!
! plugin_pipe_size[balancer]: 2048000000
! plugin_buffer_size[balancer]: 10240000
!
tee_receivers[balancer]: /path/to/tee_receivers.lst
tee_transparent: true
!
pre_tag_map: /path/to/pretag.map
NOTE: see config snippet for transparent hashing balancer (a few slides back) for additional comments on configuration directives listed above.
Enabler for selective balancing: map to assign tags
to NetFlow/IPFIX exporters

Touching ground: a config snippet for transparent selec've balancer (2/2)
shell> cat tee_receivers.lst
id=2 ip=192.168.4.1:2100 tag=100 id=3 ip=192.168.4.2:2100 tag=200
shell> cat pretag.map
set_tag=100 ip=10.0.0.0/25
set_tag=200 ip=10.0.0.128/25
Tags are assigned in pretag.map and recalled in
tee_receivers.lst
Tags are assigned in pretag.map and recalled in
tee_receivers.lst

Further informa'on
§ hOp://www.pmacct.net/lucente_pmacct_uknof14.pdf • More about coupling telemetry and BGP
§ hOp://ripe61.ripe.net/presenta'ons/156-‐ripe61-‐bcp-‐planning-‐and-‐te.pdf • More about traffic matrices, capacity planning & TE
§ hOp://wiki.pmacct.net/OfficialExamples • Compiling instruc'ons and quick-‐start guides
§ hOp://wiki.pmacct.net/Implementa'onNotes • Implementa'on notes (RDBMS, maintenance, etc.)

Thanks for your attention! Questions? Now or later ..
Paolo Lucente pmacct
<paolo at pmacct dot net> Keep in touch via LinkedIn
SEE 3 mee'ng, Sofia – Apr 2014
Collec'ng NetFlow with pmacct

Backup slides
SEE 3 mee'ng, Sofia – Apr 2014
Collec'ng NetFlow with pmacct

Post-‐processing RDBMS and repor'ng (1/2) § Traffic delivered to a BGP peer, per loca'on: mysql> SELECT peer_as_dst, peer_ip_dst, SUM(bytes), stamp_inserted
FROM acct_bgp
WHERE peer_as_dst = <peer | customer | IP transit> AND
stamp_inserted = < today | last hour | last 5 mins >
GROUP BY peer_as_dst, peer_ip_dst; § Aggregate AS PATHs to the second hop: mysql> SELECT SUBSTRING_INDEX(as_path, ‘.’, 2) AS as_path, bytes
FROM acct_bgp
WHERE local_pref = < IP transit pref> AND
stamp_inserted = < today | yesterday | last week >
GROUP BY SUBSTRING_INDEX(as_path, ‘.’, 2)
ORDER BY SUM(bytes);
§ Focus peak hour (say, 8pm) data: mysql> SELECT … FROM … WHERE stamp_inserted LIKE ‘2010-02-% 20:00:00’
…

§ Traffic breakdown, ie. top N grouping BGP peers of the same kind (ie. peers, customers, transit):
mysql> SELECT … FROM … WHERE …
local_pref = <<peer | customer | IP transit> pref>
…
§ Download traffic matrix (or a subset of it) to 3rd party backbone planning/traffic engineering applica'on (ie. Cariden, Wandl, etc.):
mysql> SELECT peer_ip_src, peer_ip_dst, bytes, stamp_inserted
FROM acct_bgp
WHERE [ peer_ip_src = <location A> AND
peer_ip_dst = <location Z> AND … ]
stamp_inserted = < today | last hour | last 5 mins >
GROUP BY peer_ip_src, peer_ip_dst;
Post-‐processing RDBMS and repor'ng (2/2)