collection, the starting point - universiteit...
TRANSCRIPT

Collection, the starting point Matching workforce to workload at TNT business counters


i
Master Thesis Matching workforce to workload at TNT business counters
Master thesis:
Title: Collection, the starting point: Matching workforce to workload at TNT Business Counters
Host organisation TNT N.V.
Research period: January 2009 – February 2010
Author:
Name: Eljo K. Haspels
Student number: 0050504
University: Twente University
Master’s degree program: Industrial Engineering and Management
Track: Production and Logistics
Contact: [email protected]
Supervisor Committee:
Supervisors University of Twente: Dr. Ir. Leo van der Wegen Lecturer at the School of Management and Governance
Dr. Ir. Gerhard Post Lecturer at the Department of Applied Mathematics
Supervisors TNT |Post : Frans de wit Manager Collection Netherlands
Marc Warmerdam Chain Manager Collection - Area West

ii

iii
Acknowledgement The final step in a students’ journey towards becoming a Master of Science is the completion of a master project. Reaching this final destination is of course important and provides a good starting point for the next step in life. But ‘success is a journey, not a destination’1.
My journey as a student started almost 8 years ago. It has since provided me many great experiences, enabled me to meet many interesting people and lead me to many places around the world. I want to thank all friends, family, colleagues and teachers who (unknowingly) helped me to arrive where I am now.
This research and report represent my final step. It has to be said that this report has shown itself to be a great hurdle just in front of the finish line. But it has also been this hurdle which has probably taught me the most. Overcoming difficulties and personal disappointments in this process by actively asking support has been a great lesson. I want to thank the following persons for their part in pulling me back on track, helping me to focus, and being a listening ear when needed: Martijn, Robbert, Rutger, Juul, Matthijs, Max, Dianne, Noortje and Juerd.
Moreover, I want to thank my supervisors Leo, Frans, Marc and Gerhard for their insights, patience, trust and the leeway they gave me to find my own way. Due to their support, the pleasant cooperation, and the help of many employees at TNT (especially Loek, Astrid, Lisa, Harry, Stella, Dico, Caroline, and Asti) I have enjoyed this project and hope to have contributed.
Finally, I want to particularly thank my parents. They have supported me with advice, trust and love throughout my life.
As always, when looking back, you realize you could have done your project differently, better, and faster, no exception here. But with this project finished, and with the lessons learned, I am looking forward to the new challenges ahead with enthusiasm and confidence: success is a journey, not a destination.
Eljo Haspels
1 Arthur Ashe, 1943 -1993, African-American Tennis Player ; http://www.arthurashe.org/site/

iv
Summary This thesis describes a master graduation research into the problem of matching workforce to workload at TNT business counters. A TNT business counter is a facility where, every night, mail is collected, prepared and sent on to a sorting centre. Team managers at these collection facilities try, on a daily basis, to make sure the process is finished in time.
The strategy of TNT Mail Netherlands currently aims at cost reduction and the creation of a more flexible cost structure at all departments. To achieve these goals within the collection department, a reorganisation called DPM-C was started at business counters. This change process includes the implementation of standardized best practice processes and improvement of process steering. The first evaluations show that cost reduction is achieved, but team managers indicate they have no clear understanding on how to organize the required amount of workforce needed on an evening. Therefore, management at collection asked for a research into the daily process of matching workforce to workload.
In this thesis we address this operational workforce management problem. The amount of required workforce depends on two uncertain factors: “mail volume” and “productivity”. To estimate the magnitude of these uncertainties at two process (intake and preparation), we analyse data within existing databases at TNT and interview experts.
The mail volumes for the intake and preparation process fluctuate daily and can be approximated by a normal distribution function. We quantify the fluctuation by measuring the coefficient of variation, which is on average 0.1 and 0.2 for the intake and preparation process, respectively. For the productivity we conclude that, although norms exist for each process, the actual achieved productivity also fluctuates significantly.
We discuss two ways to improve performance on matching workforce to workload: (1) taking actions to reduce the workload uncertainty, and (2) improving workforce flexibility to cope with the existing workload uncertainty.
It appears that the correlation between consecutive days and weekdays is very moderate, therefore no reliable predictions on workload is possible based on these variables. Our data shows nonetheless that fluctuations in mail volume may be reduced if the mail volume of different business counters is integrated. We therefore recommend continuing the current research into centralization of business counters, especially as larger facilities also make the creation of flexibility easier
From interviews we learn that uncertainty in productivity may be caused by the following factors: difference in input, difference in measurement, motivation and experience of employees. Isolating these factors and compensating for these effects in the data turns out to be impossible with the currently available data. Based on evaluations of DPM-C and interviews, however, we conclude that productivity fluctuations may be reduced by the creation of performance feedback and increase of control by management (by presence at the work floor).

v
Improving flexibility on operational level is bounded by decisions on strategic and tactical level; for example, the collective labour agreement bounds the way in which personnel can be deployed. Comparing methods to create operational workforce flexibility in literature to methods currently used by team managers, shows us that almost all methods are present within collection to some extent. We can distinguish methods used in case too many and too few employees are present at the work floor.
If too few employees are present at the work floor, flexibility can be created by cross function employment, arranging extra personnel and working overtime. If too many employees are present at the work floor, workforce flexibility can be created by asking for volunteers to take leave (for part of their shift), to participate in cross function employment, or to switch to not-time-dependent activities, such as the mandatory work related knowledge test. Workforce flexibility should preferably be created at the end of the process, and can be arranged more easily at larger facilities than at small ones. We also recommend that training of team managers should focus more on creation of commitment and cooperation, as this is essential for many of the methods to create operational flexibility.
We conclude in this thesis that reducing uncertainty of different factors in the process of matching workforce to workload is difficult on operational level. We also conclude that ways to create flexibility exist and are used by team managers to different extent. As many of the methods used to create flexibility depend on local circumstances, we recommend to increase knowledge exchange of concrete and useful approaches on this topic.

vi
Samenvatting Dit rapport beschrijft een onderzoek ter afronding van de Master Industrial Engineering and Management, aan de Universiteit Twente. Het afstudeeronderzoek richt zich op de vraag hoe, binnen het bedrijfsonderdeel business balie van TNT N.V., de hoeveelheid ingezet personeel beter kan worden afgestemd op het werk dat op een avond voor handen is.
Business balies zijn locaties in Nederland waar ’s avonds post wordt verzameld, geregistreerd en opgezet alvorens het naar een sorteercentrum wordt afgevoerd. Voor de realisatie van dit proces zijn medewerkers actief op verschillende processen, aangestuurd door een teamcoach. De teamcoach is verantwoordelijk voor het inzetten van personeel en heeft tot doel het proces op tijd af te ronden.
De huidige strategie van TNT Post Nederland richt zich op het reduceren van kosten en het flexibeler maken van de kostenstructuur. Om dit te realiseren binnen de afdeling collectie is een reorganisatie gestart genaamd DPM-C. Deze reorganisatie heeft tot doel een gestandaardiseerd “best practice” proces te implementeren op alle business balies en de aansturing van het proces te verbeteren. De eerste evaluaties laten zien dat kosten reductie wordt behaald maar dat het onduidelijk is voor teamcoaches hoe zij het aantal medewerkers moeten afstemmen op de hoeveelheid werk op een avond. Om deze reden heeft het management van collectie gevraagd om een onderzoek te starten naar de dag-tot-dag planning van het aantal in te zetten medewerkers.
Het aantal in te zetten medewerkers op een business balie is afhankelijk van de hoeveelheid post en de productiviteit. Uit analyse volgt dat de hoeveelheid post die op een avond moet worden verwerkt fluctueert en kan worden benaderd met een normale verdeling. Op het aanname- en opzetproces is er gemiddeld een variantie coëfficiënt van 0,1 respectievelijk 0,2. Dit betekent dat in 30 procent van de dagen de hoeveelheid post meer dan 10 respectievelijk 20 procent van het gemiddelde afwijkt. Voor de productiviteit geldt dat alleen voor het aannameproces kan worden gemeten hoe groot deze fluctuatie is, maar uit interviews en observaties blijkt dat ook voor het opzetproces de productiviteit onzeker is.
Gegeven de aanwezigheid van deze onzekerheden, onderscheiden wij in dit onderzoek twee manieren om de hoeveelheid in te zetten personeel beter af te stemmen op de hoeveelheid werk. (1) Er kunnen methoden zijn om onzekerheid te reduceren en (2) er kunnen methoden zijn om beter om te gaan met de bestaande onzekerheid.
Om de onzekerheid in het post volume te reduceren onderzoeken wij de mogelijkheid om de hoeveelheid post te voorspellen. Omdat in de literatuur geen ‘drivers’ voor de hoeveelheid post worden beschreven die op lokaal niveau praktisch meetbaar zijn, onderzoeken wij of historische data kan worden gebruik voor voorspellingen. Uit interviews komt naar voren dat er mogelijk een relatie bestaat tussen opvolgende dagen en opvolgende weekdagen maar deze relatie is niet zichtbaar in de data. Omdat ook in interviews geen andere praktische manieren naar voren komen om deze onzekerheid op operationeel niveau te reduceren concluderen wij dat de hoeveelheid post per business balie niet beter kan worden voorspeld.

vii
Het reduceren van onzekerheid in de productiviteit blijkt ook moeilijk. Uit interviews komt naar voren dat de grootste invloeden op de productiviteit: verschil in invoer, foute metingen, en verschil in motivatie en kunde zijn. Het isoleren van deze factoren is in het algemeen problematisch en met de huidige data onmogelijk. We kunnen wel concluderen dat, gebaseerd op evaluaties van DPM-C, de creatie van prestatie terugkoppeling en verhoogd toezicht op de werkvloer een positief effect hebben op de reductie van productiviteitsfluctuaties.
Dit onderzoek toont dat het, gegeven de beschikbare informatie, niet mogelijk is onzekerheden op operationeel niveau te reduceren. Oplossingen moeten daarom gezocht worden in het verbeteren van de omgang met de bestaande onzekerheid.
Omgaan met onzekerheid van het aantal in te zetten mensen wordt aangeduid met arbeidsflexibiliteit. Wij constateren dat alle operationele methoden van arbeidsflexibiliteit besproken in dit onderzoek op enig manier worden toegepast binnen business balies. Situaties met te veel dan wel te weinig ingeroosterde medewerkers vragen logischerwijs een andere aanpak.
Wanneer er te weinig mensen zijn ingeroosterd wordt flexibiliteit gecreëerd door: het inzetten van mensen die op andere taken waren geroosterd, het organiseren van extra personeel op korte termijn, en het aanwezige personeel laten werken in meeruren. Op avonden dat er te veel personeel op een proces is ingeroosterd, wordt arbeidsflexibiliteit voornamelijk gecreëerd door: het vragen om vrijwillig verlof opname, het schuiven van personeel naar andere processen of het laten uitvoeren van niet tijdsafhankelijke werkzaamheden zoals onder andere de vakmanschaptoets.
In beide gevallen geldt dat het moment dat bekend wordt of er te veel of te weinig personeel aanwezig is, op zijn vroegst tijdens het proces is. Methoden kunnen dus alleen effectief zijn als ze aan het eind van het proces toepasbaar zijn.
Wij concluderen dat het reduceren van de onzekerheid over het aantal benodigde arbeidskrachten moeilijk is op operationeel niveau. Wij concluderen ook dat er verschillende methoden worden toegepast voor omvang met de aanwezige onzekerheid. Omdat de toepasbaarheid van deze methode afhankelijk is van veel lokale en unieke opstandigheden adviseren wij bevordering van kennisuitwisseling tussen teamcoaches van concreet toepasbare methoden. Tevens adviseren wij dat teamcoaches specifiek worden getraind in het creëren van verantwoordelijkheid- en groepsgevoel daar dit essentieel is voor het toepassen van de verschillende methoden.
Ook adviseren wij de continuering van het huidige centralisatie proces van business balies, omdat uit data analyse blijkt dat de fluctuatie in de hoeveelheid te verwerken post verminderd bij grotere business balies en arbeidsflexibilisering methoden hier makkelijker zijn toe te passen.

viii
Table of Content
1. Introduction .......................................................................... 1
1.1 The company TNT ....................................................................................................................... 1
1.2 The mail process ......................................................................................................................... 2
2. Problem identification ........................................................... 4
2.1 Research motive ......................................................................................................................... 4
2.2 Problem definition and approach .............................................................................................. 6
2.3 Research Scope .......................................................................................................................... 9
2.4 Thesis outline ........................................................................................................................... 10
3. Collection at TNT.................................................................. 12
3.1 The organisational context ....................................................................................................... 12
3.2 The collection process .............................................................................................................. 15
3.3 Collection in the mail chain ...................................................................................................... 19
3.4 Current workforce management ............................................................................................. 20
4. Managing capacity under uncertainty .................................. 23
4.1 Planning and control in perspective ......................................................................................... 23
4.2 Flexibility Framework ............................................................................................................... 30
4.3 Operational workforce capacity management ........................................................................ 32
4.4 Application outlook .................................................................................................................. 34
5. Reducing workload uncertainty ............................................ 36
5.1 Factors causing uncertainty ..................................................................................................... 36
5.2 Data to assess the current fluctuations ................................................................................... 42
5.3 Current fluctuations ................................................................................................................. 44
5.4 Reduction of uncertainty .......................................................................................................... 51

ix
6. Increasing workforce flexibility ............................................ 59
6.1 Workforce flexibility ................................................................................................................. 59
6.2 Proactive measures to increase workforce flexibility .............................................................. 60
6.3 Reactive measures to increase workload flexibility ................................................................. 61
6.4 Required conditions ................................................................................................................. 64
6.5 Outlook for implementation .................................................................................................... 66
7. Conclusions and recommendations ...................................... 67
7.1 Conclusions............................................................................................................................... 67
7.2 Recommendations ................................................................................................................... 69
Reference list ............................................................................... 73
Appendices .................................................................................. 77

x
List of Figures
FIGURE 1: OVERVIEW GENERAL MAIL PROCESS ..................................................................................................... 3
FIGURE 2: APPROACH ON FLEXIBLE USE OF EMPLOYEES; TNO [52] ....................................................................... 9
FIGURE 3: ORGANISATIONAL STRUCTURE OF COLLECTION ....................................................................................14
FIGURE 4: COLLECTION PROCESS OVERVIEW .........................................................................................................15
FIGURE 5: PLANNING AND CONTROL REFERENCE ARCHITECTURE, ZIJM [29] ........................................................24
FIGURE 6: PLANNING AND CONTROL FRAMEWORK; HANS ET AL [13] ....................................................................24
FIGURE 7: CONCEPTUAL FLEXIBILITY FRAMEWORK, GERWIN [12] ........................................................................31
FIGURE 8: FACTORS OF UNCERTAINTY ....................................................................................................................37
FIGURE 9: PLOT OF THE SUM OF ALL ORDER ROWS AT BUSINESS COUNTERS IN AREA NW ......................................45
FIGURE 10: PLOT OF THE NUMBER OF ORDER ROWS AT A SMALL BUSINESS COUNTER .............................................45
FIGURE 11: PLOT OF THE NUMBER OF ORDER ROWS AT A LARGE BUSINESS COUNTER .............................................46
FIGURE 12: NUMBER OF ORDER ROWS AT TWO BUSINESS COUNTERS IN A HISTOGRAM PLOT ..................................47
FIGURE 13: NUMBER OF ORDER ROWS AT TWO BUSINESS COUNTERS IN Q-Q PLOT .................................................47
FIGURE 14: NUMBER OF GREY ROLL CONTAINERS AT PREPARATION PROCESS AT BUSINESS COUNTER ....................48
FIGURE 15: NUMBER OF ROLL CONTAINERS IN Q-Q PLOT .......................................................................................48
FIGURE 16: PRODUCTIVITY AT INTAKE PROCESS AT AVERAGE BUSINESS COUNTER ................................................50
FIGURE 17: CORRELATION PLOT OF MAIL VOLUME AT INTAKE PROCESS AT BC ALMERE 2008 ...............................53
FIGURE 18: VISUALIZATION OF THE MANAGEMENT PROBLEM WHEN MATCHING WORKFORCE TO WORKLOAD .......60
FIGURE 19: COST OF FORECASTING VERSUS COST OF INACCURACY SILVER ET ALL [6] ...........................................88
FIGURE 20: FORECASTING FRAMEWORK SILVER ET ALL [4] ....................................................................................88
List of Tables TABLE 1: READING GUIDE ......................................................................................................................................10
TABLE 2: MODEL TO CATEGORIZE OPERATIONAL MEASURES TO MATCH WORKFORCE TO WORKLOAD ...................33
TABLE 3: VOLUME FLUCTUATION AT THE INTAKE PROCESS AT BUSINESS COUNTERS IN AREA NW .......................46
TABLE 4: VOLUME FLUCTUATION AT THE PREPARATION PROCESS AT BUSINESS COUNTERS IN AREA NW .............49
TABLE 5: PRODUCTIVITY AT INTAKE PROCESS ........................................................................................................50
TABLE 6: CORRELATION COEFFICIENT OF MAIL VOLUME AT INTAKE PROCESS ........................................................53
TABLE 7: CORRELATION COEFFICIENT OF MAIL VOLUME AT PREPARATION PROCESS .............................................54

xi
Abbreviations and Acronyms Abbreviation /
Acronym Dutch English
BC Business Balie Business Counter
DPM-C Dynamisch Prestatie Model Collectie Dynamic Performance Model Collection
Evra Elektronische Vrachtbrief Electronic cargo bill
KPI Essentiële Prestatie Indicator Key Performance Indicator
MAD Met aanvullende dienst With extra service
N.V. Naamloos vennootschap public limited liability company
PTT Posterijen, Telegrafie en Telefonie -
ScB Sorteercentrum Brieven Sorting Centre Mail
ScP Sorteercentrum Pakketten Sorting Centre Parcels
SLA Service kwaliteit afspraak Service level agreement
NIMP Nieuw initiatief masterplan New Initiative Master Plans
TOT Toeslag onregelmatige werktijd Extra payment for irregular work hours
Non trivial translation Dutch English
Aangetekende post Registered mail
Afvoer lijdraad Discharge instruction
Bakkenkar Bin carrier
Business balie Business counter
Inzetplanning Workforce capacity planning
Los Laad plaats (LoLa) Unload-Load-Dock
Postbezorger Delivery operative
Postbode Postal employee
Rolcontainer Rolling container
Voorbereidingsgebied (VBG) delivery preparation locations
Werkvloer Work floor


Matching workforce to workload at TNT business counters
1
1. Introduction
This report describes a Master graduation research into the process of matching workforce to workload at TNT business counters during the process of “collection”. Before we elaborate on this subject, we use this first chapter to introduce the reader to the company TNT and the general mail process.
1.1 The company TNT
TNT N.V. is a company that provides delivery solutions to organisations and consumers around the world. In the global transportation and distribution market, TNT participates with two divisions: Express and Mail. Together these divisions serve over 200 countries, employ some 163,000 people and TNT N.V. reports a yearly revenue of €11,152 million. [44]
The division Mail provides mail services to businesses and consumers. It is organised in four separate business units: Mail Netherlands, Spring, Cendris and European Mail Network, each focused on a different part of the mail services market. (More details on the organisational structure can be found in Appendix 1). We focus in this research on the business unit Mail Netherlands.
Mail services comprise the collection, sorting, transport and delivery of letters, direct mail, printed matter and parcels. On average, TNT Mail Netherlands processes and delivers around 16 million mail pieces per day. To perform the required collection and delivery activities at around 7 million different locations, TNT Mail Netherlands employs over 50,000 people. This makes it the biggest private employer in The Netherlands [30].
The history of TNT Mail Netherlands dates back to 1799. During this time TNT (named PTT) started as a state owned company responsible for all Dutch mail and telegraph services. During the following 211 years many radical changes to the mail process have taken place, for example the introduction of stamps, start of postal codes usage, and development of machines for the sorting process. All these changes had a major impact on the mail process and thus the company. One of the biggest changes to the organisation itself took place in 1989. That year TNT was privatised and thus no longer government owned. The history of government ownership still impacts the corporate culture today [31].
On the first of April 2009 the liberalisation of the total Dutch postal market was effectuated; a development in line with the trend of privatisation in Europe. For TNT this means that their special legal position on the Dutch market – being the only company allowed to deliver mail under 50 grams – no longer applies. With the disappearance of this monopoly, competitors are entering the market.
Besides these developments in competition, the ongoing trend towards digitalisation of society has an even bigger impact on the mail business. Developments in internet banking, digital invoicing and especially e-mail, lead to an ongoing decrease in mail sent physically. On the other hand, Internet sales are growing fast and the volume of parcels sent each day is rising accordingly. [44]

E.K. Haspels; University of Twente
2
The increasing competition, decreasing total mail volume, ongoing reorganisations and changes of the corporate culture challenges both the TNT organisation as a whole and all its employees individually.
1.2 The mail process
Getting mail from businesses and consumers to the correct location within 24 hours is a day and night process. Within TNT this process is organized in three sequential steps: Collection, Sorting and Delivery. To get acquainted with the general mail process we briefly describe each step in this process chain.
1.2.1 Collection
Every evening, mail is collected at 58 different locations throughout the Netherlands called “business counters”. Mail arrives here through mailboxes rides, collection rides and customers themselves bringing the mail to these collection locations.
At the business counter the arriving mail is invoiced if necessary and prepared for the sorting process. This preparation includes separating mail into specific containers and placing it in the right position. The different containers are for example dedicated to: small mail, large mail and parcels.
At fixed times during the evening these containers are sent on to a sorting centre by truck.
1.2.2 Sorting
All mail from the business counters located in an area (regions defined by TNT, see Figure 1) is received at one of the sorting centres; located in Amsterdam, Zwolle, Nieuwegein, The Hague, Den Bosch and Rotterdam. During the evening the sorting process is started.
The sorting process consists of two sequential sorting stages. In the first stage all mail is sorted by area, based on the first part of the postal code. During the night this roughly sorted mail is exchanged between the sorting centres. After all mail is exchanged each sorting centre is left with mail directed to locations within its own area. This mail enters the second sorting stage.
In this second stage the mail is sorted by specific regional code, making it possible to send the mail to the delivery preparation locations present in each area. Delivery preparation locations are facilities (403 in total) located throughout the Netherlands were mail is prepared for the final delivery step.
1.2.3 Delivery
Around 6 a.m. mail arrives at the delivery preparation locations. Here the delivery process is started by “house-number-sorting”. In this process a machine makes sure each mail piece is put in the right order according to the delivery route of each “delivery operative”. Subsequently a postal employee manually combines the mail coming from the house-

Matching workforce to workload at TNT business counters
3
number-sorting machine with advertisement, mail which was too large for the machine and printed matters. Also special mail like condolence cards and registered mail is added (which arrive at the delivery preparation location by a different process). This combined mail is bundled by a rubber band and put in delivery bags. These bags now hold all mail which needs to be delivered in the right order of delivery location.
At this moment the mail is ready for distribution on foot, by bike, by car or even by boat. The delivery operatives deliver the mail into mailboxes which every business or household in the Netherlands has.
A schematic overview of the three sub processes is given in Figure 1 and more details can be found in Appendix 2.
Figure 1: Overview General Mail Process
With this basic overview of the company TNT and the general mail process in mind, we continue to the next chapter. In chapter 2 we present the actual problem statement this research addresses, and discuss our research approach and structure of this report.

E.K. Haspels; University of Twente
4
2. Problem identification
To identify the specific problem we want to address in this thesis, we discuss our research motive in section 2.1. Based on this motivation we introduce the problem statement in section 2.2. To divide this problem into manageable parts, we present four underlying investigative questions. For each of these questions we discuss our approach on how we intent to answer it. In the last two sections of this chapter, 2.3 and 2.4, we outline the scope of this research and provide an overview on how the remainder of this report is structured.
2.1 Research motive
The market of mail services is changing fundamentally [34; 44; 51]. The ongoing digitalisation of society, by for example internet banking, e-mail and digital invoicing, causes the total volume of the mail market to decrease. Especially in the Netherlands, where internet availability is high and usage extensive, mail volume decrease is predicted to be significant, around 6% per year [44]. The decrease in total market volume as well as the arrival of competitors, due to the liberalisation of mail services in the Netherlands, has a negative impact on mail volumes processed by TNT Mail Netherlands.
Decreasing mail volumes impose a challenge to the TNT Mail organisation as revenues are related to the processed volume. To counter the volume decrease new products are developed to achieve competitive advantages, and TNT is entering new and emerging markets for growth [30; 32; 44]. Still, it remains clear that cost reduction is inevitable for TNT Mail Netherlands to cope with the current volume developments. The strategy of TNT Mail Netherlands therefore aims at structural cost reduction in all processes and the creation of a more flexible cost structure to let cost develop in accordance with income (see appendix 3).
The business unit Mail Netherlands is organized in two divisions; Production and Commerce. Commerce is responsible for marketing and sales of mail (related) products, production is responsible for the physical processing of mail. Moreover, the division Production is organized into different departments, amongst others, one for each mail process step: collection, sorting and delivery (see appendix 1). Each of these departments has its own budget and targets with regard to costs reduction and flexibility of the cost structure. Our research is focused on the department collection.
The department collection is responsible for the ‘collection process’, which accounts for approximately 8 percent of all expenses within the business unit Mail Netherlands [46]. Collection is the process of getting mail from the customer to the sorting centre at the right time and in the right condition. In the past years collection was controlled by budget control. In a nutshell this can be described as giving lower management the budget of last year minus a small percentage and let them be responsible to get the job done within the new budget. The advantage of this management style is that no strict process management is needed by higher level management and no performance indicators need to be registered other than budget and quality performance. Unfortunately, it can also result in the fact that processes are organised differently at different locations and “extra” improvement opportunities can

Matching workforce to workload at TNT business counters
5
be postponed by lower management. For them, any budget saved “extra” this year will be deducted from the budget next year, making it more difficult to achieve the targets then. With TNT’s focus on flexibility of the cost structure, budget control is no longer appropriate.
Furthermore a research was initiated in 2007 on workforce efficiency at business counters. The resulting confidential internal report [37] indicates that efficiency increase can be expected with improvement of process management (see appendix 10).
For these reasons, management at collection indicated business counters as an interesting place to look for possible cost reductions and improvements in flexibility of the cost structure. Therefore, in 2007, a reorganisation was started at business counters called “Dynamic Performance Model Collection” (DPM-C). The goal of this reorganisation was to:
1. Ensure all business counters work physically in the same ”best practice” manner.
2. Develop process management instead of the current budget management to ensure all business counters perform as good as possible with respect to traffic dependent cost in this new standardized situation.
The first step of this reorganisation focuses on standardization of how the work floor is organised. The procedures at all business counters are standardized by prescribing in detail which tasks should be performed, how they should be performed and which tools may be used. Although some standard operations procedures were already available before the introduction of DPM-C, variations between locations still existed. This was mainly caused by difference of interpretation or deliberate reshaping of the process to fit personal preferences and local circumstances. The first part of DPM-C thus re-writes all procedures to a best-practice situation and then makes sure it is implemented at all locations. This implementation is done under supervision of Business Counter Change managers to insure no local variations arise.
The second step in DPM-C aims to improve the process management. To achieve this, the implementation of DPM-C starts by making the performance on efficiency of business counters measurable. And since DPM-C provides a standard work method and the assumption of equal input is made, measurement of performance on efficiency makes benchmarking different business counters possible. Based on productivity norms and average mail quantities the work time arrangements and contracts are also reviewed and changed if required for each business counter. Throughout the process behavioural change is stimulated by training. More details on the DPM-C process can be found in appendix 4.
DPM-C is implemented in several “waves” (groups of business counter) and evaluated per business counter. Difficulties during the implementation are encountered, mostly regarding employee cooperation. Still the first results of business counters working in the new DPM-C situation show that standardization of the process, focus on efficiency as well as the behavioural changes have positive effects on cost reduction and employee satisfaction [45].
Unfortunately, team managers also indicated they can only use the performance model and tools afterwards to show if the efficiency norms of workforce per mail quantity have been achieved. There is no thorough procedure to predict in advance how much workforce will be

E.K. Haspels; University of Twente
6
needed on a specific evening. Although this is mentioned in the DPM-C documents as something that should be developed, for now, team managers have the difficult task to schedule workforce on experience and gut feeling. And even if these predictions of required workforce would be available, an overview of how a team manager has to act on this information is lacking. The evaluations show the task of adjusting the workforce is far from trivial for team managers due to fixed work time arrangements, collective labour agreements and other restrictions [39; 40; 41]. Therefore management at collection has asked to perform a research into this subject.
2.2 Problem definition and approach
In this section we introduce the problem statement and discuss our approach to solve it.
2.2.1 Problem statement
As described in the research motive, management at TNT Collection wants to increase insights on how team managers can improve the match of workforce to workload at business counters on a day-to-day level. Based on the above stated inducement for this research, we formulate the following problem statement:
How could the day-to-day process of matching workforce to workload be improved at TNT business counters?
To solve the stated problem we unravel it into separate easier-to-answer questions in the next section, the so-called investigative questions [1]. These questions are formulated such that we can answer them separately and combine the answers to find a solution for the stated problem. For each question we also describe a detailed approach on how we intend to answer it. This results in a step by step plan to execute the research.
2.2.2 Investigative questions and approach
We start our research process by acquiring a general overview of TNT Mail Netherlands. In our view it is essential for a successful business research to be aware of the general organisational goals, processes and corporate culture. We acquire this understanding by interviewing employees at the head office, the area offices and on the work floor. Also desk research on general TNT documents (for example the year report and employee introduction documents) and observations in all the major processes increase our understanding of the context of this research. Against this background, we focus specifically on the collection department. To find an answer to the stated problem, it is important that we thoroughly understand the collection process at business counters. Therefore we formulate the first investigative question as:
1. How is collection organized within TNT?
The answer to this question should go into detail on: the organisational context of collection, the process steps at the business counters, responsibilities and current workforce management at business counters, to achieve a comprehensive understanding of the current situation.

Matching workforce to workload at TNT business counters
7
To acquire this knowledge, we study internal reports and schematic representations concerning the collection organisation and processes. Next we interview senior collection support employees and work floor management (team managers and collection-region managers) to confirm whether the descriptions in the documents are a valid representation of the process in reality. Also insights in processes not fully documented (for example the workforce planning process) result from these interviews. Chapter 3 presents an overview of the collected information.
With a sound understanding of the current situation we proceed by gaining insight on how to match workforce to workload. We do so by answering the question:
2. How can workforce be matched to workload according to literature?
Matching capacity to demand is discussed widely in literature and comprises many subjects and levels of detail. To clearly position this research within this wide area, we conduct a literature study to provide a positioning framework on planning and control. Within this framework we zoom in on the subject of resource capacity planning on operational level as this is the research area concerned with daily matching capacity to demand. In literature, resource capacity planning and control (also known as resource capacity management) describes the process of avoiding idle capacity with the goal of attending to demand in time and in the most efficient way [7]. Resource capacity management at business counters mainly consists of workforce capacity management as employees are basically the only resource used in the process. Therefore the most efficient way of matching workforce to demand depends logically on the balance between overstaffing (wasting resources) and understaffing (influencing quality) effects [19].
Workforce capacity management would not be difficult in a fully certain and non variable environment. Unfortunately the real world has inevitable environmental uncertainty. Coping with this uncertainty is addressed by the subject of flexibility. A theoretical view on the relation between environmental uncertainty and the possibilities of operational workforce flexibility provides the basis for this research. We study specific literature on the subjects within the framework, to create a comprehensive understanding. Chapter 4 will depict our findings.
We use the structure found in literature to focus on the specific situation at TNT by answering the question:
3. What is the workforce flexibility requirement at TNT business counters?
a. Which factors create uncertainty? b. How big is the fluctuation of these factors? c. Can the uncertainty of the factors be reduced and how?
This third question is addressed in chapter 5 and aims at outlining which factors influence the required workforce and how the uncertainty of these factors could be reduced. We address this question by analyzing the workforce requirement, using indications from literature and interviews with Business Counter Change Managers. Based on this information

E.K. Haspels; University of Twente
8
we determine the influential factors and model their relation to workload uncertainty. Then we determine the availability of data sources. For data sources that are available, we will investigate the fluctuation and uncertainty of the specific factors. Comparison of this data driven information with expert knowledge (team managers and managers), will indicate whether we can assume the results to be valid and credible.
When the uncertainty of different factors is known, we investigate how to reduce or eliminate these influences with measures on operational level. We do not intend to uncover all possibilities, and will focus on the possibility to forecast day-to-day demand, as this is a specific interest of collection management.
We know in advance that by definition not all uncertainty in workforce requirement can be eliminated. Therefore the last part of this research covers the following question.
4. How can a team manager create workforce flexibility at TNT business counters to cope with workload uncertainty?
The last step in this research, presented in chapter 6, addresses the problem of how to cope with the inevitable remaining uncertainty in the required amount of workforce. Team managers need a clear overview of tools and measures available to cope with this uncertainty. Creating and using workforce flexibility yields the way in which team managers can achieve their performance goals.
As this is no exact science, we use expert interviews to uncover best practices currently used within TNT. We do not have time and resources to interview all team managers, thus we select the team managers suggested by Area collection managers. In problem centred interviews [28] we uncover which workforce flexibility methods found in literature, are currently used by team managers to cope with too many or too few employees present during the process.
Answering all the investigative questions separately and combining the answers, results in a sound answer to the problem statement. We present this answer in the concluding chapter 7. This answer provides insight in matching workforce to workload at business counters and an overview of applicable measures for team managers to create flexibility.
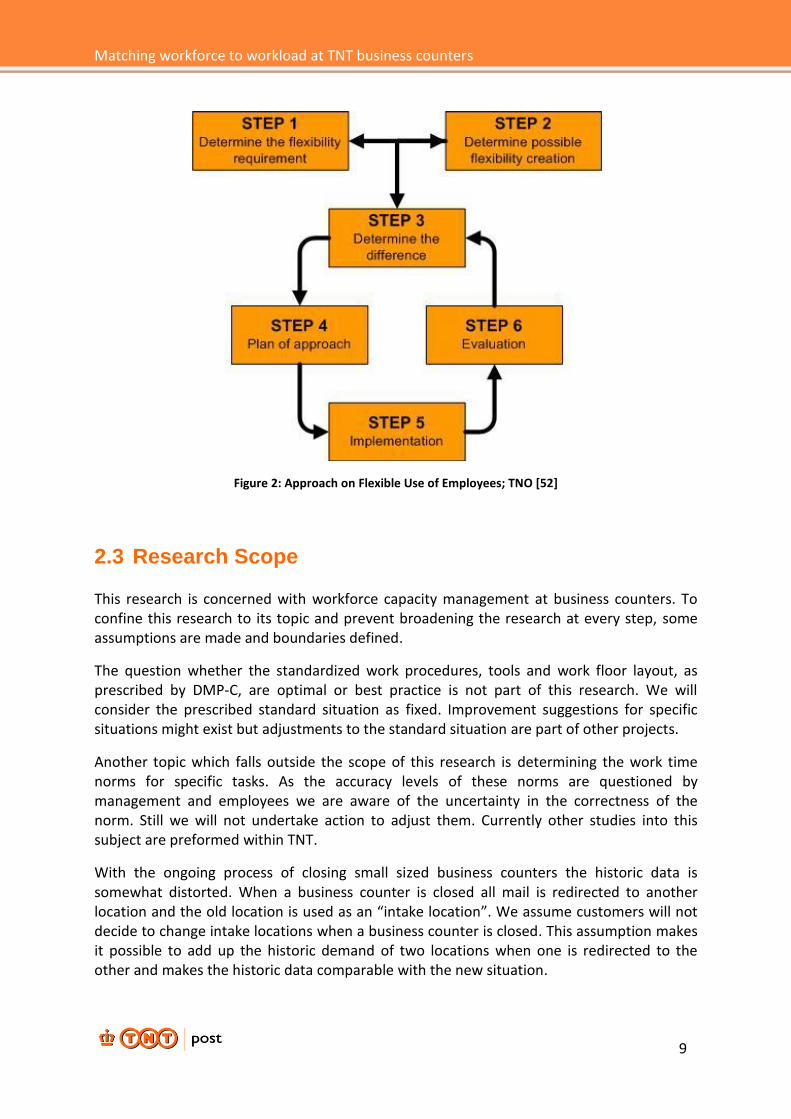
The approach our research takes on solving the research problem correlates with the first two steps in the “approach on flexible use of employees” suggested by TNO [52] (Figure 2). Their approach also shows the steps ‘determining the difference’, ‘implementation plan’, ‘implementation’ and ‘evaluation’ are needed. We agree that these steps should be performed but as they concern actions for specific facilities, these steps are outside the scope of this research. Implementation is thus not part of this research.
Now that our approach to solve the stated problem is defined, we discuss the scope of this research in the next section.
Matching workforce to workload at TNT business counters
9
Figure 2: Approach on Flexible Use of Employees; TNO [52]
2.3 Research Scope
This research is concerned with workforce capacity management at business counters. To confine this research to its topic and prevent broadening the research at every step, some assumptions are made and boundaries defined.
The question whether the standardized work procedures, tools and work floor layout, as prescribed by DMP-C, are optimal or best practice is not part of this research. We will consider the prescribed standard situation as fixed. Improvement suggestions for specific situations might exist but adjustments to the standard situation are part of other projects.
Another topic which falls outside the scope of this research is determining the work time norms for specific tasks. As the accuracy levels of these norms are questioned by management and employees we are aware of the uncertainty in the correctness of the norm. Still we will not undertake action to adjust them. Currently other studies into this subject are preformed within TNT.
With the ongoing process of closing small sized business counters the historic data is somewhat distorted. When a business counter is closed all mail is redirected to another location and the old location is used as an “intake location”. We assume customers will not decide to change intake locations when a business counter is closed. This assumption makes it possible to add up the historic demand of two locations when one is redirected to the other and makes the historic data comparable with the new situation.

E.K. Haspels; University of Twente
10
During the start of the DPM-C implementation all rides at a business counter are rescheduled to improve the planning. The routing of these vehicles is planned in a combined effort of collection team managers and transport advisors. Expert knowledge and the software package Win-route are used to create schedules that do not violate: pickup time windows, driver and car restriction and take into account maximum capacity and time of return. These restrictions make it a complex process. A trade off has to be made between efficiency of rides and the desire to have mail at the business counter as early as possible to give a team manager more time for processing. Although the outcome of this process effects the available processing time and thus the planning process, improvement of this process is outside the scope of this research.
Although the process at business counters consists of several different process steps we will focus our data analysis on two specific steps: intake and preparation. These two processes account for some 74 % of workforce usage [37]. The other processes account for the remaining 26%, but as they are more difficult to study (due to data absence and greater variation between facilities) as well because of their limited size, we leave them outside our research scope.
With the scope defined we present the thesis outline in the next section.
2.4 Thesis outline
The structure of this thesis is based on the step by step plan presented in the research approach where each investigative question is answered in a different chapter. A structured overview of this thesis is presented in Table 1.
Chapter Subject Investigative
question
1 Introduction to TNT and the mail process -
2 Identification of the problem and outline of the approach -
3 Description of the current situation at TNT business counters
1
4 A review of literature on matching workforce to workload 2
5 Determining the factors of workload uncertainty and discuss possibilities to reduce this uncertainty
3
6 Description of methods to create workforce flexibility to cope with the remaining workload uncertainty
4
7 Presentation of our conclusions and recommendations -
Table 1: Reading Guide
The first investigative question is answered in chapter 3 by providing a detailed description of the organisational context and the current processes at collection. Next in chapter 4 we present the literature used to analyse the stated problem and we describe the subjects of

Matching workforce to workload at TNT business counters
11
importance to this research, in detail. Chapter 5 addresses the third investigative question aimed at workload uncertainty. In this chapter we discuss the workforce uncertainty based on the variability of different factors. Furthermore methods to reduce this uncertainty are presented. The last investigative question about the different possibilities to create workforce flexibility is addressed in chapter 6. Chapter 7 is used to present the conclusions of this research and provides recommendations for future research.
With the problem statement, research approach, research scope and thesis outline discussed in this chapter we proceed to chapter 3.
Chapter summary:
Given the current situation of the mail market, cost reduction and cost flexibility are essential for TNT Mail. In addition to the current DPM-C reorganisation, this research aims at creating insight on how team managers can improve the match between workforce and workload on a day-to-day level. We intend to investigate how big the current fluctuations in the workload are and which operational measures could be used to reduce this uncertainty. Furthermore we will create an overview of workforce flexibility measure to cope with the remaining workload uncertainty. Creating this insight should lead to an overview on how team managers could improve the day-to-day match of workforce to workload at TNT business counters.

E.K. Haspels; University of Twente
12
3. Collection at TNT
As indicated in the research approach, we are in need of a thorough understanding of collection at TNT. We therefore begin this chapter by addressing the organisational context of collection in section 3.1. In section 3.2, we zoom in on the collection process taking place at business counters, and discuss each sub process in detail. To further comprehend the context of collection we describe its relation to other processes within TNT in section 3.3. In the last section of this chapter we discuss the current process of matching workforce to workload, as this gives us an overview of the current situation we want to improve.
3.1 The organisational context
To create insight in the organisational context of the collection department we provide a brief historical perspective, followed by an overview of collection’s function and structure.
3.1.1 Historical perspective on collection
Up until a reorganisation called NewCo in 2006, collection of mail was organised within the department delivery. Due to the limited size of the collection process (in terms of expenses and personnel) in comparison to the delivery process, not much attention was paid to efficiency and improvement opportunities. Also, the fact that collection is the first step in the sequential mail process, led to a common perception that trying to achieve cost reduction at collection could negatively influence the performance of the other steps in the mail chain. Possibilities to achieve savings were therefore not often considered.
The reorganisation NewCo in 2006 changed this situation by the creation of a specific department for collection, separated from delivery. This new collection department had its own function, organisation and goals [38]. Cost savings and increase efficiency became specific targets for collection management and thus received increased attention.
3.1.2 The function of Collection
The department collection fulfils two important functions within the mail process, namely:
Order to Cash (O2C)
Collect to Deliver (C2D)
Order to Cash describes the process of making sure all mail is paid for. As collection is the starting point of the mail process, this is where mail is aggregated and prepared for processing. If mail passes through collection into the sort process without being paid for, it is impossible to filter out. The unpaid mail would thus be delivered, resulting in unchanged costs but loss of income. It is therefore very important that mail which is not franked by the customer is registered by collection for invoicing. A financial indication of the importance of this function is given in appendix 9.

Matching workforce to workload at TNT business counters
13
The second function of collection is Collect to Deliver. Collect to Deliver comprises the function to get the mail from customers via the business counter to the sorting centre in “the right condition”, at “the right time” and in “the right way”.
“The right condition” indicates the need to prepare mail according to a specific discharge instruction. A sorting machines can only handle specific mail sizes and only when made available in specific TNT containers. Mail from customers thus needs to be pre-processed by employees at collection to let the mail comply with these specific instructions. “The right time” indicates the need to retrieve mail from the customer within the time windows agreed on by contract as well as making sure the mail arrives at the sorting centre on time. Finally, “The right way” involves amongst others: a respectful and cooperative attitude towards stakeholders, a professional TNT look of employees and equipment, and safe and environmentally responsible behaviour. Working in “the right way” is stimulated by different projects in line with the TNT Mail wide Customer Focus project.
The specific way in which collection fulfils its functions is of course subjected to change. When the collection department was created, the function was based on the collection processes at that time. But during the reorganisation in 2006 it was already suggested that research into fundamental changes in the process could yield interesting cost reductions. Projects (for example Greenfield [46]), have since then been started to explore fundamental changes to the collection process. Suggestions like the centralisation of business counters and collection in bins are explored in more detail at this moment and could change collection in the upcoming years. Even bigger changes like automation of the preparation process and invoicing by the sorting machine are mentioned as possible future developments to change the function of collection fundamentally within TNT. But as these developments towards a new situation are still uncertain at TNT, we consider the current situation and function of collection in this thesis.
3.1.3 Organisational strategy
The strategy directing collection is logically related to the strategy of the business unit Production and TNT Mail Netherlands as a whole. TNT Mail Netherlands has used the value disciplines of Treacy and Wiersema to focus their strategy on operational excellence and customer intimacy (See appendix 3).
Based on these principles, the business unit Production formulated their strategy as:
Retain current margins and profit in the Dutch market by: creating a flexible cost structure to cope with volume decrease and providing new services with which customers can achieve cost
reduction [43].
To execute this strategy New Initiative Master Plans (NIMP) were developed to give concrete directions. For each department different NIMP projects were developed. For collection the reorganisation DPM-C (briefly discussed in chapter 2 and in more detail in appendix 4) is one of those NIMP projects. Moreover, production’s year plan 2009 states 8 focus points for the year 2009 and one of them is the realization of the reorganisation DPM-C and its budget targets, thus emphasising its importance.

E.K. Haspels; University of Twente
14
3.1.4 Organizational Structure of collection
In Appendix 1, a description of the organisational structure of TNT as a whole can be found as well as details on the position of collection within this structure. In this section we will discuss the internal structure of the department collection.
Collection is, in line with Mail Netherlands, organised around the principle: centralized governance, decentralized execution. This means that policies are developed at the head office and execution of these policies is organised per area.
The department collection comprises employees at 58 Business counters, 250 business points (located across the Netherlands) and staff at the six area offices and head office. Drivers performing collection rides are also part of the collection organisation. In total this adds up to more than 4500 persons (the majority part-time employed).
Between 10 and 100 people work at a business counter. Employees at these facilities perform tasks like: intake, preparation or internal transport (see section 3.2). Each business counter is managed by 1 or 2 team managers. Team managers are responsible for the organisation at their business counter. Their tasks include scheduling of personnel, problem solving during the process and work hour registration. They are responsible for realizing the targets on cost and quality with all employees at their location [42].
Different business counters located near each other form a collection region. Each collection region has a collection region manager being the direct supervisor of all the team managers in that region. 18 of such collection regions exist.
Collection Area
Manager
Team Manager
Employee
Collection
Manager
Collection Region
Manager
Collection Area
Manager
Collection Region
Manager
Collection Region
Manager
Team Manager
Team Manager
Employee
Employee
Collection Area
Manager
Figure 3: Organisational Structure of Collection

Matching workforce to workload at TNT business counters
15
All collection regions in one area fall under the responsibility of the area manager collection. There are 6 area managers collection, one for each area, and they have a support staff at the area office. Finally there is one general collection manager at the head office, supported by senior collection advisors. An overview is given in Figure 3 and a detailed overview of the specific tasks for each function can be found in TNT documentation [42].
With the organisational context and structure in mind we focus next on the specific collection process steps which take place at the business counters.
3.2 The collection process
In this section we describe in detail the process steps executed at a business counter to get the mail from the customer to the sorting centre. We start by a description of the four ways in which mail can be collected and arrive at the business counters. Next we present in detail the process steps: split, registration and preparation. An overview of the processes is given in Figure 4.
Figure 4: Collection Process Overview
3.2.1 Mail arrival process
The process at business counters starts when mail arrives at the intake platform (Unload-Load-Dock). Depending on the business counter this arrival process starts between 15:00 and 18:00 hours. Mail can arrive in four different ways, namely: dedicated “mailbox-rides”, collections rides, an in-house business point, or customers themselves bringing mail. We will discuss each arrival process briefly.

E.K. Haspels; University of Twente
16
Mailboxes are probably the most widely known channel through which TNT collects mail. Somewhat surprising to most people is that only about 8 percent of all mail is collected through mailboxes. TNT has approximately 20,000 orange mailboxes scattered across The Netherlands. All mailboxes are emptied every day (mostly) between 17:00 and 19.00 hours, depending on their position on the pickup list. When a mailbox is emptied the mail is collected in one of two bags: region mail (green bag) and outside regional mail (brown bag); corresponding with the two intake holes of a mailbox. The bags are closed, labelled and brought to the business counter. Drivers who deliver the collected mail from mailboxes are obliged to separate the bags into two roll containers: the roll container for ‘mailbox regional mail’ (white/green) and the roll container for ‘mailbox other regions mail’ (white/brown). The colour between the brackets indicates the colour of the label on the rolling container.
The second way in which mail arrives at business counters is through collection rides by TNT employees or subcontractors. These collection rides are dedicated planned rides to collect mail at customers or TNT service points (for example postal offices or TNT concept stores or business points). Collection rides have time windows in which they have to collect mail at a specific location. Mail collected during these collection rides at almost 15.000 different location in the Netherlands can contain pre paid mail, unpaid mail, parcels (paid and not paid) and special service mail (paid and not paid). Drivers returning from a collection ride are obliged to separate the mail they collected into 4 different roll containers: Paid Special services (red), Paid Parcels (blue), Other Paid mail (grey) and Not paid mail (yellow).
A third way in which mail arrives at business counters is by customers bringing mail themselves. As this is almost exclusively done by customers with large amounts of mail and contracts about preannouncements and special delivery agreements, this normally only occurs at a business counter located at the sorting centre. Furthermore the special delivery requirements result in the fact that no additional processing steps are required aside from invoicing by weighing and possibly cross docking into new containers.
The last way in which mail can arrive at business counters is via the in-house business point. This is processed in the same way as mail from collection rides; thus separated into 4 different containers at the load-unload dock.
When mail has arrived at the business counter‘s load-unload dock and is placed in one of the six containers discussed, the next step is started.
3.2.2 Mail processing steps
The process steps taking place within the business counters are discussed next.
3.2.2.1 Stream splitting
The process steps at the business counter start when mail has arrived. At the intake dock there are 6 types of differently labelled roll containers available (as discussed in 3.1.2, depicted in Figure 4 and appendix 8). The person(s) responsible for “stream splitting” make sure the labelled roll containers are brought to the correct location inside the business counter facility. From this moment on, mail is obliged to always be identifiable by the label of the roll container, by an internal rule based on Sarbanes-Oxley clarity (an American law on

Matching workforce to workload at TNT business counters
17
accounting system prescribing process clarity). This is very important and strictly implemented because containers with unpaid mail should never be mistaken for paid mail and processed accordingly, as this would result in failure of the function Order to Cash and thus loss of income.
The white/green and white/brown labelled containers, containing “regional” and “other regions” mailbox mail respectively , do not need processing at the business counters. This mail will be handled by a machine at the sorting centre called ‘SOSMA’. Therefore the only handling at the business counter is to aggregate the labelled bags in roll containers and position those on the load-dock to be picked up by a truck transporting them to the sorting centre.
All the blue labelled containers, containing paid parcels, are transported to the parcel preparation area, which is most of the time positioned directly next to or on the load dock. Here the parcels are split into 6 different roll containers according to the specific discharge instruction of the Sorting Centre Parcel (ScP).
All the red labelled containers, containing paid special services mail, are transported to the secure special services room where each mail piece is registered. All special services mail is put into a sealed roll container and sent to a secure sorting centre located in Arnhem. Also mourn letters are handled in this special room, only they are not sent to Arnhem but put into an special “envopack” and passed on to the regular sorting centre where they handle this “envopack” in a separated process.
The grey labelled containers, containing all paid mail, are brought to the preparation area. Here these containers are placed in a buffer area, which is indicated by lines on the floor, where they are positioned until they can be processed.
Finally the yellow labelled containers, containing all not paid mail, are brought to the order splitting area.
3.2.2.2 Order splitting
All yellow containers with mail which needs to be invoiced are placed in the buffer for order splitting. Mail arriving here should contain an order form as customers are obliged to include such a form if their mail needs to be invoiced. The orders are split per order row to make registration at the counter easy and efficient. If an order form is missing the order is put aside and the form is looked for or created after contact with customer service or the customer.
All split orders are handed over to the registration counters.
3.2.2.3 Registration
Registration is an important process step for the Order-to-Cash function. Here the mail is weighted and counted to check the order form, and registered into the computer. When the order is put into the computer, the system randomly selects around 14% of the orders to be checked (“mirrored”) administratively. This means the order form is registered again and checked on consistency. The computer also randomly selects some orders to be fully

E.K. Haspels; University of Twente
18
checked, meaning they will be counted, weighed and registered again to fully check if the order form is 100% correct. If weight difference is detected a weight check is performed by a different employee on a different counter to make sure no mistake was made. The computer also checks whether a customer has payment problems or other reasons why mail should not be sent. If such a situation occurs the mail is put aside in the roll container labelled “bounced” until contact with the pre-and after sales departments has confirmed what to do.
All mail that has been invoiced correctly is placed into one of the roll containers behind the counter (being: paid mail regular 24 hour, paid mail 48 hour, paid parcels or paid special mail). Internal transport will now take these containers to the correct location.
3.2.2.4 Mail Preparation
All 24 hour regular mail (first) and 48 hours mail (last) containers at the intake process are transported to the preparation area and are labelled “green mail”. Mail arriving direct from the load-unload platform is called “grey mail”. Although the processing required at the preparation area is similar, the green mail is normally somewhat “easier” to process as it contains more grouped mail on average. Therefore grey and green mail are processed separately.
When the mail arrives at the preparation area, an employee picks it up by a lifting machine and dumps it onto a conveyer belt or a table, depending on the availability of these tools. From here the preparation employees pick up the mail and place it in a specific position in a specific bin. There are 6 different bins for respectively: large mail, small mail, bounced mail, bus-parcels own area, bus-parcels other areas and stamp mail. The employees pick up each mail piece and judge on the size, franking and postal code in with container it should be placed. They then place it in the correct container with the address in the upright position.
Full bins are places on a bin carrier, ready for shipment.
3.2.2.5 Expedition
All mail which is ready for departure is put together and made ready for shipment by the expedition employee. This includes volume registration in the computer, and checking if all bins are stacked properly on the bin carriers.
Mail which is invoiced, prepared and stored in specific roll containers or bin carriers at the load-unload dock can be place in the truck(s). Truck drivers will fill their trucks on specific times during the night and drive to the sorting centre.
The descriptions presented in this section provide an overview of the processes taking place at a business counter. Next we discuss the context of collection by highlighting its connections to other business departments.

Matching workforce to workload at TNT business counters
19
3.3 Collection in the mail chain
As Collection is just one step in the process of getting mail from the sender to the receiver we will discuss the connections business counters have with other departments.
3.3.1 The Pre- and After Sales department (PAS)
TNT tries to make sure that customers consider sending mail as being easy. So when customers hand in their mail not according to standards, the mail is most of the time still accepted. During interviews we learned that the Pre and After Sales department (PAS) is not eager to ask customers to change their sending behaviour as this may impact their experience of “the ease of sending”.
Incorrectly submitted mail however impacts the processes at business counters because the input becomes more variable. When such problems occur at business counters, the team manager seeks contact with the PAS department and tries to solve the problems in close dialogue. Contact is also made with the PAS department when wrong account numbers are mentioned on the intake form or when complains of customers occur.
3.3.2 Transport
Transport is the department which connects the business counters with the rest of the mail chain. Service Level Agreements (SLA’s) exist, which state at what time trucks arrive and what quantity they should be able to take to the sorting centre. Transport has its own SLA’s with other departments and contractors’ thus trucks cannot wait if the process finishes too late. It sometimes happens that the process at a business counter finishes 10 minutes late. This can result in the situation where the transport truck has left with all mail which was ready at the contracted time and some mail is left at the business counters. In that situation the team managers needs to arrange a car or truck from transport to come and pick up the remaining mail as fast as possible. Understandably this can result in a very costly process.
3.3.3 Sorting
Sorting is the processing step sequential to collection. The end product of collection (invoiced and prepared mail) is the input for the sorting process. Sorting and collection have Service Level Agreements considering the quality of prepared mail and the percentage of mail arriving on a specific time. The quality is measured by sample control and almost never indicates a problem (only sporadically at international mail). The amount of mail arriving on time is a bigger concern. At the sorting centre they would like to have the mail earlier as they can then plan the process more easily and have some process slack in case of machine failure. At collection they would like to deliver the mail later as they have problems of finishing in time, especially if process disruptions occur or if the mail volume is unexpectedly bigger. These different interests are considered and negotiated each year in the SLA’s.
With a clear understanding of the process at collection and the position it has within the total mail process, we now focus on the current process of matching workforce to workload at business counters.
E.K. Haspels; University of Twente
20
3.4 Current workforce management
Team managers are responsible for managing personnel at their business counter. This includes tasks in recruitment, planning, control and administration. Many of the team managers have already been employed for a long time, which means they carry out their tasks with routine and mostly based on experience.
3.4.1 Workforce planning
At every business counter there is a group of employees who work according to a work schedule in accordance with their contracts. The task of the team manager it to adapt the work schedule to changes in employee availability and workload fluctuations. Examples of changes in availability of employees are: employees preferring to switch shifts, employees desiring vacation leave or employees calling in sick. Other kinds of leave such as compulsory training also need to be taken into account. Moreover, the amount of work fluctuates due to for example lower mail activity during vacations, special advertisement campaigns, local events like festivals, and the individual choices of customers to send mail on a specific day.
The work schedule for the upcoming week is constructed the week before and is normally based on the schedule of the previous week modified with the known disruptions. But how much mail will arrive at a business counter on every evening next week is not known exactly. Some experienced team managers indicate they do know to some extent, if more or less mail can be expected. This expectation is based on a feeling for trends or the awareness of unique events. Example are: “the Monday is always more busy than the Wednesday” and “next week there will be less mail because of the fun fair in the nearby village”.
To change the work schedule team managers have their own way of processing the available information. In general no algorithms or automated systematic approaches are used to switch or add shifts; most managers use common sense, personal excel sheets and close dialogues with their employees in order to come to adjustments in the work schedule. As switching depends highly on flexibility of employees and detailed knowledge on personnel characteristics and because of the limited size of the problem, this common sense and dialogue approach is perceived sufficient.
Switching shifts of employees in the work schedule might result in violations of for example Collective Labour Agreements (CLA). These violations are automatically detected when such a switch is registered in the hour registration system: Harmony. Most team managers solve such violations by continuing to swift and hope one schedule is allowed (trial and error) or team managers let employees switch shifts without registration if no payment difference occurs.
For unplanned disruptions like illness, team managers try to arrange ad hoc solutions also in close dialogue with their employees. Because of uncertainty in the required processing time, and the deadline of the last truck leaving to the sorting centre, team managers sometimes plan more employees than needed: ‘just to be sure’. Also, as some employees have contracts dating back many years, the decreasing amount of mail leaves the business counter with more people under contract than needed on the work floor.

Matching workforce to workload at TNT business counters
21
3.4.1.1 Changes with DPM-C
The planning process at a business counter changes when DPM-C is rolled out because of two things. First, the basic schedule and thus all contracts are changed based on measurements of the average amount of mail per weekday (over 42 weeks) and standard efficiency norms. This new basis schedule is put in Harmony, the software package for work time administration, and serves as the standard situation. With the adjustments to the contracts team managers do not encounter the problem anymore of having too many people under contract. Unfortunately, this is only a 1 time fix to a problem which will reoccur in the future due to decreasing volumes. Though, the efficiency measurements will indicate if such a situation is arising. Secondly feedback on efficiency is introduced. Team managers receive on a daily basis how they performed the previous day. This feedback is intended to stimulate the team manager and direct him or her to schedule the amount of workforce better, thus having less over or under capacity.
3.4.2 Workforce control
When the planning is made, disruptions still occur. A team manager thus has to manage these disruptions to cope with them in an effective and efficient way. How a team manager does this depends on many factors. For example, if an employee becomes sick and needs to leave the process, a team manager might arrange an extra employee, ask the remaining employees to work overtime or switch employees between different processes. The specific way a team manager is used to handle in such situations depends on experience, personal preference and routine. Also the specific characteristics of employees and the business counter’s location influence the applicability of measures. Therefore coping with disruptions is done differently at different business counters.
3.4.2.1 Changes with DPM-C
The workforce control at a business counter changes when DPM-C is implemented. First of all the layout of the process is changed to create a more synoptic process. This increase in overview intends to help team managers assess the current situation and decide if action is needed. Also the introduction of process bulletin boards showing the productivity during the process should increase the ability to assess the current situation. Secondly the control function of team managers is developed by specific training on process steering. This can help the team manager to calculate with the current rate and the amount of mail present in the buffer, how much time is needed to process the remaining mail. We will address this topic in more detail in chapter 6.
3.4.3 Workforce administration
A software package called Harmony is used to administrate the work hours of personnel. The work hour schedule for the next week officially needs to be published and shown to the employees 48 hours before the schedule starts. In the Harmony application a basic schedule is present. Team managers need to adjust this schedule to the actual situation occurring on an evening. This means registration of sickness, leave time and overtime. The application gives a warning if work time restrictions are violated. Also if too many extra hours or too few hours are registered in comparison to the contract of an employee a warning is given.

E.K. Haspels; University of Twente
22
Harmony also indicates the availability of leave hours and needed action in case a person is sick for a long period of time.
3.4.4 Workforce planning restrictions
Personnel should always be scheduled within the rules of the law, the collective labour agreement, possible local rules, personal contracts and most favourably in mutual agreement. Collection is an organisation with many part-time workers. Therefore schedules are generally compliant with the laws concerning maximum work hours. If violations of the law do take place, they are mostly concerned with exceeding the maximum amount of work in overtime, and are corrected. Restrictions of the CLA are for example concerned with the minimal duration of a shift and the maximum of hours worked in overtime which can be exchanged for leave. Also personal contracts stating the minimum amount of hours to work in a month need to be taken into account by team managers when adjusting the planning.
Fortunately the work time registration application Harmony automatically checks schedules for their appliance to these rules. And Harmony also automatically calculates the amount of extra payment (for working irregular hours) employees are entitled to. For team managers it is important to know these rules and to take them into account when adjusting the schedules as for example, extra payment for working irregular hours only occurs if an employee works after 19.00 hours. So letting an employee finish its shift at 19.00 instead of 19.15 implies a lot less extra costs.
3.4.5 Summary of current workforce planning
Workforce planning at business counters is currently done by creation of a base schedule (based on average mail volumes per weekday) and then manually adjustment for known disruptions in advance and unknown disruptions during the process. As there is no structured way of predicting how much workforce will be required other than the average in the basic schedule, team managers adjust this (if at all), on experience and gut feeling. It has not been documented at TNT how to cope with disruptions during the process. Hence differences are observed at each business counter.
In this chapter we have described the processes at business counters, their position within TNT and the current methodology how workforce is matched to workload. In the next chapter we provide a literature overview of the topic of matching workforce to workload.
Chapter summary:
Business counters at TNT collect all incoming mail and prepare it for the sorting centre. Various processes are carried out in business counters and are overseen by team managers. One of the team manager’s main tasks is matching the needed workforce to the expected workload. For this, they use a weekly planning based on the contracts of the available employees, with adjustments tailored to the situation in a given week. As a formal instruction on how to produce a detailed work schedule is absent within TNT, most team managers adjust the work schedule based on experience, personal preference and routine.

Matching workforce to workload at TNT business counters
23
4. Managing capacity under uncertainty
In the previous chapter we addressed the first investigative question by providing an overview of the collection organisation and processes. In this chapter we discuss the second step in our approach, thus addressing the question how matching workforce to workload is discussed in literature.
In section 4.1 we provide a literature framework with which we place matching capacity to demand in a broad research perspective. Since coping with uncertainty is at the heart of this matching process, we introduce a framework on this subject (addressed as Flexibility) in section 4.2. Specific literature on our topic is discussed in section 4.3. We conclude this chapter with a roadmap in section 4.4 on using the literature to address the problem we defined in chapter 2.
4.1 Planning and control in perspective
A quick scan of literature on the topic of matching capacity to demand learns it is a broad research subject discussed widely, and often in manufacturing settings. For this reason we start by presenting a high level framework on planning and control to create an overview of topics, terminology and relations between research areas.
4.1.1 Introduction to planning and control
Globalization, ongoing developments in (information) technology and increasing competition have led to an increasing awareness by management about the importance of system performance. System performance does not only address efficiency and costs, but also aspects of product and process quality, flexibility and speed [29]. Unfortunately, improving system performance is, most of the time, not an easy task.
This increase of management awareness caused the scientific community to pay a lot of attention to advancements in system planning and control. According to Zijm, all approaches in planning and control have in common “that they attempt to increase process capabilities, to support planning and control, or to diminish the planning and control complexity” [29]. Because of the widely acknowledged importance, the literature on planning and control has nowadays become broad, vast and incorporates different levels of detail. To create an overview in this field of research, several planning and control frameworks have been introduced.
4.1.2 Planning and Control Framework
A planning and control framework that emphasises the relations decisions in different areas have, as well as visually supports this interdependency, is the framework introduced by Zijm [29] (Figure 5). Like many other frameworks it is hierarchical in nature but this framework explicitly shows relations between decisions in different areas and stresses the importance of an integrated approach.

E.K. Haspels; University of Twente
24
Figure 5: Planning and Control Reference Architecture, Zijm [29]
A framework introduced by Hans et al [13] elaborates on the framework of Zijm and other hierarchical production planning and control frameworks, to create the framework shown in Figure 6. This framework distinguishes functional planning areas and hierarchical levels more explicitly then the framework of Zijm.
Figure 6: Planning and Control Framework; Hans et al [13]
As we focus in this thesis on how to plan capacity to match demand we learn from these frameworks that we should confine ourselves to the research area of resource capacity planning and control but be aware of the interdependency with other areas.
Furthermore, Zijm, and Hans et al. stress the importance of uncertainty. Zijm observed that until 1999 many Operational Research studies were concentrated on developing exact

Matching workforce to workload at TNT business counters
25
solutions for relatively simple problems, and not addressed more realistic problems. In real life it is never the case that conditions like perfectly predictable demand and unlimited production capacity are met. And as managers do not have the possibility to leave uncertain variables out of their day-to-day processes, these early developed methods gained limited credibility under managers. On the positive side, Zijm justly states that applying ‘simple’ methods can lead to a less complex system or better understanding of the processes and products [29].
In essence both Zijm and Hans et al. conclude that coping with uncertainties at different hierarchical levels is at the heart of planning and control. Hans et al emphasised this by explicitly stating uncertainties at the different hierarchical levels. Zijm pointed out in his framework that for each module, methods would be needed that explicitly address uncertainty. Since 2000 the literature on models for production planning under uncertainty is growing fast. The literature review by Mula et al [21] provides an overview per production planning area (comparable to those proposed by Zijm) and per modelling approach, illustrating the extensive research on these topics.
TNT example: An example of interdependency between decisions on different areas within TNT is the possible introduction of a new sorting and preparation machine (SOSMA). As this machine would be able to handle both small and large mail, the process would be changed. But a process change like this would have a major effect on the required resources and thus process planning at business counters.
In summary we conclude that the framework in figure 5 shows us that different areas of research are concerned with planning and control and that they interact. Hans et al. introduces a way to explicitly divide research areas and hierarchical levels. We use this division in this thesis to focus on resource capacity planning as this is the topic of interest for matching capacity to demand.
4.1.3 Resource Capacity Planning
In literature resource capacity planning (also referred to as resource capacity management) describes the process of avoiding idle capacity with the goal of attending to demand in time and in the most efficient way [7]. According to Adenso-Diaz et al. [7] the problem of capacity management is one of the most difficult to tackle in business management.
As Hans et al. [13] distinguished different hierarchical levels within resource capacity planning, we will address resource capacity planning at each of these hierarchical levels. It is important to understand that decisions on higher hierarchal levels are needed earlier in time and are based on more uncertain information but do create restrictions within which the lower levels need to operate.
4.1.3.1 Strategic capacity planning
Strategic capacity planning is concerned with long range forecasts on capacity needs. These capacity needs are influenced by highly uncertain factors, amongst others: the demand some years from now, unexpected product changes, and environmental changes (for example introduction of new competitors). Planning at this level is thus a difficult task and

E.K. Haspels; University of Twente
26
far from straightforward. Still decisions are needed as for example plans for new buildings or long-term employee training programs take a long time to implement.
Often historic data is used to make a prediction about the future by extrapolation of trends. Scenario building is also a technique used in this type of planning. Expert knowledge is then used to build up different scenarios and probabilities to the likelihood of occurrence of these specific scenarios are estimated. Of course, when the predictions about the future are made, advanced techniques to plan capacity in that predicted situation can be used.
TNT example: Strategic decisions at TNT Mail collection are for example the locations and capacity of buildings in which business counters are housed or long term lease contracts of trucks. These decisions are based on uncertain long range forecasts/scenarios of mail volume developments.
4.1.3.2 Tactical capacity planning
Planning at a tactical level is concerned with order acceptance and rough cut capacity planning. At the tactical level more information on the demand and possible process disturbance is available then on the strategic level but uncertainty still exists. And although capacity is bounded by decisions made on the strategic level, adjustments can still be made.
In spite of the uncertainty existing on demand and process characteristics, a decision on accepting or rejecting an order has to be made. Hans et al. state that in practice, order acceptance and production planning are often functionally separated resulting in making decisions without considering the actual workload in the system. Moreover to acquire orders companies tend to promise a delivery date that is as early as possible. This may lead to “serious overload of resources with a devastating effect on delivery performance and the profitability of the production system as a whole” [13]. And although some advanced methods exist on optimizing order acceptance by for example Mixed Integer Linear Programming models, it is common practice that companies accept as many orders as they can possibly acquire. Coping with the impact of this decision on the operational performance can be challenging on the operational level and could result in costly solutions or possibly diminishing service levels. [13]
The task of rough cut capacity planning deals with allocating resources to processes. To deal with such allocation problems, multiple computing strategies and robust allocation heuristics have been developed for different situations.
TNT example: For small customers TNT quotes fixed due dates for mail (24 hour delivery) and accepts all mail offered, order acceptance is thus completely skipped. Overload of the system could occur resulting in decreasing delivery performance and quality or lower profitability due to penalty costs and overtime payment.
4.1.3.3 Operational capacity planning
On the operational level planning is concerned with detailed scheduling and work floor control (a.k.a. shop floor control). “Shop floor control is a critical element for company’s success since its actions impact cost and delivery lead time” [2]. Work floor control comprises, according to Greene [2], five activities: Order review and release, detailed scheduling, data collection monitoring, control feedback and order disposition. When we
Matching workforce to workload at TNT business counters
27
focus on dealing with uncertainty we focus on detailed planning activities and according to Herroelen and Leus [16], scheduling under uncertainty can be distinguished in five different methods: reactive scheduling, stochastic scheduling, fuzzy scheduling, proactive robust scheduling and sensitivity analysis.
TNT example: An example of an operational decision at TNT business counters is, the way how to deal with the schedule if someone calls in sick.
Before we elaborate more on operational planning in section 4.3 we will first narrow down this still broad research area in the next section.
4.1.4 Workforce capacity management
In the previous section we stated that planning and control literature is mostly focusing on manufacturing environments. In this section we will discuss shortly what the different between manufacturing and service industry is. We argue that the process at TNT business counters is a service process leaving us with workforce being the only resource used. This narrows our research area down from research capacity management to workforce capacity management. We will therefore discuss which difficulties arise specifically within workforce capacity management again on three different hierarchical levels.
4.1.4.1 Service and manufacturing processes
“Because organizations differ widely in their characteristics, purposes, and constituencies, many attempts have been made to categorize them by choosing some apparently dominant criterion. From the researcher's perspective, organizational taxonomies should contribute to the development of models that more precisely predict or explain. From a practical standpoint, the worth of taxonomy must be measured by its utility in accomplishing these tasks. Thus, as Bedeian succinctly stated, the classifications are neither right nor wrong, but are either useful or useless. Among the most widely used (and least agreed on) contrasting categories are manufacturing and service” *26].
It is indicated in the quote above that categorization of organisations in service and manufacturing is widely used and least agreed on. Though, one of the most agreed upon characteristics of a service process is its high percentage of labour cost compared to total costs. Also the customer specific needs (heterogeneity) and the inability to stock service (perishability and intangibility) are characteristics we support and are commonly used to characterize service industries [8].
The characteristics of the collection process at business counters indicate it being a service organisation. The operations are labour intensive with labour costs accounting for about 62% of total postal costs (housing and transport cost being other major cost drivers) [46]. Customers have specific needs and only a limited degree of service inventorying is possible. We can therefore categorize the processes at TNT business counters as service processes rather than production processes. Hence, (almost) the only resource used at TNT business counters is workforce and we can switch our focus from resource capacity management to workforce capacity management. In this service process there is a classic trade-off between cost and customer service.

E.K. Haspels; University of Twente
28
4.1.4.2 Workforce capacity management
Workforce capacity management is described as the process of avoiding idle capacity with the goal of attending to demand in time and in the most efficient way [7] and with our focus on a service process the most efficient way of matching depends logically on the balance between overstaffing and understaffing effects [19]. According to Adenso-Diaz et al [7] the problem of capacity management in the service industry is especially difficult due to uncertain demand and personalized requirements, making planning and assigning productive capacity far from straightforward. While overstaffing implies extra cost, insufficient capacity implies a lower level of attention to customer needs and therefore a lack of perceived quality. We will exemplify some difficulties in workforce capacity management.
First off, determining what is “capacity” within the service industry is difficult. Lovelock [18] defines the capacity of a service as: “the highest possible amount of output that may be obtained in a specific period of time with a predefined level of staff installations and equipment”. But there exists a certain amount of debate with respect to the identification of a valid measurement of capacity as in the service industry quality should be taken into account. Moreover, difficulties in determining capacity result from: “the problem of product mix, the problem of setup time; the problem of varying efficiency; the problem of semi finished items or subassemblies; the problem of scrap/dropout; and a number of social, cultural and economic considerations” [7]. Just as in hospitals, using deterministic approaches, planning and management systems are expected to be inadequate or at best only partially useful. Workforce capacity management should incorporate the complexity, uncertainty, variability and limitation of resources [15].
Furthermore, workforce capacity management in services processes is more difficult due to the impossibility of making an inventory of the service, as occurs with the production of goods. “The impossibility of synchronizing supply and demand produces a loss in opportunity to attend to certain customers when demand is higher and supposes high costs due to the loss of income when demand is insufficient and the fixed available capacity is not put to good use. In this sense capacity management has a considerable impact on the quality of the service perceived by customers” [7] Workforce capacity planning is related to the assignment of the right number of skilled employees at the right place and time in order to efficiently perform a job. There are many steps in the planning process from forecasting or recruitment to scheduling in order to achieve the overall objectives [4]. The ideal situation for a service organisation would be the possibility of reducing its workforce capacity in periods of low demand and increase it in the high season [22]. But this is most of the time not straightforward.
With these difficulties in mind, we will discuss the challenges arising in workforce capacity planning on the three defined hierarchical levels.
4.1.4.3 Strategic workforce capacity management
Strategic workforce capacity management is concerned with amongst others: Long range developments in required workforce, long range developments in “in- and outflow” of employees and future workforce education.

Matching workforce to workload at TNT business counters
29
TNO [52] modelled the uncertainties in the requirement for workforce into the following three categories:
Trends and change in demand (Variation in demand, variation in product mix, developments towards short delivery times and the need for high reliability of service)
Trends and change on the labour market. (Availability of skilled labour, qualifications current personnel, increasing demand for quality of labour, increasing individuality, law and regulation restrictions)
Trends and changes in production concepts (one-piece flow; demand-flow manufacturing, complexity)
Changing characteristics like the workforce size or workforce qualifications to compensate for environmental changes takes time; making it strategic decisions. Increasing the flexibility by for example changing the availability of different contracts (fulltime/part time/temporarily /0-hours/min-max/freelance/compressed work week/“hour bank”/flexible leaf) is a decisions which needs to be negotiated in CLA and cannot be changed on short notice. And all methods created at this level to increase flexibility are only beneficial if used properly at the lower hierarchical levels.
4.1.4.4 Tactical workforce capacity management
Tactical workforce capacity management concerns decisions on capacity increase or decrease for the upcoming weeks or months. Capacity is limited by decisions on strategic level but can still be altered. Examples are decisions regarding hiring of extra personnel in busy times or arranging a holiday schedule for the upcoming months. Typical issues at this tactical level are staff sizing, shift scheduling and hiring temporary employees.
4.1.4.5 Operational workforce capacity management
Workforce capacity management at operational level is concerned with dealing with short term capacity adjustments and coping with disruptions during the process. The major barrier for capacity in the short term is to be able to deal with unexpected demands [7]. Options at this level are highly dependent on what boundaries and freedom is given and left at tactical and strategic level.
Measures on operational level can broadly be separated into proactive measures and reactive measures. The proactive measures try to analyze and predict the system, and base decisions hereon (for example forecasting/simulation/queuing analyses/Stochastic programming/Scenario analysis/sensitivity analyses). Reactive measures try to determine a policy that describes how to react to events (for example re-planning/re-scheduling /Schedule repair/Multi-stage stochastic decisions/Scheduling policies)
Now that we have an understanding of what workforce capacity management at the different hierarchical levels comprises of, we can further focus on dealing with uncertainty before exploring the operational workforce capacity management in detail in section 4.3.

E.K. Haspels; University of Twente
30
4.2 Flexibility Framework
As discussed earlier, uncertainty is to some extent present in all real world system. To deal with this uncertainty one could in essence do three things: try to reduce the uncertainty, try to find a way to cope with it, or a combination of both methods [52]. Coping with uncertainty or adjusting to a changed situation is addressed in literature as flexibility.
Flexibility is defined as: “the ability of a system or facility to adjust to changes in its internal or external environment; these adjustments must induce a small penalty in time, effort or performance” [27] Betts et al. [9] state that flexibility comprises range flexibility, indicating the number of changed situations which can be dealt with, and responsive flexibility, indicating the ease (time, money, etc) with which can be switched between the different situations. According to Betts et al [9], capacity management has to deal with both range and responsive flexibility.
The different kinds of flexibility found in processes are discussed by different authors. Kathuria and Partovi [17] propose flexibility could be categorized in: the ability to introduce new products, adjust capacity, handle changes in the product mix, handle variations in the delivery schedule and customize products. Other (similar) categories of flexibility mentioned in literature [25] are: Product flexibility; process flexibility; volume flexibility; routing flexibility; machine flexibility and more. We do not intend to contribute to the debate on different kinds of flexibility but rather be aware of the fact that different useful categories of flexibility exist. We focus in this research on capacity flexibility.
Das and Patel, [10] state that if there are no changes then there is no need for flexibility. Flexibility itself has no value, only when coupled against performance affecting change does it become valuable. And although this statement looks somewhat trivial it is important to realise as we find in more and more papers that flexibility is emerging as one of the key competitive strengths in today’s manufacturing systems [25]. It is also stated that flexibility can be a critical resource of competitive advantage as uncertainty can be created by the organisations itself if they are more capable to deal with flexibility then their competition [17]. Still flexibility remains difficult to achieve and should be planned and managed.
As we are in need of insight into how uncertainty in the system and reduction or coping with uncertainty are related we introduce a framework. A framework by Gerwin [12] (Figure 7) presents an overview of the relation between Uncertainty and different ways of coping with uncertainty.
We will discuss the different parts of the framework separately in the following sections.

Matching workforce to workload at TNT business counters
31
Figure 7: Conceptual Flexibility Framework, Gerwin [12]
4.2.1 Environmental uncertainties
Galbraith [21] defines uncertainty as the difference between the amount of information required to perform a task and the amount of information already possessed. In the real world, there are many forms of uncertainty that affect processes. It is impossible to completely remove uncertainty from the supply chains, and also from each link of the chain [21]. Uncertainty can be categorized into two groups: (1) environmental uncertainty and (2) system uncertainty. Environmental uncertainty includes uncertainties beyond the process, such as demand uncertainty and supply uncertainty. System uncertainty is related to uncertainties within the process, such as operation yield uncertainty, lead time uncertainty, quality uncertainty, failure of system and changes to product structure, to mention some. An almost identical classification often is used: internal and external uncertainty. External uncertainty includes: demand volume, demand variety and supplier procurement limitations while internal uncertainty covers: efficiency, employer illness, process failure, etc.
Demand uncertainty received more attention in literature in comparison to other types of uncertainty such as supply lead times, transport times, quality uncertainty, failure of production system, and changes to product structure [21].
4.2.2 Manufacturing strategy
The extent of learning how to cope with uncertainty is reflected in a company’s manufacturing strategy which attempts to defensively adjust to uncertainty or proactively control it. [12] Because we address a service organisation we refer to this as planning strategy rather than manufacturing strategy. To cope with uncertainty one can have a proactive or reactive strategy [13]. Proactive strategies anticipate to uncertainty while reactive approaches change the planning after a change has occurred. A strategy is called online if it is effectuated during the process while offline means it is done before the process. The choice between proactive and reactive is balancing the effort to reduce uncertainty to the effort of coping with uncertainty.

E.K. Haspels; University of Twente
32
Gerwin categorizes the use of flexibility in his framework into: Redefine, Reduce, Bank and Adopt. Redefinition of flexibility is aimed at proactively changing demand in such a way that the companies ability on flexibility is maximized, creating a competitive advantages. Banking flexibility can be used to prepare for unknown changes in the future. Reducing the required flexibility and the adoption of flexibility is the traditional trade off between cost of reduction and cost of coping.
4.2.3 Required flexibility
From the model it follows that flexibility is always required, whether the strategy is defensive or proactive. Resulting from the environment and chosen strategies a certain amount of flexibility is required. Balancing is needed between the cost of reduction of uncertainty and the cost of creating flexibility. Unfortunately many factors in this decision are difficult to quantify and measure. For example, restricting the quantity customers can send reduces volume uncertainty but it is difficult to quantify the effect on customer satisfaction. Also creating contracts allowing more flexible work hours might be considered valuable by some employees and invaluable by others. A management decision balancing these costs of reducing uncertainty with the costs of creating flexibility, given the many variables involved which are difficult to measure, results in a difficult trade off.
TNT example: Examples within TNT collection of these kinds of decisions are: the cost of giving customers less choice, and thereby reducing variation versus the cost of losing customers; and the cost of increasing the workforce flexibility, versus the cost of decreasing workplace attractiveness.
4.2.4 Methods for delivering flexibility
To achieve workforce flexibility we have to take into account that decisions at higher levels impact the flexibility on lower levels; for example flexible contracts established at strategically level make it possible to let employees work overtime or send them home on operational level. If this is not incorporated in the contracts these methods are not applicable. Workforce flexibility at operational level is concerned with conditions which can be adjusted in a very short time span.
In the next section we will discuss both proactive and reactive methods to deliver workforce flexibility.
4.3 Operational workforce capacity management
To discuss methods to match workforce to workload on operational level we combine our finding for section 4.1 and 4.2 in one model. This can be seen as a simplification of the model of Gerwin but with the addition of the explicit difference in proactive and reactive methods. We visualize this in a two by two matrix model (table 2).
To adjust workforce capacity on operational level Meredith distinguished 5 categories, as cited in [7]: Increase resource (use overtime, add shifts, etc), improve use of resource (stagger shifts, accumulate stock, etc.), Modify the product (reduce quality), Modify demand (example: vary price), and Not satisfy demand. To indicate the relation to our matrix, we

Matching workforce to workload at TNT business counters
33
argue that the first two categories divined by Meredith are concerned with flexibility, the later three with reduction of workload uncertainty.
Operational measures to match workforce to workload
Reduce workload
uncertainty
Increase workforce flexibility
Proactive 1 3
Reactive 2 4
Table 2: Model to categorize operational measures to match workforce to workload
We will discuss briefly what kind of measures apply to each quadrant in the next sub sections.
4.3.1 Proactive reduction of workload uncertainty
Proactive reduction of workload uncertainty is mainly dealt with on higher hierarchical levels. On strategic level reduction of workload uncertainty can be achieved by explicitly taking uncertainty into account with the design of the product or process. On tactical level promotions could for example proactively influence the workload.
On operational level one could proactively reduce the workload uncertainty by trying to predict more accurately how much workload will arrive on a particular day. Next to pure mathematical forecasting techniques on historic data, additional information could be gathered. Pre-announcement of orders by customers could increase the reliability of predictions. At the operational level the customers demand can also still be influenced slightly by for example offering discounts if they deliver exactly the pre-announced amount.
4.3.2 Reactive reduction of workload uncertainty
Reactive reduction of workload uncertainty is somewhat strange as we try to reduce the uncertainty of something that has happened. Still, workload that has arrived can be altered. An example is denying a service if the workload has reached a limit. In the mail business this would come down to not sending a letter on the day it is posted, but the next day. The uncertainty in workload is then reactively reduced (but against loss of quality).
Another possibility is to change the workload of a service after it has arrived. If for example so much workload has arrived that it is too large to handle, we can reactively reduce this workload by changing the process or end product. For example in the mail process described in chapter 3 it could be decided that if too much workload has arrived orders would not have to be mirrored anymore or mail could be send to the sorting centre without being prepared in the proper manner. In both cases the workload is lowered but at the cost of lowered quality.

E.K. Haspels; University of Twente
34
4.3.3 Proactive increase workforce flexibility
Proactively increase of workforce flexibility means preparing the workforce to be able to cope better with an amount of uncertainty or be able to cope with more uncertainty. Thus creating in advance, ways to change the workforce according to the changes in workload.
Making the workforce proactively more flexible is mainly a strategic and tactical business. Tactical robust scheduling for example results in being able to handle a changed situation better. Educating employees to be able to work on different tasks result in more flexibility because employees can be deployed on multiple functions.
On operational level, proactive increase of workforce flexibility is mainly concerned with preparing employees to better cope with changing situations. Informing employees about the amount of work that is expected or informing them about the possibility that later during the process employees are asked to switch tasks is in a sense proactively increasing the flexibility.
4.3.4 Reactive increase workforce flexibility
The last quadrant of our overview focuses on the reactive measures to increase the workforce flexibility. During the process it can become clear that the workload is different from what was anticipated for. At that moment a manager has to react to this new situation.
Meredith’s gave some examples of measures within this field: use overtime, add shifts, employ temporary workers, use part-time workers, hire resources, sub contract and stagger shifts to mention some. Switch colleagues between tasks, either horizontally or vertically or switch employees between different facilities, are examples of concrete methods to be used in different Dutch companies [51].
Most of these methods depend on cooperation of employees and achieving this is influenced by the style of management [53]. Kathuria [17] describes the following management styles:
Relationship oriented practices (including: networking, team building, supporting, mentoring, inspiring, recognizing, and rewarding)
Participative leadership and delegation practices (including: consulting, delegating)
Work oriented practices (including: planning, clarifying, problem solving, monitoring, informing).
According to Kathuria [17+ the “relationship oriented” style of management is essential in flexible workforce environments.
4.4 Application outlook
As this research focuses on the operational level, strategic and tactical workforce capacity management fall outside the scope of this research. We do present some recommendations regarding strategic and tactical level subjects in chapter 7.

Matching workforce to workload at TNT business counters
35
Based on the literature review in this chapter we conclude we need to determine the uncertainty of the environment (section 5.3) and determine how we could reduce this on operational level both proactively and reactively (section 5.4). Moreover we need to determine how we can create flexibility to cope with the remaining uncertainty, again both proactively and reactively (chapter 6).
Chapter summary:
When service processes take place in the real world there is always an environment creating variability and uncertainty. Planning and control is focussed on dealing with these effects. We conclude from literature that uncertainty exists on different hierarchical levels. On the operational level, uncertainty can be dealt with in a proactive or reactive way and the measures can target reduction of the uncertainty itself or enhancement of the ability to cope with it by increasing the workforce flexibility.

E.K. Haspels; University of Twente
36
5. Reducing workload uncertainty
In the previous chapter we have learned that the process of matching workforce to workload on operational level is concerned with addressing uncertainty. In this chapter we investigate which factors are causing uncertainty in the workload and which measures could reduce this uncertainty. How to cope with the remaining workload uncertainty is addressed in chapter 6.
In section 5.1, we describe which (internal and external) environmental factors influence the workload. Next, in section 5.2, we present the data sources available to analyse the uncertainty and discuss problems encountered in the data collection. Section 5.3, presents our analysis of the current fluctuations of volume and productivity at both the intake and preparation process. In section 5.4 we focus on which actions could be taken to reduce or eliminate the uncertainty of volume and productivity respectively. In accordance with the model in chapter 4 we will discuss proactive and reactive measures separately. We end this chapter with conclusions on the inevitability of uncertainty in workforce requirement.
5.1 Factors causing uncertainty
In this thesis we are interested in determining how much workforce is required to finish a process exactly on time. We can interpret the example below as: on some evenings too little and on other evenings too many people were employed at business counter processes.
Example: we know the intake process at the business counters in Almere and Hoofddorp should finish every day at 20:00. In the period January 2009 to March 2009, we observe that this process finished late on approximately 10% of all evenings while on many other evenings the process finished earlier than 20:00 [49][50].
Analysing the cause of the fluctuations in the required amount of employees, we created an overview of the influential factors. Logically, the amount of required employees depends on the total required processing rate and the processing rate per employee. The total required processing rate itself depends on the total amount of units that needs to be processed and the amount of hours available. We can further dissect the amount of processing time as the time between the start- and end time minus the possible existing idle time. We visualize these basic factors and their relations in Figure 8.
Example: if we have 10 units to process and 2 hour of processing time, it follows we need at least a processing rate of 5 units per hour. If an employee can process 1 unit per hour, we need 5 employees.
In the context of our research on operational processes at TNT business counters, we consider the factor ‘end time’ to be fixed as this is part of the Service Level Agreements existing between collection and the sort department (see Section 3.3). For the factors: ‘Processing rate per employee’, ‘Total Amount of units’, ‘start time’ and ‘idle time’, we will discuss their contribution to the uncertainty in the needed workforce.

Matching workforce to workload at TNT business counters
37
Processing rate
per employee# units processed per
time per employee
Number of
EmployeesNeeded at a process
Total required
Processing Rate# units per time that
need to be processed
Processing TimeTime availible to
process the Mail
Total Amount of
units
Start TimeTime at which the
process can start
Idle TimeTime between start and
end time which is not
used for processing
End timeAt which the process
needs to be finished
Result
Possibly
Uncertain
Fixed
Figure 8: Factors of uncertainty
5.1.1 Uncertainty in start time
From interviews with collection region- and team managers we learn that the time at which the intake and preparation processes start, can fluctuate. To start these processes, mail, people and tools need to be available. We will discuss those factors in the following two sub sections.
5.1.1.1 Time at which mail is available
Fluctuations in the time at which mail is available for processing, can cause delay in the process start time. One might expect the mail to be available at a fixed time, due to the fixed time-windows in which mail is collected at customers. Unfortunately, in reality it is not always the case and mail can be delivered later than planned. The most common cause for delay is related to traffic congestion. Also more rare occurrences can cause delays; for example breakdown of a car, problems at a customer or a car being behind schedule due to the initial absence of a driver.
At all business counters team managers plan time between the first arriving cars and the start of the processes. This is done to generate a buffer of mail, which damps the impact of a car arriving later than planned. At most facilities this method is sufficient to deal with small delays. Still at some business counters, problems related to delayed arrival occur more frequent due to specific local circumstances.
Because the implementation of DPM-C at business counters includes restructuring of collection rides, these problems are being addressed for each business counter individually. New routes or even reallocation of customers to a different business counter to better fit the schedule, are possible actions which can be taken at each “problem situation”. As route restructuring will occur at all business counters, we assume in this thesis that this problem is addressed adequately at all current ‘problem’ situations. We thus assume in this research that mail is available at the planned time and does not contribute to any uncertainty.

E.K. Haspels; University of Twente
38
5.1.1.2 Time at which the required workforce and tools are available
The start time of the processes also depends on the presence of workforce and tools. Team managers indicate tools are only unavailable in very rare cases of severe process disruption, like for example computer failure at the intake process, or when tools are misplaced the previous day and have to be looked for. The availability of workforce depends on unexpected absence of employees (due to illness or an unknown reason) or “start-up” delays (due to employees discussing their weekend instead of starting the process).
Measuring the frequency of these kinds of fluctuations is difficult and would require much effort. Furthermore, DPM-C addresses these kinds of fluctuation by for example the introduction of a kick-off speech to make sure everybody starts on time, tighter descriptions of where to place tools to prevent the need to look for them, and the addition of a preparation shift to make sure all process tools are available before the start. As DPM-C addresses the availability of workforce and tools adequately we will not investigate this factor in this thesis.
In summary, based on our interviews we assume that DPM-C resolves the problems of fluctuation in the start time of the process, to a level where we can assume the start time to be constant. Measurement will therefore not be performed on start time fluctuations.
5.1.2 Uncertainty in the existence of idle time
The second factor which could cause uncertainty in the available processing time is the presence of idle time. Idle time refers to a time period between the start and finish of a process in which no mail is being processed. The existence of idle time thus lowers the available processing time between fixed start and end times, while the time needed to process the mail does not change. We distinguish two types of idle time.
The first type of idle time is time which is fixed in the collective labour agreement like coffee breaks or sanitary breaks (coffee breaks in minutes and sanitary breaks as a percentage of the total work time [47]). Although technically this is considered idle time, because no processing is done while employees are paid, it is fixed, planned for and thus not creating uncertainty.
The second type of idle time is not planned for. It occurs due to the unavailability of one of the required resources for the process. From interviews with team managers we learned that situations occur which result in this second type of idle time. Examples of rare occurrences causing idle time are computer failure or work floor accidents. More common was, before DPM-C, failure in internal transport. To exemplify such a situation: full roll containers ready to be processed were sometimes still located on the unload-dock, while the preparation process had to stop due to absence of input.
The standardized situation introduced with the DPM-C reorganisation has clear procedures on where to place each container, which should prevent these kinds of failure. As the existence of unpredictable idle time is, within the new DPM-C situation, rare and completely accidental by nature, we will not investigate the uncertainty resulting from these kinds of events.
Matching workforce to workload at TNT business counters
39
In summary, we assume in this thesis that DPM-C resolves the problem of idle time to a level where we can assume no idle time exists other that fixed idle time. Measurement will therefore not be performed on existence of uncertain idle time.
5.1.3 Uncertainty in the amount to be processed
The third factor of possible uncertainty we review, is the amount of mail to be processed. The quantity of mail is probably the most obvious factor of influence on the required amount of workforce. Intuitively more mail means a larger workforce is required while less mail would lead to a smaller required workforce. For this research we are thus interested in the presence of uncertainty in mail volume at business counters and if there are possibilities to reduce this uncertainty.
The mail volume fluctuates due to the fact that individual people or companies do, or do not, send mail on a specific day. And although it is virtually impossible to know all individual motivations to send mail on a particular day, one can try to find more general factors of influence to predict the fluctuations.
As we indicate in figure 8 we are interested in the fluctuation of mail volume to understand the required processing rate. Important to recognize is, that for some processes it does not hold that 1 additional piece of mail translates into extra work.
Example: as described in chapter 3, the intake process is concerned with registering the orders for invoicing. As an order can consist of different products, each product is written down on a different row. One additional piece of mail does not mean extra work when it is part of an existing order row on the form. But if this mail piece is from a different product group, it requires a new order row and thus increases the workload significantly. Differently, in the preparation process, the amount of work depends on the requirement for individual handling of mail pieces. Thus more mail means more work, but if mail pieces are more similar (supposed with “green mail”, see 3.2.2.4) the increase is not the same as in unarranged mail.
Hence, for each process the workload is driven by a different workload driver. The mail volume to be processed should thus be expressed in different units at different processes. The difficulty with determining workload drivers is that they are only useful if the driver can describe an underlying group which is uniform to some extent. For example, when one order row takes 5 minutes to process and another one takes 1 minute, measuring the amount of order rows leaves a difficult interpretation of performance
Example: Judging the performance of an employee may be difficult. For instance, if an employee finishes 12 order rows in an hour, did he or she do a good job (12 times an order row taking 5 minutes), or did he or she perform poorly (finishing all 12 in 12 minutes and then chat with a colleague for 48 minutes)?
To counter this effect one could determine a more precise workload driver: for example by making a division between “easy” and “hard” order rows. On the contrary, it might be difficult to measure beforehand if something is hard or easy and measuring might not be worth the extra effort, as the increased insight in process performance is limited.

E.K. Haspels; University of Twente
40
Within the collection processes at TNT business counters, drivers for each process step were determined in DPM-C. For the preparation process, the number of roll containers was determined to be an appropriate workload driver (grey and green). At the intake process ‘the number of order rows’ was determined as being the workload driver for this process. Unfortunately we learned from interviews and observations that these workload drivers yield some fundamental problems:
1. Diversity in underlying process 2. Difficulties in measurements
The first problem that occurs when using these drivers is caused by the diversity in the underlying processes. Especially in the preparation process, containers differ highly from each other. Again, measuring the number of containers makes interpretation of the results very difficult if 1 roll containers can contain mail which is processed in 10 minutes up to 1 hour. Thus measuring 5 containers could yield anything between 1 and 5 hours work.
As awareness of this difficulty was already present at the start of DPM-C, two types of roll containers were determined: green and grey (see 3.2.2.4). Green containers arrive from the intake process and are expected to contain mail which is easier to prepare, therefore having a different productivity norm. Unfortunately, we learned from interviews with change managers and observations that within the groups of green and grey containers much diversity remains. Although no thorough measurements within the context of this thesis have been done, we learned from our interviews that the example of 1 hour vs. 10 minutes is not unrealistic. A quantitative indication of this effect by measurements performed within an internal confidential research can be found in appendix 10.2. Although other effects might distort these figures to some extent, we observe that even cumulative over an evening large fluctuations in productivity exist (over 30% difference). Although we mention extremes in this example, and it is very unlikely that 5 of those extreme containers would be arriving on an evening at one business counter, it still leaves the interpretation between 5 or 6 roll containers to be difficult. Especially for smaller business counters where only a few roll containers are processed; the deviation can be significant. At larger facilities the significance of this effect should be smaller as a larger amount of containers or order rows should level out more the extreme values.
The second problem occurs due to problems with the measurement of these drivers. At the intake process, measuring the number of order rows seems fairly easy as these are registered in the invoice system. Still, due to the process of mirroring and checking (resulting in more order rows in the system), some abstruseness arose on the question which order rows should be included. At the preparation process a more fundamental flaw in measurements exists. As each roll container is filled with a different amount of mail, counting the number of containers is not sufficient. For each container it has to be registered with a scanner if the container is half-full, ¾ full or completely full. Letting two persons scan the same roll containers can result in significant difference in the registered amount of containers as one person interprets the fill rate differently as another person. This interpretation makes the measurement system less reliable and also vulnerable to deliberate distortion of the measurements. Much debate has occurred over this topic as it

Matching workforce to workload at TNT business counters
41
was observed by the DPM-C project team that difference in measurement led to unjustifiable scores on efficiency for business counters.
To counter these problems of measurement and underlying process diversity, we have participated in discussions on how to improve the drivers. Dividing mail into other groups turned out to be difficult and remains highly arbitrary. Measuring different drivers (for example the small bins exiting the preparation process or weighing the containers) have been discussed and each yields different advantages and disadvantages. Also options like measuring once a year for a short period of time or not measuring at all have been discussed. Valuing the advantage of possibly more accurate measurements against the increase of measurement costs and renewed process change has lead to the decision not to change the current measurement method for now. Thus for this research we use the existing drivers to express mail volumes for each process. We do want to stress that interpretation of the results, especially at small facilities, is more difficult due to the effects of these fundamental flaws.
In summary, analyzing the current uncertainty in mail volume could reveal causes for uncertainty in the required workforce. We will address this issue in 5.3 by quantitatively analysing the current fluctuation in mail volume drivers. We assume in this thesis that the currently used drivers represent the real amount of mail to a sufficient extent. In section 5.4 we will investigate measures to reduce the uncertainty in mail volume.
5.1.4 Uncertainty in the processing rate per employee
The fourth factor we distinguish in figure 8, as a possible cause for uncertainty in the workload, is the fluctuation in processing rate. The processing rate (or productivity) of employees is expressed in an amount of a specific workload driver per time unit [35]. And as we just discussed in section 5.1.3, the workload driver has in itself some difficulties. Moreover, measuring the productivity is very difficult as no system is registering the exact amount of hours worked at a specific process: internal shifting is not registered and therefore distorts the interpretation of hours registered in the Harmony system. Moreover, in Harmony not all hours are booked on the right process code as team managers are not very keen on accurately using the code system. Therefore we do not know how much time was spent at each process. Also, on days on which the process finishes early Harmony registers work time until the end of the shift as employees get paid until the end of their shift. But they do not process mail in the final part of this shift. Using this data would thus distort the productivity calculations.
Furthermore, unlike the theoretical situation in which each employee is similar, employees differ from each other. From interviews we learn that efficiency of employees can differ highly. A team manager said, when answering a question about why the efficiency rate was very high one day: “Oh, right, that was the day that mister X and mister Y both worked on the same day, they always work fast.” For the preparation process team managers also indicated that some employees can process a containers twice as fast as others just because of their dexterity.
To cope with these differences between people an objective norm time for the duration of processing 1 unit at each process step was created within DPM-C. Unfortunately interviews

E.K. Haspels; University of Twente
42
teach us that factors like the condition of the mail itself highly influence the achievable processing rate, complicating the interpretation of this norm. The motivation and experience of an employee play part in the achieved productivity as well, but separating these effects from the input effect is difficult at best. We are therefore cautious while interpreting measurement results on the productivity.
In section 5.3 we address the fluctuation in productivity. For the intake process we did quantify the fluctuations but stress that interpretation is not straightforward. For the preparation process the productivity is only qualitatively assessed.
5.1.5 Summary
We conclude that within our research scope the uncertainty in the amount of required employees only depends on the uncertainty in mail volume and the uncertainty in productivity of employees. In the upcoming sections we will investigate the uncertainty in these factors by determining how big the current fluctuations are and whether there are measures which can be taken to reduce their uncertainty.
5.2 Data to assess the current fluctuations
To analyze the fluctuations in volume and productivity quantitatively, we are in need of data. We indicated in 5.1.3 that to address the volume fluctuations at the intake and preparation process we need to know the amount of order rows and grey/green containers respectively. For the productivity we need to know the amount of order rows or containers processed per unit of time. In line with the focus of this research, we are interested in the productivity on a day-to-day basis at business counters, thus the fluctuation in productivity per day per business counter and not on employee level. We will next discuss which data sources we have used for this analysis and the results follow in 5.3.
5.2.1 BubaKassa
The database we use to extract order row data is the “BubaKassa” system. This application registers the orders, order rows and customer data for each order passing an intake counter. Because the numbers put into this system are used to invoice the customer, much effort is put into making this an accurate system. As discussed in 3.2 only trained employees have permission to work with the system and data put into this system is randomly selected for re-entry to check the performance on accuracy.
The data from this company specific system is transferred to a database in Groningen every week, creating a database containing all order data from 2006 until today. Due to backward order corrections which overwrite original data, this historic data has some disruptions. Also failure of the Bubakassa system sporadically leads to the situation where all orders of a day are re-entered the next day. In the database this leads to a day with almost no orders followed by a day with extremely high numbers of order rows. Although we need to compensate for these effects we consider the data source to be accurate.
Another effect present in the data is the closure of facilities. Some business counters have been closed in the last years and their mail has been redirected to another facility. As the

Matching workforce to workload at TNT business counters
43
closure of a business counter does not change anything for a customer (the facility remains a collection point) we therefore assume that customers will not change their collection location. With this assumption we can add the historic data of the closed location to the location it is redirected to.
Furthermore a radical change has taken place since the 1st of April 2009. As the Dutch postal market was liberalized on this day, no more “BTW” (tax) order rows have to be created from that day on. This has lead to a reduction of some 14 to 20 % of the registered order rows at business counters.
In summary we can say we have a data source with accurate data from the last 3.5 years on the number of order rows for each business counter, but it contains some effects we need to consider. To correct the dataset for errors caused by backward orders, system failure or holidays we exclude all values for a business counter that deviate more than 50% from the average (considered registration failures). The period between Christmas and New Years is excluded as well as this period differs a lot from the rest of the year in the mail business. Special teams to analyse the mail volumes in this period exist within TNT.
Besides the data on order rows, the BubaKassa system can also be used for the productivity calculations at the intake process. For the productivity we need to know how many hours of workforce were used to process the order rows per day. We already extracted the amount of order rows per day, so we only need the amount of hours it took to process them. As mentioned in section 5.1, we unfortunately cannot use the registration of work hours in Harmony. We therefore determine the total number of hours worked at the intake process by measuring the time between the first and the last order processed. As this only works in cases where no type two idle time is present we only investigate facilities where DPM-C has been implemented. This data was available from the first of January 2009 until the 31th march 2009. We retrieved the time between the first and the last order entered in the system as well as the total number of orders entered on all computers that evening. From this data we deduct the processing rate in section 5.3.
5.2.2 Count application
The second data source used to quantitatively analyse the fluctuations in mail volume and productivity is the count application. At each facility where DPM-C is introduced, a person is required to scan each container that arrives at the preparation process, checking if it is a full, ¾ full or ½ full container. The digital scanner loads this data to the count application database, resulting in an overview of how many containers have passed the preparation process on an evening at a specific business counter.
The scanning process is far from error free. We observe in the data that many evenings only a small part of the containers are scanned, especially just after introduction of the scan method at a facility. Moreover as discussed earlier the interpretation of what a full or half full container is leads to very different scan results. Deliberately scanning more containers might also have occurred since some employees know this data is used to calculate their own productivity. We were not able to verify the accuracy of the scan data by comparing the numbers with for example the number of containers registered to be loaded on the trucks (a system called Evra) as not all containers pass preparation and the fill rates differ highly as

E.K. Haspels; University of Twente
44
well. To gain some accuracy we only used the data of business counters from the first wave of implementations which leads to almost a year of registration data. The first 4 weeks of registration are also excluded as learning period. Furthermore, values which deviated more than 50% of the average amount are excluded, as it was confirmed with business counter change managers that these values would very likely be wrong measurements. The amount of data to be analysed is far less than the order row data.
Unfortunately there is no data source registering the number of people working at the intake process. The processing rate can therefore not be quantified at this process at each individual business counter. We discuss some qualitative information from our interview on this topic in section 5.3.
5.2.3 Work time study report
The last data source we use within our analysis is a work time study research preformed within TNT during the pilot of DPM-C. This study was used as a basis to determine the norms for productivity. The research consists of observations at 6 business counters for 2 or 3 days making a total of 13 observations. Although statistically this is not a large sample, we use the outcomes to compare them with our findings from our interviews to check consistency (section 5.3.5).
Now that we have discussed our data sources we will next present the actual analyse.
5.3 Current fluctuations
In this section we quantify the current fluctuation of the mail volume and productivity. As mentioned in Section 2.3 we focus in this thesis on the preparation and intake process and we will discuss the current mail volume and productivity fluctuations for these processes separately as they have different volume drivers.
The measure we use to express the spread of the variables is the coefficient of variation. The coefficient of variation is calculated by dividing the variables standard deviation by its average [5]; for more on this subject we refer to appendix 6.
5.3.1 Volume fluctuations at the intake process
Before we can determine the coefficient of variation of the amount of order rows at each of the 58 business counters we need to determine if trends or irregularities are present in the data. We achieve this by visually checking data plots and by examination of basic data set characteristics. To illustrate this process (which we performed for each business counter individually) we show the plot of the sum of all business counters in the area North West (figure 9).
As expected, a downward trend is observed in almost all plots. The downward trend is very small during the year while a more abrupt break occurs at the start of each year. This could be explained by the fact that most small businesses revise the way they send mail at the beginning of each year. Also a summer dip is observed every year, caused of course by the absence of many people and closure of businesses during the vacation period. Moreover,

Matching workforce to workload at TNT business counters
45
absence of data points can be seen during the period between Christmas and new years. This period is excluded for the explained reasons (see section 5.2.1). Other data points missing result from our discussed threshold to exclude extreme values. The many extreme fluctuations observed in 2006 are probably caused by backward bookings which stayed just below our threshold criterion. Because no indication was found for 2006 being indeed a year with more extremes than other years, we exclude all values before 1-1-2007 to prevent disruption of our analysis.
Figure 9: Plot of the sum of all order rows at business counters in area NW
To exemplify the fluctuations at a single business counter we show the plot of the number of order rows registered per day (in this case the period 3-3-2008/3-3-2009) for both a small (Zwaag, Figure 10) and large (Amsterdam Australiehavenweg, Figure 11) business counter. We observe that the fluctuations at the large business counter are relatively small and a weekday trend seems present.
Figure 10: Plot of the number of order rows at a small business counter
After visual inspection of the data we calculated for each business counter the coefficient of variation per year. We did this to minimize the impact of the trend on the coefficient of variation. We calculated the average of these three year coefficients of variation for each business counter to summarize the data. The average coefficient of variation thus indicates

E.K. Haspels; University of Twente
46
the spread or fluctuation of the daily amount of order rows. For the business counters in area North West we present this data in Table 3. The data for all other business counters can be found in appendix 11. We included in the table the average number of order rows just as an indication for the size of the facility.
Figure 11: Plot of the number of order rows at a large business counter
Area Location name Average # order rows
Average Coeff. of variation
Shapiro-Wilk-test
NW AMSTERDAM-Kabelweg 503 0,10 Yes
NW AMSTERDAM ZUIDOOST-Hoogoordd. 424 0,07
NW AMSTERDAM-Fred. Roeskestraat 252 0,07
NW AMSTERDAM-Australiehavenweg 1459 0,06 Yes
NW ALMERE-Transistorstraat - Gooise P. 394 0,06
NW HILVERSUM-1e Loswal 225 0,10
NW ZWAAG-De Oude Veiling 215 0,08
NW ALKMAAR-Hertog Aalbrechtweg 421 0,07 Yes
NW Heemskerk / BEVERWIJK 111 0,11 Yes
NW ZAANDAM-Mahoniehout 116 0,10 Yes
NW HAARLEM-Minckelersweg 306 0,09
NW AMSTELVEEN-Langs de Werf 219 0,08
NW HOOFDDORP-Parellaan 225 0,07
AREA TOTAAL 4960 0,05
Table 3: Volume fluctuation at the intake process at Business counters in Area NW
To analyze if the observed spread is to some extent following a pattern we examine its distribution. In figure 12 we present, again for a small and large business counter, an example of the histogram plots we made for each business counter. We observe directly the shape of a normal distribution. To visually check the assumption of a normal distribution we made Q-Q plots for each business counter (see figure 14 for two examples). These plots support the assumption of normal distribution, and this is what we could expect if we assume all customers to send their mail independently; as by the central limit theorem, the sum of a large number of independent random variables is distributed approximately normally.

Matching workforce to workload at TNT business counters
47
Figure 12: Number of order rows at two business counters in a Histogram plot
Figure 13: Number of order rows at two business counters in Q-Q plot
To further check this visual indication we performed on each business counters’ dataset the Shapiro-Wilk test for normality. We observed that not all datasets can be considered normally distributed according to the Shapiro-Wilk test (indicated in table 2), although they visually resemble highly to a normal distribution. This is mainly caused by a slightly increased kurtosis value found, indicating more than expected values in the tails of the distribution.
We conclude from this data that team managers working with the average amount of order rows as an indication for the amount expected tomorrow, will be on average at least 30 percent of the days (or about 2 days per week) off by more than 1 standard deviation. With the average coefficient of variation being 0.1 this comes down to being off by more than approximately 10% of the total amount of order rows in those situations. And on average in 5 percent of the evenings (but probably a bit more often due to the kurtosis), their expectation will be off by at least 20 percent.
Moreover, we can conclude that team managers who plan based on averages, have to cope equally often with too much or too little personnel. And we observe that at larger facilities the coefficients of variation are slightly lower.

E.K. Haspels; University of Twente
48
5.3.2 Volume fluctuations at the preparation process
As indicated in section 5.1 we only analyse the volume fluctuations at the preparation process for business counters which started registering roll containers during the first wave.
We analyse the data in the same manner as in section 5.3.1. We thus visually inspect the data by plotting the data in different graph formats and test for normality. For this data it holds that there is not enough data to indicate the presence of a long term trend. We do not clearly observe a summer dip, but most important is the absent data on many days due to the fact that extreme values are excluded. Figure 14 and 15 show as an example, the results for the grey roll containers at the business counter of Almere.
What we observe from the plots is that there is a larger fluctuation. This is expressed by a flatter histogram and higher coefficient of variation values. Still the approximation by a normal distribution seems reasonable.
Figure 14: Number of grey roll containers at preparation process at business counter
Figure 15: Number of roll containers in Q-Q plot
In table 3, an overview of the coefficient of variation for all business counters in wave 1 is given for both grey and green containers.

Matching workforce to workload at TNT business counters
49
Area Location name Average # containers
Grey
coeff. of variation
Average # containers
Green
coeff. of variation
NW ALMERE-Transistorstraat – GP 7,3 0,27 11,2 0,21
NW HOOFDDORP-Parellaan 5,6 0,22 8,3 0,23
W ALPHEN AAN DEN RIJN-Prinse 8,1 0,24 4,2 0,27
W 'S-GRAVENHAGE-Zonweg 24,2 0,18 30,1 0,19
ZW DORDRECHT-Cornelis Lelystr. 9,2 0,21 7,3 0,28
ZW BREDA-Slingerweg 21,3 0,19 27,4 0,21
C AMERSFOORT-Nijverheidsweg 13,1 0,20 30,1 0,19
ZO TILBURG-Ringbaan Noord 12,6 0,17 17,9 0,22
ZO HEERLEN-In de Cramer 9,4 0,18 11,8 0,23
NO HENGELO OV-Hassinkweg 5,6 0,19 7,5 0,20
NO LEEUWARDEN-Celsiusweg 14,1 0,19 13,7 0,23
Table 4: Volume fluctuation at the preparation process at Business counters in Area NW
We conclude from this data that the actual amount of arriving roll containers on an evening will on average differ more than 20% in at least 30 percent of the days. Team managers using the average as a prediction will thus have to deal with these differences. And again the under estimation and over estimation occur equally often.
5.3.3 Conclusions on volume fluctuations
We conclude with respect to volume fluctuations that the amount of workload driver fluctuates on a day to day level. The amount of order rows as well as the amount of containers seems to resemble a normal distribution. We furthermore conclude that the fluctuations at smaller business counters are relatively slightly larger and fluctuations at the preparation process are larger than at the intake process (average coefficient of variation of 0.1 and 0.2 respectively). For the amount of order rows we observe a slightly downward trend and clear summer dip. It is also important to realize that this data indicates that if team managers organize employees based on the average workload, they have to cope with either too many or too few employees present during an evening.
To put in perspective: if on an evening 10 percent less order rows arrive, employees at the intake process working a normal shift of 3 hours, should finish some 18 minutes earlier if all else stays the same. In case 10 percent more order rows than expected arrive, they will be asked to all work 18 minutes longer or an extra intake counter needs to be opened.
With these conclusions in mind we turn or focus to the current productivity fluctuations.
5.3.4 Productivity fluctuations at the intake process
To investigate the achieved productivity we need to know how many order rows are processed in a certain amount of time. As indicated before we had data from the first of January 2009 until the 31 of March 2009 of all business counters but we only investigated the business counters which already implemented DPM-C.
We retrieved from the intake computers the time of the first and last registered order and the total amount of order rows registered between those two times for each day during this period. We divided the number of order rows by the number of hours between the first and

E.K. Haspels; University of Twente
50
the last registration, giving us the average processing rate per day per intake computer. We then took the average over all active intake computers on a business counter for each day to get the per day productivity of each business counter. As an example we show the productivity at the intake process at the business counter of Almere in figure 18.
Figure 16: Productivity at intake process at average business counter
We present the data of all investigated business counters in table 4.
Area Location name Average
order rows Average
productivity Coefficient of
variation NW ALMERE-Transistorstraat – GP 368 35,5 0,11
NW HOOFDDORP-Parellaan 194 34,8 0,10
W ALPHEN AAN DEN RIJN-Prinses M 139 28,1 0,19
W 'S-GRAVENHAGE-Zonweg 634 40,4 0,17
ZW DORDRECHT-Cornelis Lelystraat 188 38,4 0,13
ZW BREDA-Slingerweg 529 31,3 0,12
C AMERSFOORT-Nijverheidsweg- 468 46,5 0,28
ZO TILBURG-Ringbaan Noord 434 42,5 0,14
ZO HEERLEN-In de Cramer 241 37,7 0,19
NO HENGELO OV-Hassinkweg 165 20,6 0,16
NO LEEUWARDEN-Celsiusweg 444 26,7 0,09
Table 5: productivity at intake process
The data shows the productivity is in most cases higher at larger facilities. It also indicates that the productivity fluctuates, meaning that the number of order rows registered per hour differs from day to day. The coefficient of variation shows this difference can be quite large.
Higher productivity on busy days is expected by team managers as they indicate employees “work harder” if more mail is in the buffer. But this is difficult detect in the data. We do not know which days were busy because many order rows does not imply a busy day, e.g. if more employees were present that day.
Moreover, the lower productivity at Hengelo was not in accordance with expectations of the experts, indicating other effects (like switching between intake computers) might be the cause for this extreme low value.

Matching workforce to workload at TNT business counters
51
5.3.5 Productivity fluctuations at the preparation process
As indicated before, we do not have data sources to quantitatively analyse the fluctuations in productivity at the preparation process at all business counters. The only data we have for this productivity is a time study performed internally by TNT. This time study shows that the rate at which mail is processed at the preparation process easily varies more than 30 percent between consecutive days. Day averages going as low as 20 minutes per roll container and as high as 55 minutes per roll container where observed. Team managers we interviewed agreed that the processing rate can vary significantly. They indicate that difference in input highly influences this fluctuation. This effect is dampened within larger facilities as larger amounts of containers regularly flatten out the extreme containers.
5.3.6 Conclusions on productivity fluctuations
Measuring productivity is difficult as many factors influence this process. We can conclude that at both processes the productivity fluctuates, especially at the preparation process the fluctuations can be large. We learned from interviews and observations that the productivity is influenced by the amount of mail in the buffer. If a lot of work has to be done, the productivity goes up. This is an interesting effect as it counters the fluctuations in the mail volume, but it has its limits.
With the current fluctuations in volume and productivity analysed we can focus on methods to reduce the uncertainty of these fluctuations. The next section will discuss for both the mail volume and productivity, proactive and reactive measures that could be taken to reduce the overall uncertainty in workload.
5.4 Reduction of uncertainty
We determined in section 5.3 that the mail volume and productivity fluctuate. In chapter 4 we discussed that dealing with uncertainty is at the heart of matching workforce to workload. In this section we will thus discuss which ways there are to reduce the mail volume- and productivity uncertainty. For proactive reduction of the mail volume uncertainty we focus on forecasting, as this is of special interest to management because it is suggested in DPM-C documentation as needed to be developed.
5.4.1 Proactive Reduction of volume uncertainty by forecasting
To forecast one can either use drivers to apply regression or use historic data in time series (see appendix 5). Literature exists on forecasting mail volumes [14; 22; 48]. Unfortunately this literature is focussed mainly on long range forecasts on national or international level. Drivers discussed in such articles are for example GDP, demographic changes, price development, etc. (see appendix 7). These drivers are not measurable on individual business counter level. As we do not have drivers on local day-to-day level, we focus on time series analysis for historical data.
Time series analysis aims at finding trends or correlations in historical data and uses those underlying effects to forecast into the future. We thus start by investigating the existence of correlations. Many correlations may exist. To confine ourselves to a manageable amount of

E.K. Haspels; University of Twente
52
work we interviewed team managers to indicate possible correlations. From these interviews we learn that correlations between consecutive days and consecutive weekdays may exist. Also first and last day of the month correlations were mentioned but as we did not find obvious correlation and the large effect of weekday difference influenced our analysis we did not go into detail on this subject.
We express the correlation between two variables with the correlation coefficient. For more background on this subject we refer to appendix 6. To investigate the correlations we use the same data source as in the previous section. We exclude data pairwise, so if one observation point is missing two correlation points will be excluded. We also took out the data from the 1st of July until the 31st of August to prevent the summer dip from increasing the correlation coefficient.
A positive correlation between consecutive days suggests that a “busy” day today increases the chance of a busy day tomorrow. A negative correlation suggests that a busy day today would increase the chance of a quiet day tomorrow. For consecutive weekdays a positive correlation suggests a busy Monday this week would increase the chance of a busy Monday next week. To visually check the correlations we produced scatter plots for both consecutive days and consecutive weekdays for each business counter (see figure 16 for an example). If a pattern along the line x=y would appear, a positive correlation is present. A pattern parallel to x= -y would indicate a negative correlation.
5.4.1.1 Correlations in the order rows at the intake process
Because the average amount of order rows registered on for example a Monday differs from the average amount registered on a Tuesday we need to normalize all data for the “consecutive day correlation”. We do so by dividing all days by their weekday average. With the normalized values we are checking the correlation between two consecutive days in the sense that if they are positively correlated we determined that for example a Monday which is busy in comparison to other Mondays, is often followed by a busy Tuesday in comparison to other Tuesdays.
The correlation coefficients in table 6 show what correlation coefficients were found.
For the consecutive day correlation we observe that the order rows are slightly positive correlated at all business counters. This is to be expected with the slight trend present in the data. Unfortunately no strong correlation is present.
For the weekday correlations we present an average over all weekdays as this reduces the amount of data to be presented in the table. This average was calculated by averaging the absolute correlations over all weekdays (Monday-Friday), as they can be positive or negative. Thus the value indicated in table 6 does not indicate if the correlation is positive or negative, just the average magnitude. We did check the individual weekday correlations for all business counters to see if some individual weekdays were highly correlated. Although at some business counters high correlations were observed in individual year, this was never constant over each year (except in eight single weekdays at different business counters, see appendix 11) and mainly caused by a smaller amount of data points in a year due to extreme values or a specific period of the year in which mail was partly send to another location.

Matching workforce to workload at TNT business counters
53
The slightly higher positive correlation between consecutive weekdays than consecutive days can be explained by the fact that much less observed values per year are used for these calculations and with the same year trend this is thus expected to be of more influence in this data.
Figure 17: Correlation plot of mail volume at intake process at BC Almere 2008
Area Location name Correlation coefficient
Day, Day +1
Average Correlation coefficient
Weekday, weekday+1 NW AMSTERDAM-Kabelweg 0,23 0,30
NW AMSTERDAM ZUIDOOST-Hoogoordd. 0,07 0,21
NW AMSTERDAM-Fred. Roeskestraat 0,26 0,25
NW AMSTERDAM-Australiehavenweg 0,06 0,18
NW ALMERE-Transistorstraat - Gooise P. 0,15 0,29
NW HILVERSUM-1e Loswal 0,11 0,16
NW ZWAAG-De Oude Veiling 0,11 0,16
NW ALKMAAR-Hertog Aalbrechtweg 0,17 0,19
NW Heemskerk / BEVERWIJK 0,08 0,14
NW ZAANDAM-Mahoniehout 0,05 0,26
NW HAARLEM-Minckelersweg 0,13 0,23
NW AMSTELVEEN-Langs de Werf 0,07 0,20
NW HOOFDDORP-Parellaan 0,14 0,16
Table 6: Correlation coefficient of mail volume at intake process
With the correlation coefficient presented in Table 6 we conclude there is no significant correlation for both consecutive days and consecutive weekdays at business counters. Therefore we do not expect a more accurate prediction model can be built based on this information than the current model that is developed (a moving average for each individual weekday).
5.4.1.2 Correlations in mail volume at the preparation process
We performed the same analysis as for the intake process on both the green and grey roll containers for facilities of the first DPM-C wave.
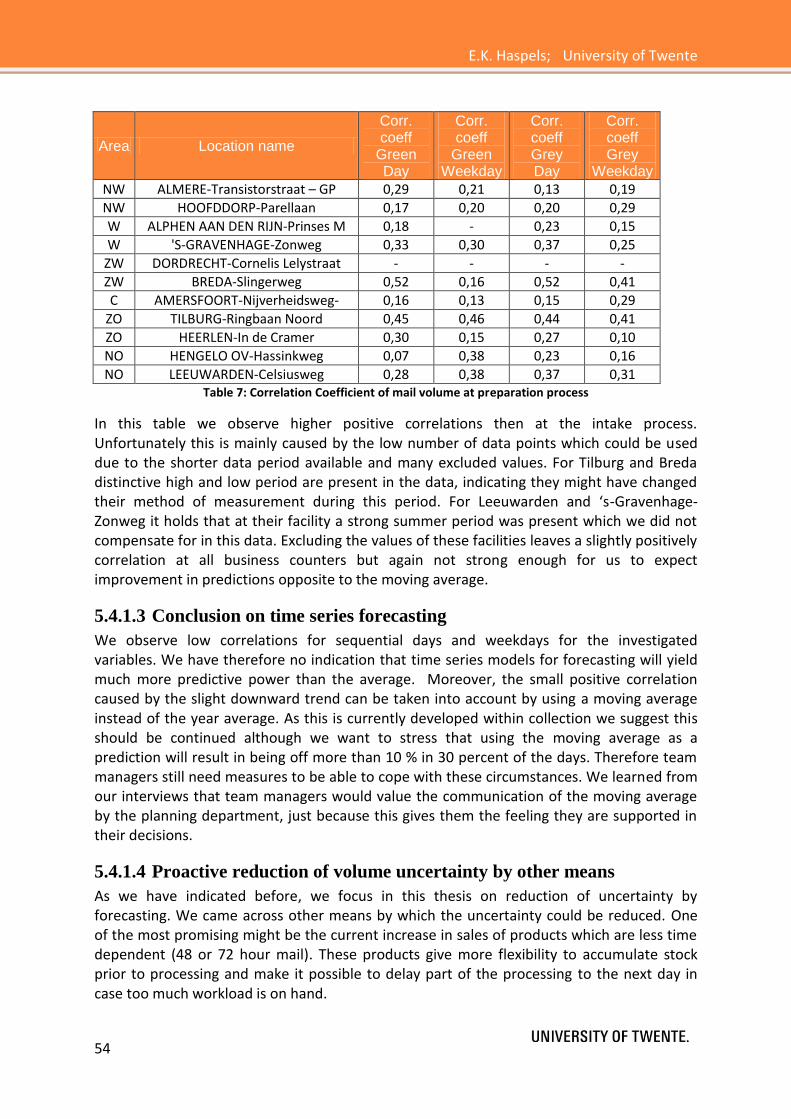
E.K. Haspels; University of Twente
54
Area Location name
Corr. coeff
Green Day
Corr. coeff
Green Weekday
Corr. coeff Grey Day
Corr. coeff Grey
Weekday
NW ALMERE-Transistorstraat – GP 0,29 0,21 0,13 0,19
NW HOOFDDORP-Parellaan 0,17 0,20 0,20 0,29
W ALPHEN AAN DEN RIJN-Prinses M 0,18 - 0,23 0,15
W 'S-GRAVENHAGE-Zonweg 0,33 0,30 0,37 0,25
ZW DORDRECHT-Cornelis Lelystraat - - - -
ZW BREDA-Slingerweg 0,52 0,16 0,52 0,41
C AMERSFOORT-Nijverheidsweg- 0,16 0,13 0,15 0,29
ZO TILBURG-Ringbaan Noord 0,45 0,46 0,44 0,41
ZO HEERLEN-In de Cramer 0,30 0,15 0,27 0,10
NO HENGELO OV-Hassinkweg 0,07 0,38 0,23 0,16
NO LEEUWARDEN-Celsiusweg 0,28 0,38 0,37 0,31 Table 7: Correlation Coefficient of mail volume at preparation process
In this table we observe higher positive correlations then at the intake process. Unfortunately this is mainly caused by the low number of data points which could be used due to the shorter data period available and many excluded values. For Tilburg and Breda distinctive high and low period are present in the data, indicating they might have changed their method of measurement during this period. For Leeuwarden and ‘s-Gravenhage-Zonweg it holds that at their facility a strong summer period was present which we did not compensate for in this data. Excluding the values of these facilities leaves a slightly positively correlation at all business counters but again not strong enough for us to expect improvement in predictions opposite to the moving average.
5.4.1.3 Conclusion on time series forecasting
We observe low correlations for sequential days and weekdays for the investigated variables. We have therefore no indication that time series models for forecasting will yield much more predictive power than the average. Moreover, the small positive correlation caused by the slight downward trend can be taken into account by using a moving average instead of the year average. As this is currently developed within collection we suggest this should be continued although we want to stress that using the moving average as a prediction will result in being off more than 10 % in 30 percent of the days. Therefore team managers still need measures to be able to cope with these circumstances. We learned from our interviews that team managers would value the communication of the moving average by the planning department, just because this gives them the feeling they are supported in their decisions.
5.4.1.4 Proactive reduction of volume uncertainty by other means
As we have indicated before, we focus in this thesis on reduction of uncertainty by forecasting. We came across other means by which the uncertainty could be reduced. One of the most promising might be the current increase in sales of products which are less time dependent (48 or 72 hour mail). These products give more flexibility to accumulate stock prior to processing and make it possible to delay part of the processing to the next day in case too much workload is on hand.

Matching workforce to workload at TNT business counters
55
Also the current process of merging business counters to create larger facilities reduces the volume uncertainty to some degree. As we observe in our data, larger facilities or the sum of all facilities in an area, experience less fluctuation.
Finally standardization of the products, selling mail capacity rather than accepting all mail or variation of prices based on system workload (by for example carrying out promotions during the summer period) could reduce the fluctuation of mail volume as well.
Although we see the large benefits these measures could have on the reduction of uncertainty and therefore the improvement of workforce scheduling, these are strategic decisions and fall outside the scope of this research. We will address these issues briefly in our recommendations, found in chapter 7.
5.4.2 Reactive reduction of volume uncertainty
The reactive reduction of volume uncertainty is somewhat strange because the unexpected volume has already occurred when these measures can be taken. It is therefore a more theoretical way of saying that when too much mail has arrived a part of the mail will not be handled that evening (therefore reducing the uncertainty). Order acceptance is not done at TNT business counters thus all orders from small customers are always accepted. Reactive reduction of volume uncertainty is thus always occurring when the due date which is promised to be fixed is violated. This effects quality and customer experience highly as the mail has already been collected and promised to be delivered within 24 hours. Reactive reduction of volume uncertainty is therefore not desirable.
5.4.3 Conclusions on reduction of volume uncertainty
We can conclude that the uncertainty in mail volume is difficult to reduce on operational level. Time series analysis do not indicate predictions based on the volume of yesterday or the weeks before hold more predictive value then the average (except during the predictable summer dip and holidays, and only if the downward trend is taken into account with the average). Local knowledge on unique events is valuable to increase the accuracy of volume predictions. Other means to reduce the volume uncertainty are mainly strategic in nature and fall outside the scope of this research but might yield interesting improvements.
5.4.4 Proactive reduction of productivity uncertainty
We determined in section 5.3 that the productivity at both the intake and preparation process is difficult to measure but certainly fluctuates. In the following two sections we will discuss which measures on operational level, can be taken to reduce the uncertain fluctuation in the productivity.
To reduce the uncertainty of productivity team managers can either try to reduce the uncertainty in mail input, the fluctuation in employee motivation or the difference in employee capability. There are a multitude of measures within these fields which team managers can take. As we cannot indicate the severity of the factors and we do not know if other factors are involved we therefore sum up measures mentioned by team managers as being of interest.

E.K. Haspels; University of Twente
56
First of all, team managers indicated during interviews that more equal input would strongly positively influence the reduction of uncertainty. Unfortunately, standardization of the products, like for example offering less different products or obligating customers to use label writers (to avoid bad handwriting) are of course strategic decisions. On operational level, measures to reduce the input uncertainty can be aimed at better instructions of the drivers. At this moment drivers are obliged to separate the mail into different containers on arrival at the business counter. If this is done incorrectly, it has to be corrected later on in the process causing extra work. Team managers also control separation better can prevent this higher diversity in input at the intake and preparation process.
Measures within the second category aim at reducing the effect of motivation. The effect of motivation should not be underestimated. If a team manager creates a stable atmosphere in which employees are motivated to work and are eager to finish the process in time, less productivity fluctuations are expected. If on the other hand, employees are discontent and unwillingness is present in the group, it is more likely that employees will reduce their pace if no supervision is around resulting in highly fluctuating processing rates. How a team manager can create such an atmosphere to motivate their employees depends on many factors and is complex. One of the factors in achieving such a situation is the importance of commitment and appropriate management style, as discussed in chapter 4.3.4 and following from interviews with team managers (see section 6.3). But more specific research on this topic is required and a detailed plan on how to accomplish this is outside the scope of this research.
Proactive measures to reduce the difference in employee capability can help to reduce the uncertainty in productivity. Although we have to accept that people will always differ from each other and that therefore getting equal productivity is unreachable. Still by exchanging knowledge on effective working practices, increased training for those who need to improve their skills and better assessment of capabilities of new employees can help to level out productivity. For proactive measures to reduce productivity uncertainty we can conclude that most measures are at tactical or strategic level. On operational level, better instruction for the drivers to prevent uncertain input and better motivation to prevent fluctuating productivity are mentioned by team managers to be of importance. Differences in input and motivation can highly affect productivity but are hard to measure.
5.4.5 Reactive reduction of productivity uncertainty
During the process the productivity fluctuates, and team managers would like to react quickly to prevent these fluctuations. Within DPM-C it was realised that the most important step in achieving this was to make the fluctuations detectable while they are happening. Thus at the preparation process, a team board was introduced on which is written down every 15 minutes how many roll containers have been processed. Team managers working with this team board indicated they received reactions between the two extremes of: “You make me feel like a computer now that we have to achieve a number each 15 minutes” and “it is fun to try to get the exact amount each time”. Overall team managers indicated employees react positive to the productivity feedback and get motivated to perform better if scores are high and feel like being complimented if scores are high.

Matching workforce to workload at TNT business counters
57
Also an increased presence of team managers on the work floor, as is being stimulated during DPM-C, stabilizes the productivity. Less “dips” in productivity due to non related activities (excessive chit-chat, more smoke breaks than allowed, etc.) occur because of the presence of the team manager.
Finally the “plan-do-check-act” principle, which team managers are trained in during DPM-C, helps to reduce the fluctuations in productivity. Team managers plan with a certain productivity during the evening to finish on time. While work is ongoing the productivity is checked every 15 minutes on the team board. If the productivity is low, a team manager is stimulated to investigate the cause and react to it to prevent it from happening again.
Example: if productivity is low at the intake process and the team manager finds out it is caused by poorly separated mail by the order splitters, he or she can react to this information by addressing the issue with the splitters. This will reduce the input fluctuation and solve the problem, resulting in less fluctuating productivity.
5.4.6 Conclusions on reduction of productivity uncertainty
We conclude that fluctuations in productivity can have a multitude of causes. Uncertainty in input, uncertainty in motivation and difference in capabilities of employees have been discussed. Measures to reduce these uncertainties are vast but complex to assess on effectively as they are difficult to quantify, highly interconnected and influenced by local circumstances.
Team managers have indicated during interviews that they view “equalizing input by better instruction of drivers” and “creating an atmosphere of commitment and trust” as operational proactive measures to prevent the productivity from fluctuating highly. Reactive measures which they indicate as being effective are the direct feedback of the achieved productivity and increase of team manager presence on the work floor. Team managers indicated that productivity is also influenced by the amount of work in the buffer. If more work has to be done, employees are “stepping up” the pace of work. If less work has to be done the productivity goes down accordingly. Although productivity fluctuates due to this effect, it dampens the need to increase or decrease the amount of employees in accordance with fluctuations in the mail volume. Hence the productivity fluctuation can help to some extend although the right balance has to be found.
On strategic and tactical level measures to equalize input and improve training to equalize capabilities also can support the reduction of productivity uncertainty but fall outside the scope of this research.
A final remark on the subject of productivity fluctuation is that During this research we looked at the fluctuations within the amount of order rows and containers at the different processes. Although we observed fluctuations and researched ways to reduce and cope with them, it is important to note that the fluctuations are considered fairly small by some. We have talked to employees working at the planning department for the sorting process, the delivery process and with people working outside TNT. Many indicate that coefficients of variation of 0,1 or 0,2 are common in industry or even considered low. Our assumptions on

E.K. Haspels; University of Twente
58
mail being available on time and the absence of process failures are in reality not achievable and therefore coefficients of variation of 0,1 and 0,2 can be considered very stable.
Chapter summary:
We conclude in this chapter it is difficult to determine beforehand how much workforce is required on a specific evening. Uncertainty in amount of work and productivity is significant and difficult to reduce. Team managers therefore need workforce flexibility to adjust the workforce to the fluctuating workload and achieve their targets.

Matching workforce to workload at TNT business counters
59
6. Increasing workforce flexibility
As we discussed in the previous chapter, measures on operational level to reduce the workload uncertainty at TNT business counters are difficult to find. This leaves coping with the existing uncertainty, both proactive and reactive, to be even more important (see section 4.3).
In this chapter we address the application of measures to cope with the workload uncertainty. As the focus of this thesis is on operational level, we address short term workforce flexibility measures. In section 6.1 we discuss how the measures could contribute in the day-to-day matching process. Next in section 6.2 we present which proactive measures to increase workforce flexibility are used within TNT. Moreover in 6.3 we present the reactive measures which are applied by different team managers. Section 6.4 discusses some advantages and disadvantages of applying the different methods and to conclude we discuss briefly in section 6.5 some outlooks for implementation, though as stated in 2.4, an implementation plan is not part of this research.
6.1 Workforce flexibility
As discussed in chapter 4, flexibility is the ability to adjust to a changed situation. Capacity flexibility is concerned with both the range to which it can adjust and the ease of adjustment (range and response flexibility). In chapter 5 we concluded that the workload fluctuates within a range at each business counter and that there is almost equally often an over and under capacity if an average amount of employees is present at the work floor. This means that when we are looking for temporarily adjustments in the number of employees at a process, we need to look for measures which increase and measure which decrease the number of employees.
To put the different measures we are going to discuss in perspective we want to emphasise that when we talk about decreasing or increasing the number of employees we do not mean hiring or firing employees as we only discuss temporarily measures. Moreover, the range flexibility we are addressing is mostly in the order of “leaving 15-30 minutes earlier”, “staying 15 minutes longer” or “Asking one of the 5 employees to take a day off”. The response flexibility, the speed and cost of adjustment is more often the bottleneck, as we are addressing some measures which need to be deployed during the process leaving a very short time within which it needs to be effected. Furthermore, coping with uncertainty is always concerned with creating flexibility against some cost. These costs can either be direct, like having an extra employee in case it gets busy or indirect for example employee dissatisfaction due to task switching. As many indirect costs are extremely difficult to measure but very important the decision process depends to some extent on management talent to assess these factors.
In figure 20 we visualize the management problem (although we compensated for structural day differences to make the figure easier to interpret). For a specific day of the month we have shown it is not possible to adjust the amount of employees in advance to the expected
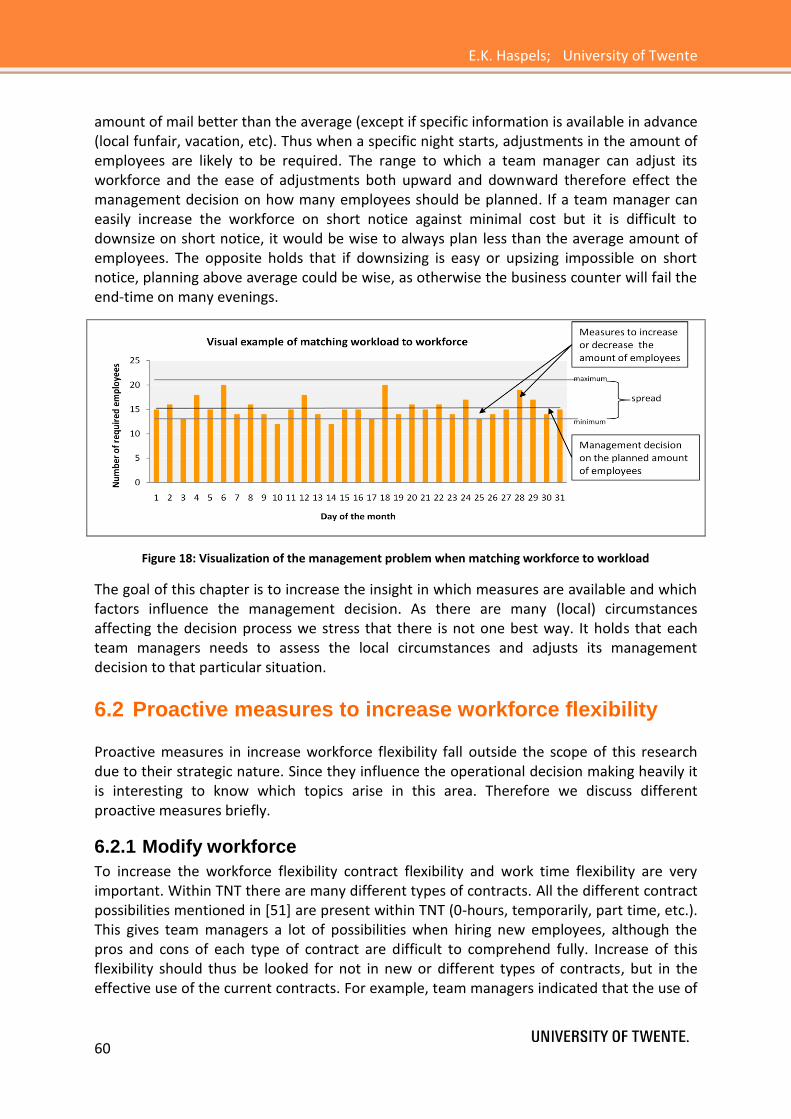
E.K. Haspels; University of Twente
60
amount of mail better than the average (except if specific information is available in advance (local funfair, vacation, etc). Thus when a specific night starts, adjustments in the amount of employees are likely to be required. The range to which a team manager can adjust its workforce and the ease of adjustments both upward and downward therefore effect the management decision on how many employees should be planned. If a team manager can easily increase the workforce on short notice against minimal cost but it is difficult to downsize on short notice, it would be wise to always plan less than the average amount of employees. The opposite holds that if downsizing is easy or upsizing impossible on short notice, planning above average could be wise, as otherwise the business counter will fail the end-time on many evenings.
Figure 18: Visualization of the management problem when matching workforce to workload
The goal of this chapter is to increase the insight in which measures are available and which factors influence the management decision. As there are many (local) circumstances affecting the decision process we stress that there is not one best way. It holds that each team managers needs to assess the local circumstances and adjusts its management decision to that particular situation.
6.2 Proactive measures to increase workforce flexibility
Proactive measures in increase workforce flexibility fall outside the scope of this research due to their strategic nature. Since they influence the operational decision making heavily it is interesting to know which topics arise in this area. Therefore we discuss different proactive measures briefly.
6.2.1 Modify workforce
To increase the workforce flexibility contract flexibility and work time flexibility are very important. Within TNT there are many different types of contracts. All the different contract possibilities mentioned in [51] are present within TNT (0-hours, temporarily, part time, etc.). This gives team managers a lot of possibilities when hiring new employees, although the pros and cons of each type of contract are difficult to comprehend fully. Increase of this flexibility should thus be looked for not in new or different types of contracts, but in the effective use of the current contracts. For example, team managers indicated that the use of

Matching workforce to workload at TNT business counters
61
many small contracts (for example 3 days a week) makes it possible to switch shifts much easier. Most people with small contracts are interested in working more hours but it has to be said that working more hours structurally has legal implications. Adjustment of existing contracts is of course difficult as in the Netherlands legal protection for employees on this subject is high and the union within TNT has a very strong position.
Educating employees to be able to work at different processes is essential to make reactive task switching possible. Unfortunately, research suggests that there is not a simple trade-off between numerical and functional flexibility [11]. The cost of educating employees for different tasks is directly visible but the gain of more flexibility in switching employees is difficult to quantify. From the interview we learned most well performing team managers switch between the intake and preparation process or between the intake and special services mail often. It remains a difficult management decision on how many flexible employees are required and economically desirable.
During the DPM-C implementation the new work times which are established should take into account that the preparation process starts later than the intake process and the intake process finished earlier than the preparation process. If employees at the business counter start more in a step by step way, the contracts resemble more closely the real process. With a step wise ending of the process some slack is created making it easier to work in overtime without violating the Service Level Agreements. It has to be said that stepwise starting and finishing can have negative effects on the “team spirit”.
Proactive measures to increase workforce flexibility are mainly structural adjustments of strategic nature. In this section we briefly mentioned some possible measures but effectiveness and practicality should be investigated further in other research. We will come back to this in the recommendations in chapter 7.
6.3 Reactive measures to increase workload flexibility
We will discuss measures we have uncovered during interviews within each category.
6.3.1 Modify workforce
The first thing a team manager can do in a changed situation is modifying the available resources. All team managers we interviewed used on a regular basis the following measures to increase their workforce:
Ask employees to work overtime – often employees are asked to work after their shift has finished. The way this is registered differs per location. Some add all overtime into Harmony (as low as 10 minutes) others have an unspoken rule that for the days that they work some extra, there are also days where they can leave earlier and no registration is done. If registration is done correctly, the team managers need to make sure the extra hours rising in the “hour bank” are also sometimes lowered by taking leave.
Add a shift – depending on the facilities situation and time at which the need for an extra shift arises drivers are asked to work at the preparation process or employees

E.K. Haspels; University of Twente
62
or temporarily employees are called and asked to work that very moment. A list of employees willing to work extra shifts and having employees living close to the facility are conditions making the application of this measure easier.
Hire temporary employees - in case of (long) illness or longer leave of regular employees temporary employees can be hired. TNT has contracted agencies through which this can be arranged.
Borrow employee from other facilities – If too few people are available and by contact with other team managers it becomes clear that other facilities have employees to spare, employees can be asked to work on a different location. Especially if it is decided during the evening, travel times have to be taken into account as they have to be paid as regular working hours.
Shift employees horizontal between functions – on of the most often mentioned measures used by team managers is switching between processes. No (strong) correlation between the amounts of workload at the different processes was present in the data. Hence, shifting can dampen the fluctuation by taking people from a quiet process (if existing) and employ them at the busy process. Important was that team managers mentioned that if this measure is applied, switching more often will make people get used to both processes but working too much at the preparation process as an intake employee is both expensive (as intake employees get paid higher wages) and is considered undesirable by the intake employees. Also it has to be taken into account that switching employees from preparation to intake is most of the time not possible because one needs the proper training to work at the intake process.
Shift employees vertical between functions – This situation occurs when a team manager decides to help during the process if workload is higher than expected and the end time might not be achieved. Not all team managers applied this measure as it can create difficulties in hierarchy.
To decrease their workforce team managers suggested:
Ask employees to take leave for (part of) their shift – Most well performing team managers mentioned that if they had too many employees at the work floor due to lower than expected workload, they always ask for volunteers to take leave for the last part of their shift. This is a very effective measure if applicable but is completely dependent on the willingness to cooperate by the employees. Employees cannot be forces to take leave for part of their shift.
Switch employees to non workload related tasks – Although applied to different extend by team managers, all apply switching employees to non workload related activities in times of low workload. In most cases this is just to the level of some minor tidying or cleaning tasks. In some cases the obligatory functioning talk and craftsmanship test are announced to be sometime during the upcoming month, and are effectuated on an evening with low workload. This requires preparation and the willingness to let people in ignorance about the specific day on which the test or talk will occur (possibly to the discontent of the employee).
Lend employees to other facilities – when over capacity of employees occurs one might try to lend employees to nearby facilities who are in need of employees.

Matching workforce to workload at TNT business counters
63
Send home temporary employees – some contracts allow for team managers to send people home after a minimal duration of the shift (mostly 2 hours)
Horizontal function shift - in the same way as described before, the switching of employees between processes can dampen the over capacity.
With these different reactive measures to adjust the amount of resources we will now discuss the workforce flexibility achievable by adjusting the use of resources.
6.3.2 Improve the use of workforce
Instead of increasing or decreasing the physical presence of employees team managers can also adjust the efficiency of the employees. To increase the workload that can be handled team managers can stimulate their employees to work “faster” and to decrease the workload which can be handled they can allow the employees to work “slower”. Of course allowing people to work slower decreases the efficiency rate, something which is the task of a team manager to prevent! Moreover, pushing people to work faster than the norm in case of a busy day is not in line with the CLA and can affect the employees’ willingness to cooperate. Still everyone can understand some leverage is present in this area. Team managers indicated during the interviews asking to “step it up” during a busy evening and loosening the pressure on a quiet evening is all in the balancing game of a team manager to get the most out of a team. They all pointed out this is probably the most effective measure they all used. There is not objective way to determine an optimal way in balancing how far one can stretch or how much loosening is needed to balance with acceptable boundaries. It is here were management skills of judging how far you can go and judging how you can keep the team spirit and cooperation high, comes to play.
Introduction of the plan-do-check-act cycle at business counters has led to stiffer control on real time productivity. During the process, the productivity is measured and shown on a process board. If productivity is lower than what was planned for (norm), employees and team managers are directly aware and can react to the situation.
6.3.3 Modify the product, Modify demand or not satisfy demand
Although mentioned to some extend in chapter 5 we will briefly discuss how a team manager can act on an evening with regard to modification of the product or demand. This is part of the tool pack from which a team manager has to choose measures to cope with the uncertainty.
It might seem strange to modify the product you have agreed on to deliver in case a change in required capacity occurs. It followed from our interviews that this is seldom put to practice. Still it remains an option for team managers to do so. To exemplify this situation at the preparation process: in case there is more work than can be dealt with by other means, team managers might consider sending unprepared mail to the sorting centre. Here the problem is handed over to the sorting centre, hoping they have the capacity to deal with it (using the “SOSMA” machine), thus making the recipient do part of the work. Of course this should only be done in close dialogue with the receiver as this is not solving a problem but shifting it to another location. One could agree this is not capacity flexibility but routing flexibility because excess mail is brought to a different location. At the intake process a

E.K. Haspels; University of Twente
64
similar “emergency” procedure can be applied. In that case products are only weighed and invoicing is done the next day. As in this situation no mirroring or full check (see 3.4.1) can be done the next day, this is highly undesirable and reduces the quality of work.
Although we did not come across any situation where the product was modified during a day with lower workload than expected, we can think of a theoretical situation where the surplus capacity is used to do part of the work normally done at the sorting centre. The first sort stage, sorting mail by area, could be done by hand at a business counter. But as this might create problems with transport it seems logical other ways to deal with surplus capacity are highly favourable.
The last way to adjust in a reactive way to an unexpected workload is to adjust or not satisfy demand. Within TNT this is revered to as “drowning” (Dutch: “verzuipen”). Although this happens more often at the sorting centres, at business counters this is most of the time not accepted. If it occurs that not enough workforce capacity is available, working overtime is used to finish the mail late, but still that evening. It is very rare that mail is left to be processed the next day. The fact that collection is the starting point of the process creates psychological pressure not to fail the first step. Most team managers have a very strong drive to never leave “their” mail unprocessed. Moreover, legal implications for TNT if a certain percentage of mail is not delivered within 24 hours also effects the drive to always finish mail on an evening. The management decision to leave mail unprepared until the next day due to high costs of processing in overtime is at best only rarely considered.
We have discussed all measures applied at TNT. In the next section we will discuss which conditions are required to apply the measures.
6.4 Required conditions
To apply the different reactive measure to cope with unexpected workload on a day-to-day level some conditions need to be met. Although they are not adjustable on a day-to-day level we still discuss them here as they are important for the applicability of measures.
6.4.1 Contractual leeway
First of all, enough (legal) leeway within the contracts should be available to deploy different reactive measures. This was acknowledged at the beginning of DPM-C, and therefore all contracts are revised on contracted hours. This is a good start but team managers need to keep in mind that with each new employee they need to assess the current conditions of the business counter. Making sure a business counter does not have a structural over or under capacity of contracted hours (especially over capacity as the trend of workload is downward) is needed. It is recommended by some team managers to have multiple temporary small sized contracts within the business counter as these make switching employees much easier. More temporary contracts results in the situation were contracts can be adjusted more frequently. This could be considered an advantage as they can therefore be adjusted downward if the trend gives reason to do so. On the other hand, temporary contracts yield the risk of being forced to look for new employees more often. As the process of interviewing new applicants can be time consuming and expensive this has to be weighed

Matching workforce to workload at TNT business counters
65
against the benefits. More throughput in personnel (due to the use of temporary contracts and for example higher pressure) can also be costly as all new employees need to be recruited, educated and trained. These costs are often not taken into account when thinking of adjusting to smaller contracts. Moreover, the conditions on the labour market need to be taken into account. In times of higher unemployment, is becomes easier to attract personnel but demanding more might have a negative effect in future tighter labor markets.
6.4.2 Cooperation
All team managers we interviewed indicated commitment, team spirit, cooperation, job satisfaction or similar indications are very important. The importance of commitment follows from the fact that the measures most applied by team managers depend completely on the willingness of employees to cooperate (asking volunteers to: work overtime, take leave or temporarily “step up” their productivity). As discussed in 4.3.4, a relationship oriented management style is essential in workforce flexibility. Team managers should therefore focus on activities like teambuilding, networking and creating commitment within their business counter to be able to apply more and more effectively, workforce flexibility measures. Also creating fulfilment and communicating ‘purpose of function’ is very important in this process.
6.4.3 Insight in current situation
To effectively apply certain flexibility measures a team manager needs to be aware of the current situation at his/her business counters on a number of subjects. First, the team manager needs to know which rules from the collective labor agreement apply in a specific situation. An important example we came across in our interviews was that team managers need to be aware of the rules with regard to “surplus payment”. A situation might occur in which a team manager can decide to contract a new person from 16.00-19.00 or from 16.15-19.15. In this case the team manager should know that if the second contract is signed that person work finished later than 19.00 and her/she will receive an additional “irregular work hour payment” of +20% over all hours after 18.00. If the first contract is signed no additional payments occur. Awareness of these rules can therefore be very important.
Secondly, applying measures with regard to leave and overtime require the team managers to be aware of a person’s leave hour status. Team managers should therefore check regularly the amount of plus and minus hours recorded in Harmony for each employee. Aiming to have all employees close to 0 plus and minus hours prevent the hours to be acquitted on fixed days, twice a year.
6.4.4 Willingness to take calculated risks
Finally business counter change managers and collection region managers indicated team managers who are more willing to take risks and try to perform as cream of the crop, score better on efficiency. Team managers who deliberately not plan an additional employee for the rare case of extreme high amounts of mail, might in a very small percentage of days fail to make the deadline, but in most of the days they will achieve higher efficiency. The self confidence required to do so might be easier to achieve if this decision is supported by the planning department which every area has. Currently a project is started to investigate if the

E.K. Haspels; University of Twente
66
planning department of each area can communicate once a week how much employees should be employed the next week at business counters. For this prediction they can use the moving average of the amount of order rows and roll containers, divided by the norm times of processing 1 of these workload drivers. Communicating this type of planning is already done in the area south east and appreciated by many team managers. With the planning from the planning department they feel more secure to take decisions even if the accuracy level is not higher than their own predictions.
6.5 Outlook for implementation
As stated in 6.1, we cannot provide an optimal way for team managers to match their workforce to their workload. Local circumstances like the particular workload fluctuation, distance to the next business counter, currently applied measures and cooperative attitude of employees highly influence the optimal way to match workforce to workload. In this chapter we have given an overview of measures used by the team managers we interviewed and discussed some advantages and disadvantages concerned with applying these measures.
Team managers will continue to have to make a management decision on how many employees to plan next week. With a better understanding on which measures can be applied to reactively increase or decrease the workforce, this decision should become more synoptic. It will stay a complex decision, requiring interpretation of difficult to quantify variables and calculated risks. Cooperation of employees is of the utmost importance in this process and an increased focus on this subject might be required.
We suggest that team managers arrange, besides the focus on creating commitment, standard operations procedures for different scenarios. In this way they can react quickly on changed situations. Knowing which actions need to be taken if for example a more than average amount of order rows arrives, can create calmness and clarity for employees on the work floor.
In chapter 7, we present the conclusions of this research by answering the individual investigative questions and addressing the problem statement. Furthermore we provide some recommendations for future research.
Chapter summary:
Given the inevitability of uncertainty in the required workforce, team managers need to arrange workforce flexibility. We have discussed concrete reactive measures currently used by well performing team managers. Most commonly used measures to adjust the required workforce are adding shifts (drivers), work in overtime, asking volunteers to take leave or pushing employees to ‘step it up’ for a short amount of time. Moreover different conditions have been discussed which are needed to apply the different methods, the most important being the presence of a willing and committed employees.

Matching workforce to workload at TNT business counters
67
7. Conclusions and recommendations
In this final chapter we present our conclusions with respect to the investigative questions and subsequently the problem statement (which were introduced in section 2.2). We start in section 7.1 by repeating the problem statement to remind us what the goal of this research is. Next, we briefly summarize our conclusions on each of the investigative questions. We then combine this information to answer the problem statement. Furthermore we present in section 7.2 recommendations for future research on some research specific subjects as well as more general subjects we came across during our research.
7.1 Conclusions
The goal of this research is to answer the problem statement: “How could the day-to-day process of matching workforce to workload be improved at TNT business counters?” To do so, we formulated 4 investigative questions.
The first investigative question aimed to clarify how collection is organized within TNT. Chapter 3 presented an overview of processes taking place at a business counter and taught us that team managers are responsible for the performance of their business counter. One of their tasks is to schedule employees, balancing the cost of understaffing against the cost of overstaffing. We focus in this research on the intake (invoicing mail) and preparation process (preparing mail for the sorting centre). We concluded scheduling employees for these processes is complicated due to strict time restriction, variability in the required amount of employees, the changing availability of employees and the absence of a clear set of actions which can be taken.
The goal of the second investigative question was creating more insight in the process of matching workforce to workload. We revealed in chapter 4 the broad research area concerned with this subject. We focused on workforce capacity management on operational level as we are interested in day-to-day matching. We combined two models to identify concrete measures on matching workload to workforce. These measures were identified to be focused on ‘reduction of workload uncertainty’ or ’increase of workforce flexibility’ and could be either ‘proactive’ (before the process) or ‘reactive’ (during the process). We used this model to structure the remaining chapters 5 and 6.
The third investigative question was focussed on depicting the workforce flexibility requirement at TNT business counters. We concluded the uncertainty in workforce requirement is caused by uncertainty in the amount of mail and the productivity. We quantified for each business counter, the current fluctuation in both factors at the processes we focus on. From our analysis on this data we concluded that the fluctuations resemble a normal distribution but that day-to-day forecasts based on consecutive (week) days do not yield much predictive power. Reduction of the workload uncertainty on operational level by other methods then forecasting turned out to be impractical. It left us the conclusion that reduction of uncertainty on operational level is difficult and thus making the process of coping with the existing uncertainty with workforce flexibility of increasing important.

E.K. Haspels; University of Twente
68
Adversely, we do support the current development within collection to let the area planning department communicate a weekly forecast for each business counter. This because we support the arguments that with this planning, team managers feel supported in planning tighter, keep track of the downward trend and do not forget holidays. Though, it has to be stressed that our analysis suggests the accuracy level remains low (for the preparation process more than 20% off in 30% of the days). Moreover we conclude for the data that the merge of facilities might yield interesting benefits with regard to reduction of uncertainty. We will address this in the recommendations as this concerns strategic changes.
The last investigative questions addressed the topic ‘increase of workforce flexibility’. We discussed in chapter 6 measures team managers can take to create operational workforce flexibility within their business counters to cope with the day-to-day workload uncertainty. We concluded from observations and interviews many operational ways to create workforce flexibility, both proactive and reactive, are used by team managers. Most commonly used practices to increase capacity are: (1) temporarily increase of efficiency (2) work in overtime and (3) arranging extra personnel. To decrease capacity, (1) asking for volunteers to take leave, and (2) switching to non-time-restricted activities were most common. We concluded that for (almost) all flexibility measures the willingness of employees to cooperate is required and we learned that team managers who focussed more on cooperation and commitment within their teams could deploy measures more effectively. Moreover we observed that different measures are applicable in different situations, and that team managers use different measures at different locations. We concluded knowledge exchange on creating commitment and applicability of measures is required.
Answering the problem statement:
We conclude that the process of matching workforce to workload at TNT business counter can theoretically be improved by reduction of workload uncertainty or by increasing flexibility in the workforce capacity. This research has shown reduction of workload uncertainty is difficult on operational level. Therefore we conclude that the creation of workforce capacity flexibility is important. We have shown workforce capacity flexibility is currently achieved by different methods. The measures to create workforce capacity flexibility depends on strategic boundaries (for example the CLA), local situations (amongst others: contracts, facility size, location, history) and the cooperative attitude of employees. For team managers to improve their match between workforce and workload, they need to assess the applicability of the different measures at their facility and decide how many employees they plan on an evening. We conclude that this assessment is complex and an increase of knowledge exchange between team managers is required. Moreover we conclude an increased focus on cooperation within business counters is needed as most measures are only applicable in these conditions.
Finally we concluded that the current fluctuations are considered low in comparison to other departments of TNT and measures on operational level will have a limited impact. Changes at strategic level are recommended and we address our suggestions on this topic in the next section. Although we do not want to trivialize the importance of reduction of uncertainty and increase of workforce capacity flexibility at operational level, we do want to emphasize that costs and gains need to be taken into account when addressing the problem.

Matching workforce to workload at TNT business counters
69
7.2 Recommendations
We provide recommendations with respect to workforce matching, DPM-C and more general recommendations based on our observations during our research period.
7.2.1 Recommendations on matching manpower to workload at business counters
We showed in our data analysis that larger facilities have lower coefficients of variation and even lower values were observed when mail volumes of an area were added up. We also concluded that methods to improve workforce capacity flexibility are easier to deploy at larger business counters. We therefore recommend increasing the size of business counters by integrating small business counters into large facilities. Both the reduction of workload uncertainty as well as the increase of flexibility will positively affect the match between workforce and workload. Currently projects within TNT collection on this subject are undertaken. These projects now take into account effects of integration like: changes in transport times and cost, changes in hours worked in TOT (Extra payment for irregular work hours) sensitive time, boundary of maximum capacity of a facility, and others. We recommend taking into account the increase in workforce capacity flexibility in decision making as well. We are aware that no financial indications for the improved match between workforce and workload at larger facilities have been created until now. We therefore recommend follow-up research into this specific subject.
As stated in the conclusions, we recommend increasing the exchange of knowledge between team managers on operational methods to create flexibility. This research can be seen as a first step in this process. A specific ‘team manager knowledge system’ could be developed, but we suggest (national) team manager days to be organized. Exchange of knowledge on concrete measures should be central but also knowledge exchange on the use of contracts (more small contracts, use of 0-hour contracts, etc) should be addressed. We think that letting team managers work nights on different facility a few times per year could also achieve effective knowledge exchange. Assessment of the complex and unique situation at each business counter is a difficult job and team managers need to be supported in this process. Training and knowledge exchange on the complex issues of creating commitment and cooperation, balancing contracts and effective operational management needs to be increased although the cost of such an operation need to be balanced with the expected cost reduction by improved matching.
In addition to our conclusion with respect to the involvement of the planning department in forecasting the amount of mail for the upcoming week, we recommend rolling out the current pilot in area ZO to all other areas. We think the planning department is better equipped than individual team managers to take into account local events, a downward year trend and holidays (as this department is specialized in forecasting volumes). Furthermore knowledge on these effects is easier preserved at the planning department rather than at every individual business counter. And as discusses earlier, a positive effect we expect to result from involvement of the planning department is a decrease of the “extra capacity planned for safety”. Team managers currently forecasting the amount of mail themselves

E.K. Haspels; University of Twente
70
might be insecure about their own forecast. This behaviour results in structurally planning overcapacity and would be prevented by letting the planning department be responsible for the forecasts of mail volumes
Finally we expect improvements in the process of matching manpower to workload if the 72 hour product would also be introduced for small customers. We think most mail which is sent, is not highly time dependent. The ability to stock mail for some days in case of under capacity could highly improve the match between workforce and workload.
7.2.2 Recommendations with regard to DPM-C
Within the process of creating better work-time-arrangement and subsequently adjustment of contracts, we recommend business counter-change-managers to pay special attention to TOT hour payment. The time at which the processes at business counters take place is highly sensible to changes in TOT hour payment. In the CLA it is stated that no additional payment is received if employees finish before 19.00 hours, but if they work past 19.00 hours all time after 18.00 is topped an additional 20%. Awareness of these CLA rules during the creation of the work-time-arrangements and contracts can reduce costs. Also for team managers it is essential to be aware of this payment regulation when deciding to use work in overtime to finish mail. If it is currently scheduled that the processes finish at 19.00 but working 5-10 minutes in overtime occurs frequently one has to know that those extra 5 minutes result in the payment of 65 minutes 20% wage addition. Although we did not fully investigate the level of awareness with regard to these rules, we expect increasing awareness could reduce cost.
For example: If 5 employees work from 16.30 to 19.30 a total of 15 hours is worked but wage cost will be: 5 persons x (1,5 hours x normal wage +1,5 hours x wage increased by 20%). If 6 persons would be schedules from 16.30 until 19.00 still 15 hours in total is worked but wage cost would now be 6 persons x 2,5 hours x normal wage. In this example scheduling a sixed person would reduce wage costs by 9%
At the start of the DPM-C implementation an excel file is used to register, amongst other data, the amount of order rows and containers processed at a business counter in the last 42 weeks. This data is then transformed, within the excel file, into output regarding the number of hours this business counter should have in contract each day of the week. During our research we observed extreme values in the data registration due to errors or influences of special days (For example 0 order rows processed on queens day, etc). As these values influence the output (based on averages) we recommend to prevent these errors by adjusting the Excel file to highlight extreme values so a change manager can take action.
Another Excel file which is introduced during the implementation of DPM-C is the “day progress model”. This file is used by team managers to record their performance and get visual feedback. Development of this excel file was still ongoing during our research period and no final version existed. The latest version we have seen, showed it would be locked to prevent local adjustments, which we applaud as we experienced the difficulty of local adjustments in Excel files ourselves during our research. We do want to recommend further research into the storage and use outside the business counter of the data in the Excel file. As these Excel files are stored locally by team managers themselves, it can be questioned if

Matching workforce to workload at TNT business counters
71
backups are made regularly. Furthermore, combining data of different business counters cannot be done automatically as they are stored differently and could be time consuming to do manually. Finally as the ICT support department within TNT does not support self-created Excel applications support for team managers having problems with the Excel file needs to be arranged within collection itself. We recommend making a member of the support staff at head office responsible for support of this Excel file and central storage of all these files on a SharePoint site. Though, again cost of training team managers in SharePoint might outweigh the benefits in this situation.
Moreover, cost and gains also need to be remembered when addressing the problems we encountered in this research. As discussed in section 5.1 we observed that the current driver to record the amount of mail at the preparation process (the number of containers) has some serious downsides. We observed this driver is variable and uncertain. Resulting from this uncertainty is the fact that interpreting the numbers becomes more difficult. Changing and improving the measurement could yield better insight in the real amounts of mail but might come at a cost. Although more quantitatively decisions are often preferred from a researchers point of view, remaining practical an accepting the defects in the data might show the general direction indicated by the data is more important than the accuracy.
7.2.3 Recommendations with regard to Collection
Taking into account performance of the whole chain rather than of an individual process step is very important. An example is that service level agreements between sorting and collection should not be about negotiating the optimal conditions for one process step but trying to find the combination which is most optimal for the entire mail chain within TNT. If the sorting department has pushed the deadline to receive the mail as soon as possible and mail then has to wait at the sorting process, money is lost at the collection department. Also further alignment between commerce and production could in our view yield improvements. And example is that during interviews we learned that the Pre and After Sales department (PAS) is not eager to ask customers to change their sending behaviour as this may result in the loss of a customer. But not changing this behaviour also affects the profitability of this customer. Closer contact between these two departments could prevent problems and lower costs as productions knowledge on ease of processing can prevent difficult to handle product being introduced. Also a strategy on pricing products in accordance with real time system workload capacity for of small customers might yield interesting gains but is more futuristic.
Furthermore we recommend evaluating the current database systems (EIS-P) as many employees indicated they do not use the system as it is considered impractical. Also we recommend not overwriting historic data with backward booking as this distorts any future research with this data.
Finally, employees might be insecure about current CLA developments within TNT and changes in their work and performance goals. This could lead to resistance in change processes. We were impressed by the amount of effort put in correct communication during the DPM-C process and recommend keeping up this focus as commitment and trust (we addressed as being important) are at this moment easily lost.

E.K. Haspels; University of Twente
72

Matching workforce to workload at TNT business counters
73
Reference list
Books 1. Cooper, D.R.; Schindler P.S. [2006]; Business Research Methods; McGraw – Hill
Companies; international edition; 9th edition
2. Greene, J. H.; [1997]; Production and Inventory Control Handbook; McGraw-Hill Companies, 3th edition
3. Hanke, J.E.; Reitsch, A.G.; [1998]; Business Forecasting; Prentice-Hall International Inc; 6th edition
4. Rampton, G.M.; Turnbull, I.J.; Doran, J.A.; [1999]; Human Resource Management Systems: A Practical Approach; Carswell
5. Rice, J.A.; [1995]; Mathematical statistics and data analysis, International Thomson Publishing, 2nd edition, p.212
6. Silver, E.A.; Pyke, D.F.; Peterson, R.; [1998]; Inventory Management and Production Planning and Scheduling; John Wiley & Sons Inc.; 3rd edition
Articles 7. Adenso-Diaz, B.; Gonzalez-Torre P.; [2002]; A capacity management model in service
industries; International Journal of Service Industry Management; Vol 13. No. 3 2002 pp.286-302; MCB UP Limited
8. Auzair, S.M.; Langfield-Smith, K.; [2005]; The effect of service process type, business strategy and life cycle stage on bureaucratic MCS in service organisations; Management Accounting Research; Elsevier Ltd; Vol 16; No 4; pp. 399–421
9. Betts, A; Meadows, M.; Walley, P.; [2000]; Call centre capacity management; International Journal of Service Industry Management, MCB University Press, Vol. 11, No. 2, pp.185-196
10. Das, S.K.; Patel, P.; [2002]; An audit tool for determining flexibility requirements in a manufacturing facility; Integrated Manufacturing Systems, MCB University Press, Vol. 13; No 4; pp. 264-274
11. Caroli, È.; Gautié, J.; Lloyd, C.; Lamanthe, A.; James S.; [2007]; Delivering flexibility: working time and contractual status in the food processing industry in France and the UK (working paper); Université Paris X-Nanterre
12. Gerwin, D.; [1993]; Manufacturing Flexibility: A strategic Perspective; The institute of Management Science.; Management Science, Vol. 39, No. 4 pp. 395-410;

E.K. Haspels; University of Twente
74
13. Hans, E.W.; Herroelen, W.; Leus, R.; Wullink, G.; [2007]; A hierarchical approach to multi-project planning under uncertainty; Omega, Elsevier, Vol. 35, pp. 563-577
14. Harding, M.C.; [2004]; Mail Demand Models; Department of Economics, MIT, Cambridge, Background Paper No. 1
15. Harper, P.R.; [2002]; A Framework for Operational Modelling of Hospital Resources; Health Care Management Science; Kluwer Academic Publishers; Vol. 5; pp. 165–173
16. Herroelen, W.; Leus, R.; [2005]; Project Scheduling under Uncertainty: Survey and research potentials; Elsevier B.V. European Journal of Operational Research Vol. 165 pp. 289-306.
17. Kathuria, R.; Partovi, F.Y.; [1999]; Work Force Management Practices for Manufacturing Flexibility; Journal of Operations Management, Vol. 18. pp. 21-39; Elsevier B.V.
18. Lovelock, H.C.; [1992]; Seeking synergy in service operations: seven things marketers need to know about service operations; European Management Journal, Vol. 10 No. 1; pp 22-9
19. Malhotra, M.K.; Ritzman, L..P.; [1994]; Scheduling Flexibility in the service sector: A postal case study; Production and Operational Management, Vol. 3; No. 2; p.100-117
20. Meso, P; [2008]; A Resource Based View Of Manufacturing Strategy And Implications To Organizational Culture And Human Resources; Journal of Business & Economics Research –Terrence J. Moran, St. Bonaventure University, USA ; Vol. 6, No. 11
21. Mula, J.; Poler, R.; Garcı´a-Sabater, J.P.; Lario, F.C.; [2006]; Models for production planning under uncertainty: A review; International Journal Production Economics; Vol. 103 pp. 271–285; Elsevier B.V.
22. Nader, F.H. ; Lintell, M.; [2008]; Mail Trends Update (Adrenale Corporation) Background Paper No. 2008-1, Pitney Bowes , February 2008
23. Ng, I. C.L.; Wirtz,J.; Lee, K. S.; The strategic role of unused service capacity; International Journal Of Service Industry Management; Vol. 10; No. 2; pp211-238
24. Oke, A.; [2003]; Drivers of volume flexibility requirements in manufacturing plants; International Journal of Operations & Production Management; Vol. 23 No. 12.; MCB UP Limited
25. Ranga V. Ramasesh; Maliyakal D. Jayakumar; [1991]; Measurement of Manufacturing Flexibility: A Value Based Approach; JOURNALO F OPERATIONMS ANAGEMENT; Vol. IO. No. 4, October 1991

Matching workforce to workload at TNT business counters
75
26. Snyder, C.A.; Cox, J.F.; Jesse, R.R.; [1982]; A Dependent Demand Approach to Service Organization Planning and Control; Academy of Management Review, Vol. 7, No. 3, 455-466
27. Upton, D.M.; [1995]; Flexibility as process mobility: the management of plant capabilities for quick response manufacturing; Journal of Operations Management; No. 12; pp. 205–224
28. Witzel, A.; [2000]; The problem-centered interview; Qualitative Social Research (On-line Journal), vol. 1, No 1 url: http://www.qualitative-research.net/fqs-texte/1-00/1-00witzel-e.htm
29. Zijm, W.H.M.; [2000]; Towards intelligent manufacturing planning and control systems; OR Spektrum; Springer-Verlag; Vol 22; p. 313-345
Websites 30. [Website]
url: www.tntpost.nl (14 Mar. 2009)
31. [Website] url: http://group.tnt.com/aboutus/history/index.aspx (5 Feb. 2009)
32. [Website] url:http://group.tnt.com/press/446346/TNT_launches_first_to_market_South_American_integrated_road_network.aspx (29 Apr. 2009)
33. [Website] url: http://www.ez.nl/Onderwerpen/Huidige_economie/Postmarkt (17 Jun. 2009)
34. [Website] url: http://ec.europa.eu/internal_market/post/index_en.htm (2 Jun. 2009)
Other 35. [TNT Document] Model DPM Collectie; Inzicht in het dynamisch prestatie model
(normatief)
36. [TNT Document] Uitgangspunten opzetten werkorganisatie colletie
37. [TNT Document] Tijdsbesteding Businessbalie t.b.v. Dynamisch Prestatie Model Collectie Definitief Bureau - Arbeidsstudie Staf OPS - Procesmanagement
38. [TNT Document] Op je plek binnen de nieuwe organisatie (september 2005)
39. [TNT Document] Oplever en overdrachtsdocument; Collectielocatie Apeldoorn ;DPM Collectie

E.K. Haspels; University of Twente
76
40. [TNT Document] Oplever en overdrachtsdocument; Collectielocatie Almere Gooise Poort; DPM Collectie
41. [TNT Document] Oplever en overdrachtsdocument; Collectielocatie Alphen aan den Rijn; DPM Collectie
42. [TNT Document] Functie informatie BU Productie – lijnfuncties
43. [TNT Document] Jaarplan Productie 2009
44. [TNT Annual Report 2008] http://www.group.tnt.com/annualreports/annualreport08/index.html#annualreport2008
45. [TNT PowerPoint Presentation] Terug – en vooruitblik; Implementatie DPM-Collectie (12-mei-2009)
46. [TNT PowerPoint Presentation] 20080424_GreenfieldCollectie_MT Mail_20080418
47. [TNT Document] Collective Labour Agreement
48. [PowerPoint Presentation] Luis Jimenez (22 February, 2006); “Is There a Future for Mail?” ; Postal Rate Commission - Washington, D.C.
49. [Excel sheet] Dagvoortgangsmodel Almere
50. [Excel sheet] Dagvoortgangsmodel Hoofddorp
51. [European report] Main developments in the postal sector, ECORYS Nederland BV (2006-2008); Dr. Nick van der Lijn (Team Leader) Patrick de Bas, Garry Carter Frederik van Doorn, Nicolai van Gorp Hans Kok, Judith Mathijssen Lars Meindert, Peter Vis Rotterdam, 11 September 2008 http://ec.europa.eu/internal_market/post/doc/studies/2008-ecorys-final_en.pdf
52. [TNO Arbeid report] Leede, de, J.; Cox-Woudstra, E.; Goudswaard, A.; Rhijn, van, G.; Schie, van, J. Tuinzaad, B.; Veldhuizen, van, A.; 2002; Flexibele inzet van personeel in productiebedrijven; Praktijkvoorbeelden, trends, effecten, instrumenten; TNO Arbeid/Industrie, PlantijnCasparie Heerhugowaard. ISBN: 90-6743-939-8
53. [Master thesis] Drenth, J.C.;[2009]; The ingredients for a committed workforce; url: http://essay.utwente.nl/58556/1/scriptie_J_Drenth.pdf

Matching workforce to workload at TNT business counters
77
Appendices
1. Organizational Structure TNT ............................................... 78
2. Overview Mail Process .......................................................... 80
3. Link between DPM-C and Corporate Strategy ...................... 82
4. Overview DPM-C .................................................................. 83
5. Mail volume forecasting ....................................................... 87
6. Statistics ................................................................................. 89
7. Drivers in mail demand models ............................................ 90
8. Roll container labels ............................................................. 91
9. Financial indication O2C ....................................................... 92
10. Confidential report work time studies ................................. 93
11. Business counter information ............................................... 94

E.K. Haspels; University of Twente
78
1. Organizational Structure TNT
As we have indicated in the introduction chapter, this research focuses on a specific part of TNT N.V., namely: the business counters. To understand the position of the business counter within the organisation we depict the organisational structure of TNT N.V., the division Mail, the business unit Mail Netherlands and the area structure.
The structure of TNT has changed to some extent recently. Parcel services is given a new position and with the introduction of a project called operational excellence also the structure at production and the area has changed slightly. This does not affect the position of business counters within the organisation.
1.1 TNT N.V.
TNT N.V.
Board
TNT Mail
TNT Express
Head office
support
Supervisory
Board
1.2 TNT Mail
TNT Mail
Mail Netherlands
Cendris
Parcel services
European Mail
Network
Spring
Support (Real
Estate, ICT Mail,
Legal, etc.)
Pakketservice
1.3 Mail Netherlands

Matching workforce to workload at TNT business counters
79
1.4 Production
Production
Operations
Development
HR&O
Mobility
Area ZW
Area ZO
Area NW
Area C
Area W
Area NO
1.5 Areas
Area Director
Manager
Sorting
Staff Operations
HR
Control
Manager
Collection
Manager
Delivery
Collection Region
Manager
“Bedrijfsleider”
VBG Manager
Team Manager
collection
PTL
Team Manager
delivery

E.K. Haspels; University of Twente
80
2. Overview Mail Process
Although this research will focus on the collection process, understanding the relation between collection and the other processes leads to a full understanding of the problems and difficulties. Therefore an schematic overview of all processes is given.
2.1 General Processes at TNT Mail
[Dutch]

Matching workforce to workload at TNT business counters
81
2.2 Schematic overview of the mail process
Sorteren en Voorbereiden
Bezorgen
Collectie
Brievenbus
Postkantoor/
Servicepunt
Business Point
Haalservice
Business Balie
Schiften/
Opzetten/
Stempelen
Losse
post 1e Sortering
Klein/Groot/
Overig
(Video-)
coderen
Verzamelen per
sorteercentrum
Naar buitenland
Afvoer naar
andere
sorteercentra
Bakkensortering
Klein/Groot2e Sortering
Klein/Groot/
Overig en evt.
3e Sortering
Huisnummer-
sorteren
Overig
Verzamelen per
bestelkantoor en
afvoeren
Handmatige
verwerking
Brengklanten
Bestellen
Postbussen
Partijenpost
Voorgesorteerde partijen
3e sortering:
Huisnummer-
sorteren
Overig
Klein

E.K. Haspels; University of Twente
82
3. Link between DPM-C and Corporate Strategy
Treacy and Wiersema2 describe three value disciplines: (1) Operational excellence (2) Customer intimacy (3) Product leadership. TNT made the choice to focus on customer intimacy and operational excellence.
The mission statement of TNT N.V. is formulated as followed:
Our mission is to exceed the expectations of our customers with regard to the worldwide transport of their goods and documents. We create value for our customers by providing the most reliable and efficient solutions for distribution and network management [43]
The strategy for the division TNT Mail Netherlands to contribute to the corporate missions is formulated as:
Retain current margins and profit in the Dutch market by: creating a flexible cost structure to cope with volume decrease and providing new services with which customers can achieve cost reduction [43]
There are several reasons why focussing on cost reduction and cost flexibility is a sound decision.
1. The product mail is going from the mature to the decline stage of the Product Life Cycle 3which implicates the need for cost reduction and cost flexibility.
2. TNT has a high market share and low grow potential. The BCG matrix indicates this as being a cash cow, implicating cost reduction is a sound decision. For basic info see. 4
Within the business unit production this strategy is translated every year into multiple measurable key targets. For the year 2009 BU production has translated the corporate mission into 8 target, for example delivering the budget, keeping employee satisfaction steady and implementation of the New initiative master plans (NIMP).
One of projects within NIMP focussed on collection is the project for implementation of DPM-C at all business counters.
2 http://www.buddykluin.nl/html/downloads/DisciplineofMarketleaders.pdf
3 Levitt. T. [1965], "Exploit the product life cycle", Harvard Business Review, volume 43, november-december 1965, pagina 81-94
4 http://en.wikipedia.org/wiki/Growth-share_matrix

Matching workforce to workload at TNT business counters
83
4. DPM-C
For a complete overview of what DPM-C comprises we advise to read the TNT documentation on the internal SharePoint site dedicated to DPM-C. Here we provide an overview of main topics within DPM-C.
4.1 General overview DPM-C
The environment in which TNT is doing business with its mail division is changing. And this requires TNT to adapt to new situations. The strategic focus on operational excellence directs this adaption process. For collection it was determined the following had to change: customer and service orientation, standardization of processes, more outsourcing, tighter process steering, steering on achievement, first-time-right and cost thinking. To achieve this change, different project were started. DPM-C, being one of these NIMP projects, aims at achieving a more efficient process at business counters.
Being aware that change processes require an integral approach, four pillars were formulated for the DPM-C reorganization. (1) Establishing more efficient processes; (2) improve process steering; (3) adjust personnel occupation; (4) stimulation of the right behavior. (see figure in Dutch)
Together with these main pillars, more concrete targets were formulated within each pillar and concrete financial targets were determined. The end products this reorganization requires are: (1) Performance models in Excel and a count application, (2) a renewed process and layout design (3) renewed work time arrangements (4) a registered process of plan-do-check-act and (5) a internal course addressing attitude and behavior.
Starting at pilot locations, and later on at each business counter individually these end products where implemented and evaluated. The whole process is controlled by the DPM-C project team.
4.2 Stakeholders and responsibilities
The national DPM-C project manager is head of the DPM-C project. Within the project team there are 8 business counter change managers (BCM). These BCMs have the task to support the team managers and collection region managers to implement DPM-C at their business counter. Frequent meeting with the Area collection managers BCM and collection regions managers should ensure a smooth implementation.
+ Slimmer
ingerichte Processen
Aanpassing personele bezetting
Het juiste gedrag van
medewerkers MT en staf
+ Focus op process-sturing +

E.K. Haspels; University of Twente
84
4.3 process standardization
A document describing the standardized process at business counters is available at the SharePoint site of DPM-C. The process described in this document is in accordance with the process described in chapter 3. The main goal of this process standardization is to implement a best practice way of working at all business counters. Also the specific main to prevent mail streams from crossing each other ensures the risk of failure in the order to cash function is lowered.
Differences do still exist between business counters. There are for example situation where the physical properties of a business counter facility prevent the standardized process from being implemented. The decision between doing a facility makeover or allow deviation from the standardized process is made in dialogue between the DPM-C project manager and collection area manager. Also high investment costs in new equipment for facilities which are expected to be disband within the upcoming years could also be a reason to allow deviation from the standardized process.
4.4 Implementation
When DPM-C is implemented at a business counter a kickoff meeting is held in which all employees are informed about the change process. All business counters going through this process are supported by a change manager and process implementation advisors.
The change process starts with installation of the count application and the preparation of the performance model in Excel. All business counter use the count application since beginning 2009.
Next the following 5 steps are undertaken: (1) making a “photo” of the business counter, (2) change of the process, (3) adjust the work time arrangement (4) match the people and (5) evaluate. We will discuss each step briefly.
4.4.1 Photo
Making a photo of the business counter is both literally making pictures as well as bringing the following information together: Current contracts, Number of employees, current work time arrangements, contract sizes, Check for structural horizontal switching, correct registration AC codes, current work time arrangements, workload average 42 weeks, count application numbers first months, checklists, service level agreements, opening hours, available tools, layout facility, etc.
Also an employee satisfaction measurement is done and room for input is given to the employees.
At the same time the collection rides are rearranged by the team manager in close dialogue with the transport department and BCM to try to route vehicles optimal.

Matching workforce to workload at TNT business counters
85
4.4.2 Change of work floor process
If the previous step is finished the workfloor is rearrange according to document “Procesverbeteringen en standaardisatie Business-balie” This may include repositioning of the intake counters, repositioning of the preparation conveyer and the introduction of collared tape on the ground to indicate lanes and buffer areas. Moreover, the bins are places in a specific way around the preparation employees for best practice results. It might take some employees some time to get used to the new situation, thus affecting their output in the first days after implementation.
4.4.3 New working time arrangement
Now that the process has been changed the work times and contracts need to be changed as well. A building team is created at every location consisting of a process implementation advisor, a BCM and volunteering employees. They have the responsibility to construct a new work time arrangement based on the document “Uitgangspunten werkorganisatie colletie” , the average workload at all processes and the process implementation advisors initial planning. The building team suggests a new work time arrangement and organizes discussion sessions to see if local needs and wishes can be addressed by changing their planning.
4.4.4 people matching
When the work time arrangement has been determined and agreed upon the contracts are matched to the work time arrangements as best as possible. This means shifts are created and the process implementation advisor and BCM try to mach capabilities of people to available shifts. As almost at every location less employees are needed in de new situation. Aa strict procedure on matching employees, including rank numbers (based on number of years of employment, etc.) exists. Employees who cannot be placed on a shift in the new situation will be helped to another job if possible by Mobility.
4.5 First reactions
The first evaluations on DPM-C implementation are on average positive. The cost reduction target are achieved, the more synoptic process brings composure to the work floor and the performance goals are achieved most of the time resulting in a positive atmosphere.
Still we should not deny the negative sounds regarding a more common feeling amounst TNT employees of distress about the announced layoffs and failure to reach a collective labour agreement. Also within the DPM-C reorganisation some voices of discontent are heard saying “they try to push us out of the company” and more in line with these expressions.
Furthermore we copied some quotes from the first evaluation documents which show the problems team managers have with regard matching workforce to workload.

E.K. Haspels; University of Twente
86
[Oplever en overdrachtsdocument ;Collectielocatie Almere Gooise Poort;DPM Collectie]
[Oplever en overdrachtsdocument ;Collectielocatie Alphen aan den Rijn ;DPM Collectie]
[Oplever en overdrachtsdocument ;Collectielocatie Apeldoorn ;DPM Collectie]

Matching workforce to workload at TNT business counters
87
5. Mail volume forecasting
“It’s very difficult to make predictions, especially about the future” (Niels Bohr, 1992)
In the previous appendix, as well as in DPM-C documentation it is concluded that for team managers to improve their personnel planning, predictions of mail volumes are necessary. This appendix will therefore start by describing what is known about mail volume forecasting in literature. Next we will go into detail on forecasting techniques and needed information.
5.1 Mail volume prediction in literature
Mail prediction has been a topic within literature for some time. At first, prediction about the increase in mail volume where needed to check if capacity should be expended. Later, mail volume predictions were used most of the time to investigate mail volume decrease and how to cope with that.[14; 22; 48]
Review of the existing literature on mail demand models can be done according to Harding [14] in a framework categorized along three dimensions: data type, degree of economic structure and mail heterogeneity.
Drivers in these different types of mail demand models are very divers. Research by the Postal Rate Commission of the Universal Postal Union shows a extensive overview of mail volume drivers (Appendix 7). Although exact correlations between the driver and mail volumes are difficult to determine and predictions of these drives also contain uncertainty the applicability for this research fails mostly on the fact that most of the drivers are virtually impossible to determine on business counter level. The scope of these drivers and all other literature on mail volume predictions is addressing the subject on a nation- or worldwide scale. To make steering on volume possible, predictions are needed on business counter level. And business counters cover a physical area which is defined by TNT. Unfortunately drivers like economic growth, communication panels or even weather forecasts are not available for these specific areas and creating this data can be expensive. Furthermore, this research aims at providing a forecast solution applicable at all business counters and collecting the above mentioned data at all locations is even more difficult, expensive and outside the scope of this research.
Therefore the only quantitative option remaining is using historical data of these specific business counters. This forecast will therefore focus on time series analysis of data available at business counters.
5.2 Theory on time series forecasting
All formal forecasting procedures involve extending the experience of the past into the uncertain future [3]. To indicate if forecasting is effective Silver et all [6] suggest one should weight the cost of forecasting against the cost reduction achieved by the reduction of

E.K. Haspels; University of Twente
88
uncertainty. In Figure 19 the relation between the cost of forecasting and the cost of inaccuracy is depicted.
Unfortunately the cost of forecasting and the cost of inaccuracy are hard to determine. Still the insight in the relation between these two costs can indicate that expensive forecast methods are not advisable if uncertainty is low.
Forecasting is done to support managers in decision making. A forecasts in itself is never a decision taker [3]. Forecasts can give an indication but knowledge not in the model and interpretation is always necessary when using a forecast. Silver et all [6] present a framework for forecasting explicitly taking human knowledge and interpretation into account. See Figure 20.
Forecasting consist of 4 steps:
1. Data collection
2. Data reduction or condensation
3. Model building
4. Model extrapolation
For further basis reading on time series forecasting we refer to [3], [6] or in Dutch we suggest “Tijdreeks voorspellingen” (Erwin de Winter, Master thesis, University Twente, 2002)
Figure 19: Cost of forecasting versus cost of inaccuracy Silver et all [6]
Figure 20: Forecasting framework Silver et all [4]

Matching workforce to workload at TNT business counters
89
6. Statistics
We briefly discuss the basic statistics we used in this thesis. For a more elaborate review of statistics in general we refer to [5]
6.1 Coefficient of variation
In statistics the coefficient of variation is used to express the spread of a dataset. The coefficient of variation is defined as the standard deviation divided by the average of the dataset. In a formal expression this is:
Where µ is the average of a data set, calculated by:
The variation of a data set is expressed as the σ2 calculated by
,
6.2 Correlation coefficient
The correlation coefficient ρX,Y between two random variables X and Y defined as:
Where the average is expressed by μX and μY and standard deviations by σX and σY. Moreover, the E is the expected value operator and cov the covariance. This covariance can be calculated by:
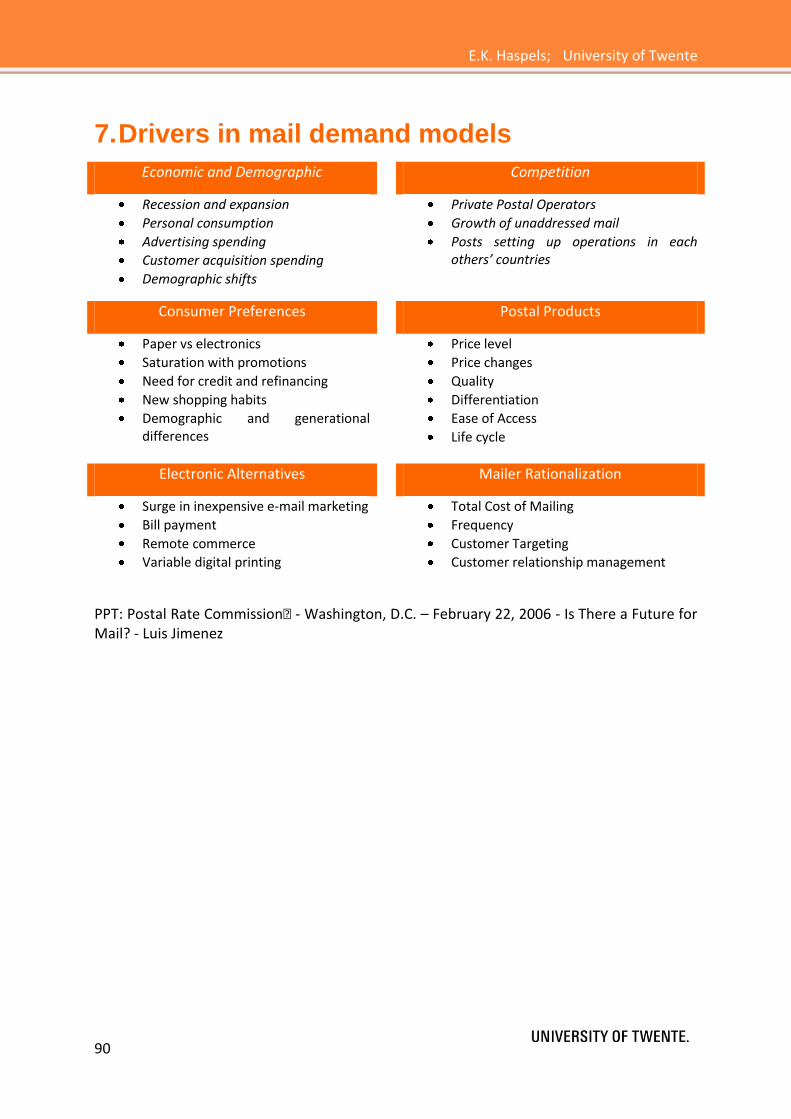
E.K. Haspels; University of Twente
90
7. Drivers in mail demand models
Economic and Demographic Competition
Recession and expansion
Personal consumption
Advertising spending
Customer acquisition spending
Demographic shifts
Private Postal Operators
Growth of unaddressed mail
Posts setting up operations in each others’ countries
Consumer Preferences Postal Products
Paper vs electronics
Saturation with promotions
Need for credit and refinancing
New shopping habits
Demographic and generational differences
Price level
Price changes
Quality
Differentiation
Ease of Access
Life cycle
Electronic Alternatives Mailer Rationalization
Surge in inexpensive e-mail marketing
Bill payment
Remote commerce
Variable digital printing
Total Cost of Mailing
Frequency
Customer Targeting
Customer relationship management
PPT: Postal Rate Commission� - Washington, D.C. – February 22, 2006 - Is There a Future for Mail? - Luis Jimenez

Matching workforce to workload at TNT business counters
91
8. Roll container labels
[Dutch]

E.K. Haspels; University of Twente
92
9. Financial indication O2C
CONFIDENTIAL

Matching workforce to workload at TNT business counters
93
10. Confidential report work time studies
We briefly discuss the outcomes of the confidential report on work time studies.
10.1 Time use at business counters
CONFIDENTIAL
10.2 Productivity fluctuations at preparation process
CONFIDENTIAL

94
11. Business counter information
11.1 Intake process – order rows
# all correlation coefficients are displayed as absolute values as the average of the different correlation coefficients is used. Still, both slight positive and negative correlations occurred, mostly slight positive correlations were amongst the values as can be expected due to the slight trend during the year.
AREA LOCATION NUMBER LOCATION NAME
Average # order rows
Average Var. Coeff. #
Order rows
Average Corr. Coeff. Day,
Day+1
Average Corr. Coeff. Day,
Day+1 (corrected for
day diff)
Average Corr. Coeff.
Weekday, weekday+1
NW 10009055 AMSTERDAM-Kabelweg 503 0,10 0,23 0,25 0,30
NW 10009056 AMSTERDAM ZUIDOOST-Hoogoord 424 0,07 0,07 0,07 0,21
NW 10009057 AMSTERDAM-Fred. Roeskestraat 254 0,07 0,26 0,32 0,25
NW 10009091 AMSTERDAM-Australiehavenweg 1460 0,06 0,06 0,05 0,18
NW 10009092 ALMERE-Transistorstraat - Gooise P 394 0,06 0,15 0,22 0,29
NW 10009097 HILVERSUM-1e Loswal 225 0,10 0,11 0,04 0,16
NW 10009137 ZWAAG-De Oude Veiling 215 0,08 0,11 0,09 0,16
NW 10009139 ALKMAAR-Hertog Aalbrechtweg 421 0,07 0,17 0,11 0,19
NW 10009140 Heemskerk / BEVERWIJK 111 0,11 0,08 0,05 0,14
NW 10009169 ZAANDAM-Mahoniehout 116 0,10 0,05 0,09 0,26
NW 10009170 HAARLEM-Minckelersweg 306 0,09 0,13 0,02 0,23
NW 10009171 AMSTELVEEN-Langs de Werf 219 0,08 0,07 0,05 0,20
NW 10009172 HOOFDDORP-Parellaan 223 0,07 0,14 0,14 0,16
W 10009173 KATWIJK ZH-Heerenweg 112 0,12 0,14 0,20 0,18
W 10009174 LEIDEN-Schipholweg 240 0,10 0,16 0,07 0,20
W 10009176 ALPHEN AAN DEN RIJN-Prinses Marg. 146 0,11 0,08 0,15 0,24
W 10009203 'S-GRAVENHAGE-Zonweg 770 0,06 0,06 0,15 0,25
W 10009204 'S-GRAVENHAGE-Loire 938 0,15 0,08 0,13 0,23
W 10009206 ZOETERMEER-Stephensonstraat 211 0,07 0,12 0,13 0,16
W 10009207 DELFT-Rijnweg 137 0,09 0,09 0,09 0,16

E.K. Haspels; University of Twente
95
W 10009208 GOUDA-Keerkring 126 0,11 0,07 0,10 0,21
ZW 10009212 ROTTERDAM-Giessenweg 144 0,09 0,21 0,22 0,20
ZW 10009215 ROTTERDAM-Terbregseweg 1843 0,07 0,13 0,06 0,17
ZW 10009223 DORDRECHT-Cornelis Lelystraat 193 0,08 0,07 0,05 0,19
ZW 10009300 BREDA-Slingerweg 610 0,06 0,17 0,13 0,23
ZW 10009330 ROOSENDAAL-Oostelijke Havendijk 310 0,07 0,11 0,11 0,26
ZW 10009343 MIDDELBURG-Arnesteinweg 222 0,08 0,15 0,21 0,16
ZW 10009364 TERNEUZEN-Hughersluys 133 0,09 0,16 0,17 0,16
ZW 10009371 GOES-Verrijn Stuartweg 154 0,08 0,10 0,09 0,12
C 10009418 NIEUWEGEIN-Drenthehaven 181 0,08 0,06 0,15 0,26
C 10009420 WOERDEN-Edisonweg 112 0,12 0,08 0,11 0,24
C 10009421 GORINCHEM-Papland 129 0,10 0,21 0,19 0,27
C 10009422 NIEUWEGEIN-Grote Wade 1532 0,07 0,28 0,27 0,29
C 10009423 UTRECHT-Koploperstraat / Cartesius 544 0,06 0,05 0,02 0,18
C 10009428 AMERSFOORT-Nijverheidsweg-Noord 493 0,06 0,09 0,11 0,20
C 10009433 HARDERWIJK-Johanniterlaan 131 0,10 0,06 0,10 0,18
C 10009455 ZEIST-Dijnselburgerlaan 175 0,11 0,19 0,14 0,17
C 10009477 NIJMEGEN-van Rosenburgweg 483 0,07 0,08 0,11 0,19
C 10009544 EDE GLD-Dieselstraat 178 0,08 0,18 0,20 0,19
C 10009563 ARNHEM-Johan de Wittlaan 519 0,05 0,07 0,10 0,17
ZO 10009597 TILBURG-Ringbaan Noord 475 0,07 0,13 0,14 0,16
ZO 10009599 'S-HERTOGENBOSCH-De Steenbok 2578 0,06 0,22 0,20 0,15
ZO 10009650 HELMOND-Marshallstraat 227 0,08 0,19 0,28 0,18
ZO 10009657 VENLO-Groot-Bollerweg 333 0,07 0,17 0,24 0,25
ZO 10009661 HEERLEN-In de Cramer 255 0,09 0,15 0,21 0,20
ZO 10009664 SITTARD-Geerweg 326 0,09 0,24 0,37 0,37
ZO 10009665 MAASTRICHT-Duboisdomein 257 0,08 0,10 0,09 0,20
NO 10009666 ENSCHEDE-Rigtersbleek-Westend 256 0,08 0,10 0,10 0,21
NO 10009668 HENGELO OV-Hassinkweg 172 0,09 0,17 0,16 0,17
NO 10009670 ALMELO-Aalderinkssingel 155 0,08 0,11 0,17 0,22
NO 10009671 ZUTPHEN-Industrieweg 176 0,08 0,13 0,06 0,17
NO 10009672 APELDOORN-Christiaan Geurtsweg 317 0,08 0,24 0,26 0,27
NO 10009675 DOETINCHEM-Expeditieweg 259 0,11 0,07 0,09 0,16
NO 10009676 ZWOLLE-Anthony Fokkerstraat 1773 0,08 0,21 0,06 0,18

96
NO 10009689 ASSEN-W.A. Scholtenstraat 211 0,08 0,16 0,03 0,24
NO 10009681 LEEUWARDEN-Celsiusweg 444 0,07 0,08 0,11 0,17
NO 10009683 HEERENVEEN-Skrynmakker 180 0,09 0,10 0,17 0,19
NO 10009685 GRONINGEN-Achterweg 693 0,07 0,19 0,15 0,20
We removed the correlation coefficients for Naarden from this list as its scores were very high due to the fact that it redirected some mail for a period of time in 2008, resulting in high correlation scores.
For a more detailed look we present in the table below, the correlation coefficients per weekday. We calculated the values by taking the average over the correlation coefficient per year of data to prevent the trend from being of influence.
AREA LOCATION NUMBER LOCATION NAME
Corr. Coeff. Monday
Corr. Coeff. Tuesday
Corr. Coeff. Wednesday
Corr. Coeff. Thursday
Corr. Coeff. Friday
NW 10009055 AMSTERDAM-Kabelweg 0,17 0,20 0,37 0,12 0,19
NW 10009056 AMSTERDAM ZUIDOOST-Hoogoord 0,02 0,21 -0,05 0,14 0,11
NW 10009057 AMSTERDAM-Fred. Roeskestraat 0,36 -0,02 -0,02 0,23 0,13
NW 10009091 AMSTERDAM-Australiehavenweg 0,06 0,04 0,12 -0,08 0,03
NW 10009092 ALMERE-Transistorstraat - Gooise P 0,13 0,06 0,11 0,04 0,23
NW 10009097 HILVERSUM-1e Loswal 0,27 -0,14 0,17 0,06 0,01
NW 10009137 ZWAAG-De Oude Veiling 0,28 0,10 0,11 -0,02 0,06
NW 10009139 ALKMAAR-Hertog Aalbrechtweg -0,08 -0,02 0,16 -0,08 0,09
NW 10009140 Heemskerk / BEVERWIJK -0,12 0,17 0,05 0,12 -0,07
NW 10009169 ZAANDAM-Mahoniehout 0,37 0,30 0,06 0,29 -0,04
NW 10009170 HAARLEM-Minckelersweg 0,06 0,09 0,06 -0,15 -0,32
NW 10009171 AMSTELVEEN-Langs de Werf -0,18 -0,08 -0,04 -0,09 0,04
NW 10009172 HOOFDDORP-Parellaan -0,04 0,00 0,09 0,03 -0,02
W 10009173 KATWIJK ZH-Heerenweg 0,27 0,15 0,08 0,22 -0,01
W 10009174 LEIDEN-Schipholweg -0,14 0,08 0,00 -0,16 0,20
W 10009176 ALPHEN AAN DEN RIJN-Prinses Marg. 0,15 0,40 0,15 0,32 0,14
W 10009203 'S-GRAVENHAGE-Zonweg 0,25 0,07 0,20 0,05 0,01
W 10009204 'S-GRAVENHAGE-Loire -0,02 -0,04 0,07 0,30 0,20
W 10009206 ZOETERMEER-Stephensonstraat 0,12 0,06 0,01 0,13 -0,01
W 10009207 DELFT-Rijnweg -0,07 0,07 0,06 -0,10 0,32
W 10009208 GOUDA-Keerkring 0,07 -0,13 -0,13 0,12 -0,02
ZW 10009212 ROTTERDAM-Giessenweg 0,01 0,17 -0,35 0,13 0,11

E.K. Haspels; University of Twente
97
ZW 10009215 ROTTERDAM-Terbregseweg 0,22 0,02 0,13 0,18 -0,14
ZW 10009223 DORDRECHT-Cornelis Lelystraat 0,01 0,06 -0,12 0,12 -0,04
ZW 10009300 BREDA-Slingerweg -0,05 -0,05 0,02 -0,19 0,11
ZW 10009330 ROOSENDAAL-Oostelijke Havendijk 0,39 -0,33 0,09 -0,04 0,17
ZW 10009343 MIDDELBURG-Arnesteinweg 0,04 -0,02 0,24 0,14 -0,17
ZW 10009364 TERNEUZEN-Hughersluys 0,21 -0,14 0,08 0,01 0,03
ZW 10009371 GOES-Verrijn Stuartweg -0,06 0,12 0,00 -0,09 0,03
C 10009418 NIEUWEGEIN-Drenthehaven 0,11 0,31 0,24 0,01 -0,17
C 10009420 WOERDEN-Edisonweg 0,03 -0,11 0,02 -0,06 0,00
C 10009421 GORINCHEM-Papland -0,08 0,23 0,41 0,16 0,29
C 10009422 NIEUWEGEIN-Grote Wade 0,25 0,15 0,39 0,18 0,10
C 10009423 UTRECHT-Koploperstraat / Cartesius -0,12 -0,05 -0,33 -0,13 -0,16
C 10009428 AMERSFOORT-Nijverheidsweg-Noord 0,28 -0,05 0,23 -0,03 -0,25
C 10009433 HARDERWIJK-Johanniterlaan 0,01 0,09 -0,28 -0,10 0,10
C 10009455 ZEIST-Dijnselburgerlaan -0,20 -0,03 0,11 0,23 -0,03
C 10009477 NIJMEGEN-van Rosenburgweg 0,35 0,05 0,25 -0,06 -0,10
C 10009544 EDE GLD-Dieselstraat 0,17 0,17 0,25 0,11 0,10
C 10009563 ARNHEM-Johan de Wittlaan 0,03 0,07 -0,13 0,01 -0,06
ZO 10009597 TILBURG-Ringbaan Noord 0,09 0,09 0,05 0,14 -0,23
ZO 10009599 'S-HERTOGENBOSCH-De Steenbok 0,14 -0,06 0,10 0,18 0,18
ZO 10009650 HELMOND-Marshallstraat -0,06 -0,09 0,24 0,26 0,04
ZO 10009657 VENLO-Groot-Bollerweg 0,08 0,14 0,18 0,14 -0,08
ZO 10009661 HEERLEN-In de Cramer 0,25 0,17 0,01 0,07 0,15
ZO 10009664 SITTARD-Geerweg 0,20 0,26 0,10 0,23 0,18
ZO 10009665 MAASTRICHT-Duboisdomein 0,27 -0,11 0,15 -0,07 -0,22
NO 10009666 ENSCHEDE-Rigtersbleek-Westend 0,23 0,13 0,03 0,06 -0,09
NO 10009668 HENGELO OV-Hassinkweg 0,12 0,04 0,21 0,05 0,12
NO 10009670 ALMELO-Aalderinkssingel -0,04 -0,05 0,09 -0,08 -0,02
NO 10009671 ZUTPHEN-Industrieweg 0,15 0,01 0,01 -0,03 -0,15
NO 10009672 APELDOORN-Christiaan Geurtsweg 0,29 0,25 0,03 0,22 -0,01
NO 10009675 DOETINCHEM-Expeditieweg 0,09 0,17 -0,04 -0,08 0,01
NO 10009676 ZWOLLE-Anthony Fokkerstraat 0,08 0,11 0,25 0,00 -0,03
NO 10009689 ASSEN-W.A. Scholtenstraat 0,25 0,02 0,02 0,33 0,11
NO 10009681 LEEUWARDEN-Celsiusweg 0,25 -0,10 0,04 0,11 -0,17

98
NO 10009683 HEERENVEEN-Skrynmakker 0,12 0,29 0,04 0,05 -0,16
NO 10009685 GRONINGEN-Achterweg 0,18 0,04 0,17 0,16 -0,09
11.2 Preparation process – roll containers
For the preparation process we do not present the correlation coefficient for individual weekdays as there are not enough data point per individual weekday to come to reliable correlation coefficients.