collective negotiations, work stoppages, and the effects ... · 592. ogre + 712a + e. where avgs =...
TRANSCRIPT

D '0:47 4
TITLE
TN8tITUT1ONAGENC
BOEEAU NOPOLi DATENOT
EDES PRICEDESCRIPTORS
DOCUMENT 8ESUME
IA tO6 401
Collective Negotiations, Work Stoppages, and theEffects of Nogotiati0us on Teacher Salaries inOhio's Public School:. Final. Report.Wright State Univ., Dayton, Ohio.National Inst. of Education (DOEW), Washington,V.C.D-3-22217438p.; A related document is EA 006 457
MF-$0.75 HC-$1,85 LLUS POSTJIGE*Collective Negotiation; DizcLiminant Analysis;Educational Finance; Educational Research; FactorAnalysis; Multiple Regression Analysis; *StateLegislation; Statistical Analysis; *TeacherAs:lociatIons; Teacher Salaries; *Teacher Strikes;*Teacher Supply and Demand
ABSTRACTThis study was designed to investigate the impact
that colloct$,ve negotiations have had on teachers' salaries in Ohio;and the relationships between the incidence of work stoppages and thecharacteristics of Ohio school districts. Since the focus of this wastwofold, it was found neckessar.:y to employ several statisticaltechniques to accomplish the objectives of the study. The first partof this report deals with the model and data base used to explain thevariance of average salaries for public school teachers in Ohio.Another section sets forth the research design used in ascertainingthe characteristics of school districts that had strikes. Empiricaldata presented in the report show the results of the factor anddiscriminant analysis. Conclusions and recommendations are alsopresented. (Author/JF)

FINAL REPORT
Collective Negotiations, Work Stoppages,and the Effects of Negotiations on
Teachers' Salaries in Ohio's Public Schools
National Institute of Education Project No. 32221
Project DirectorsDr. John J. Treacy
Dr. Charles H. Blake, Jr.
Wright State UniversityDayton, Ohio
1974
The research reported herein was performed pursuant to a grant contract with theNational Institute of Education, U.S. Department of Health, Education, andWelfare. Contractors undertaking such projects under Government sponsorshipare encouraged to express freely their professional judgment in the conduct ofthe project. Points of view or opinions stated do not, therefore, necessarilyrepresent official National Institute of Education position or policy.

COLLECTIVE NEGOTIATIONS, WORK STOPPAGES,
AND THE EFFECTS OF NEGOTIATIONS ON
TEACHERS' SALARIES IN OHIO'S PUBLIC SC:103LS
National Institute of Education Project No. 3-2221
Project Directors*
Dr. John J. TreacyDr. Charles H. Blake, Jr
Wright State University
Dayton, Ohio
1974
We wish to acknowledge the assistance provided byRussell Harris, Patricia Huber, Clary Chaffins andRobert Martin in preparing this report.

TABLE OF CONTENTS
Ic
II.
III.
IV.
Introduction
Objectives
Review of Literature
Procedures
Page
1
1
3
Part A: The Model and Data Sources 4
Theory 4
The Data 8
Part B: Research Design for Strikes 10
Factor Analysis 10
Discriminant Analysis 13
V. Empirical Results 17
Part A: Teacher Salaries 17
Part B: Teacher Strikes 22
Factor Analysis 22
Discriminant Analysis 24
VI. Conclusions and Recommendations 27
REFERENCES
BIBLIOGRAPHY
APPENDIX A

TA:ILES AND'CORRELATION MATRICLS
Page
Table Correlation Matrix of Ohio Public School 9
Variables in the 225 District Sample (1971)
Table II Discrimlnant Analysis Means for 16Populations W1 and W2
Table III Cross Tabulation of Organized and 19Unorganized Ohio School Districtsby Urban Characteristics
Table IV Correlation Matrix of Ohio Urban Public 21School Variables
Table V Discriminant Analysis F Scores 25

I. Introducltion
Durini; the pi:v1t: yo,;r2 Iccwher militanvv 1a!1 boon
exp2; os!,3od 1w 1) inovosed use of collective bargaining and
the use of the strike to imurove their salaries and to advance
their job security. Nationally, and especially in Ohio, public
school teachers have resorted to economic action to improve
their welfare.
The purpose of this study is to investigate 1) the impact
that collective negotiations have had on teachers' salaries in
Ohio; and 2) the relationships between the incidence of work
stoppages and the characteristics of Ohio school districts.
II. :Thjectives
Our research was designed to analyze the impact that collective
bargaining has had on teachers' salaries in Ohio where public
employees do not have the legal right to engage in collective
negotiations as exist in the private sector. Nevertheless, 66
percent of Ohio's school districts are represented at the collective
bArgaining table by the Ohio Education Association (406) or the
American Federation of 1,,ihor (6) . Teachers are definitely on the
move to improve the quality of their working environment and their
ncorLe.
N5tionally, the incidence of work stoppazes in the public
;,2hools has increased at an alarming rate du::.inz the past year,
A :Itud by the Denartment of Labor revealed there were 88
ntrtkes in 191)81 :',1t 97 in the Irint six months of 1972.
:;t:ri!-e' by teachers in Ch10 havt, also been increasing since
Lw' though c)hio's Fergu;on Act -ny :hits any pubLic

o oo oo iiamplyfm paPtptinr in d iaA
St 2 he GO f c!oloivo arthoanci tU o lut ao1ien iminvtnt
(clonomic and nooiat concePnin,i, the iuture ttnowling of
public odu,?ation in thy:' nation. Can school diBtricto continuo
to raise property t,.xes or must new sources of taxation be
developed to finance public education? Increased demand for
higher salaries are adding to the taN burden in most cities and
states. Moreover, should teachers and other public emnloyees
have the legal right to engage in collective bargaining?
Review of Literature
Earlier studies by Kasper,2 Thorton,3 Baird and Landon; and
Hall and Carrol 5 attempted to shed light on the effect that
teacher organizations have had on salaries. One of the major
difficulties these studies encountered was either such an aggre-
gated data base for their variables or restricted their sample
to include school districts from many states or from a very
restricted area of one state, that their results have to be
treated with caution. Only the Lipky and Droting study of
the cffects of collective bargaininil on teacher ;alaries in New
York state deals with a large number of school disn-icts within
a state having the same tax laws, :,tale aid programs,
rurtuirements ror teacher certification, and etc.
ince the design and model o each of Tile nrevious studies
the results vary on the pffect'; that col]oetivo 5argaining
ha-Lhad on teacher salaries. Kap,:r1.z7 ticinceri:w :;tudv revealed
that collective negotiations have ha: dn inelinificant effect on
f-eacher:.;' salariPs. laird and iAn!on concluded that the percntai,

.,1
ino';,i):5Ao in aalario that WAO negcAlatod by VatA.onal Education
Afociation (NM) chaptur wno bnvoly oignilicnt and tho contracts
notiated by American reduration of Labor (APT) localB had an
i:nignificaat effect on adjusting salaries. In tho Thorton9 study,
v,hich analyed school districts in cities with a population of
over 100,000, the effect of collective negotiations WIG significant
and added 2.3 to 2.8 percent in salaries. Likewise, Hall and
Carroll° found that teacher organizations in 125 school districts
of suburban Cook county significantly added about 1.8 percent to
salaries.
The Lipsky and Droting 11 study, which tested the effect of
unionization after the Taylor Law permitted teachers and other
public employees to engage In collective barge.ling, concluded
that negotiations had no effect on the salary levels of teachers
for all (excluding those in New York City) school districts.
However, the union did have a significant impact on salaries in
small towns. In addition, after unionization war; legalized, the
eflect on salaries from 1967 t(. l'IG8 was 1,()th positive and
TV. Procciures
Th,2 focus, of this study two- {'old, it ;ads found necessary
tc -,everil statistical ',,chn:quQs tc) a..2complish Ile objec-
tvt.;:, o: 3tuc:y. Part A 1V wi'h the model_
1111 ;at,4 L-1sF! ilso to expl lin th,, lv,.rare ';lciries for
teach,r.; in of iV :;et;, forth

tho mloroh citrdin usocl in acortaining tho oharactoviotion of
fohool diutricts that had 8triko. 2ootion V ov:mtano tho
ompirical results from the model used in Part A of 3fiction TV
on the effect of collective bargaining and Part 13 of 'llcaution IV
shows the results of the factor and discriminant analysis.
Part A: The Model and Data Sources
Theory
Our model to test the effects of collective organization
on Ohio teacher average salaries is posited in the form:
AVGS = +1AGI + 2TVPP + 3i2 41 + .121 592
OGRE + 712a + e
where AVGS = Average Salary
AGI = Adjus1.2d Gross Income Per Pupil (1966)
TVPP = Property Tax Valuation Per Pupil
STM n Local School Tax Millage
ADM = Average Daily Membership (attendance)
OD = Organized District Bivariatc Variable
AGRE = Existence of a Written Contract BivariateVariable
PTR = Pupil Teacher Ratio
Alpha, Beta and Epsilon, respectively, represent the constant term,
slope coefficients and the error term found In the conver,tional
linear r-egression model.;.

two indopondont varia.0.1 may NI viowod ars moanurilv,
tho tindniA[Al woll being of tho diNtriet from the pertvoctivo
of tho votor and in turm e.;t tho awtilablo tax baoo. While it hat3
1Joen commonly aooumed in the literatue that thesQ two au Qlot3oly
linked, an examination of the Correlation Matrix in Table 1: for our
ample data shows otherwise. AnT meadures adjusted gross income as
defined on line 18 of the internal Revenue Service Personal Income
Tax form aggregated to include all returns filed in the district
divided by school attendanee.12 This variable might be viewed as a
measure of voters' ability to pay and an index of their taste for
,!xpenditures on education. In addition, An' probably represents
regional factor price differences. We used Art measured for 1966
in our cross section model because 1970 census data by school dis-
trict was not available at the time we made our initial runs.
Subsequent tests established the high dep,ree of association between
AGI and the 1970 census income e:3-timateF., (r = .03). Our preliminary
asses.:;ment of this variable a:so 1,:!!,,rmi.ned that a very large percent
of the variance that occurred in this variable was within county
groupings of districts- rather than Iwtween counties.
This means that local difference in /VII within a county
rei'lect income segregation of voters; :1-1,1 not iwYt regional cost
iifter,nces while TVPP differencefl ropresent varvini, percentages
o: inu'itrial and commercial p:opertv in a district's tax base.
n i i possible to have relatively Iii it incomt. 1,,!vels for
the voterG :Ind low amounts of tax 1,,t ,e in district so that the
ter : :. rich, or poor, must specify itrwr the vot,,t.:; (A- the tax base
purpo:3e5 of ciririty. The exint,!nce of a ri(Th rivikes

ea,lik:r ,I:or d ditArict to aolitt 1,voo,Qm numd:1 with ci
eLvon tt-4x
TPM Li a ntoosuro oC the voters williw,ness tu tdx tho bat3o
.ivai2,able in the Oistvict. kr):' the school di;Ariet,
measure,1 by ADM, would tend to be associatod with the degree of
urbaniotion in the area where the school district was located.
Highor salaries were posited for hirher ADM distr,!Alts on the
oxounds that more higher paying positions associated with special
education would occur in the lappser districts. Such larger dis-
tricts in urban areas might als be viewed as undesirable by
teachers who might view the loss of professional autonomy in the
more complex districts and perhaps the presence of social tensions
as requiring higher pay to attract their services.
OD was a dummy variable assigned a value of one if the
district had a teacher organization advocating collective bar-
i'aining and zero if it did not. Since many districts had such
!",ut had not ac!lieycd a writte.n contract, we intro-
!uced another dummy variable Ann which indicates the existence
,-)f a written contract between teachers and the administration if
coded one and ,:err for no agreement. We expected that: the presence
of in otianization advocating collectivr bargaining might induce
the 1dministratior to grant 1,igher sdlarie in the hones of allaying
:rossure:: to crllectivrly bargain.
ince and Carro113 indicatc6 that they had !'ound evidence
inlicate somo Lsff 14,tween s,J1,iry ;tni
w,! include rTP in our model expet tit,' 111,0 ldrvor ratios wpuld he
ar;c;ocidted with hisThor Othor

. .
. ..";
vAtia!:)1, wr_q,o cgonifAvicle. wQre p.3. 1)d on gv,--.11(41 thzst
kfmOrl,oal data WOPO not Fwailablo to iroanurt! u;M or becallso
thoy Introduc:Od obviouo two-way ._nugalItv into tho mdel. An
oxamplo ot' the first tvpu variable WJG 161bo1od th domonotration
effect whioh hypothosiud thAt suecosBful wau nogoviations by
one cvNnigation it a county might spur other nearby diotricts
to y higheli.salaries to increase -noir efforts. V:e had no
means o dating contracts and were not certain that the county
was a meaningful gi.?,ographie context uid so abandoned thi.,4 variable.
A more promisini'i variable was a measue ol fringe benefits. Data
on this subject, however, is reported in such a manner that
we were not able to construct an index of their economic value
for the individual districts to include in this analysis.
An example of the second type problem is d measure of the
level of training via a Master Degreenaccalaurate Degree ratio.
This variable was initially appealino !Alt wq:1 ,'electod on grounds
that higher than average salaries may 11,1ve aitractod higher cre-
Jentialed teachers into the distrit.7t, thus introducing two-way
causality into the model.
The model posited in its final form expected positive regression
cc'etticients for all independent variables so that higher salaries
were expected in hi),I1 income, high property vell:x, hiTh tax dis
tricts that had an organizition .'rosin for c):1ive bargaining.
'ht exif;tenco C) a collectiv as.7,rec.mi!nt Jnd large class
were :11..10 exsted to ac:2ouh! 1-r Hphor tHe'F;.
1

.8-
Wto Data
Our sagq;le contained 225 out: o f the 624 Ohio School DIstricts
for l'.170-71 echoo1 Your. All data in our uamph! Is for 1971
except At which wan calculated an Internal Rovonuo Sorvico
tape file of 1966 personal income. no organization (01)) and
agreement (AGRE) dummies were obtained of a mail quostionnarel5
that followed up the initial mailing by polling the non-responding
school districts. The 225 unable responses produced a very repre-
sentative sample which was distributed between SMSA center city,
suburban and exurban (none SMA) districts in proposition to their
distribution in the state.
Table T gives the two-way tabulation of the sample between
urban and organizational characteristics in the sample indicating
that 5796 of the districts had some form of organization. What
was surprising was that 60% of the center cities in the sample
were not organized while a majority of both suburban and exurban
respondents were organized. The largest group of our school
districts were located in the suburbs of Ohio's 14 Standard
Metropolitan Statistical Areas.
Ail other data was drawn from our Financinp Education Croup
tape files. The interrelations between the variables are given
in the correlation matrix in Table 1.

Sig
TAPLE I
Correlation Matrix of Ohio Public School Variablesin the 225 District Sample (1971)
AGI* TVPP STM ADM ACRE OD PTR AVGS
AnI 1.00 .35 .17 .28 .14 .17 -.22 r. 0J
TVPP 1.00 -.32 .06 .07 .12 -.46 .43
STM 1.00 .16 .07 .04 -.03 .24
ADM 1,00 .03 -.02 .003 .33
ACRE 1.00 .31 -.07 .16
OD 1.00 -.08 .07
PTR 1.00 -.25
AVOS 1.00
*AC1 was available for 1966 only.

-10-
Part '6; Research Design for Strikes
In order to examine the characteristics of Ohio School Districts
so that some mcaningiul distinction can be drawn between districts
that had strikes and those that did not, an R-type factor analysis
and a linear discriminant analysis were performed. What follows :s
a non-analytic discussion of both these techniques to familiarize
the reader with what is being attempted.
Factor Analysis
Factor analysis is a statistical technique or scientific
method for mathematically analyzing data. Its single most dis-
tinctive feature is its capability of reducing the data to several
empirical constructs called factors. The factors, assuming that
some meaningful variation exists in the data, can be interpreted
as dimensions or theoretical constructs bridging diverse phe.lomena
which e;'hibit mathematical relationships. They can be used to
Describe actual data regularities or to estimate universal patterns
from a sample. The factors may also he employed to uncover causal
order, explain uniformities, or classify correlations. In adcition
to their employment as a typology, factors may be considered char-
acteristics or variables which can be used in other research
techniques; regression, for example. Factor analysis may be used
.seductively as part of a formal theory or, inductively, to determine
unknown patterns of phenomena or unsuspected influences in thi
lata Isar3e.
There are many specific ()f Lictor anal77,in althouTh ;1-
mentioned above, it is primariLv used as i (lata-roduction technque

which will (hopefully) result in the delineation or clarification
of meaningful patterns of interrelationships or structural dimen-
sions in the data. It can also be used to classify or describe
"groups" of variables on the basis of their similar profile values.
It may be used in scaling, using weights which are derived from the
common variation between variables and their related factors.
Hypothesis-tes ing, data transformation, mapping and exploration
for purposes of simplification are additional uses.
There are essentially five factor analysis models. Classical
or common factoring is the most popular method. Others are
principle components, image, canonical and alpha factoring. Common
factor analysis assumes that only a few factors will be significant
since, theoretically, there can be as many factors as there are
characteristics. Therefore, a criterion (an eigen value) is
employed to discontinue the factoring once the predetermined value
is reached. This value may he considered to be representative of
the minimum allowable variation in the data that is explained by
a factor. That is, factors explaining lees variation than the
minimum acceptable eigen value will he rejected. The principle
c,-mponent5 method, being purely mathematical, results in as many
actors a7, there are characteristics (or variables). The other
mf,tha,Th are more similar to common factor analysis in this respect.
There are three major steps in factor analysis: 1) Pre-
i'aration of the correlation matrix; 2) extraction of the initial
.actor:;; inci 3) rotation to terminal 4ac4r.rs. nncc, the researcher
11,1 s,-le,:ted the relevant variablc!:-; t. inclu,_led in the analysis,
h al:pro;:ridte r,easures of asnnciation must e selected; most

-12-
factor analyses require product-moment correlation coefficients.
If the correlation coefficients between characteristics (variables)
are calculated, the analysis is called R-factor analysis. If a
correlation matrix of units ;objects) is factor analyzed, the
procedure is called Q-factor analysis. Of the two the R-type is
mo,_;t common.
The second step in the analysis is the construction of new
variables on the basis of interrelationships in the data. Normally
it is assumed that the resulting factors are independent or ortho-
gonal. It is also assumed that there exists common determinants
which influence observed variables and that the variation in the
variables that is common is much greater than the nondeterminant
or unique variation. In other words, the correlations between
variables are considered to be due to common factors. Communalities
are estimates of the amount of common variances in the data. The
procedure used to estimate the communalities, which are inserted
in the main diagonal of the correlation matrix, determines the
particular factoring technique. The last major step is the rotation
of the factors to their terminal sclutions. In esence, this is a
simplification of the original factors which may be accomplished in
various ways, none of which is consifered abslutely superior to
Othr:rs--it depends on the theoretical needs; of the re:learcher.
A 7.1aor decision to be made is wheth,:r orthogonal (independent) or
cblique (correlated) factors are ..iesired. The oblique solution is
more re;il_:3tio while rth-r-on.il are mathema-
ticalLy sImpler to han(11q. tec'inique5 emplf)ved,
the rr?sulting terminal factors a!, !i:':-n.;ions or patterns

-13-
of interrelationships and, hopefully, contribute to a better
understanding of the general structure of the data.
Discriminant Analysis
The basic problem we are facing in discriminant analysis is
to classify an individual into one or more groups on the basis of
properties held by those individuals. If we Bxpress this in math-
amatical terms we would say that we are trying to classify an
individual w into one of k populations W1, W2, ....Wk on the basis
of measurements x1,
x2, ....x on P characteristics.
Tn linear discriminant analysis we are concerned with only
two populations, therefore k = 2 and our populations are symbolized
by W, and W2. What becomes important in linear discriminant analysis
is to find a linear combination of our xl, x2 ....xn measurements on
P characteristics that will yield a critical value. The critical
value is then used to 'discriminate' between the two populations
'0 and W2*
If the discriminant function that has been found isI
above the critical value then we can classify th,. xl, x2 ....x
measurement of an individual into pcmpuialon W1if it is below the
critical value that has been found v,e classi!y Lie individual into
population W2. The linear discriminant function takes the form:
z = a-x1
+ a2x2
+T`x
)
where al, a2, are constants k:Iown fiincriminant cofficients.
From this function we classify an xi, x2, (which reprw-,ents
a vector) into a W1or W,
4depend; ins, on whethor or not the, function
Virtl.iq I value greater than or 1,-3 the (JriLical value.

-14-
The problem now reduces to choosing the constants al, a21
....a and our critical value c such that we will minimize the
risk of classifying an individual from population W1 in W2 and
an individual from W2
in W1. The method used to do this is to
choose our constants al, a2, ....ap so that we obtain the farthest
separation possible between the mean of W1 and the mean of 't12.
In order for this procedure to be valid the variances of the
two populations must be the same, other vise the overlap of the
two populations may be so great that no classification procedure
will work. The c value is chosen to be halfway between the means
of the two populations (u1 + u2/2).
Logically what is happening is similar to stepwise regression.
The difference being that the F statistic used in stepwise regression
is based on partial correlation whereas in stepwise discriminant
analysis the F statistic is based on a one-way analysis of variance.
The program chooses the variable which has the highest F
statistic, which in our case denotes the variable with the highest
separation of means relative to the variance. On each successive
itep the variable with the highest F statistic is chosen relative
to the variables previously chosen. This process continues until
all the variables are entered or until all those variables remaining
to be entred add nothimg to our ability to discriminate between the
two populations.
Frc:7. this procedure we chose the variables that 'best' dis-
minate by comparinp our cmputetl F to tl,o ta!),Ilar F relative to
some level of' 3ignificanct: that we

-15-
The variables used in an attempt to distinguish between school
districts that have strikes and those that do not are as follows:
X1
= AGI Adjusted gross income per pupil
X2
= TVPP Tax valuation per pupil
X3 = APM All purpose millage
X4
= TSM Total school rnillage
X5 = CPP Cost per pupil
X6
= ADM Average Daily Membership (attendance)
X7
= AVH° Aggregate value of housing owner occupied
X8
= AVHB Aggregate value of housing owner black
X9
= AVHV Aggregate value of housing owner vacant
X10
= RO Renter occupied
X11
= RB Renter black
X12
= RV Renter vacant
X13
= RW Race white
X14
= RN Race negro
The basic assumption underlying the use of linear discriminate
analysis is that we are in fact dealing with two separate populations.
This requires a wide separation of means between the populations
under consideration. As can be seen from Table II there is some
validity to the assumption that we are dealing with two distinct
set,; of school districts in the state of Ohio.

-16-
TABLE TT
DISCRIMINANT ANALYSIS MEANS
W1
FOR POPULATIONS 6J1 AND W2
W2
AGI 8848 10458
TVPP 14492 15703
APM 0.42 0,47
TSM 0.31 0.34
CPP 613 652
ADM 2897 7820
AVHO 188284 587162
AVHB 4450 4467r,
AVHV 1625 4188
RO 95501 528939
RB 5671 114819
RV 6435 40540
RW 12433 37198
RN 633 U74

1
-17-
V. EmoiricJal Results
Part A: Teacher Salaries
We ran two versions of the model because of the suspected
differences between urban and rural school districts. In the
first we included all the variables in an OLS regression with
the following results:
AVGG = 5285 + .069AGI + .045TVPP + .4045STM .032ADM +(.013)* (.007)* (.081)* (.010)*
232.89AGRE - 111.220D + 6.14PTR(154.81)** (100.84)*** (19.75)
R2
= .47
*Significant at .01**?'gnificant at .05
**kLignil',.cant at .15(Standard Errors)
Average salaries went up almost seven cents for every dollar
increase in AGI and over four cents for every additional dollar of
TVPP in a school district. A forty cent increase for each mill of
school tax along with the foregoing demonstrated that the financial
condition of he voters, the district tax base and voter willingness
to tax themselves are the major explainers of the variability in
average salaries. Adding small but significant amounts of explan-
atory rower was the size of the district.
While the existence of an agreement was responsible for $232
in average salary variance the existence of a collective bargaining
,,ssociate,i with a negative coefficient. The OD
npt enter the equation at -1 hiirh level of -,iTnificance
*_'.'her' WIS 1CS5 than chance th,it its' coefficiPnt did not
the value for the ropulation parameter. Our Al RE
::),--'ficient was in r;i.J.7n an'3 size to and Carrol's16

-18-
variables denoting the existence of a collective bargaining agree-
ment. We would accordingly conclude that collective bargaining
units that have won a contract have succeeded in winning salaries
above the mean but that the mere existence of an organization
advocating collective bargaining did riot explain higher salaries.
Indeed, the unexpected sign on OD plus the slight degree of col-
linearity between it and ACRE introduces the possibility that
two-way causality exists.
Low average salaries may have caused teachers in the district
to organize in an attempt to remedy their plight. PTR was not
significant indicating that the pupil-teacher ratio, in association
with the variables delineated in our model, was not different than
zero in terms of its effects. The relatively low amount of ex-
plained variance (R2
= .47) in this model stemmed from the lack
of homegenity in the school districts included in the statewide
sample. In attempting to determine if our model would be more
appropriate for explaining the behavior of salaries in urban
area school districts we reduced the size of our sample to include
only the 133 S1SA districts. These included 5 center city and
128 suburban districts noted in Ta1)14' III as being located in a
county in one of Ohio's fourteen SWA'n. Teio TV gives the
st:nple correlation coefficients !or :hr. urban :;ample.

-19-
TABLE III
Cross Tabulation of Organizedand Unorganized Ohio School Districts
by Urban Characteristics
CountRow % No
Col % OrganizationTot %
Organization Row Total
Center 3 2 5
City 60.0 40.0 2.2
3.1 1.6
1.3 .940.OMIN
Suburban 52 76 128
4o.6 59.4 56.9
54.2 58.9
23.1 33.8
turban 41 51 92
1.4.6 55.4 40.9
42.7 39.518.2 22.7
Col Tot. 96 12942.7 57.3
Source: Mailed Questionnaire by Charles Blake, WSU 1972.

Our re&o2aion equation was ostiwttod f:()ELows:
UrbJin i\ /(`; = 5614 + .068A(11 .043TVPP .4136STM(.016)* (.007)* (.110q)*
.025A.'M 224.430nD + 196.2CAGRE(.011)* (140.00)** (210.11)
R2
7. .45
*Si,inificant at .01*Sinificant at .05
V.hen this, estin.ate is compared with our complete sample estimate
we find that the intercept value for urban districts is higher
bet that the slope coefficients f.Dr AFT, TVPP, STM and ADM
remain similar in magnitude. However, the existence of an or-
anization dummy enters the regression equation before AnRE
and takes on a relatively smaller standard error. The existence
of an agreement becomes statistically insignificant from zero
indicatim, that the multicollinearitv present has caused the
estimate to become unstable for the urban sample. In addition,
the lower R 2demonstrates that our hypothesis of SMSA districts
beinJ a more homogeneous group with regard to salary variance is
:else. increased significance and the larger slope coefficient
for OD reinforces the idea that the direction of causality may
he that low salaries are a major reason the existence of collec-
tive 5art'aining organizations occur in those distrietrl.
In response to the question concerning the effecte, of collective
1)argainin on salaries, we may answor that union agreements appear
:(-) nave won small ,ogins at best at ter c-Illowing for the financial
epm.iitio:. of the school district. nT eitert 11 :ve been limited
to encomT,as such a small number ol distrit that their bargaining

A
TAM!, IV
Colvolation 1,4itv1x of Ohio ui Publio 3ohool VaviableLl
ACU
TVPP
S TM
ADM
OD
AGRE
PTR
AV OS
Am:
1.00
Tv Pr
.368
1,00
( n
STM
-.017
-.446
1.00
n 13.3)
ADM
.190
.028
.060
1.00
OD
.243
.157
.048
-.040
1.00
.18)
.084
.142
.047
.310
1.00
PTR
-.185
-.469
.075
.079
-.088
-.010
1.00
AVGS
.5L$
.456
.082
.257
.067
.181
-.237
1.00

"ronuato dould not bo troarod rov statistfoal NignIfioaneo
oomparoA with the On vffort:3. PTR ci not meat the coitoriDn
level to it the stepwise reiwoltlion program. The rolativQv
high dogroe of negative wnlociation that thin variable has
TVPP, as seen in Table IV, indicates that higher mpil-teachEr
ratios may be related to problems at an adequate tax base in
the district. This examination of the urban sample iniicates
that organizational activity had not produced larp,er economic
pains in urbanized areas than in the state as a whole.
The results of this section were presented in a paper
entitled, "Effects of Collective Bargaining on Ohio Public Sch)ol
Teacher Salaries" by John Treacy, Russell Harris and Charles
Blake at a March 29, 1974 meeting of the Ohio Association of
Economists and Political Scientists at Kent State University.
A copy of this paper is attached. Note that the paper as
presented acknowledges support of the National Institute
;.)f Education,
art Teacher Strikes
Factor A:Hlysis
in ,,r(ler to better understand the data base that is being used
a .:ommor, 'actor analysis (R-tvpe) wa; run ar;numing orthogonal deter-
Fr-ml the unrotated factor matrix five factors were selected
on the bar;in of their eiiTen vatusThe maximum cigen value (first factor) in with the
minimum (fifth fdctor) being Th I r t fact'ir summari7es
51.3 percent 01 the variance in the data; the sicond, 18.4 percent;

-23-
the third, 13.9 percent; the fourth, 11.7 percent ; the last, 4.7
percent. The communalities ranged from approximately 95 percent
tor rho agrcgatu housing and rental variables to loss than 5
percent for houses vacant for sale. Most of the variables have
communalities of 25 percent or greater with many above 75 percent.
The first factor, since it summarizes 51 percent of the
variance in the data, is by far the most predominant. The six
aggregate housing and rental variables, average daily membership,
and race variables have high loadings on this factor. The housing
variables all having loadings of at least .80 with average daily
membership at .72 and race variables at .48. The common feature
of these variables is that they imply a concentration or density
of population with a fairly high proportion of non-white members.
Consequently we may describe this factor as being representative
of urbanization.
The second factor is also meaningful. Here, there are fairly
high loadings for residential tax valuation (.59), total school millage
(.93), all purpose millage (.85) and tax valuation per pupil (-.39).
This factor may he labeled "bedroom" suburban as housing tax
valuation is likely to be high in such an area. Also, having
nc, otner resources (such as industry) to draw from in terms of
taxer, these people would likely vote themselves higher millage
rates in order to acquire satisfactory public services as well
proper education for their children.
Th- third factor is also imlicative of suburbia -- but of
a quite different nature. Here hiph loading occurred for adjusted
rross income. (.57), tax valuation per pupil (.78) and cost per

;11_0.1 (.89). This factor can ire said to imply "industrial" sub-
urbani.zation for several reasons. First: in an industrial area
one would expect higher income!, and thus a relatively larger size
working force. Second, tax va].uation per pupil is likely to be
higher in such an area as industries are forced to contribute a
sizable amount of funds for pu'Dlic purposes. Third, cost per
pupil is likely to be high in such an area as superior educational
facilities are demanded since they can be had (largely) at
industries' expense.
While the first three factors are consistent with results
obtained in previous researci (see appendix A) in this area, the
fourth and fifth factors are obscure and provide little insight
into the structure of the data.
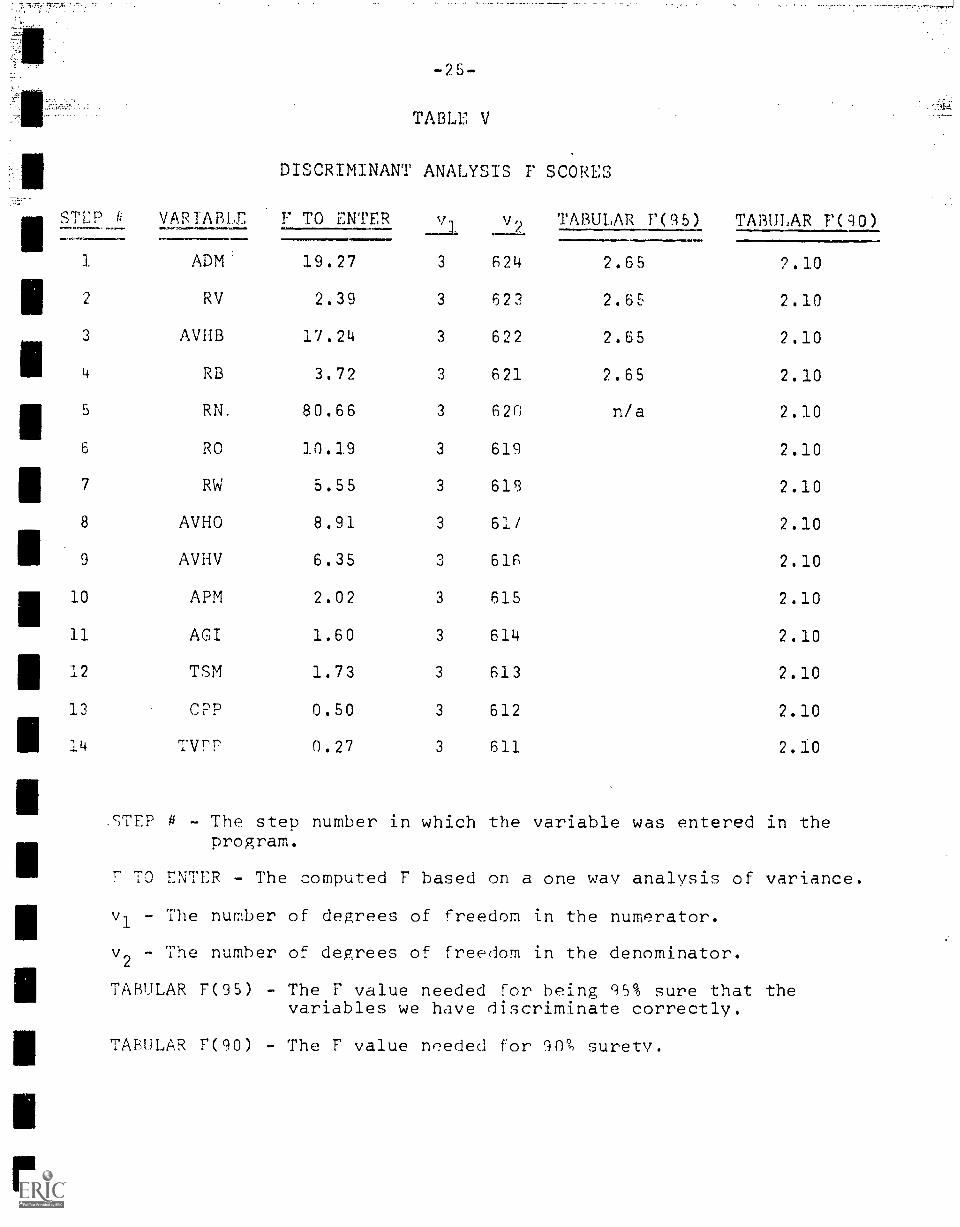
Discriminant Analysis
Of the fourteen variables used in the program Discriminant
Analysis only 9 of them entered with a significance level of .10
or greater. See Table V for the order the variables entered and
their respective F values. The discriminant function is:
*- 611.7(ADM) - 113.5(PV)** - 127.1(AVHB)** - 131.8(RB)**
+ 2405.1(RN)** + 16.8(80)" - 182.1(RW)** - 1.0(AV}iO)
+ 674.8(AVHV)*
*ignificant at .01**Significant at .10
STEP Ii
-25-
TABLE V
DISCRIMINANT ANALYSIS F SCORES
VARTABLfl F TO ENTER....1.a. v2
TABULAR F('15) TABULAR F(90)
1 ADM 19.27 3 624 2.65 2.10
2 RV 2.39 3 622 2.6E 2.10
3 AVUB 17.24 3 622 2.65 2.10
4 RB 3.72 3 621 2.65 2.10
RN. 80.66 3 620 n/a 2.10
6 RO 10.19 3 619 2.10
7 RW 5.55 3 619 2.10
8 AVHO 8.91 3 61/ 2.10
9 AVHV 6.35 0, 616 2.10
10 APM 2.02 3 615 2.10
11 ACI 1.60 3 614 2.10
12 TSM 1.73 3 613 2.10
13 CPP 0.50 3 612 2.10
14 1'V'.-'p 0.27 3 611 2.10
STEP # - The step number in which the variable was entered in theprogram.
r TO ENTER - The computed F based on a one way analysis of variance.
vl - The number of degrees of freedom in the numerator.
v2- The number of degrees of freedom in the denominator.
TABULAR F(95) - The F value needed for being q5% sure that thevariables we have discriminate correctly.
TABULAR F(90) - The F value needed for 90% surety.

-26-
The relevant critical value of z was found by substituting
the means of W1and W for the 9 variables entered such that:
z1
= - 611.7(2897) - 113.5(6435) - 127.1(4450) - 131.8(5671)
+ 2405.1(633) + 16.8(95501) - 182.1(12433) - 1.0(188284)
674.8(1625)
s'. z1
= - 2,046,223
z2 = - 611.7(7820) - 113.5(40540) - 127.1(44676)
- 131.8(114819) + 2405.1(8674) + 16.8(528939)
- 182.1(37198) - 1.0(587162) + 674.8(4188)
- 4,987,678
+ z2iThe critical value of z is found by z-1-
3,516,950.52
From the linear discriminant function coupled with the critical
z value we are able, with 10 percent surety, to classify a school
district into either a strike or a non-strike school district.
The implication of the discriminant function derived is that
the 'size' factor is of most importance in distinguishing school
districts that have strikes f-omthose that do not. It must he
remembered that all variables that discriminate significantly are
variables that loaded high on factor one which was characterized
as the urbanization factor. This is certainly consistent with the
facts, fo' in Ohio 47.1 percent of all urban areas have had work
stoppages whereas 13.9 percent of suburban areas hive had strikes
and only 7.2 percent of exurban area.; have hid strikes.
since RN(race negro) was- highly positive, moaning that the
-27-
more negross in a school district the more likely that district is
to be classified into W1or non-strike districts.
VI. Conclusions and Recommendations
In our cross-sectional analysis, we have specified the average
salary fol a large sample of Ohio's school districts. Our model
Las overcome a major weakness that was found in the Hall and
Carroll, Kasper andBaird and Landon studies. The results show
that collective bargaining has had a positive but minor impact
on teacher salaries.
Other demographic and socioeconomic variables that probably
could improve our analysis of the impact that collective bar-
gaining is having on teachers' salaries would be: 1) the ratio
of male-female teachers in each school district; 2) the type of
collective bargaining contract in each school district; and 3)
the .average age of male-female teachers in each school district.
Moreover, a longitudinal study would shed considerable information
on this issue since collective bargaining among teachers is rela-
tively new in the nation.
A hypothesis that racial tensions were a major contributor
to strikes would have to be rejected. This lends credence to the
ariTuments that economic motives arc the primary source of unrest
in school district labor relations. The deteriorating financial
position of bedroom type suburbs would lead us to forecase
greater labor strife in suburban districts in future periods.
With increased teacher militancy for more lob security, we can
anticipate more conflict in teacher-school board labor relations.

-28-
Results of the discriminate function analysis might yield
more stable results if we had added in the 1973-74 school year
28 strikes to the file. However, the validity of cross-section
techniques on time influences variables is increasingly doubtful,
particularly with the inflation rates experienced in the past
year.
Since our findings show that the Ferguson Act is ineffective
in prohibiting strikes, Ohio and other states should legalize
plo-die employees' rights to engage in collective bargaining.
Teacher labor relations could be improved in the nation providing
teachers are given the legal right to engage in free collective
bargaining. Once collective bargaining is established in public
education, local school districts could begin to develop labor
relation models that could improve human relations in the field
of education.

REFERENCES
1. New York Times, January 29, 1973, p. 19.
2. Hirschel Kasper, "The Effects of Collective Bargainingon Public School Teachers' Salaries," Industrial andLabor Relations Review, Vol. 24, No. 1 (October 1970),pp. 57-72.
3. Robert J. Thornton, "The Effects of Collective Negotiationson Teachers' Salaries," Quarterly jZeview of Economics andBusiness, Vol. 11, No. 4779.77eT31TT7pp. 3 -46.
4. Robert N. Baird and John H. Landon, "The Effects ofCollective. Bargaining on Public School Teachers' Salaries:Comment," Industrial and Labor. Relations Review, Vol. 25,No. 3 (April 1972), pp. 410-416.
John H. Landon and Robert N. Baird, "Monopsony in theMarket for Public School Teachers," American EconomicReview, Vol. 61, No. 5 (December 1977757966-971.
5. W. Clayton Hall and Norman E. Carrol, "The Effects ofTeachers' Organization on Salaries and Class Sizes,"Industrial and Labor Relations Review, Vol. 26, No. 2
(January 1977, pp. 834-841.
6. David B. Lipsky and John E. Droting, "The Influence ofCollective Bargaining on Teachers' Salaries in New YorkState," Industrial and Labor Relations Review, Vol. 27,No. 1 (October 1973),pp. 18-35.
7. Kasper, 22. cit., p. 72.
8. Baird and Landon, OD. cit., p. 971.
9. Thornton, az. cit., p. 46.
10. Hall and Carrol, op. cit., p. 841.
11. Lipsky and Droting, az. cit., p. 35.
12. Dewy Stollar and Gerald Boardman, Personal Incomes laSchool Districts, Gainsyi.11e: National EducationFinance Project, 1971.
13. Hall and Carrol, op. cit.

REFERENCES (con't)
14. John J. Treacy, Lloyd Frueh, Roger Stevens, and JamesDillehay, An Anal sis la Ohio School District of H.B.1112 (Pease Bill Financing EdEaTnn Croup, WorkingPaper #7, Wright State University, 1972, p. 50.
15. See Appendix A.
16. Hall and Carrol, 22. cit.

BIBLIOGRAPHY
Baird, Robert N. and Landon, John H. "The Effects of CollectiveBargaining on Public School Teachers' Salaries: Comment," indus-trial and Labor Relations Review, Vol. 25, No. 3 (April 1972) , pp.410-416.
Hall, W. Clayton and Carrol, Norman E. "The Effects of Teachers'Organization on Salaries and Class Sizes," Industrial and LaborRelations Review, Vol. 26, No. 2 (January 19773) pp. 834=8417---
Kasper, Hirschel "The Effects of Collective Bargaining on PublicSchool Teachers' Salaries," Industrial and Labor Relations Re-view, Vol. 24, No. 1 (October 1970), pp. 57-72.
Landon, John E. and Baird, Robert N. "Monopsony in the Marketfor Public School Teachers," American Economic Review, Vol. 61,No. 5 (December 1971), pp. 966-971.
Lipsky, David B. and Droting, John E. "The Influence of CollectiveBargaining on Teachers' Salaries in New York State," Industrialand Labor Relations Review, Vol. 27, No. 1 (October 1973 T7Thp. 18-35.
New York Times, January 29, 1973, p. 19.
Stollar, Dewy and Boardman, Gerald Personal Incomes SchoolDistricts, Gainsville: National Education Finance-Froject, 1971.
Thornton, Robert J. "The Effects of Collective Negotiations on7.?achers' Salaries," Quarterly Review of Economics and Business,Vol. 11, No. 4 (Winter 1971), pp. 37 -46.
Th-edcy, John j. , Trueh, Lloyd, Stevens, Roger and Dillehay, JamesAn Analysis; Ly Ohio School. District of H. B. 1112 (Pease Bill),rindncing EducaTT Group, Working Paper 717,77Tight State Univer-sIty, 1972, r 50.

APPENDIX A
PUBLIC EVLOYEE LABOR RELATIONSSURVEY IN OHIO
Dr. Charles H. Blake, Jr.Department of EconomicsWright State UniversityDayton, Ohio 45431
1. Names of Public employee organizations in your district:
Name of Organization
a.
rea r Organized,
November 1, 1972
Is there a written contract?Yes No
c,
d.
2. Specify nature of issues, if any, leading to organization of employees.
3. Number of employees in each targaining unit: 1q71 1(1/1 117.,
R. Profeciional teaching staVf
b. Non-teaching staff (clerical, custodial,lunchroom and maintenance)
1111.11 ..1
4. Fercent of eliglUe employees belon,..;ing to ear.th Lu l.:ning unit in 1;72:
1QT.7!
Profe....7.11 ,itaff
b. Non-teachin3 staff
5. kre princl7als :n4 x..:rinter.4.r.ts to prnfeJI;lc-141 staff, anifor 4..,c! sfAf
b. Non-teaching staff

6. Do your contracts provide for dues deduction?
Yes
a. Professional teaching staff
b. Non-teaching staff
7. Is a grievance procedure provided for in your existing contracts?
No
1111M1
.11111111111M0
Yes No
a. Professional teaching staff
b. Non-teaching staff
8. Which of the following are provided in the grieance procedure to resolve anyday-to-day insure that may develop?
Profe3sicnIA teaching staff Non- te..t hint taff-a. arbItratioa a. arbitration
b. mediation b. mediaticz
c.
d. othr (F7e.7.Lfy)
c.
1. :,*-_h!r (..;-1-rzi (V)
9. ii-syra t::'-re been any i moo. -;:,off")
a. Profes:I:nnal- t...11.:hirg staff
b. N...-1-'.r.v:hin;; staff
10. Ifow were P. ,f ,..,;, ,. , , I
with
(*.
d. with
e. tp
h.
,1 p !. ! :..;k. t;! (:.:'
- --
U. 'What r-:..1.! , if r2..r.y :el -;) t:1:" u..-. or =r Lvirsr t'v.3 A :t yr WA-, !z 'a.

44;$1 Caleko.494
r,
3
12. That procedures were used to reinatate any of the individuals or the bargainingunit for violating a "no strike" agreement? specify.
13. Which of the procedures listed in Question 10 are provided in each existingcontract to resolve work stoppages, strikes cr any impasse that may occur?
a. Professional teaching staff
b. Non-teaching staff
5122ify Proce(lures
IIMIEMENne.
ft
111=r
1=061MIIIIN
14. Specify any changes you would recommend to the Fersu,s.m Act,
15. Pl'lesA send a COW of each contract wit;. vmr em71c7oW laorif cne e::tzts.
16. Do you want a copy of the survey report? To whom should it be sent?
17. Name of your school district:
yo.1 for completing this sisvey for
AYR