college employee satisfaction survey - chula vista, california · 2019-10-23 · college employee...
TRANSCRIPT

College Employee Satisfaction Survey
SPRING 2015
Prepared by the Office of Institutional Effectiveness, Institutional Research Unit
College Employee Satisfaction Survey Spring 2015
Table of Contents
Introduction
Survey Themes, Contents, and Rating Scales ........................................................................................... 1
Understanding the Survey Results ................................................................................................................. 3
Key Findings
Section 1: Campus Culture and Policies ................................................................................................... 5
Section 2: Institutional Goals .................................................................................................................... 5
Section 3: Involvement in Planning and Decision-Making ....................................................................... 6
Section 4: Work Environment .................................................................................................................. 6
Overall Satisfaction ................................................................................................................................... 7
Institutional Comparison Group List .............................................................................................................. 8
Respondent Demographics ............................................................................................................................ 10
Section 1: Campus Culture and Policies ......................................................................................................... 11
Section 1.A
Table 1: Importance and Satisfaction Descriptives, Gap Scores,
& Year-to-Year Comparisons of Gap Ranking................................................................................ 12
Table 2: Statistical Comparison of Importance and Satisfaction Ratings
Between Southwestern College and Comparison Group ............................................................... 14
Section 1.B
Campus Culture and Policies, Tables and Charts ............................................................................... 16
Section 2: Institutional Goals ......................................................................................................................... 25
Table 3: Importance Rating Descriptives ........................................................................................... 26
Table 4: Means and Mean Change of Importance Scores from
Spring 2014 to Spring 2015 ........................................................................................................... 26
Figure 1: Bar chart of Mean Change of Importance Scores from Spring 2014
to Spring 2015 ............................................................................................................................... 27
Table 5: Statistical Comparison of Importance Scores between
Southwestern College and Comparison Group .............................................................................. 28
Table 6: Weighted Priority Ranking of Institutional Goals from Spring 2014
to Spring 2015 ............................................................................................................................... 28
Figure 2: Bar chart of Weighted Priority Ranking of Institutional Goals from Spring 2014
to Spring 2015 ............................................................................................................................... 29
Section 3: Involvement in Planning and Decision-Making ............................................................................ 30
Table 7: Involvement Rating Descriptives .......................................................................................... 31
Table 8: Statistical Comparison of Involvement Ratings between
Southwestern College and Comparison Group .............................................................................. 31
Table 9: Distance Scores & Change from Spring 2014 to Spring 2015 ............................................... 31

College Employee Satisfaction Survey Spring 2015
Figure 3: Bar chart of Involvement Distance Scores from Spring 2014 to Spring 2015 ..................... 32
Section 4: Work Environment ........................................................................................................................ 33
Section 4.A
Table 10: Importance and Satisfaction Descriptives, Gap Scores,
& Year-to-Year Comparison of Gap Ranking ................................................................................. 34
Table 11: Statistical Comparison of Importance and Satisfaction Ratings
Between Southwestern College and Comparison Group ............................................................... 35
Section 4.B
Work Environment, Tables and Charts .............................................................................................. 36
Overall Satisfaction ........................................................................................................................................ 43
Table 12: Descriptives, Spring 2015 ................................................................................................... 43
Table 13: Means and Mean Change from Spring 2014 to Spring 2015 ............................................. 43
Table 14: Statistical Comparison of Overall Satisfaction Ratings
Between Southwestern College and Comparison Group ............................................................... 43
Survey Instrument
Ruffalo Noel-Levitz College Employee Satisfaction Survey ................................................................ 44
Open-Ended Response Summaries .............................................................................................................. 49

College Employee Satisfaction Survey Spring 2015
1
Introduction
Survey Themes, Contents, and Rating Scales1 The College Employee Satisfaction Survey (CESS), created and administered by Ruffalo Noel-Levitz, is designed to assess the campus environment for all college employees (faculty, staff, and administration) on various workplace themes, including interdepartmental communication, campus mission, institutional goals, and decision-making. The survey allows employees the opportunity to contribute their opinions and concerns regarding the workplace environment and institution in general. The College Employee Satisfaction Survey Report is divided into several sections:
Respondent Demographics
Section 1: Campus Culture and Policies
Section 2: Institutional Goals
Section 3: Involvement in Planning and Decision-Making
Section 4: Work Environment
Overall Satisfaction In Section 1, Campus Culture and Policies, respondents were asked to rate thirty-five survey items related to campus culture and college policy in terms of importance and satisfaction. The original version of the survey includes thirty core items within Section 1. Southwestern College’s Office of Research, Grants, and Planning provided an additional five items specific to our institutional environment:
This institution’s leadership demonstrates support for shared planning and decision-making.
This institution’s leadership creates an environment that promotes trust and respect.
The Superintendent/President makes timely and informed decisions.
The Governing Board does a good job implementing policy initiatives.
This institution does a good job communicating budget decision-making processes. The following five-point Likert scale was used for both importance and satisfaction ratings:
Importance and Satisfaction Rating Scale
Importance Rating Numerical Value Satisfaction Rating
Very important 5 Very satisfied
Important 4 Satisfied
Somewhat Important 3 Somewhat Satisfied
Not very important 2 Not very satisfied
Not important at all 1 Not satisfied at all
In Section 2, Institutional Goals, respondents were asked to rate the importance of nine distinct institutional goals and to then select three of those goals as Southwestern College’s top priorities. This section also included one open-ended question, “What other institutional goals do you think are important? Please describe them in the space below.”
1 Source: Ruffalo Noel Levitz Interpretive Guide
College Employee Satisfaction Survey Spring 2015
2
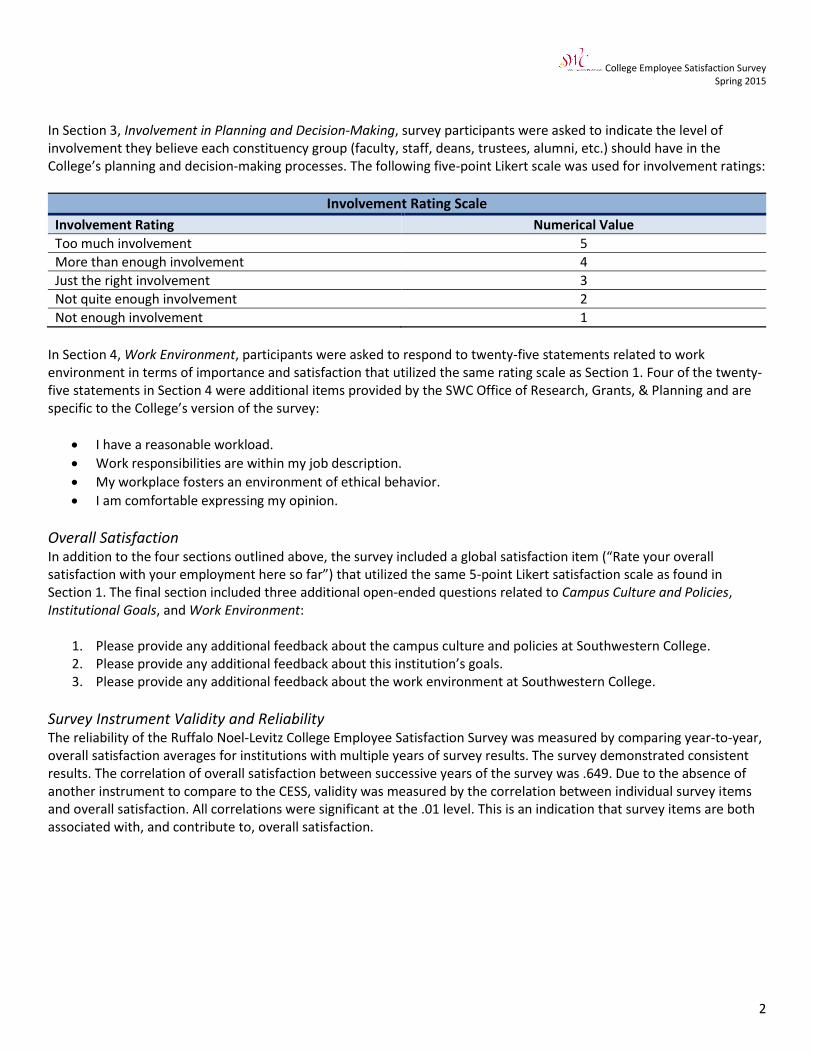
In Section 3, Involvement in Planning and Decision-Making, survey participants were asked to indicate the level of involvement they believe each constituency group (faculty, staff, deans, trustees, alumni, etc.) should have in the College’s planning and decision-making processes. The following five-point Likert scale was used for involvement ratings:
Involvement Rating Scale
Involvement Rating Numerical Value
Too much involvement 5
More than enough involvement 4
Just the right involvement 3
Not quite enough involvement 2
Not enough involvement 1
In Section 4, Work Environment, participants were asked to respond to twenty-five statements related to work environment in terms of importance and satisfaction that utilized the same rating scale as Section 1. Four of the twenty-five statements in Section 4 were additional items provided by the SWC Office of Research, Grants, & Planning and are specific to the College’s version of the survey:
I have a reasonable workload.
Work responsibilities are within my job description.
My workplace fosters an environment of ethical behavior.
I am comfortable expressing my opinion.
Overall Satisfaction In addition to the four sections outlined above, the survey included a global satisfaction item (“Rate your overall satisfaction with your employment here so far”) that utilized the same 5-point Likert satisfaction scale as found in Section 1. The final section included three additional open-ended questions related to Campus Culture and Policies, Institutional Goals, and Work Environment:
1. Please provide any additional feedback about the campus culture and policies at Southwestern College. 2. Please provide any additional feedback about this institution’s goals. 3. Please provide any additional feedback about the work environment at Southwestern College.
Survey Instrument Validity and Reliability The reliability of the Ruffalo Noel-Levitz College Employee Satisfaction Survey was measured by comparing year-to-year, overall satisfaction averages for institutions with multiple years of survey results. The survey demonstrated consistent results. The correlation of overall satisfaction between successive years of the survey was .649. Due to the absence of another instrument to compare to the CESS, validity was measured by the correlation between individual survey items and overall satisfaction. All correlations were significant at the .01 level. This is an indication that survey items are both associated with, and contribute to, overall satisfaction.

College Employee Satisfaction Survey Spring 2015
3
Understanding the Survey Results
Statistical Terminology An important component of this report is the use of the mean and standard deviation (SD) of aggregated survey responses. The mean, or average, is derived by summing scores on a particular survey item and dividing by the total count of responses. Within context of an individual survey item, standard deviation is a measure of the relative dispersion of scores. Interpretation of standard deviation is important for understanding the distribution of survey item data. A large standard deviation indicates greater variability in scores around the mean, while a smaller value denotes a tighter distribution of scores, or, in this case, stronger agreement among responses. Statistical significance refers to the likelihood that an observed result or relationship does not occur by chance, and would likely occur again if testing were repeated. The role of the p-value and alpha level in the determination of statistical significance is a ubiquitous aspect of statistical research. In practice, a p-value under five percent is strong evidence, but not absolute proof, that a given result is statistically significant and the result of a systematic effect. In essence, p-values assist in the determination of whether observed differences across mean survey scores are too great to have simply occurred by chance. In this report, one asterisk (*) signifies a p-value of .05, meaning that the two scores are significantly different and such a difference would only be due to change 5% of the time. Two asterisks (**) signify a p-value of .01, meaning the two scores are significantly different and that such a difference would only occur by change 1% of the time. Finally, three asterisks (***) signify a p-value of .001, meaning that the two scores are significantly different and such a difference would only be due to chance 0.1% of the time.
Calculating the Performance Gap Means for importance and satisfaction ratings for individual items are calculated by summing all respondent ratings and dividing by the number of valid respondents. Performance gap means are calculated by taking the difference between the (mean) importance rating and the (mean) satisfaction rating. A large performance gap value indicates a large disparity between employee ratings of importance and their level of satisfaction for a given survey item.
Institutional Comparison Groups As part of its survey administration service, Ruffalo Noel-Levitz provides a complimentary comparison report of our survey results to a master list of like institutions. Currently, the list is composed of thirty-five two-year, public colleges across the country (see Page 6, “Institution Comparison Groups,” for the list of colleges included in questionnaire item comparisons). Each section of this report includes a table of significant mean differences between Southwestern College ratings and the comparison group ratings. Items identified as being “statistically significant” denote a substantive statistical difference between the mean (average) scores of Southwestern College items and the average scores of comparison institutions. It is important to note that all statistical analyses in this report utilized questionnaire prompts that were original to the Ruffalo Noel-Levitz survey; consequently, questionnaire items added by the SWC Office of Research, Grants, & Planning are excluded from statistical analysis with comparison institutions.
Year-to-Year Comparisons This year marks the second administration of the Employee Satisfaction survey hosted by the company, Ruffalo Noel-Levitz. As a result, we will be able to compare survey results longitudinally to illustrate improvements, or lack thereof, made by the college in response to last year’s findings. Year-to-year comparisons will be included in the majority of the results sections in this report.
College Employee Satisfaction Survey Spring 2015
4
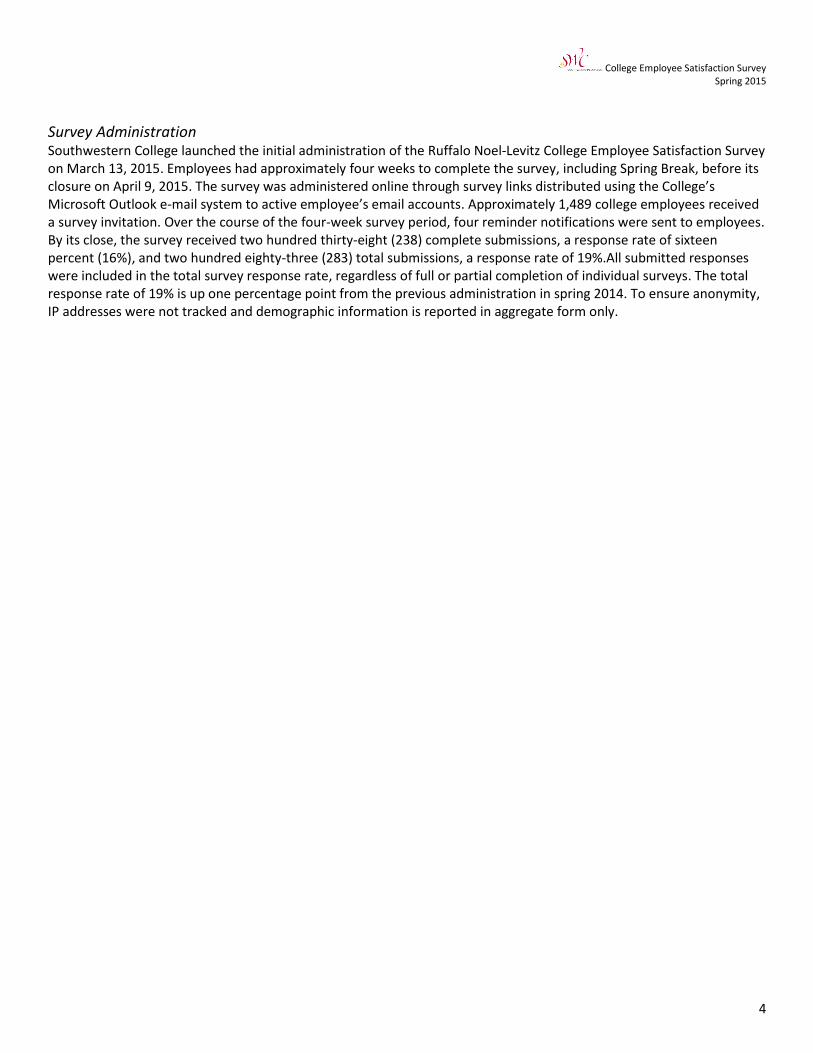
Survey Administration Southwestern College launched the initial administration of the Ruffalo Noel-Levitz College Employee Satisfaction Survey on March 13, 2015. Employees had approximately four weeks to complete the survey, including Spring Break, before its closure on April 9, 2015. The survey was administered online through survey links distributed using the College’s Microsoft Outlook e-mail system to active employee’s email accounts. Approximately 1,489 college employees received a survey invitation. Over the course of the four-week survey period, four reminder notifications were sent to employees. By its close, the survey received two hundred thirty-eight (238) complete submissions, a response rate of sixteen percent (16%), and two hundred eighty-three (283) total submissions, a response rate of 19%.All submitted responses were included in the total survey response rate, regardless of full or partial completion of individual surveys. The total response rate of 19% is up one percentage point from the previous administration in spring 2014. To ensure anonymity, IP addresses were not tracked and demographic information is reported in aggregate form only.
College Employee Satisfaction Survey Spring 2015
5
Key Findings
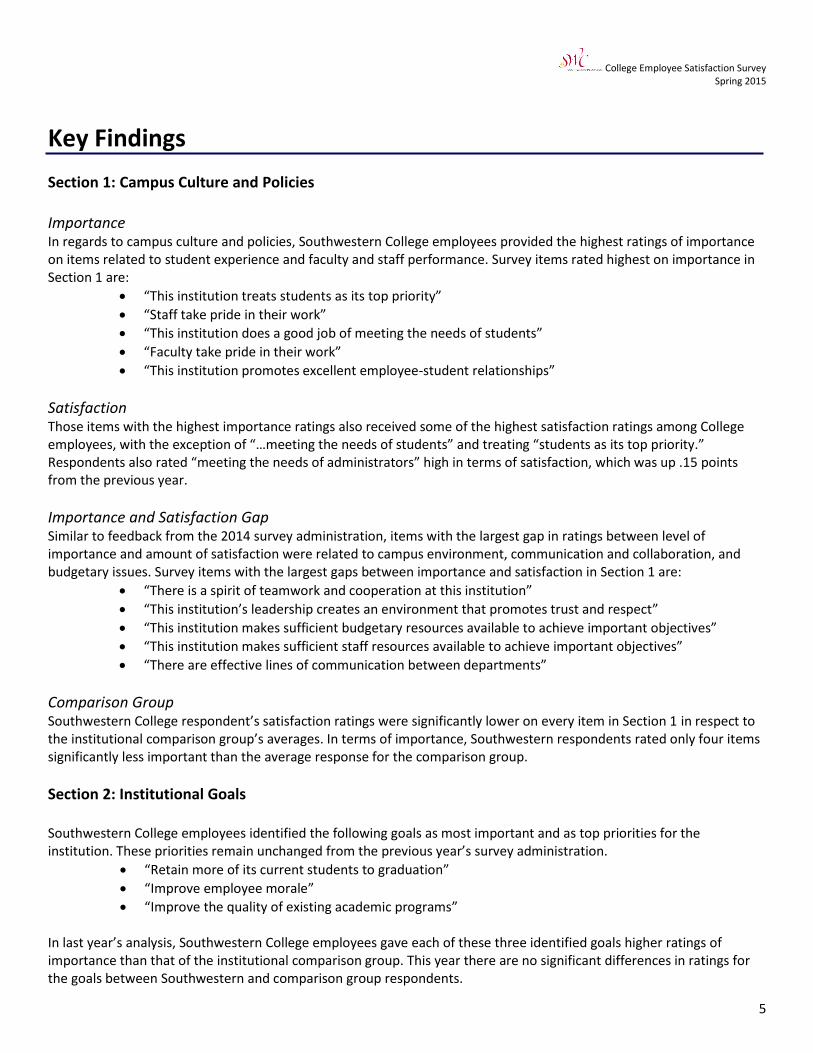
Section 1: Campus Culture and Policies Importance In regards to campus culture and policies, Southwestern College employees provided the highest ratings of importance on items related to student experience and faculty and staff performance. Survey items rated highest on importance in Section 1 are:
“This institution treats students as its top priority”
“Staff take pride in their work”
“This institution does a good job of meeting the needs of students”
“Faculty take pride in their work”
“This institution promotes excellent employee-student relationships”
Satisfaction Those items with the highest importance ratings also received some of the highest satisfaction ratings among College employees, with the exception of “…meeting the needs of students” and treating “students as its top priority.” Respondents also rated “meeting the needs of administrators” high in terms of satisfaction, which was up .15 points from the previous year.
Importance and Satisfaction Gap Similar to feedback from the 2014 survey administration, items with the largest gap in ratings between level of importance and amount of satisfaction were related to campus environment, communication and collaboration, and budgetary issues. Survey items with the largest gaps between importance and satisfaction in Section 1 are:
“There is a spirit of teamwork and cooperation at this institution”
“This institution’s leadership creates an environment that promotes trust and respect”
“This institution makes sufficient budgetary resources available to achieve important objectives”
“This institution makes sufficient staff resources available to achieve important objectives”
“There are effective lines of communication between departments”
Comparison Group Southwestern College respondent’s satisfaction ratings were significantly lower on every item in Section 1 in respect to the institutional comparison group’s averages. In terms of importance, Southwestern respondents rated only four items significantly less important than the average response for the comparison group.
Section 2: Institutional Goals Southwestern College employees identified the following goals as most important and as top priorities for the institution. These priorities remain unchanged from the previous year’s survey administration.
“Retain more of its current students to graduation”
“Improve employee morale”
“Improve the quality of existing academic programs”
In last year’s analysis, Southwestern College employees gave each of these three identified goals higher ratings of importance than that of the institutional comparison group. This year there are no significant differences in ratings for the goals between Southwestern and comparison group respondents.

College Employee Satisfaction Survey Spring 2015
6
Section 3: Involvement in Planning and Decision-Making Relatively consistent with last year’s ratings, when survey respondents were asked about constituency groups’ involvement in planning and decision-making, the following groups were ranked based on averages scores in order from “too much involvement” to “not enough involvement:”
Senior administrators
Deans or directors of administrative units
Deans or directors of academic units
Trustees
Academic Senate
Faculty
Staff
Students
Alumni All involvement ratings for constituency groups were significantly different from institutional comparison group ratings, with the exception of trustees, students, and staff. Of those ratings that were significantly different, Southwestern College respondents rated senior administrators, deans or directors of administrative units, deans or chairs of academic units, and faculty higher in involvement than the comparison group. The only group that Southwestern respondents rated significantly lower than the comparison group was alumni.
Section 4: Work Environment
Importance In regards to work environment, Southwestern College employees provided the highest ratings of importance on items related to the value of the work that is done at the College and compensation and employee benefits. Survey items rated highest on importance in Section 4 are:
“The type of work I do on most days is personally rewarding”
“The work I do is valuable to the institution”
“I am proud to work at this institution”
“The employee benefits available to me are valuable”
“I am paid fairly for the work I do”
Satisfaction Those items with the highest importance ratings also received some of the highest satisfaction ratings among Southwestern College employees, with the exception of items related to compensation and benefits.
Importance and Satisfaction Gap Similar to feedback from the 2014 survey administration, items with the largest gap in ratings between level of importance and amount of satisfaction were related to fiscal needs, personnel support, job advancement, and information sharing. Salary compensation seems to be slightly less of a concern as compared to last year. “I am paid fairly for the work I do” had one of the largest gaps in the 2014 survey administration and this year sits sixth in rank. Survey items with the largest gaps between importance and satisfaction in Section 4 are:
“My department has the staff needed to do its job well”
“My department has the budget needed to do its job well”
“I have adequate opportunities for advancement”
“It is easy for me to get information at this institution”

College Employee Satisfaction Survey Spring 2015
7
Comparison Group Southwestern College respondents’ satisfaction ratings were significantly lower on every item in Section 4 when compared to the comparison group’s averages, with the exception of two items: “I am paid fairly for the work I do” and “The type of work I do on most days is personally rewarding.” In terms of importance, Southwestern respondents rated only two items significantly less important than the average response for the comparison group: “I have the information I need to do my job well” and “My supervisor pays attention to what I have to say.”
Overall Satisfaction Satisfaction Lastly, respondents were asked to rate their overall satisfaction with their employment at Southwestern College so far. In the current survey administration, overall satisfaction fell between “Somewhat satisfied” and “Satisfied” (M = 3.65). This was a moderate improvement from the previous year, though the difference between spring 2014 and spring 2015 was not statistically significant.
Comparison Group Southwestern College respondents’ overall satisfaction rating was significantly lower compared to the institutional comparison group’s satisfaction rating.

College Employee Satisfaction Survey Spring 2015
8
Institutional Comparison Group List
Comparison Institutions* Type of Institution Location
Aims Community College 2-year, Public Colorado
Arizona Western College 2-year, Public Arizona
Broome Community College 2-year, Public New York
Butler Community College 2-year, Public Kansas
Cascadia Community College 2-year, Public Washington
Central Ohio Tech 2-year, Public Ohio
College of the Redwoods Ɨ 2-year, Public California
Community College of Beaver County 2-year, Public Pennsylvania
Cowley County Community College 2-year, Public Kansas
Eastern Gateway Community College 2-year, Public Ohio
Georgia Military College 2-year, Public Georgia
Greenville Technical College 2-year, Public South Carolina
Kankakee Community College 2-year, Public Illinois
Kishwaukee College 2-year, Public Illinois
Lakeland College AB 2-year, Public Wisconsin
Lakeshore Technical College 2-year, Public Wisconsin
Laramie County Community College Ɨ 2-year, Public Wyoming
Laredo Community College 2-year, Public Texas
Marion Technical College Ɨ 2-year, Public Ohio
Minneapolis Community and Technical College 2-year, Public Minnesota
Montcalm Community College 2-year, Public Michigan
Mountain View College Ɨ 2-year, Public Texas
Mountwest Community & Technical College 2-year, Public West Virginia
Mt Hood Community College Ɨ 2-year, Public Oregon
Murray State College 2-year, Public Oklahoma
New Mexico Junior College 2-year, Public New Mexico
New Mexico State University - Carlsbad 2-year, Public New Mexico
Normandale Community College 2-year, Public Minnesota
North Dakota State College of Science Ɨ 2-year, Public North Dakota
Northeast Iowa Community College Ɨ 2-year, Public Iowa
Northeast State Community College 2-year, Public Tennessee
Northern Oklahoma College Ɨ 2-year, Public Oklahoma
Northwest Arkansas Community College Ɨ 2-year, Public Arkansas
Northwest Iowa Community College 2-year, Public Iowa
Northwest Technical College 2-year, Public Minnesota
Ogeechee Technical College 2-year, Public Georgia
Parkland College Ɨ 2-year, Public Illinois
Piedmont Technical College 2-year, Public South Carolina
Rhodes State College 2-year, Public Ohio

College Employee Satisfaction Survey Spring 2015
9
Comparison Institutions* Type of Institution Location
Santa Fe Community College 2-year, Public Florida
Southwest Wisconsin Technical College 2-year, Public Wisconsin
Tri-County Technical College 2-year, Public South Carolina
Trident Technical College 2-year, Public South Carolina
Western Technical College 2-year, Public Wisconsin
Wisconsin Indianhead Technical College 2-year, Public Wisconsin
* All comparison institution data collected within the last three years
Ɨ College added to Comparison Group as of 2015.

College Employee Satisfaction Survey Spring 2015
10
Respondent Demographics
As illustrated in the tables below, Southwestern College survey respondents, in comparison to similar 2-year, public
institutions, are employees who have been working at the College longer and are comprised of slightly more faculty
positions and fewer full-time positions. As compared to the distribution of all Southwestern College employees, survey
respondents are comprised of substantially more administrators (12% of respondents, 2% of all SWC employees) and
classified staff (37% of respondents, 29% of all SWC employees). Additionally, though faculty make up about 69% of
employees at Southwestern College, they only represented about 50% of survey respondents.
How long have you worked at this institution? SWC
Count SWC
Percent Comparison
Count Comparison
Percent
Less than 1 year 18 7.6% 1,070 7.9%
1 to 5 years 35 14.7% 4,084 30.2%
6 to 10 years 41 17.2% 3,184 23.5%
11 to 20 years 96 40.3% 3,387 25.0%
More than 20 years 48 20.2% 1,812 13.4%
All responses 238 100.0% 13,537 100.0%
Is your position: SWC
Count SWC
Percent Comparison
Count Comparison
Percent
Faculty 121 50.8% 5,710 44.0%
Staff 88 37.0% 5,869 45.2%
Administrator 29 12.2% 1,397 10.8%
All responses 238 100.0% 12,976 100.0%
Is your position: SWC
Count SWC
Percent Comparison
Count Comparison
Percent
Full-time 180 75.6% 10,466 83.6%
Part-time 58 24.4% 2,056 16.4%
All responses 238 100.0% 12,522 100.0%
College Employee Satisfaction Survey Spring 2015
11
Section 1: Campus Culture and Policies
Section 1.A
Table 1. Campus Culture and Policies: Importance and Satisfaction Descriptives, Gap Scores, & Year-to-Year
Comparison of Gap Ranking
Table 2. Campus Culture and Policies: Statistical Comparison of Importance and Satisfaction Ratings between
Southwestern College and Comparison Group
Section 1.B
Tables and bar charts for importance and satisfaction mean changes from 2014 to 2015
Section 1.A presents response data for the first thirty-five items of the 2015 CESS and addresses employee attitudes
toward campus culture and college policy. The first data table (Table 1) includes descriptive statistics for both the
importance and satisfaction ratings of each item, as well as performance gap analysis of the two aforementioned
categories. Descriptive statistics include the mean, standard deviation (“SD”), and the valid number of responses
tallied for each item (“n”). Please see Statistical Terminology on page 2 for further clarification of statistics.
Performance gap analysis is a method used to determine the amount of disparity between the average level of
importance and the average level of satisfaction for a given survey item. The items in this table have been ranked by
gap size, from largest to smallest. Large gaps (items near the top of the list) indicate substantial differences in ratings
of importance and levels of satisfaction, and signify areas of weakness in regard to employee satisfaction. Items
toward the end of the list require less attention, as they are better balanced between the two ratings. Gap rankings
for both 2014 and 2015 results are included to illustrate changes in attitudes from the previous year and are available
in Table 1.
The second table in Section 1.A (Table 2) provides a comparison of importance and satisfaction ratings between
Southwestern College and the institutional comparison group. This analysis includes only the survey items provided in
the original version of the Ruffalo Noel-Levitz questionnaire, and does not include additional items specific to the
Southwestern College version of the survey (items 31 through 35). Item averages that significantly differed between
our College and the comparison group are highlighted in beige (dark beige for importance; light beige for satisfaction)
and marked with one, two, or three asterisks, depending on significance level. Please see Statistical Terminology on
page 2 for further clarification of significance testing.
Section 1.B provides graphical and tabular information for each survey item. These charts allow for comparison
between importance and satisfaction ratings, changes in these ratings from 2014 to 2015, and provide more detailed
information regarding the change in gap scores from year to year.

College Employee Satisfaction Survey Spring 2015
12
SECTION 1.A
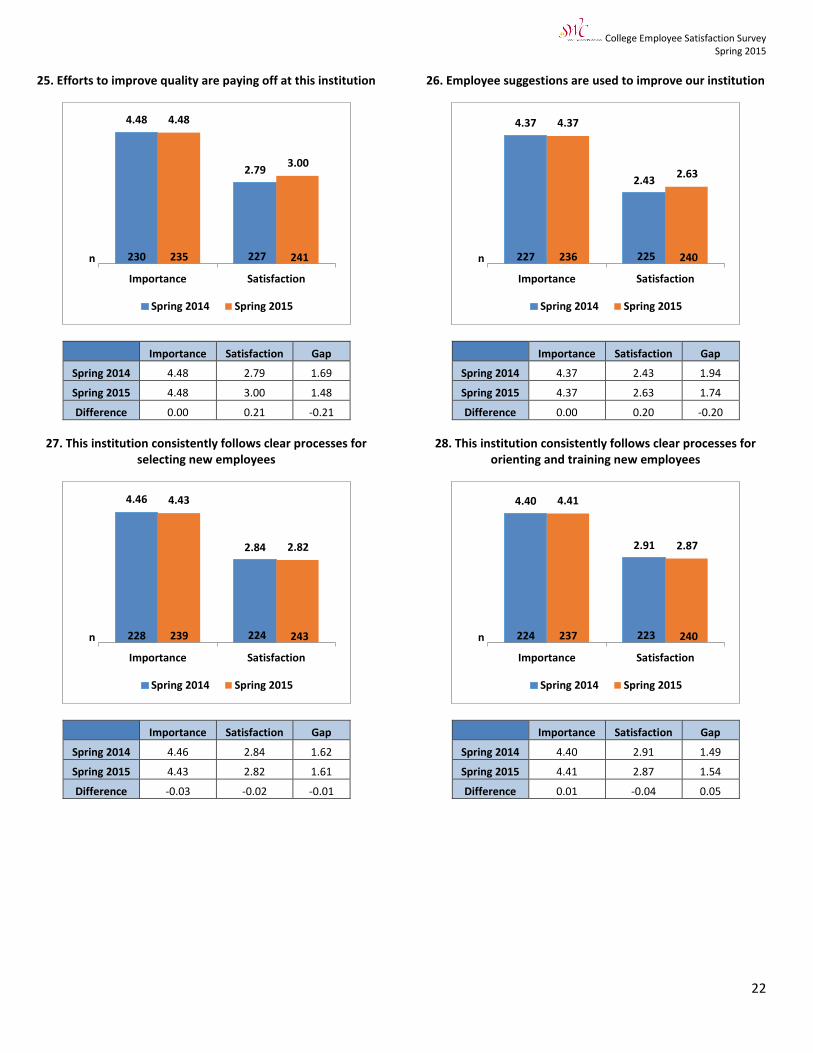
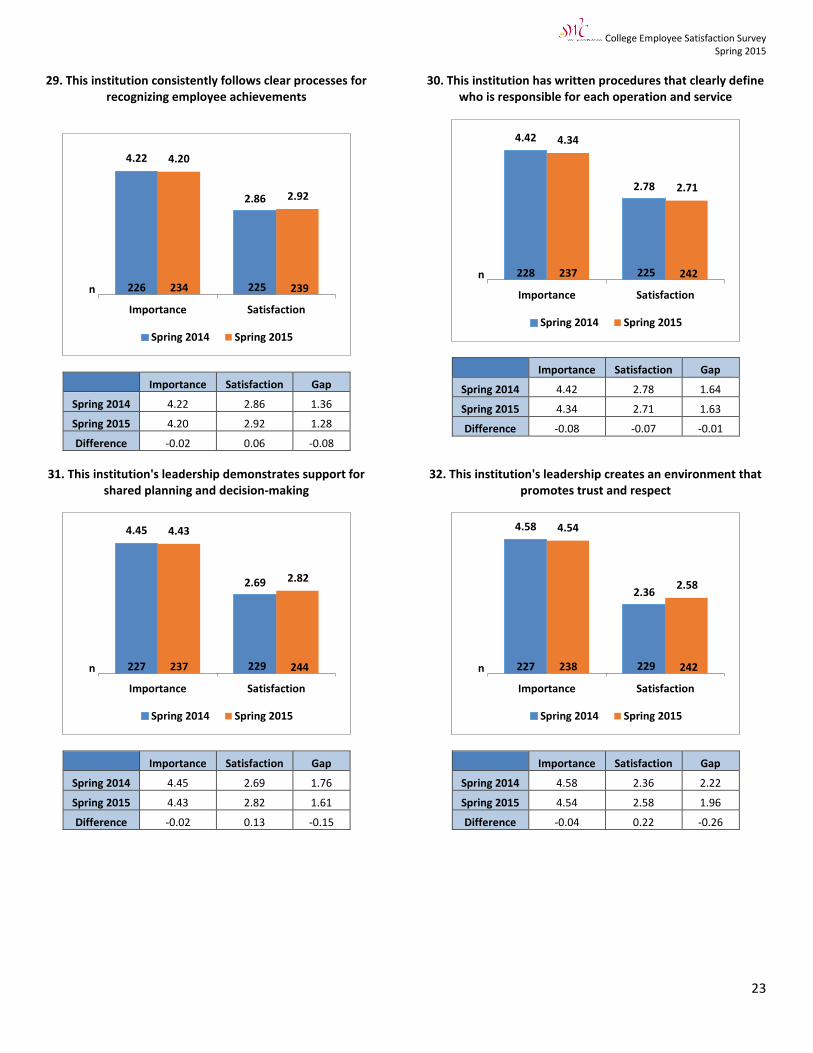
Table 1. Campus Culture and Policies: Importance and Satisfaction Descriptives, Gap Scores, & Year-to-Year Comparison of Gap Ranking
2015 Gap Rank
2014 Gap Rank
Statements Rated on Importance and Satisfaction Scales (Score of 1: “Not important/Not satisfied at all” / Score of 5: “Very important/Very satisfied”)
IMPORTANCE SATISFACTION Gap
Mean SD n Mean SD n
1 1 There is a spirit of teamwork and cooperation at this institution 4.54 0.82 241 2.54 1.17 246 2.00
2 2 This institution’s leadership creates an environment that promotes trust and respect Ɨ 4.54 0.77 238 2.58 1.24 242 1.96
3 3 This institution makes sufficient budgetary resources available to achieve important objectives 4.52 0.77 271 2.73 1.12 277 1.79
4 8 This institution makes sufficient staff resources available to achieve important objectives 4.48 0.77 273 2.71 1.10 279 1.77
5 10 There are effective lines of communication between departments 4.30 0.83 240 2.53 1.06 246 1.77
6 6 This institution plans carefully 4.51 0.77 273 2.74 1.20 281 1.77
7 7 Employee suggestions are used to improve our institution 4.37 0.80 236 2.63 1.14 240 1.74
8 12 Administrators share information regularly with faculty and staff 4.46 0.74 240 2.75 1.14 245 1.71
9 4 There is good communication between the faculty and the administration at this institution 4.42 0.78 236 2.76 1.08 241 1.66
10 5 The institution does a good job communicating its budget decision-making processes Ɨ 4.43 0.83 235 2.78 1.16 243 1.65
11 13 The leadership of this institution has a clear sense of purpose 4.51 0.80 271 2.87 1.25 278 1.64
12 11 This institution is well-respected in the community 4.57 0.73 237 2.94 1.20 243 1.63
13 24 This institution has written procedures that clearly define who is responsible for each operation and service 4.34 0.84 237 2.71 1.13 242 1.63
14 15 There is good communication between staff and the administration at this institution 4.41 0.81 232 2.79 1.10 242 1.62
15 25 This institution consistently follows clear processes for selecting new employees 4.43 0.81 239 2.82 1.23 243 1.61
16 18 This institution’s leadership demonstrates support for shared planning and decision-making Ɨ 4.43 0.75 237 2.82 1.21 244 1.61
17 16 This institution does a good job of meeting the needs of staff 4.41 0.85 271 2.83 1.09 274 1.58
18 27 This institution consistently follows clear processes for orienting and training new employees 4.41 0.81 237 2.87 1.13 240 1.54
19 20 This institution treats students as its top priority 4.68 0.65 280 3.14 1.16 283 1.54
20 9 The reputation of this institution continues to improve 4.50 0.76 241 2.97 1.20 244 1.53
21 17 This institution involves its employees in planning for the future 4.41 0.79 274 2.90 1.20 279 1.51
22 21 Efforts to improve quality are paying off at this institution 4.48 0.72 235 3.00 1.15 241 1.48
23 23 This institution does a good job of meeting the needs of students 4.62 0.66 278 3.16 1.06 282 1.46
24 14 This institution does a good job of meeting the needs of its faculty 4.42 0.84 274 2.97 1.12 277 1.45
25 22 The Superintendent/President makes timely and informed decisions Ɨ 4.52 0.75 235 3.19 1.18 242 1.33
26 19 The Governing Board does a good job implementing policy initiatives Ɨ 4.49 0.74 233 3.18 1.10 237 1.31
27 31 This institution consistently follows clear processes for recognizing employee achievements 4.20 0.88 234 2.92 1.11 239 1.28

College Employee Satisfaction Survey Spring 2015
13
SECTION 1.A
Table 1. Campus Culture and Policies: Importance and Satisfaction Descriptives, Gap Scores, & Year-to-Year Comparison of Gap Ranking
2015 Gap Rank
2014 Gap Rank
Statements Rated on Importance and Satisfaction Scales (Score of 1: “Not important/Not satisfied at all” / Score of 5: “Very important/Very satisfied”)
IMPORTANCE SATISFACTION Gap
Mean SD n Mean SD n
28 26 Administrators take pride in their work 4.56 0.70 233 3.29 1.14 238 1.27
29 29 This institution promotes excellent employee-student relationships 4.61 0.70 279 3.37 0.98 281 1.24
30 28 The goals and objectives of this institution are consistent with its mission and values 4.36 0.80 271 3.18 1.10 277 1.18
31 30 The mission, purpose, and values of this institution are well understood by most employees 4.29 0.79 278 3.12 1.07 278 1.17
32 32 Most employees are generally supportive of the mission, purpose, and values of this institution 4.33 0.78 274 3.25 1.01 278 1.08
33 33 Faculty take pride in their work 4.62 0.59 238 3.69 0.94 242 0.93
34 34 Staff take pride in their work 4.63 0.62 235 3.70 0.98 243 0.93
35 35 This institution does a good job of meeting the needs of administrators 4.18 0.91 267 3.58 1.09 272 0.60
† Item is unique to Southwestern College’s version of the survey.

College Employee Satisfaction Survey Spring 2015
14
SECTION 1.A
Table 2. Campus Culture and Policies: Statistical Comparison of Importance and Satisfaction Ratings between Southwestern College and Comparison Group
Statements Rated on Importance and Satisfaction Scales (Score of 1: “Not important/Not satisfied at all” / Score of 5: “Very important/Very satisfied”)
SOUTHWESTERN COMPARISON GROUP Significance
IMP Mean
SAT Mean
Gap IMP
Mean SAT
Mean Gap IMP SAT
This institution promotes excellent employee-student relationships 4.61 3.37 1.24 4.62 3.76 0.87 NS ***
This institution treats students as its top priority 4.68 3.14 1.54 4.70 3.70 1.01 NS ***
This institution does a good job of meeting the needs of students 4.62 3.16 1.46 4.68 3.65 1.03 NS ***
The mission, purpose, and values of this institution are well understood by most employees 4.29 3.12 1.18 4.35 3.55 0.80 NS ***
Most employees are generally supportive of the mission, purpose, and values of this institution 4.33 3.25 1.08 4.37 3.61 0.76 NS ***
The goals and objectives of this institution are consistent with its mission and values 4.36 3.18 1.47 4.43 3.62 0.82 NS ***
This institution involves its employees in planning for the future 4.41 2.90 1.66 4.41 3.11 1.31 NS **
This institution plans carefully 4.51 2.74 1.77 4.51 3.21 1.31 NS ***
The leadership of this institution has a clear sense of purpose 4.51 2.87 1.64 4.59 3.40 1.20 * ***
This institution does a good job of meeting the needs of its faculty 4.42 2.97 1.44 4.43 3.30 1.13 NS ***
This institution does a good job of meeting the needs of staff 4.41 2.83 1.57 4.41 3.18 1.23 NS ***
This institution does a good job of meeting the needs of administrators 4.18 3.58 0.59 4.22 3.71 0.51 NS *
This institution makes sufficient budgetary resources available to achieve important objectives 4.52 2.73 1.79 4.47 3.24 1.23 NS ***
This institution makes sufficient staff resources available to achieve important objectives 4.48 2.71 1.77 4.40 3.16 1.25 NS ***
There are effective lines of communication between departments 4.30 2.53 1.78 4.45 2.87 1.57 ** ***
Administrators share information regularly with faculty and staff 4.46 2.75 1.72 4.47 3.13 1.35 NS ***
There is good communication between the faculty and the administration at this institution 4.42 2.76 1.66 4.47 3.11 1.35 NS ***
There is good communication between staff and the administration at this institution 4.41 2.79 1.62 4.43 3.11 1.32 NS ***
Faculty take pride in their work 4.62 3.69 0.93 4.67 3.91 0.75 NS ***
Staff take pride in their work 4.63 3.70 0.93 4.62 3.83 0.79 NS *
Administrators take pride in their work 4.56 3.29 1.28 4.59 3.77 0.83 NS ***
There is a spirit of teamwork and cooperation at this institution 4.54 2.54 2.00 4.58 3.09 1.49 NS ***
The reputation of this institution continues to improve 4.50 2.97 1.53 4.59 3.53 1.06 * ***
This institution is well-respected in the community 4.57 2.94 1.63 4.64 3.74 0.90 * ***
Efforts to improve quality are paying off at this institution 4.48 3.00 1.48 4.49 3.43 1.06 NS ***

College Employee Satisfaction Survey Spring 2015
15
SECTION 1.A
Table 2. Campus Culture and Policies: Statistical Comparison of Importance and Satisfaction Ratings between Southwestern College and Comparison Group
Statements Rated on Importance and Satisfaction Scales (Score of 1: “Not important/Not satisfied at all” / Score of 5: “Very important/Very satisfied”)
SOUTHWESTERN COMPARISON GROUP Significance
IMP Mean
SAT Mean
Gap IMP
Mean SAT
Mean Gap IMP SAT
Employee suggestions are used to improve our institution 4.37 2.63 1.74 4.36 3.03 1.32 NS ***
This institution consistently follows clear processes for selecting new employees 4.43 2.82 1.60 4.40 3.22 1.17 NS ***
This institution consistently follows clear processes for orienting and training new employees 4.41 2.87 1.54 4.42 3.18 1.24 NS ***
This institution consistently follows clear processes for recognizing employee achievements 4.20 2.92 1.28 4.24 3.19 1.05 NS ***
This institution has written procedures that clearly define who is responsible for each operation and service 4.34 2.71 1.63 4.33 3.18 1.15 NS ***
*, **, *** Group means are significantly different at .05, .01, and .001 levels, respectively, and highlighted in tan for emphasis.
College Employee Satisfaction Survey Spring 2015
16
Section 1.B: Campus Culture and Policies, Tables & Charts
1. This institution promotes excellent employee-student relationships
Importance Satisfaction Gap
Spring 2014 4.62 3.24 1.38
Spring 2015 4.61 3.37 1.24
Difference -0.01 0.13 -0.14
3. This institution does a good job of meeting the needs of students
Importance Satisfaction Gap
Spring 2014 4.72 3.06 1.66
Spring 2015 4.62 3.16 1.46
Difference -0.10 0.10 -0.20
2. This institution treats students as its top priority
Importance Satisfaction Gap
Spring 2014 4.73 3.01 1.72
Spring 2015 4.68 3.14 1.54
Difference -0.05 0.13 -0.18
4. The mission, purpose, and values of this institution are well understood by most employees
Importance Satisfaction Gap
Spring 2014 4.38 3.02 1.36
Spring 2015 4.29 3.12 1.17
Difference -0.09 0.10 -0.19
4.62
3.24
4.61
3.37
252 250279 281
Importance Satisfaction
n
Spring 2014 Spring 2015
4.72
3.06
4.62
3.16
250 252278 282
Importance Satisfaction
n
Spring 2014 Spring 2015
4.73
3.01
4.68
3.14
252 252280 283
Importance Satisfaction
n
Spring 2014 Spring 2015
4.38
3.02
4.29
3.12
249 251278 278
Importance Satisfaction
n
Spring 2014 Spring 2015

College Employee Satisfaction Survey Spring 2015
17
5. Most employees are generally supportive of the mission, purpose, and values of this institution
Importance Satisfaction Gap
Spring 2014 4.42 3.19 1.23
Spring 2015 4.33 3.25 1.08
Difference -0.09 0.06 -0.15
7. This institution involves its employees in planning for the future
Importance Satisfaction Gap
Spring 2014 4.50 2.72 1.78
Spring 2015 4.41 2.90 1.51
Difference -0.09 0.18 -0.27
6. The goals and objectives of this institution are consistent with its mission and values
Importance Satisfaction Gap
Spring 2014 4.47 3.00 1.47
Spring 2015 4.36 3.18 1.18
Difference -0.11 0.18 -0.29
8. This institution plans carefully
Importance Satisfaction Gap
Spring 2014 4.54 2.59 1.95
Spring 2015 4.51 2.74 1.77
Difference -0.03 0.15 -0.18
4.42
3.19
4.33
3.25
248 250274 278
Importance Satisfaction
n
Spring 2014 Spring 2015
4.50
2.72
4.41
2.90
249 253274 279
Importance Satisfaction
n
Spring 2014 Spring 2015
4.47
3.00
4.36
3.18
249 251271 277
Importance Satisfaction
n
Spring 2014 Spring 2015
4.54
2.59
4.51
2.74
249 252273 281
Importance Satisfaction
n
Spring 2014 Spring 2015

College Employee Satisfaction Survey Spring 2015
18
9. The leadership of this institution has a clear sense of purpose
Importance Satisfaction Gap
Spring 2014 4.55 2.72 1.83
Spring 2015 4.51 2.87 1.64
Difference -0.04 0.15 -0.19
11. This institution does a good job of meeting the needs of staff
Importance Satisfaction Gap
Spring 2014 4.38 2.58 1.80
Spring 2015 4.41 2.83 1.58
Difference 0.03 0.25 -0.22
10. This institution does a good job of meeting the needs of its faculty
Importance Satisfaction Gap
Spring 2014 4.38 2.56 1.82
Spring 2015 4.42 2.97 1.45
Difference 0.04 0.41 -0.37
12. This institution does a good job of meeting the needs of administrators
Importance Satisfaction Gap
Spring 2014 4.03 3.49 0.54
Spring 2015 4.18 3.58 0.60
Difference 0.15 0.09 0.06
4.55
2.72
4.51
2.87
249 251271 278
Importance Satisfaction
n
Spring 2014 Spring 2015
4.38
2.58
4.41
2.83
247 247271 274
Importance Satisfaction
n
Spring 2014 Spring 2015
4.38
2.56
4.42
2.97
248 248274 277
Importance Satisfaction
n
Spring 2014 Spring 2015
4.03
3.49
4.18
3.58
247 244267 272
Importance Satisfaction
n
Spring 2014 Spring 2015

College Employee Satisfaction Survey Spring 2015
19
13. This institution makes sufficient budgetary resources available to achieve important objectives
Importance Satisfaction Gap
Spring 2014 4.50 2.42 2.08
Spring 2015 4.52 2.73 1.79
Difference 0.02 0.31 -0.29
15. There are effective lines of communication between departments
Importance Satisfaction Gap
Spring 2014 4.43 2.50 1.93
Spring 2015 4.30 2.53 1.77
Difference -0.13 0.03 -0.16
14. This institution makes sufficient staff resources available to achieve important objectives
Importance Satisfaction Gap
Spring 2014 4.40 2.47 1.93
Spring 2015 4.48 2.71 1.77
Difference 0.08 0.24 -0.16
16. Administrators share information regularly with faculty and staff
Importance Satisfaction Gap
Spring 2014 4.48 2.60 1.88
Spring 2015 4.46 2.75 1.71
Difference -0.02 0.15 -0.17
4.50
2.42
4.52
2.73
248 251271 277
Importance Satisfaction
n
Spring 2014 Spring 2015
4.43
2.50
4.30
2.53
230 226240 246
Importance Satisfaction
n
Spring 2014 Spring 2015
4.40
2.47
4.48
2.71
247 249273 279
Importance Satisfaction
n
Spring 2014 Spring 2015
4.48
2.60
4.46
2.75
229 229240 245
Importance Satisfaction
n
Spring 2014 Spring 2015
College Employee Satisfaction Survey Spring 2015
20
17. There is good communication between the faculty and the administration at this institution
Importance Satisfaction Gap
Spring 2014 4.50 2.45 2.05
Spring 2015 4.42 2.76 1.66
Difference -0.08 0.31 -0.39
19. Faculty take pride in their work
Importance Satisfaction Gap
Spring 2014 4.76 3.74 1.02
Spring 2015 4.62 3.69 0.93
Difference -0.14 -0.05 -0.09
18. There is good communication between staff and the administration at this institution
Importance Satisfaction Gap
Spring 2014 4.46 2.64 1.82
Spring 2015 4.41 2.79 1.62
Difference -0.05 0.15 -0.20
20. Staff take pride in their work
Importance Satisfaction Gap
Spring 2014 4.71 3.79 0.92
Spring 2015 4.63 3.70 0.93
Difference -0.08 -0.09 0.01
4.50
2.45
4.42
2.76
227 227236 241
Importance Satisfaction
n
Spring 2014 Spring 2015
4.76
3.74
4.62
3.69
229 227238 242
Importance Satisfaction
n
Spring 2014 Spring 2015
4.46
2.64
4.41
2.79
226 224232 242
Importance Satisfaction
n
Spring 2014 Spring 2015
4.71
3.79
4.63
3.70
229 226235 243
Importance Satisfaction
n
Spring 2014 Spring 2015
College Employee Satisfaction Survey Spring 2015
21
21. Administrators take pride in their work
Importance Satisfaction Gap
Spring 2014 4.63 3.11 1.52
Spring 2015 4.56 3.29 1.27
Difference -0.07 0.18 -0.25
23. The reputation of this institution continues to improve
Importance Satisfaction Gap
Spring 2014 4.54 2.61 1.93
Spring 2015 4.50 2.97 1.53
Difference -0.04 0.36 -0.40
22. There is a spirit of teamwork and cooperation at this institution
Importance Satisfaction Gap
Spring 2014 4.53 2.29 2.24
Spring 2015 4.54 2.54 2.00
Difference 0.01 0.25 -0.24
24. This institution is well-respected in the community
Importance Satisfaction Gap
Spring 2014 4.58 2.69 1.89
Spring 2015 4.57 2.94 1.63
Difference -0.01 0.25 -0.26
4.63
3.11
4.56
3.29
225 224233 238
Importance Satisfaction
n
Spring 2014 Spring 2015
4.54
2.61
4.50
2.97
231 229241 244
Importance Satisfaction
n
Spring 2014 Spring 2015
4.53
2.29
4.54
2.54
231 231241 246
Importance Satisfaction
n
Spring 2014 Spring 2015
4.58
2.69
4.57
2.94
227 225237 243
Importance Satisfaction
n
Spring 2014 Spring 2015
College Employee Satisfaction Survey Spring 2015
22
25. Efforts to improve quality are paying off at this institution
Importance Satisfaction Gap
Spring 2014 4.48 2.79 1.69
Spring 2015 4.48 3.00 1.48
Difference 0.00 0.21 -0.21
27. This institution consistently follows clear processes for selecting new employees
Importance Satisfaction Gap
Spring 2014 4.46 2.84 1.62
Spring 2015 4.43 2.82 1.61
Difference -0.03 -0.02 -0.01
26. Employee suggestions are used to improve our institution
Importance Satisfaction Gap
Spring 2014 4.37 2.43 1.94
Spring 2015 4.37 2.63 1.74
Difference 0.00 0.20 -0.20
28. This institution consistently follows clear processes for orienting and training new employees
Importance Satisfaction Gap
Spring 2014 4.40 2.91 1.49
Spring 2015 4.41 2.87 1.54
Difference 0.01 -0.04 0.05
4.48
2.79
4.48
3.00
230 227235 241
Importance Satisfaction
n
Spring 2014 Spring 2015
4.46
2.84
4.43
2.82
228 224239 243
Importance Satisfaction
n
Spring 2014 Spring 2015
4.37
2.43
4.37
2.63
227 225236 240
Importance Satisfaction
n
Spring 2014 Spring 2015
4.40
2.91
4.41
2.87
224 223237 240
Importance Satisfaction
n
Spring 2014 Spring 2015
College Employee Satisfaction Survey Spring 2015
23
29. This institution consistently follows clear processes for recognizing employee achievements
Importance Satisfaction Gap
Spring 2014 4.22 2.86 1.36
Spring 2015 4.20 2.92 1.28
Difference -0.02 0.06 -0.08
31. This institution's leadership demonstrates support for shared planning and decision-making
Importance Satisfaction Gap
Spring 2014 4.45 2.69 1.76
Spring 2015 4.43 2.82 1.61
Difference -0.02 0.13 -0.15
30. This institution has written procedures that clearly define who is responsible for each operation and service
Importance Satisfaction Gap
Spring 2014 4.42 2.78 1.64
Spring 2015 4.34 2.71 1.63
Difference -0.08 -0.07 -0.01
32. This institution's leadership creates an environment that promotes trust and respect
Importance Satisfaction Gap
Spring 2014 4.58 2.36 2.22
Spring 2015 4.54 2.58 1.96
Difference -0.04 0.22 -0.26
4.22
2.86
4.20
2.92
226 225234 239
Importance Satisfaction
n
Spring 2014 Spring 2015
4.45
2.69
4.43
2.82
227 229237 244
Importance Satisfaction
n
Spring 2014 Spring 2015
4.42
2.78
4.34
2.71
228 225237 242
Importance Satisfaction
n
Spring 2014 Spring 2015
4.58
2.36
4.54
2.58
227 229238 242
Importance Satisfaction
n
Spring 2014 Spring 2015

College Employee Satisfaction Survey Spring 2015
24
33. The Superintendent/President makes timely and informed decisions
Importance Satisfaction Gap
Spring 2014 4.58 2.91 1.67
Spring 2015 4.52 3.19 1.33
Difference -0.06 0.28 -0.34
35. The institution does a good job communicating its budget decision-making processes
Importance Satisfaction Gap
Spring 2014 4.51 2.51 2.00
Spring 2015 4.43 2.78 1.65
Difference -0.08 0.27 -0.35
34. The Governing Board does a good job implementing policy initiatives
Importance Satisfaction Gap
Spring 2014 4.54 2.79 1.75
Spring 2015 4.49 3.18 1.31
Difference -0.05 0.39 -0.44
4.58
2.91
4.52
3.19
228 226235 242
Importance Satisfaction
n
Spring 2014 Spring 2015
4.51
2.51
4.43
2.78
228 227235 243
Importance Satisfaction
n
Spring 2014 Spring 2015
4.54
2.79
4.49
3.18
225 224233 237
Importance Satisfaction
n
Spring 2014 Spring 2015
College Employee Satisfaction Survey Spring 2015
25
Section 2: Institutional Goals
Table 3. Institutional Goals: Importance Rating Descriptives Table 4. Institutional Goals: Means and Mean Change of Importance Scores from Spring 2014 to Spring 2015 Figure 1. Bar Chart of Mean Change of Importance Scores from Spring 2014 to Spring 2015 Table 5. Institutional Goals: Statistical Comparison of Importance Scores between Southwestern College and
Comparison Group Table 6. Institutional Goals: Weighted Priority Ranking of Institutional Goals and Ranking Change from Spring
2014 to Spring 2015 Figure 2. Bar chart of Weighted Priority Ranking of Institutional Goals from Spring 2014 to Spring 2015
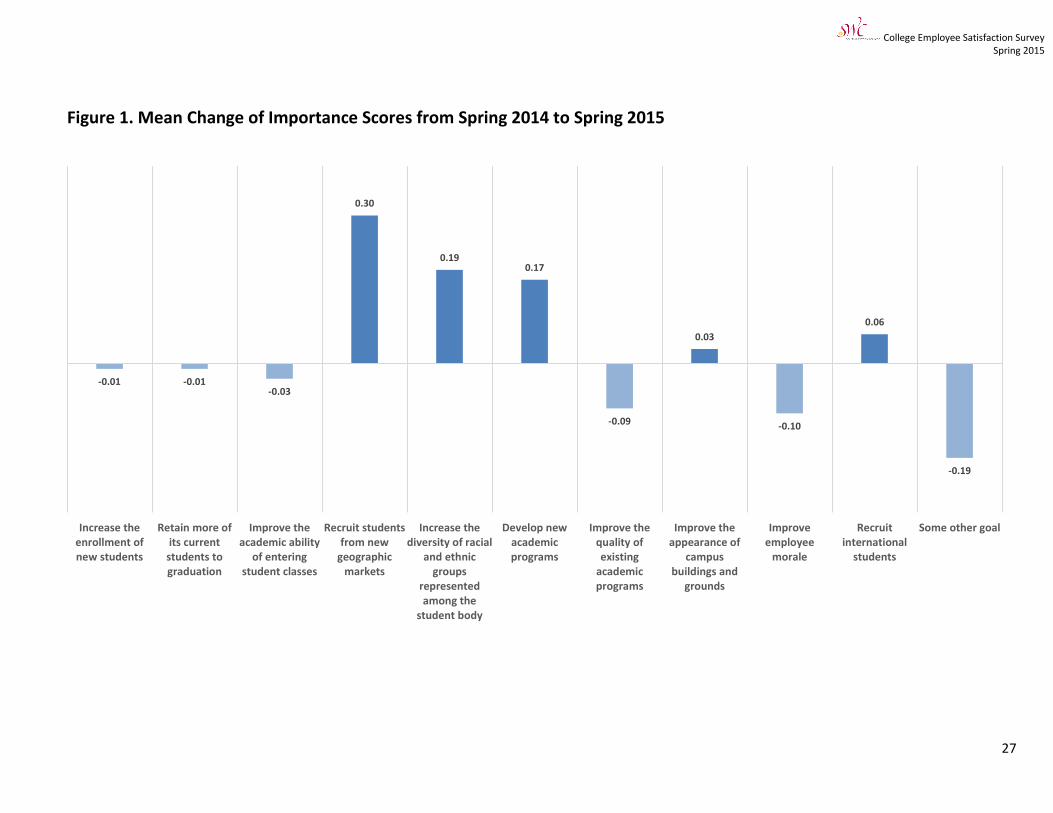
Section 2 focused on the importance and prioritization of Institutional Goals at Southwestern College. In the first section, respondents were asked to rate the level of importance of eleven institutional goals on a Likert scale from 1 (“Not important at all”) to 5 (“Very important”). Table 3 presents descriptive data related to institutional goal importance ratings. Descriptive statistics include the mean, standard deviation (“SD”), and the valid number of responses tallied for each item (“n”). Please see Statistical Terminology on page 2 for further clarification of statistics. Mean scores of institutional goals are presented in order of highest to lowest importance ratings. Table 4 includes Importance means scores from the spring 2014 survey administration in comparison to spring 2015 ratings. A mean change was calculated for each of the items and Figure 1 depicts these year-to-year changes. Positive scores (bars above the axis) indicate an increase in ratings of importance from 2014 to 2015; while negative scores (bars below the axis) indicate a decrease in ratings of importance. Please note: Table 4 has two fewer items as Goals J and K are excluded for comparison purposes. Table 5 provides a comparison of Importance mean scores from Southwestern College to the institutional comparison group. None of the means significantly differed between the College and the comparison group for this current survey administration. Survey respondents were then asked to rank the top three goals that they felt should be the institution’s top priorities. Due to the ranking aspect of this section, and to standardize scores across years, raw counts for each goal were weighted according to each participant’s ranking order. Higher values indicate a combination of higher importance ranking and more participants selecting that goal, whereas lower values indicate that fewer people selected that goal and/or did not rank it as highly. Table 6 displays these calculated, weighted importance ranking scores from 2014 in comparison to 2015 scores. Additionally, the change in these weighted scores from 2014 to 2015 is presented in this table. Positive numbers in the ranking change column indicate that a particular institutional goal has increased in priority/ranking in 2015 compared to 2014; a negative ranking change indicates that an institutional goal has decreased in priority/ranking compared to the previous year. Figure 2 depicts weighted importance ranking scores from 2014 and 2015 for each of the listed institutional goals on the survey.

College Employee Satisfaction Survey Spring 2015
26
Table 3. Institutional Goals: Importance Rating Descriptives (Spring 2015; Sorted by Level of Importance)
Statements Rated on Importance Scales (Score of 1: “Not important at all” / Score of 5: “Very important”)
Mean SD n
[B] Retain more of its current students to graduation 4.69 0.59 246
[I] Improve employee morale 4.63 0.69 244
[G] Improve the quality of existing academic programs 4.60 0.64 245
[C] Improve the academic ability of entering student classes 4.47 0.76 245
[A] Increase the enrollment of new students 4.22 0.91 246
[F] Develop new academic programs 3.90 1.03 244
[H] Improve the appearance of campus buildings and grounds 3.79 1.00 245
[E] Increase the diversity of racial and ethnic groups represented among the student body 3.56 1.16 245
[D] Recruit students from new geographic markets 3.47 1.11 246
[J] Recruit international students 3.02 1.21 245
Table 4. Institutional Goals: Means and Mean Change of Importance Scores from Spring 2014 to Spring 2015
Statements Rated on Importance Scales (Score of 1: “Not important at all” / Score of 5: “Very important”)
Spring 2014 Spring 2015 Mean
Change
Increase the enrollment of new students 4.23 4.22 -0.01
Retain more of its current students to graduation 4.70 4.69 -0.01
Improve the academic ability of entering student classes 4.50 4.47 -0.03
Recruit students from new geographic markets 3.17 3.47 0.30
Increase the diversity of racial and ethnic groups represented among the student body 3.37 3.56 0.19
Develop new academic programs 3.73 3.90 0.17
Improve the quality of existing academic programs 4.69 4.60 -0.09
Improve the appearance of campus buildings and grounds 3.76 3.79 0.03
Improve employee morale 4.73 4.63 -0.10
Recruit international students 2.96 3.02 0.06
Some other goal 3.15 2.96 -0.19
College Employee Satisfaction Survey Spring 2015
27
-0.01 -0.01-0.03
0.30
0.190.17
-0.09
0.03
-0.10
0.06
-0.19
Increase theenrollment ofnew students
Retain more ofits currentstudents tograduation
Improve theacademic ability
of enteringstudent classes
Recruit studentsfrom new
geographicmarkets
Increase thediversity of racial
and ethnicgroups
representedamong the
student body
Develop newacademicprograms
Improve thequality ofexisting
academicprograms
Improve theappearance of
campusbuildings and
grounds
Improveemployee
morale
Recruitinternational
students
Some other goal
Figure 1. Mean Change of Importance Scores from Spring 2014 to Spring 2015

College Employee Satisfaction Survey Spring 2015
28
Table 5. Institutional Goals: Statistical Comparison of Importance Scores between Southwestern College and
Comparison Group α
Statements Rated on Importance Scales (Score of 1: “Not important at all” / Score of 5: “Very important”)
SWC Mean
Comparison Group Mean
A) Increase the enrollment of new students 4.22 4.31
B) Retain more of its current students to graduation 4.69 4.67
C) Improve the academic ability of entering student classes 4.47 4.39
D) Recruit students from new geographic markets 3.47 3.59
E) Increase the diversity of racial and ethnic groups represented among the student body 3.56 3.59
F) Develop new academic programs 3.90 3.95
G) Improve the quality of existing academic programs 4.60 4.53
H) Improve the appearance of campus buildings and grounds 3.79 3.85
I) Improve employee morale 4.63 4.56
α None of Southwestern College’s mean scores differed significantly from the Comparison Group.
Table 6. Institutional Goals: Weighted Priority Ranking of Institutional Goals and Ranking Change from Spring 2014 to Spring 2015
2014 Weighted Ranking
2015 Weighted Ranking
Ranking Change
[A] Increase the enrollment of new students 10.9 13.8 2.9
[B] Retain more of its current students to graduation 24.5 26.7 2.2
[C] Improve the academic ability of entering student classes 11.7 10.0 -1.7
[D] Recruit students from new geographic markets 0.2 0.5 0.3
[E] Increase the diversity of racial and ethnic groups represented among the student body 0.3 1.7 1.4
[F] Develop new academic programs 4.2 6.4 2.2
[G] Improve the quality of existing academic programs 23.2 21.2 -2.0
[H] Improve the appearance of campus buildings and grounds 1.1 1.9 0.8
[I] Improve employee morale 21.3 16.4 -4.8
[J] Recruit international students 0.7 0.0 -0.7
[K] Some other goal 1.9 1.3 -0.6

College Employee Satisfaction Survey Spring 2015
29
Figure 2. Weighted Priority Ranking of Institutional Goals from Spring 2014 to Spring 2015
10.9
24.5
11.7
0.2 0.3
4.2
23.2
1.1
21.3
0.7
1.9
13.8
26.7
10.0
0.5
1.7
6.4
21.2
1.9
16.4
0.0
1.3
Increase theenrollment ofnew students
Retain more ofits currentstudents tograduation
Improve theacademic ability
of enteringstudent classes
Recruit studentsfrom new
geographicmarkets
Increase thediversity of racial
and ethnicgroups
representedamong the
student body
Develop newacademicprograms
Improve thequality ofexisting
academicprograms
Improve theappearance of
campusbuildings and
grounds
Improveemployee
morale
Recruitinternational
students
Some other goal
Spring 2014 Spring 2015
College Employee Satisfaction Survey Spring 2015
30
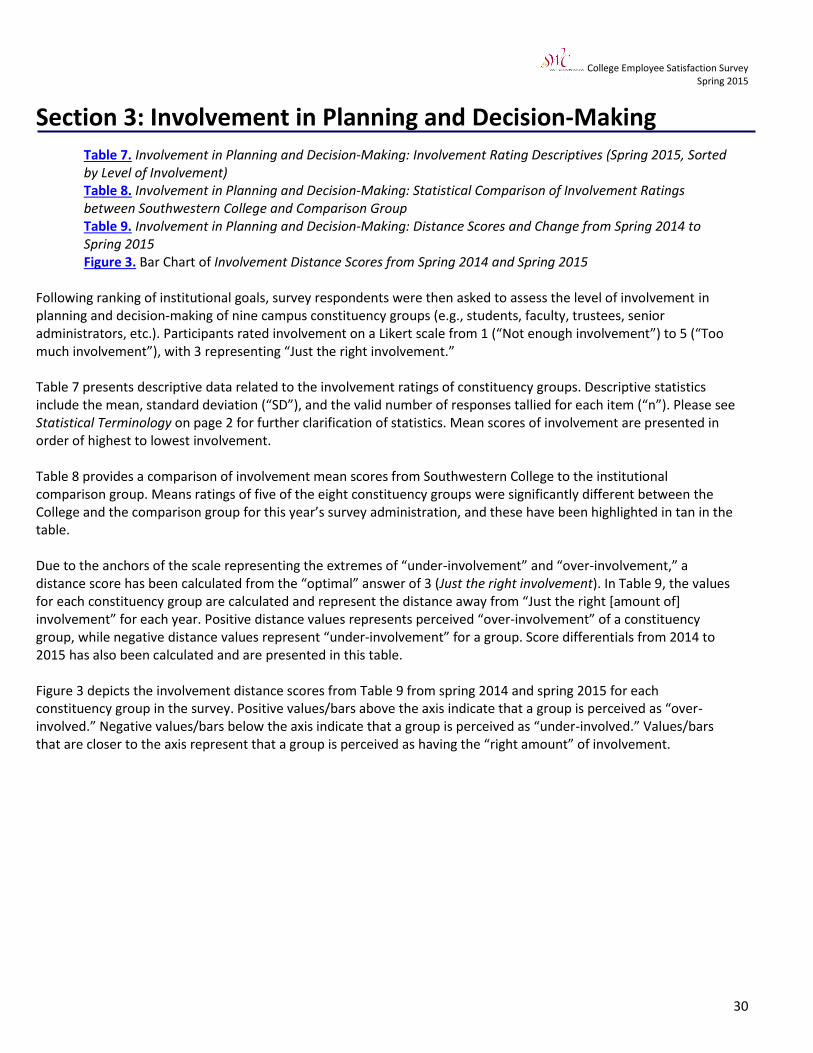
Section 3: Involvement in Planning and Decision-Making
Table 7. Involvement in Planning and Decision-Making: Involvement Rating Descriptives (Spring 2015, Sorted by Level of Involvement)
Table 8. Involvement in Planning and Decision-Making: Statistical Comparison of Involvement Ratings between Southwestern College and Comparison Group
Table 9. Involvement in Planning and Decision-Making: Distance Scores and Change from Spring 2014 to Spring 2015 Figure 3. Bar Chart of Involvement Distance Scores from Spring 2014 and Spring 2015
Following ranking of institutional goals, survey respondents were then asked to assess the level of involvement in planning and decision-making of nine campus constituency groups (e.g., students, faculty, trustees, senior administrators, etc.). Participants rated involvement on a Likert scale from 1 (“Not enough involvement”) to 5 (“Too much involvement”), with 3 representing “Just the right involvement.” Table 7 presents descriptive data related to the involvement ratings of constituency groups. Descriptive statistics include the mean, standard deviation (“SD”), and the valid number of responses tallied for each item (“n”). Please see Statistical Terminology on page 2 for further clarification of statistics. Mean scores of involvement are presented in order of highest to lowest involvement. Table 8 provides a comparison of involvement mean scores from Southwestern College to the institutional comparison group. Means ratings of five of the eight constituency groups were significantly different between the College and the comparison group for this year’s survey administration, and these have been highlighted in tan in the table. Due to the anchors of the scale representing the extremes of “under-involvement” and “over-involvement,” a distance score has been calculated from the “optimal” answer of 3 (Just the right involvement). In Table 9, the values for each constituency group are calculated and represent the distance away from “Just the right [amount of] involvement” for each year. Positive distance values represents perceived “over-involvement” of a constituency group, while negative distance values represent “under-involvement” for a group. Score differentials from 2014 to 2015 has also been calculated and are presented in this table. Figure 3 depicts the involvement distance scores from Table 9 from spring 2014 and spring 2015 for each constituency group in the survey. Positive values/bars above the axis indicate that a group is perceived as “over-involved.” Negative values/bars below the axis indicate that a group is perceived as “under-involved.” Values/bars that are closer to the axis represent that a group is perceived as having the “right amount” of involvement.

College Employee Satisfaction Survey Spring 2015
31
Table 7. Involvement in Planning and Decision-Making: Involvement Rating Descriptives (Spring 2015, Sorted by Level of Involvement)
INV Rank
Involvement (1 = "Not enough involvement" / 3 = "Just the right involvement" / 5 = "Too much involvement") Mean SD n
1 How involved are: Senior administrators (VP, Provost level or above) 3.91 0.97 234
2 How involved are: Deans or directors of administrative units 3.60 0.92 233
3 How involved are: Deans or chairs of academic units 3.47 0.94 232
4 How involved are: Trustees 3.35 1.00 231
5 How involved are: Academic Senate 3.10 0.94 230
6 How involved are: Faculty 3.00 1.27 237
7 How involved are: Staff 2.41 0.91 234
8 How involved are: Students 2.37 0.96 238
9 How involved are: Alumni 2.20 0.93 226
Table 8. Involvement in Planning and Decision-Making: Statistical Comparison of Involvement Ratings between Southwestern College and Comparison Group
Involvement (1 = "Not enough involvement" / 3 = "Just the right involvement" / 5 = "Too much involvement")
Southwestern College Mean
Comparison Group Mean
How involved are: Senior administrators (VP, Provost level or above) 3.91*** 3.72***
How involved are: Deans or directors of administrative units 3.60*** 3.34***
How involved are: Deans or chairs of academic units 3.47** 3.29**
How involved are: Trustees 3.35 3.24
How involved are: Faculty 3.00*** 2.61***
How involved are: Staff 2.41 2.34
How involved are: Students 2.37 2.33
How involved are: Alumni 2.20*** 2.52***
** ,*** Group means are significantly different at .01 and .001 levels, respectively, and highlighted in tan for emphasis.
Table 9. Involvement in Planning and Decision-Making: Distance Scores & Change from Spring 2014 to Spring 2015
Spring 2014
Distance Score
Spring 2015
Distance Score
Distance Score
Change
Faculty -0.05 0.00 0.05
Staff -0.71 -0.59 0.12
Deans or directors of administrative units 0.60 0.60 0.00
Deans or chairs of academic units 0.41 0.47 0.06
Senior administrators (VP, Provost level or above) 0.92 0.91 -0.01
Students -0.69 -0.63 0.06
Trustees 0.47 0.35 -0.12
Alumni -0.72 -0.80 -0.08
Academic Senate 0.10 0.10 0.00
College Employee Satisfaction Survey Spring 2015
32
Figure 3. Involvement Distance Scores from Spring 2014 and Spring 2015
-0.05
-0.71
0.60
0.41
0.92
-0.69
0.47
-0.72
0.10
0.00
-0.59
0.60
0.47
0.91
-0.63
0.35
-0.80
0.10
Faculty Staff Deans or directorsof administrative
units
Deans or chairs ofacademic units
Senioradministrators (VP,
Provost level orabove)
Students Trustees Alumni Academic Senate
How involved are…
Spring 2014 Spring 2015
Un
der
-in
volv
ed
R
igh
t A
mo
un
t
Ove
r-in
volv
ed
of
Invo
lve
me
nt
College Employee Satisfaction Survey Spring 2015
33
Section 4: Work Environment
Section 4.A.
Table 10. Work Environment: Importance and Satisfaction Descriptives, Gap Scores, & Year-to-Year Comparison of
Gap Ranking
Table 11. Work Environment: Statistical Comparison of Importance and Satisfaction Ratings between
Southwestern College and Comparison Group
Section 4.B.
Tables and bar charts for importance and satisfaction mean changes from 2014 to 2015
Section 4.A presents response data for twenty-five items of the College Employee Satisfaction Survey. These items
address employee attitudes toward the work environment at Southwestern College. The first data table (Table 10)
includes descriptive statistics for both importance and satisfaction ratings of each item, as well as performance gap
analysis of the two aforementioned categories. Descriptive statistics include the mean, standard deviation (“SD”), and
the valid number of responses tallied for each item (“n”). Please see Statistical Terminology on page 2 for further
clarification of statistics.
Performance gap analysis is a method used to determine the amount of disparity between the average level of
importance and the average level of satisfaction for a given survey item. The items in this table have been ranked by gap
size, from largest to smallest. Large gaps (items near the top of the list) indicate substantial differences in ratings of
importance and levels of satisfaction, and signify areas of weakness in regard to employee satisfaction. Items toward the
end of the list require less attention, as they are better balanced between the two ratings. Gap rankings for both 2014
and 2015 results are included to illustrate changes in attitudes from the previous year and are available in Table 10.
The second table in Section 4.A (Table 11) provides a comparison of importance and satisfaction ratings between
Southwestern College and the institutional comparison group. This analysis includes only the survey items provided in
the original version of the Ruffalo Noel-Levitz questionnaire, and does not include additional items specific to the
Southwestern College version of the survey. Item averages that significantly differed between our College and the
comparison group are highlighted in tan (dark tan for importance; light tan for satisfaction) and marked with one, two,
or three asterisks, depending on significance level. Please see Statistical Terminology on page 2 for further clarification
of significance testing.
In Section 4.B provides graphical and tabular information for each survey item. These charts allow for comparison
between importance and satisfaction ratings, 2014 to 2015 ratings, and also provide more detailed information
regarding the change in gap scores from year to year.

College Employee Satisfaction Survey Spring 2014
34
† Item is unique to Southwestern College’s version of the survey.
SECTION 4.A
Table 10. Work Environment: Importance and Satisfaction Descriptives, Gap Scores, & Year-to-Year Comparison of Gap Ranking
2015 Gap Rank
2014 Gap Rank
Statements Rated on Importance and Satisfaction Scales (Score of 1: “Not important/Not satisfied at all” / Score of 5: “Very important/Very satisfied”)
IMPORTANCE SATISFACTION
Gap Mean SD n Mean SD n
1 2 My department has the staff needed to do its job well 4.50 0.73 224 2.58 1.26 229 1.92
2 1 My department has the budget needed to do its job well 4.46 0.78 224 2.62 1.23 227 1.84
3 3 I have adequate opportunities for advancement 4.29 0.91 224 2.64 1.26 230 1.65
4 5 It is easy for me to get information at this institution 4.48 0.71 227 2.88 1.16 233 1.60
5 11 I have a reasonable workload Ɨ 4.49 0.66 225 3.07 1.38 231 1.42
6 9 I am empowered to resolve problems quickly 4.33 0.77 225 2.91 1.20 232 1.42
7 4 I am paid fairly for the work I do 4.52 0.65 225 3.13 1.27 233 1.39
8 6 I have adequate opportunities for training to improve my skills 4.40 0.77 224 3.02 1.23 229 1.38
9 7 The employee benefits available to me are valuable 4.52 0.71 225 3.16 1.37 231 1.36
10 10 I am comfortable expressing my opinion Ɨ 4.54 0.70 223 3.19 1.36 232 1.35
11 12 My workplace fosters an environment of ethical behavior Ɨ 4.56 0.76 223 3.30 1.40 233 1.26
12 8 I have adequate opportunities for professional development 4.39 0.76 225 3.15 1.25 232 1.24
13 16 Work responsibilities are within my job description Ɨ 4.46 0.75 222 3.25 1.36 230 1.21
14 14 My supervisor helps me improve my job performance 4.37 0.79 225 3.18 1.35 226 1.19
15 13 I have the information I need to do my job well 4.49 0.74 224 3.34 1.08 231 1.15
16 15 My job responsibilities are communicated clearly to me 4.50 0.66 221 3.37 1.16 230 1.13
17 17 My supervisor pays attention to what I have to say 4.48 0.75 224 3.36 1.40 229 1.12
18 18 My department or work unit has written, up-to-date objectives 4.25 0.83 222 3.21 1.18 230 1.04
19 19 My department meets as a team to plan and coordinate work 4.34 0.82 222 3.31 1.37 230 1.03
20 20 The work I do is appreciated by my supervisor 4.38 0.82 226 3.40 1.35 233 0.98
21 21 I learn about important campus events in a timely manner 4.11 0.81 226 3.21 1.06 231 0.90
22 23 The work I do is valuable to the institution 4.53 0.66 227 3.73 1.15 230 0.80
23 22 I am comfortable answering student questions about institutional policies and procedures 4.14 0.85 225 3.34 1.04 230 0.80
24 24 I am proud to work at this institution 4.53 0.64 224 3.78 1.19 230 0.75
25 25 The type of work I do on most days is personally rewarding 4.56 0.64 225 4.01 0.96 231 0.55

College Employee Satisfaction Survey Spring 2015
35
SECTION 4.A
Table 11. Work Environment: Statistical Comparison of Importance and Satisfaction Ratings between Southwestern College and Comparison Group
Statements Rated on Importance and Satisfaction Scales (Score of 1: “Not important/Not satisfied at all” / Score of 5: “Very important/Very satisfied”)
SOUTHWESTERN COMPARISON GROUP Significance
IMP Mean
SAT Mean
Gap IMP
Mean SAT
Mean Gap IMP SAT
It is easy for me to get information at this institution 4.48 2.88 1.61 4.47 3.34 1.14 NS ***
I learn about important campus events in a timely manner 4.11 3.21 0.90 4.20 3.57 0.62 NS ***
I am empowered to resolve problems quickly 4.33 2.91 1.42 4.40 3.42 0.98 NS ***
I am comfortable answering student questions about institutional policies and procedures 4.14 3.34 0.80 4.21 3.55 0.67 NS **
I have the information I need to do my job well 4.49 3.34 1.15 4.60 3.67 0.93 ** ***
My job responsibilities are communicated clearly to me 4.50 3.37 1.12 4.56 3.74 0.83 NS ***
My supervisor pays attention to what I have to say 4.48 3.36 1.12 4.57 3.89 0.68 * ***
My supervisor helps me improve my job performance 4.37 3.18 1.19 4.43 3.75 0.68 NS ***
My department or work unit has written, up-to-date objectives 4.25 3.21 1.04 4.22 3.62 0.61 NS ***
My department meets as a team to plan and coordinate work 4.34 3.31 1.03 4.31 3.67 0.64 NS ***
My department has the budget needed to do its job well 4.46 2.62 1.84 4.48 3.14 1.35 NS ***
My department has the staff needed to do its job well 4.50 2.58 1.91 4.54 3.11 1.42 NS ***
I am paid fairly for the work I do 4.52 3.13 1.39 4.54 3.17 1.38 NS NS
The employee benefits available to me are valuable 4.52 3.16 1.36 4.57 3.83 0.74 NS ***
I have adequate opportunities for advancement 4.29 2.64 1.65 4.21 3.08 1.13 NS ***
I have adequate opportunities for training to improve my skills 4.40 3.02 1.38 4.38 3.43 0.95 NS ***
I have adequate opportunities for professional development 4.39 3.15 1.24 4.35 3.46 0.89 NS ***
The type of work I do on most days is personally rewarding 4.56 4.01 0.55 4.55 4.11 0.44 NS NS
The work I do is appreciated by my supervisor 4.38 3.40 0.98 4.44 3.89 0.55 NS ***
The work I do is valuable to the institution 4.53 3.73 0.80 4.55 4.00 0.55 NS ***
I am proud to work at this institution 4.53 3.78 0.75 4.56 4.14 0.42 NS ***
*, **, *** Group means are significantly different at .05, .01, and .001 levels, respectively, and highlighted in tan for emphasis.

College Employee Satisfaction Survey Spring 2015
36
Section 4.B: Work Environment, Tables & Charts
39. It is easy for me to get information at this institution
Importance Satisfaction Gap
Spring 2014 4.55 2.80 1.75
Spring 2015 4.48 2.88 1.60
Difference -0.07 0.08 -0.15
41. I am empowered to resolve problems quickly
Importance Satisfaction Gap
Spring 2014 4.44 2.87 1.57
Spring 2015 4.33 2.91 1.42
Difference -0.11 0.04 -0.15
40. I learn about important campus events in a timely manner
Importance Satisfaction Gap
Spring 2014 4.24 3.25 0.99
Spring 2015 4.11 3.21 0.90
Difference -0.13 -0.04 -0.09
42. I am comfortable answering student questions about institutional policies and procedures
Importance Satisfaction Gap
Spring 2014 4.25 3.27 0.98
Spring 2015 4.14 3.34 0.80
Difference -0.11 0.07 -0.18
4.55
2.80
4.48
2.88
225 220227 233
Importance Satisfaction
n
Spring 2014 Spring 2015
4.44
2.87
4.33
2.91
221 216225 232
Importance Satisfaction
n
Spring 2014 Spring 2015
4.24
3.25
4.11
3.21
223 216226 231
Importance Satisfaction
n
Spring 2014 Spring 2015
4.25
3.27
4.14
3.34
219 217225 230
Importance Satisfaction
n
Spring 2014 Spring 2015

College Employee Satisfaction Survey Spring 2015
37
43. I have the information I need to do my job well
Importance Satisfaction Gap
Spring 2014 4.62 3.35 1.27
Spring 2015 4.49 3.34 1.15
Difference -0.13 -0.01 -0.12
45. My supervisor pays attention to what I have to say
Importance Satisfaction Gap
Spring 2014 4.54 3.40 1.14
Spring 2015 4.48 3.36 1.12
Difference -0.06 -0.04 -0.02
44. My job responsibilities are communicated clearly to me
Importance Satisfaction Gap
Spring 2014 4.56 3.37 1.19
Spring 2015 4.50 3.37 1.13
Difference -0.06 0.00 -0.06
46. My supervisor helps me improve my job performance
Importance Satisfaction Gap
Spring 2014 4.46 3.22 1.24
Spring 2015 4.37 3.18 1.19
Difference -0.09 -0.04 -0.05
4.62
3.35
4.49
3.34
220 219224 231
Importance Satisfaction
n
Spring 2014 Spring 2015
4.54
3.40
4.48
3.36
218 219224 229
Importance Satisfaction
n
Spring 2014 Spring 2015
4.56
3.37
4.50
3.37
222 220221 230
Importance Satisfaction
n
Spring 2014 Spring 2015
4.46
3.22
4.37
3.18
220 219225 226
Importance Satisfaction
n
Spring 2014 Spring 2015

College Employee Satisfaction Survey Spring 2015
38
47. My department or work unit has written, up-to-date objectives
Importance Satisfaction Gap
Spring 2014 4.31 3.21 1.10
Spring 2015 4.25 3.21 1.04
Difference -0.06 0.00 -0.06
49. My department has the budget needed to do its job well
Importance Satisfaction Gap
Spring 2014 4.58 2.45 2.13
Spring 2015 4.46 2.62 1.84
Difference -0.12 0.17 -0.29
48. My department meets as a team to plan and coordinate work
Importance Satisfaction Gap
Spring 2014 4.39 3.29 1.10
Spring 2015 4.34 3.31 1.03
Difference -0.05 0.02 -0.07
50. My department has the staff needed to do its job well
Importance Satisfaction Gap
Spring 2014 4.64 2.66 1.98
Spring 2015 4.50 2.58 1.92
Difference -0.14 -0.08 -0.06
4.31
3.21
4.25
3.21
220 218222 230
Importance Satisfaction
n
Spring 2014 Spring 2015
4.58
2.45
4.46
2.62
220 217224 227
Importance Satisfaction
n
Spring 2014 Spring 2015
4.39
3.29
4.34
3.31
219 219222 230
Importance Satisfaction
n
Spring 2014 Spring 2015
4.64
2.66
4.50
2.58
217 213224 229
Importance Satisfaction
n
Spring 2014 Spring 2015

College Employee Satisfaction Survey Spring 2015
39
51. I am paid fairly for the work I do
Importance Satisfaction Gap
Spring 2014 4.57 2.78 1.79
Spring 2015 4.52 3.13 1.39
Difference -0.05 0.35 -0.40
53. I have adequate opportunities for advancement
Importance Satisfaction Gap
Spring 2014 4.37 2.51 1.86
Spring 2015 4.29 2.64 1.65
Difference -0.08 0.13 -0.21
52. The employee benefits available to me are valuable
Importance Satisfaction Gap
Spring 2014 4.63 2.97 1.66
Spring 2015 4.52 3.16 1.36
Difference -0.11 0.19 -0.30
54. I have adequate opportunities for training to improve my skills
Importance Satisfaction Gap
Spring 2014 4.48 2.77 1.71
Spring 2015 4.40 3.02 1.38
Difference -0.08 0.25 -0.33
4.57
2.78
4.52
3.13
220 219225 233
Importance Satisfaction
n
Spring 2014 Spring 2015
4.37
2.51
4.29
2.64
221 221224 230
Importance Satisfaction
n
Spring 2014 Spring 2015
4.63
2.97
4.52
3.16
218 215225 231
Importance Satisfaction
n
Spring 2014 Spring 2015
4.48
2.77
4.40
3.02
220 217224 229
Importance Satisfaction
n
Spring 2014 Spring 2015

College Employee Satisfaction Survey Spring 2015
40
55. I have adequate opportunities for professional development
Importance Satisfaction Gap
Spring 2014 4.44 2.82 1.62
Spring 2015 4.39 3.15 1.24
Difference -0.05 0.33 -0.38
57. The work I do is appreciated by my supervisor
Importance Satisfaction Gap
Spring 2014 4.43 3.40 1.03
Spring 2015 4.38 3.40 0.98
Difference -0.05 0.00 -0.02
56. The type of work I do on most days is personally rewarding
Importance Satisfaction Gap
Spring 2014 4.62 4.05 0.57
Spring 2015 4.56 4.01 0.55
Difference -0.06 -0.04 -0.02
58. The work I do is valuable to the institution
Importance Satisfaction Gap
Spring 2014 4.61 3.75 0.86
Spring 2015 4.53 3.73 0.80
Difference -0.08 -0.02 -0.06
4.44
2.82
4.39
3.15
218 217225 232
Importance Satisfaction
n
Spring 2014 Spring 2015
4.43
3.40
4.38
3.40
222 218226 233
Importance Satisfaction
n
Spring 2014 Spring 2015
4.62
4.05
4.56
4.01
221 222225 231
Importance Satisfaction
n
Spring 2014 Spring 2015
4.61
3.75
4.53
3.73
222 220227 230
Importance Satisfaction
n
Spring 2014 Spring 2015

College Employee Satisfaction Survey Spring 2015
41
59. I am proud to work at this institution
Importance Satisfaction Gap
Spring 2014 4.50 3.69 0.81
Spring 2015 4.53 3.78 0.75
Difference 0.03 0.09 -0.06
61. Work responsibilities are within my job description
Importance Satisfaction Gap
Spring 2014 4.48 3.33 1.15
Spring 2015 4.46 3.25 1.21
Difference -0.02 -0.08 0.06
60. I have a reasonable workload
Importance Satisfaction Gap
Spring 2014 4.49 3.09 1.40
Spring 2015 4.49 3.07 1.42
Difference 0.00 -0.02 0.02
62. My workplace fosters an environment of ethical behavior
Importance Satisfaction Gap
Spring 2014 4.57 3.23 1.34
Spring 2015 4.56 3.30 1.26
Difference -0.01 0.07 -0.08
4.50
3.69
4.53
3.78
221 220224 230
Importance Satisfaction
n
Spring 2014 Spring 2015
4.48
3.33
4.46
3.25
214 217222 230
Importance Satisfaction
n
Spring 2014 Spring 2015
4.49
3.09
4.49
3.07
220 222225 231
Importance Satisfaction
n
Spring 2014 Spring 2015
4.57
3.23
4.56
3.30
219 219223 233
Importance Satisfaction
n
Spring 2014 Spring 2015

College Employee Satisfaction Survey Spring 2015
42
63. I am comfortable expressing my opinion
Importance Satisfaction Gap
Spring 2014 4.49 3.02 1.47
Spring 2015 4.54 3.19 1.35
Difference 0.05 0.17 -0.12
4.49
3.02
4.54
3.19
218 222223 232
Importance Satisfaction
n
Spring 2014 Spring 2015

College Employee Satisfaction Survey Spring 2015
43
Overall Satisfaction
Table 12. Overall Satisfaction: Descriptives, Spring 2015
Table 13. Overall Satisfaction: Means and Mean Change from Spring 2014 to Spring 2015
Table 14. Overall Satisfaction: Statistical Comparison of Overall Satisfaction Ratings between
Southwestern College and Comparison Group
The last item on the College Employee Satisfaction Survey asked respondents to rate their overall
satisfaction with their employment at Southwestern College so far. The first data table (Table 12) in this
section includes descriptive statistics for this item for the spring 2015 survey administration. Descriptive
statistics include the mean, standard deviation (“SD”), and the valid number of responses tallied for each
item (“n”). Please see Statistical Terminology on page 2 for further clarification of statistics.
The second table in this section (Table 13) depicts the overall satisfaction means and change from spring
2014 to spring 2015. Overall satisfaction did not significantly increase from the 2014 to 2015 survey
administration.
Lastly, Table 14 provides a comparison of the overall satisfaction rating between Southwestern College
and the institutional comparison group. The overall satisfaction rating was significantly lower for
Southwestern College compared to the institutional comparison group. Please see Statistical Terminology
on page 2 for further clarification of significance testing.
Table 12. Overall Satisfaction: Descriptives, Spring 2015
SATISFACTION: 1 = "Not satisfied at all” / 5 = "Very satisfied" Mean SD n
Rate your overall satisfaction with your employment here so far: 3.65 1.08 231
Table 13. Overall Satisfaction: Means and Mean Change from Spring 2014 to Spring 2015β
SATISFACTION: 1 = "Not satisfied at all” / 5 = "Very satisfied" 2014 Mean 2015 Mean Mean
Change
Rate your overall satisfaction with your employment here so far: 3.56 3.65 0.11
β 2014 and 2015 Overall satisfaction means are not significantly different.
Table 14. Overall Satisfaction: Statistical Comparison of Overall Satisfaction Ratings between Southwestern College and Comparison Group
SATISFACTION: 1 = "Not satisfied at all” / 5 = "Very satisfied" SWC Mean Comparison Group
Mean
Rate your overall satisfaction with your employment here so far: 3.65*** 3.90***
*** Group means are significantly different at .001 level.

College Employee Satisfaction Survey Spring 2015
44
Survey Instrument
Employee Satisfaction Survey
Southwestern College has engaged Ruffalo Noel-Levitz to conduct this survey of employees to assess their satisfaction.
This survey should take about 20 minutes to complete. Your answers are completely anonymous, and no information is collected that
will allow individuals to be identified.
Thank you!
very
im
po
rtan
t
imp
ort
an
t
so
mew
ha
t im
po
rtan
t
no
t very
im
po
rtan
t
no
t im
po
rtan
t at
all
SECTION 1: Campus culture and policies
The following statements describe different aspects of colleges and
universities. Rate how important each of these are to you as an employee
of this institution, and then rate your satisfaction with how well the
statement is implemented on your campus.
very
sati
sfi
ed
sati
sfi
ed
so
mew
ha
t sati
sfi
ed
no
t very
sati
sfi
ed
no
t s
ati
sfi
ed
at
all
1. This institution promotes excellent employee-student relationships
2. This institution treats students as its top priority
3. This institution does a good job of meeting the needs of students
4. The mission, purpose, and values of this institution are well understood by most employees
5. Most employees are generally supportive of the mission, purpose, and values of this institution
6. The goals and objectives of this institution are consistent with its mission and values
7. This institution involves its employees in planning for the future
8. This institution plans carefully
9. The leadership of this institution has a clear sense of purpose
10. This institution does a good job of meeting the needs of its faculty
11. This institution does a good job of meeting the needs of staff
12. This institution does a good job of meeting the needs of administrators
13. This institution makes sufficient budgetary resources available to achieve important objectives
14. This institution makes sufficient staff resources available to achieve important objectives
15. There are effective lines of communication between departments
16. Administrators share information regularly with faculty and staff
17. There is good communication between the faculty and the administration at this institution
18. There is good communication between staff and the administration at this institution

College Employee Satisfaction Survey Spring 2015
45
very
im
po
rtan
t
imp
ort
an
t
so
mew
ha
t im
po
rtan
t
no
t very
im
po
rtan
t
no
t im
po
rtan
t at
all
SECTION 1 (Continued): Campus culture and policies
The following statements describe different aspects of colleges and
universities. Rate how important each of these are to you as an employee
of this institution, and then rate your satisfaction with how well the
statement is implemented on your campus.
very
sati
sfi
ed
sati
sfi
ed
so
mew
ha
t sati
sfi
ed
no
t very
sati
sfi
ed
no
t s
ati
sfi
ed
at
all
19. Faculty take pride in their work
20. Staff take pride in their work
21. Administrators take pride in their work
22. There is a spirit of teamwork and cooperation at this institution
23. The reputation of this institution continues to improve
24. This institution is well-respected in the community
25. Efforts to improve quality are paying off at this institution
26. Employee suggestions are used to improve our institution
27. This institution consistently follows clear processes for selecting new
employees
28. This institution consistently follows clear processes for orienting and
training new employees
29. This institution consistently follows clear processes for recognizing
employee achievements
30. This institution has written procedures that clearly define who is
responsible for each operation and service
31. This institution’s leadership demonstrates support for shared planning
and decision-making
32. This institution’s leadership creates an environment that promotes trust
and respect
33. The Superintendent/President makes timely and informed decisions
34. The Governing Board does a good job implementing policy initiatives
35. This institution does a good job communicating its budget
decision-making processes

College Employee Satisfaction Survey Spring 2015
46
very
im
po
rtan
t
imp
ort
an
t
so
me
wh
at
imp
ort
an
t
no
t ve
ry im
po
rta
nt
no
t im
po
rtan
t a
t all
SECTION 2: Institutional goals
36. How important is it to you that this institution pursue the following
goals?
[A] Increase the enrollment of new students
[B] Retain more of its current students to graduation
[C] Improve the academic ability of entering student classes
[D] Recruit students from new geographic markets
[E] Increase the diversity of racial and ethnic groups represented among
the student body
[F] Develop new academic programs
[G] Improve the quality of existing academic programs
[H] Improve the appearance of campus buildings and grounds
[I] Improve employee morale
[J] Some other goal
[K ] Recruit international students
37. From the list above (in Section 2), choose three goals that you believe should be this institution's top priorities, and enter the letter
for that goal below, in order of importance:
First priority goal:
Second priority goal:
Third priority goal:
What other institutional goals do you think are important? Please describe them in the space below:
SECTION 3: Involvement in planning and decision-making
38. In your opinion, how much involvement do each of the following
have in planning and decision-making at your institution
too
mu
ch
inv
olv
em
en
t
mo
re t
ha
n e
no
ug
h
inv
olv
em
en
t
jus
t th
e r
igh
t
inv
olv
em
en
t
no
t q
uit
e e
no
ug
h
inv
olv
em
en
t
no
t e
no
ug
h
inv
olv
em
en
t
Faculty Staff Deans or directors of administrative units Deans or chairs of academic units Senior administrators (VP, Provost level or above) Students Trustees Alumni Academic Senate

College Employee Satisfaction Survey Spring 2015
47
very
im
po
rtan
t
imp
ort
an
t
so
mew
hat
imp
ort
an
t
no
t very
im
po
rtan
t
no
t im
po
rtan
t at
all
SECTION 4: Work environment
The following statements describe conditions of your work environment as
an employee at this institution. Rate how important each of these are to
you, and then rate your satisfaction with this aspect of your work
environment. very
sati
sfi
ed
sati
sfi
ed
so
mew
hat
sati
sfi
ed
no
t very
sati
sfi
ed
no
t s
ati
sfi
ed
at
all
39. It is easy for me to get information at this institution
40. I learn about important campus events in a timely manner
41. I am empowered to resolve problems quickly
42. I am comfortable answering student questions about institutional policies and procedures
43. I have the information I need to do my job well
44. My job responsibilities are communicated clearly to me
45. My supervisor pays attention to what I have to say
46. My supervisor helps me improve my job performance
47. My department or work unit has written, up-to-date objectives
48. My department meets as a team to plan and coordinate work
49. My department has the budget needed to do its job well
50. My department has the staff needed to do its job well
51. I am paid fairly for the work I do
52. The employee benefits available to me are valuable
53. I have adequate opportunities for advancement
54. I have adequate opportunities for training to improve my skills
55. I have adequate opportunities for professional development
56. The type of work I do on most days is personally rewarding
57. The work I do is appreciated by my supervisor
58. The work I do is valuable to the institution
59. I am proud to work at this institution
60. I have a reasonable workload
61. Work responsibilities are within my job description
62. My workplace fosters an environment of ethical behavior
63. I am comfortable expressing my opinion
College Employee Satisfaction Survey Spring 2015
48
64. Rate your overall satisfaction with your employment here so far:
Very Satisfied
Satisfied
Somewhat satisfied
Not very satisfied
Not satisfied at all
65. Please provide any additional feedback about the campus culture and policies at Southwestern College.
66. Please provide any additional feedback about this institution's goals
67. Please provide any additional feedback about the work environment at Southwestern College.
SECTION 5: Demographics
68. How long have you worked at this institution?
Less than 1 year
1 to 5 years
6 to 10 years
11 to 20 years
More than 20 years
69. Is your position:
Full-time
Part-time
70. Is your position:
Faculty
Staff
Administrator
College Employee Satisfaction Survey Spring 2015
Open-ended Response Summaries
Throughout the 2015 College Employee Satisfaction Survey (CESS), survey respondents were given the opportunity to
respond to four open-ended questions. The first open-ended question was supplemental to Section 2 and related to
institutional goals; the remaining three open-ended questions were located at the end of Section 4 and requested
additional feedback regarding three of the four major sections of the survey.
Q #37: “What other institutional goals do you think are important? Please describe them in the space below.”
Q #65: “Please provide any additional feedback about the campus culture and policies at Southwestern College.”
Q #66: “Please provide any additional feedback about this institution's goals.”
Q #67: “Please provide any additional feedback about the work environment at Southwestern College.”
The responses provided to these questions were carefully coded and summarized in the following report. Implications of
these results should be interpreted with caution as responses were optional and do not reflect all respondent’s opinions,
let alone that of all college employees and therefore are not statistically sound. For a valid understanding of the survey
results, the statistically-supported, quantitative analysis (provided in the initial report) should serve as the main focus,
and the preceding qualitative information should be considered only as a supplement to those major findings.
Survey Prompts in Context
For a comprehensive understanding, employee comments to open-ended prompts should be viewed in context of the
CESS questionnaire framework.
The first open-ended prompt, “What other institutional goals do you think are important?” is found within the
Institutional Goals section. This question serves as a follow-up to an earlier prompt to “choose three goals that you
believe should be this institution's top priorities” from a listing of eleven (11) specified institutional goals. Question 37 is
intended to address any other aspirational goals that are not currently incorporated in institutional planning. To
ascertain more generalized feedback regarding institutional goals, an additional prompt is found within Section 4,
Workplace Environment. This latter prompt (Question 66) requests that employees “provide any additional feedback
about this institution's goals.”
Additionally, the Workplace Environment section contained two prompts regarding Campus Culture & Policies and the
Workplace Environment. Question 65 asked respondents to “provide any additional feedback about the campus culture
and policies at Southwestern College.” The final prompt (Question 67) sought employee perspective regarding “any
additional feedback about the work environment at Southwestern College.” This prompt was intended as a follow-up to
statements that "describe conditions of [the] work environment as an employee at this institution” which included
topics such as compensation, training opportunities, staffing, workload, and others.
Finally, it should be noted that an underlying attempt of this survey, as a whole, is to identify challenges or areas of
improvement for the college in regards to campus culture and policies, work environment, planning and decision-
making, and institutional goals. One limitation of the open-ended section of the survey may be the lack of
counterbalance; that is, the absence of prompting respondents to reflect on what they believe the college is doing right
and to provide their perspective of what programs and services are already meeting expectation.

College Employee Satisfaction Survey Spring 2015
Response Classifications
In order to facilitate summarization of the College Employee Satisfaction Survey’s (CESS) open-ended responses, several
thematic categories were constructed to classify employee opinions and perspectives. These categories were guided by
a need to encompass comments in a logical and meaningful way to the campus community and at the same time reflect
the employee survey’s underlying focus of “Campus Culture and Policies,” “Institutional Goals,” “Involvement in
Planning and Decision-Making,” and the “Work Environment.” Similar to last year’s administration, survey responses
were classified based on content and tone using a homegrown method of content analysis. Twelve classification groups
were developed to organize respondent opinions and perspectives systematically. Employee comments varied greatly in
length, many with an array of thematic contents; thus, many responses are classified under two or more categories.
A majority of the category themes derived from last year’s report carried over to this year, as several comments and
concerns from the prior year were voiced again in the current survey administration. There were only a few minor
changes to category titles and operational definitions to allow for more accurate and relevant categorization. Responses
were classified based on the following categories:
1. Budget involves mention of fiscal allocations and processes, employee salary/ compensation, and other
budgetary items.
2. Communication refers to formal and informal information patterns across departments, offices, and
employees.
3. Employee Services relates to organizational practices and mechanisms at the employee level such as hiring
and human resource management. This category also includes comments regarding adjunct issues (like job
security) and employee job fit.
4. Infrastructure & Technology encompasses physical resources and capital such as facilities, maintenance,
technology, and other equipment.
5. Mission & Priorities includes institutional-level comments regarding the college’s mission and its perceived
organization of priorities.
6. Morale relates to an individual’s workplace satisfaction, attitudes, and sentiments. A sub-category within
Morale emerged related to intimidation, trust, and fear of retaliation.
7. Planning & Decision-Making relates to organizational practices of planning and decision-making, including
shared governance.
8. Policy & Procedure refers to the understanding and implementation of departmental or institutional policies
and procedures, or lack thereof.
9. Student Success involves any institutional processes and initiatives affecting curriculum, academic outcomes,
and educational trajectories.
10. Transparency includes institutional disclosure practices, or the availability of information permitting collective decision-making. 11. Workplace Support involves staff development, training, and job-related support within and across
departments.
12. Other encompasses employee comments outside the aforementioned categories (including topics of
compressed calendar, safety, transparency, community/PR, and others).

College Employee Satisfaction Survey Spring 2015
Distribution of Category Topics
Table 1, presented below, provides a general overview of the most frequently mentioned topics by each open-ended
question. The left-most “TOTAL” column illustrates the most frequently mentioned categories across all four questions.
The top three categories overall are Morale, Student Success, and Employee Services, respectively. The distribution of
categories within each question will be discussed in further detail in the succeeding sections. Finally, the bottom row,
“Number of Respondents” gives light to the limitation of generalizability of these responses to the entire campus
community as, on average, only about 73 employees responded to each question (Highest n = 103, Question 65; Lowest
n = 46, Question 66).
Table 1. Distribution of Categories across Open-Ended Responses
Question 37 Question 65 Question 66 Question 67 TOTAL
CATEGORY n % n % n % n % n
Budget 8 6% 14 5% 6 6% 10 7% 38
Communication 2 2% 24 9% 4 4% 12 8% 42
Employee Services 17 13% 32 12% 8 9% 30 21% 87
Infrastructure & Technology 13 10% 14 5% 5 5% 5 4% 37
Mission & Priorities 7 5% 12 5% 9 10% 2 1% 30
Morale 14 11% 56 22% 14 15% 49 35% 133
Planning & Decision-Making 11 9% 17 7% 11 12% 6 4% 45
Policy & Procedure 4 3% 27 10% 1 1% 9 6% 41
Student Success 36 28% 32 12% 21 22% 5 4% 94
Transparency 2 2% 11 4% 1 1% 4 3% 18
Workplace Support 6 5% 12 5% 6 6% 3 2% 27
Other 9 7% 9 4% 8 9% 7 5% 33
Number of Category Tags 129 100% 260 100% 94 100% 142 100% 625
Number of Respondents 71 25% 103 36% 46 16% 73 26% 238

College Employee Satisfaction Survey Spring 2015
Section 2, Question 37 Response Summary
“What other institutional goals do you think are important?”
The first open-ended prompt, “What other institutional goals do you think are important?” is found within the
Institutional Goals section. This question serves as a follow-up to an earlier prompt to “choose three goals that you
believe should be this institution's top priorities” from a listing of eleven (11) specified institutional goals. Question 37 is
intended to address any other aspirational goals that are not currently incorporated in institutional planning. The word
cloud below depicts the one-hundred most frequently used words in employee responses to Question 37.
Figure 1. Word Cloud of 100 Most Frequently Used Words in Open-Ended Question 37 Responses
Wordle is an internet application used to generate “word clouds” from text strings (http://www.wordle.net/). The clouds give greater prominence
to words that appear more frequently in the source text.
Figures 2 and 3 featured below provide further detail of Question 37 responses. The most frequently mentioned topics
in regards to other important institutional goals were student success, employee services, and morale. This is slightly
different from the content of responses in the 2014 survey administration as those primarily centered around goals
related to student success, institutional process (which was formerly defined as a combination of planning and
decision-making and policy and procedure), and budget.
The tone of commentary was primarily neutral for the majority of responses, which is not surprising considering
respondents were simply asked to provide feedback on additional aspirations they have for the college.
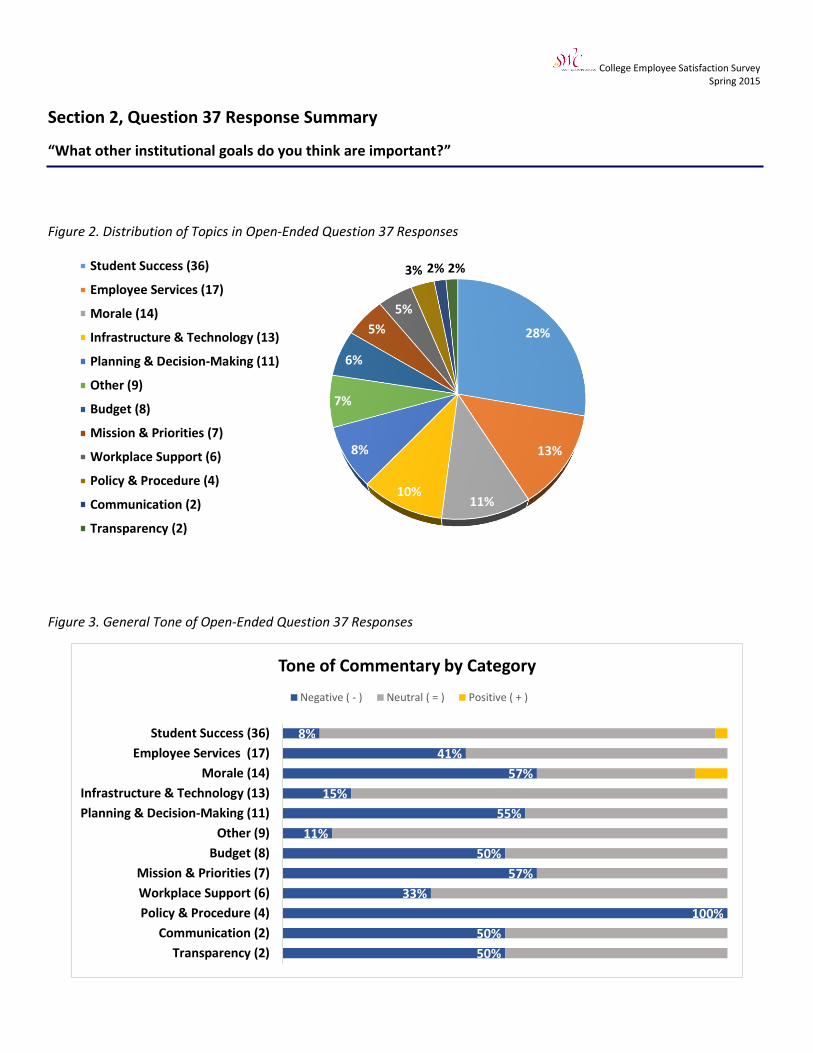
College Employee Satisfaction Survey Spring 2015
Section 2, Question 37 Response Summary
“What other institutional goals do you think are important?”
Figure 2. Distribution of Topics in Open-Ended Question 37 Responses
Figure 3. General Tone of Open-Ended Question 37 Responses
28%
13%
11%10%
8%
7%
6%
5%
5%
3% 2% 2%Student Success (36)
Employee Services (17)
Morale (14)
Infrastructure & Technology (13)
Planning & Decision-Making (11)
Other (9)
Budget (8)
Mission & Priorities (7)
Workplace Support (6)
Policy & Procedure (4)
Communication (2)
Transparency (2)
8%
41%
57%
15%
55%
11%
50%
57%
33%
100%
50%
50%
Student Success (36)
Employee Services (17)
Morale (14)
Infrastructure & Technology (13)
Planning & Decision-Making (11)
Other (9)
Budget (8)
Mission & Priorities (7)
Workplace Support (6)
Policy & Procedure (4)
Communication (2)
Transparency (2)
Tone of Commentary by Category
Negative ( - ) Neutral ( = ) Positive ( + )

College Employee Satisfaction Survey Spring 2015
Section 2, Question 37 Response Summary
“What other institutional goals do you think are important?”
For the purpose of organization of each open-ended response summary, the three most frequently mentioned themes
are discussed. Summary statements within each question category are broad and reflect an attempt to accurately and
objectively recapitulate employee opinion.
Within context of Question 37, response content was most frequently tagged for Student Success, Employee Services,
and Morale. The following bullet points summarize many of the comments made in regards to these topics at
Southwestern College:
Student Success
Improve quality of existing academic and support programs
Increase support and morale among full-time and part-time faculty in order to better serve students
Align and re-evaluate course and program offerings to better match local and current workforce needs
Employee Services
Improve hiring process and prioritization for adjunct faculty
Increase the number of full-time faculty
Increase the number of student support staff (tutors, custodians, library & bookstore employees)
Morale
Equality of treatment and pay among all employees
Improve relationships between administrators, faculty, and staff
Create an environment of inclusion and support for part-time faculty
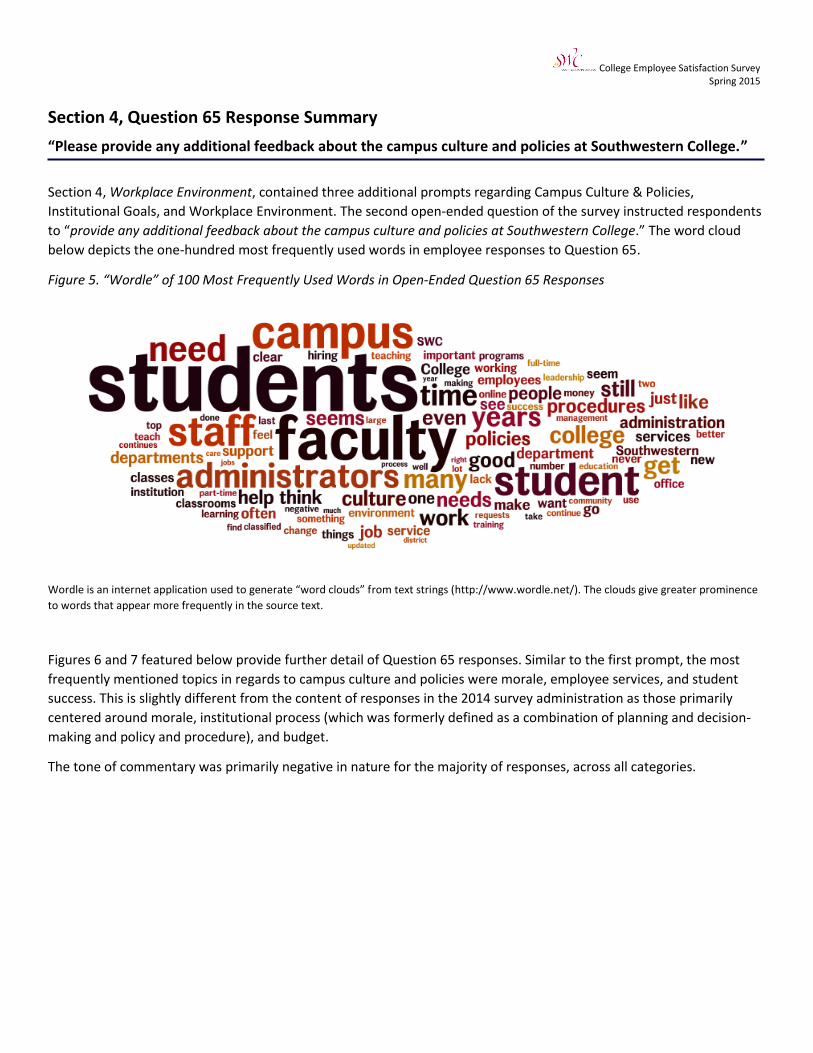
College Employee Satisfaction Survey Spring 2015
Section 4, Question 65 Response Summary
“Please provide any additional feedback about the campus culture and policies at Southwestern College.”
Section 4, Workplace Environment, contained three additional prompts regarding Campus Culture & Policies,
Institutional Goals, and Workplace Environment. The second open-ended question of the survey instructed respondents
to “provide any additional feedback about the campus culture and policies at Southwestern College.” The word cloud
below depicts the one-hundred most frequently used words in employee responses to Question 65.
Figure 5. “Wordle” of 100 Most Frequently Used Words in Open-Ended Question 65 Responses
Wordle is an internet application used to generate “word clouds” from text strings (http://www.wordle.net/). The clouds give greater prominence
to words that appear more frequently in the source text.
Figures 6 and 7 featured below provide further detail of Question 65 responses. Similar to the first prompt, the most
frequently mentioned topics in regards to campus culture and policies were morale, employee services, and student
success. This is slightly different from the content of responses in the 2014 survey administration as those primarily
centered around morale, institutional process (which was formerly defined as a combination of planning and decision-
making and policy and procedure), and budget.
The tone of commentary was primarily negative in nature for the majority of responses, across all categories.

College Employee Satisfaction Survey Spring 2015
Section 4, Question 65 Response Summary
“Please provide any additional feedback about the campus culture and policies at Southwestern College.”
Figure 6. Distribution of Topics in Open-Ended Question 65 Responses
Figure 7. General Tone of Open-Ended Question 65 Responses
22%
12%
12%
10%
9%
7%
5%
5%
5%
5%4% 4%
Morale (56)
Employee Services (32)
Student Success (32)
Policy & Procedure (27)
Communication (24)
Planning & Decision-Making (17)
Budget (14)
Infrastructure & Technology (14)
Workplace Support (12)
Mission & Priorities (12)
Transparency (11)
Other (9)
79%
94%
81%
78%
88%
82%
79%
93%
92%
92%
91%
100%
Morale (56)
Employee Services (32)
Student Success (32)
Policy & Procedure (27)
Communication (24)
Planning & Decision-Making (17)
Budget (14)
Infrastructure & Technology (14)
Workplace Support (12)
Mission & Priorities (12)
Transparency (11)
Other (9)
Tone of Commentary by Category
Negative ( - ) Neutral ( = ) Positive ( + )

College Employee Satisfaction Survey Spring 2015
Section 4, Question 65 Response Summary
“Please provide any additional feedback about the campus culture and policies at Southwestern College.”
For the purpose of organization of each open-ended response summary, the three most frequently mentioned themes
are discussed. Summary statements within each question category are broad and reflect an attempt to accurately and
objectively recapitulate employee opinion.
Within context of Question 65, response content was most frequently tagged for Morale, Employee Services, and
Student Success. The following bullet points summarize many of the comments made in regards to these topics at
Southwestern College:
Morale
Great lack of trust and ability in administration and management
Issues regarding involvement, communication, and support from administration to classified staff
Part-time faculty feel underappreciated
Campus culture has been improving
Employee Services
Poor job fit for many employees/ quality of hiring
Little job security for part-time faculty
Improve Human Resources communication and procedures
Student Success
Administrators do not make student’s their top priority
Create a professional, clean environment for students in order to foster success
Need for faculty training to improve academic programs (including distance education)

College Employee Satisfaction Survey Spring 2015
Section 4, Question 66 Response Summary
“Please provide any additional feedback about this institution's goals.” To ascertain more generalized feedback regarding institutional goals, and similar in format to the previous question,
respondents were asked to “please provide any additional feedback about this institution’s goals.” The word cloud
below depicts the one-hundred most frequently used words in employee responses to Question 66.
Figure 9. “Wordle” of 100 Most Frequently Used Words in Open-Ended Question 66 Responses
Wordle is an internet application used to generate “word clouds” from text strings (http://www.wordle.net/). The clouds give greater prominence
to words that appear more frequently in the source text
Figures 10 and 11 featured below provide further detail of Question 66 responses. The most frequently mentioned
topics in regards to institutional goals were student success, morale, and planning and decision-making. This is only
slightly different from the content of responses in the 2014 survey administration as those primarily centered around
morale, institutional process (which was formerly defined as a combination of planning and decision-making and policy
and procedure), and budget.
The tone of commentary was primarily neutral for the majority of responses, which is not surprising considering
respondents were simply asked to provide feedback on additional aspirations they have for the college.

College Employee Satisfaction Survey Spring 2015
Section 4, Question 66 Response Summary
“Please provide any additional feedback about this institution's goals.”
Figure 10. Distribution of Topics in Open-Ended Question 66 Responses
Figure 11. General Tone of Open-Ended Question 66 Responses
22%
15%
12%10%
9%
9%
6%
6%
5%4%
1% 1%Student Success (21)
Morale (14)
Planning & Decision-Making (11)
Mission & Priorities (9)
Employee Services (8)
Other (8)
Budget (6)
Workplace Support (6)
Infrastructure & Technology (5)
Communication (4)
Transparency (1)
Policy & Procedure (1)
29%
64%
27%
56%
38%
38%
67%
17%
40%
0%
100%
0%
100%
100%
Student Success (21)
Morale (14)
Planning & Decision-Making (11)
Mission & Priorities (9)
Employee Services (8)
Other (8)
Budget (6)
Workplace Support (6)
Infrastructure & Technology (5)
Communication (4)
Transparency (1)
Policy & Procedure (1)
Tone of Commentary by Category
Negative ( - ) Neutral ( = ) Positive ( + )
College Employee Satisfaction Survey Spring 2015
Section 4, Question 66 Response Summary
“Please provide any additional feedback about this institution's goals.” For the purpose of organization of each open-ended response summary, the three most frequently mentioned themes
are discussed. Summary statements within each question category are broad and reflect an attempt to accurately and
objectively recapitulate employee opinion.
Within context of Question 66, response content was most frequently tagged for Student Success, Morale, and Planning and Decision-Making. The following bullet points summarize many of the comments made in regards to these topics at Southwestern College:
Student Success
Funding, and decisions made around it, should be centered around our students (improve classrooms and office space, increase staff, update technology).
Build curriculum around workforce/vocational and transfer needs to support student success after SWC
Morale
Improve level of trust between faculty and staff
Train administration to be more supportive & responsive to staff
Planning & Decision-Making
Include faculty in decision-making process
Increase the practice of data-informed decision making to better align program offerings with student needs
Keep student needs at the center of institutional decision-making

College Employee Satisfaction Survey Spring 2015
Section 4, Question 67 Response Summary
“Please provide any additional feedback about the work environment at Southwestern College.”
The final prompt sought employee perspective regarding “any additional feedback about the work environment at
Southwestern College.” This prompt was intended as a follow-up to statements that "describe conditions of [the] work
environment as an employee at this institution” which included topics such as compensation, training opportunities,
staffing, workload, and others. The word cloud below depicts the one-hundred most frequently used words in employee
responses to Question 67.
Figure 13. “Wordle” of 100 Most Frequently Used Words in Open-Ended Question 67 Responses
Wordle is an internet application used to generate “word clouds” from text strings (http://www.wordle.net/). The clouds give greater prominence
to words that appear more frequently in the source text.
Figures 14 and 15 featured below provide further detail of Question 67 responses. The most frequently mentioned
topics in regards to the College’s work environment were morale and employee services. This is slightly different from
the content of responses in the 2014 survey administration as those primarily centered around institutional process
(which was formerly defined as a combination of planning and decision-making and policy and procedure), student
success, and budget.
The tone of commentary was primarily negative in nature for the majority of responses, across all categories.

College Employee Satisfaction Survey Spring 2015
Section 4, Question 67 Response Summary
“Please provide any additional feedback about the work environment at Southwestern College.”
Figure 14. Distribution of Topics in Open-Ended Question 67 Responses
Figure 15. General Tone of Open-Ended Question 67 Responses
35%
21%8%
7%
6%
5%
4%
4%4%
3% 2% 1%Morale (49)
Employee Services (30)
Communication (12)
Budget (10)
Policy & Procedure (9)
Other (7)
Planning & Decision-Making (6)
Infrastructure & Technology (5)
Student Success (5)
Transparency (4)
Workplace Support (3)
Mission & Priorities (2)
69%
83%
92%
80%
100%
100%
83%
80%
60%
75%
67%
100%
Morale (49)
Employee Services (30)
Communication (12)
Budget (10)
Policy & Procedure (9)
Other (7)
Planning & Decision-Making (6)
Infrastructure & Tech (5)
Student Success (5)
Transperancy (4)
Workplace Support & Training (3)
Mission & Priorities (2)
Tone of Commentary by Category
Negative ( - ) Neutral ( = ) Positive ( + )
College Employee Satisfaction Survey Spring 2015
Section 4, Question 67 Response Summary
“Please provide any additional feedback about the work environment at Southwestern College.”
For the purpose of organization of each open-ended response summary, the three most frequently mentioned themes
are discussed. Summary statements within each question category are broad and reflect an attempt to accurately and
objectively recapitulate employee opinion.
Within context of Question 67, response content was most frequently tagged for Morale, Employee Services, and
Communication. The following bullet points summarize many of the comments made in regards to these topics at
Southwestern College:
Morale
Dissatisfaction among competency and supervision of administrators
Environment of fear and bullying from high-level employees
While the environment is generally welcoming and collaborative, there are subgroups that are greatly
discontent and these individuals seem to have a large effect on campus or departmental culture.
Employee Services
Little to no accountability of administrators
Lack of training, supervision, and support from management/ administration
Increase hiring of staff and faculty and improve process of replacing vacant positions
Communication
Little to no interaction with department heads and division deans
Suggestions for change are often shut down
Regular feedback from higher level employees would foster improvement and inclusion