college of engineering university of california,...
TRANSCRIPT
Feasibility Study on Solid Waste to Energy
Technological Aspects
Yuzhong Tan
College of EngineeringUniversity of California, Berkeley
Fung Technical Report No. 2013.04.15 http://www.funginstitute.berkeley.edu/sites/default/�les/SolidWasteToEnergy.pdf
April 15, 2013
130 Blum Hall #5580 Berkeley, CA 94720-5580 | (510) 664-4337 | www.funginstitute.berkeley.edu
Lee Fleming, Faculty Director, Fung Institute
Advisory Board
Coleman FungFounder and Chairman, OpenLink Financial Charles GiancarloManaging Director, Silver Lake PartnersDonald R. Proctor Senior Vice President, O�ce of the Chairman and CEO, CiscoIn Sik RheeGeneral Partner, Rembrandt Venture Partners
Fung Management Lee FlemingFaculty DirectorBeth HochDirector, Academic A�airs
Copyright © 2014, by the author(s). All rights reserved.
Permission to make digital or hard copies of all or part of this work for personal or classroom use is granted without fee provided that copies are not made or distributed for pro�t or commercial advantage and that copies bear this notice and the full citation on the �rst page. To copy otherwise, to republish, to post on servers or to redistribute to lists, requires prior speci�c permission.
The Coleman Fung Institute for Engineering Leadership, launched in January 2010, prepares engineers and scientists – from students to seasoned professionals – with the multidisciplinary skills to lead enterprises of all scales, in industry, government and the nonpro�t sector.
Headquartered in UC Berkeley’s College of Engineering , the Fung Institute combines leadership coursework in technology innovation and management with intensive study in an area of industry specialization. This integrated knowledge cultivates leaders who can make insightful decisions with the con�dence that comes from a synthesized understanding of technological, marketplace and operational implications.
130 Blum Hall #5580 Berkeley, CA 94720-5580 | (510) 664-4337 | www.funginstitute.berkeley.edu

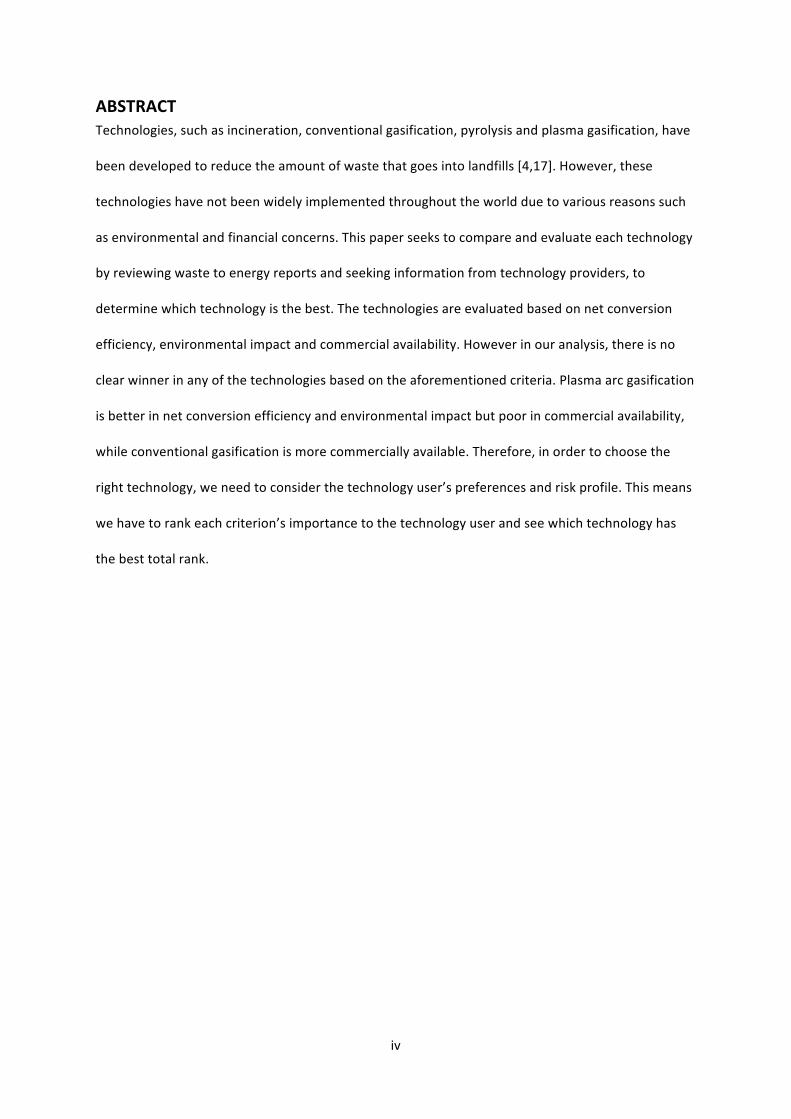
Abstract: Technologies, such as incineration, conventional gasi�cation, pyrolysis and plasma gasi�cation, have been developed to reduce the amount of waste that goes into land�lls [4,17]. However, these tech-nologies have not been widely implemented throughout the world due to various reasons such as environmental and �nancial concerns. This paper seeks to compare and evaluate each technology by reviewing waste to energy reports and seeking information from technology providers, to determine which technology is the best. The technologies are evaluated based on net conversion e�ciency, environmental impact and commercial availability. However in our analysis, there is no clear winner in any of the technologies based on the aforementioned criteria. Plasma arc gasi�cation is better in net conver-sion e�ciency and environmental impact but poor in commercial availability, while conventional gasi�ca-tion is more commercially available. Therefore, in order to choose the right technology, we need to consider the technology user’s preferences and risk pro�le. This means we have to rank each criterion’s importance to the technology user and see which technology has the best total rank.
130 Blum Hall #5580 Berkeley, CA 94720-5580 | (510) 664-4337 | www.funginstitute.berkeley.edu

Feasibility Study on Solid Waste to Energy
Technological Aspects
Prepared by: Yuzhong Tan
April 15, 2013

TABLE OF CONTENTS
LIST OF FIGURES ...................................................................................................................................... i
LIST OF TABLES ........................................................................................................................................ ii
LIST OF NOMENCLATURE/NOTATIONS .................................................................................................. iii
ABSTRACT .............................................................................................................................................. iv
1.0 INTRODUCTION .......................................................................................................................... 1
2.0 LITERATURE REVIEW .................................................................................................................. 3
2.1 Incineration ............................................................................................................................ 3
2.2 Conventional Gasification ...................................................................................................... 4
2.3 Pyrolysis ................................................................................................................................. 5
2.4 Plasma Arc Gasification .......................................................................................................... 7
3.0 METHODOLOGY ......................................................................................................................... 9
3.1 Criteria ................................................................................................................................... 9
3.1.1 Net Conversion Efficiency .............................................................................................. 9
3.1.2 Environmental Impact .................................................................................................... 9
3.1.3 Commercial Availability ............................................................................................... 10
3.2 Decision Tool ........................................................................................................................ 10
3.2.1 Procedure ..................................................................................................................... 10
4.0 DISCUSSION ............................................................................................................................. 12
4.1 Criteria ................................................................................................................................. 12
4.1.1 Net Conversion Efficiency ............................................................................................ 12
4.1.1.1 Scenario 1 ................................................................................................................. 13
4.1.1.2 Scenario 2 ................................................................................................................. 13
4.1.1.3 Ranking ..................................................................................................................... 14
4.1.2 Environmental Impact .................................................................................................. 15
4.1.2.1 Ranking ..................................................................................................................... 16
4.1.2 Commercial Availability ............................................................................................... 16
4.1.3.1 Ranking ..................................................................................................................... 18
4.2 Sensitivity Analysis ............................................................................................................... 18
5.0 CONCLUSION ............................................................................................................................ 21
Appendix A – questionnaire ................................................................................................................ A-‐1

i
LIST OF FIGURES Figure 1. Single stage incinerator ............................................................................................................ 4 Figure 2. Gasifier ..................................................................................................................................... 5 Figure 3. Overview of pyrolysis ............................................................................................................... 6 Figure 4. AlterNRG’s plasma gasification unit ......................................................................................... 7 Figure 5. Location of WTE facilities ....................................................................................................... 17 Figure 6. WTE technologies at varying stages of commercial maturity ................................................ 18 Figure 7. Sensitivity of 𝑒!,! to 𝑦 ............................................................................................................. 19 Figure 8. Sensitivity of 𝑒!,! to 𝑧 ............................................................................................................. 20
ii
LIST OF TABLES Table 1. Results of questionnaire ......................................................................................................... 11 Table 2. Best suited technology based on results of questionnaire ..................................................... 11 Table 3. Net conversion efficiency ........................................................................................................ 12 Table 4. Projected net conversion efficiency ........................................................................................ 14 Table 5. Net conversion efficiency compared based on production of electrical power ..................... 14 Table 6. Ranking by net conversion efficiency ...................................................................................... 14 Table 7. Technologies and their byproducts ......................................................................................... 15 Table 8. Technologies and their emissions with MSW as feedstock ..................................................... 15 Table 9. Ranking by environmental impact .......................................................................................... 16 Table 10. Ranking by commercial availability ....................................................................................... 18 Table 11. Summary of criteria evaluation ............................................................................................. 21

iii
LIST OF NOMENCLATURE/NOTATIONS MSW Municipal solid waste NRP Non-‐recyclable plastics tpy tons per year PM Particulate Matter HCl Hydrochloric Acid NOx Nitrous Oxides SOx Sulphur Oxides Hg Mercury 𝑟!,! Rank of technology 𝑖 for criterion 𝑗 𝑎! Value of criterion 𝑗 awarded by stakeholder 𝑤! Weight of importance of each criterion 𝑗 𝑟!,! Total rank of technology 𝑖 𝐸𝑉! Energy value of plastics 𝐸𝑉!"# Energy value of MSW 𝐸𝑅!,! Energy recovered using technology 𝑖 and plastics 𝐸𝑅!,!"# Energy recovered using technology 𝑖 and MSW 𝐸𝐶!,! Energy consumed using technology 𝑖 and plastics 𝐸𝐶!,!"# Energy consumed using technology 𝑖 and MSW 𝑒!,! Net conversion efficiency using technology 𝑖 and plastics 𝑒!,!"# Net conversion efficiency using technology 𝑖 and MSW 𝑦 Ratio of 𝐸𝐶!,! and 𝐸𝐶!,!"#
𝑧 Ratio of !"!,!!"!
and !"!,!"#!"!"#
iv
ABSTRACT Technologies, such as incineration, conventional gasification, pyrolysis and plasma gasification, have
been developed to reduce the amount of waste that goes into landfills [4,17]. However, these
technologies have not been widely implemented throughout the world due to various reasons such
as environmental and financial concerns. This paper seeks to compare and evaluate each technology
by reviewing waste to energy reports and seeking information from technology providers, to
determine which technology is the best. The technologies are evaluated based on net conversion
efficiency, environmental impact and commercial availability. However in our analysis, there is no
clear winner in any of the technologies based on the aforementioned criteria. Plasma arc gasification
is better in net conversion efficiency and environmental impact but poor in commercial availability,
while conventional gasification is more commercially available. Therefore, in order to choose the
right technology, we need to consider the technology user’s preferences and risk profile. This means
we have to rank each criterion’s importance to the technology user and see which technology has
the best total rank.

1
1.0 INTRODUCTION In 1988, the solid waste management hierarchy was adopted into US national policy to reinforce the
movement away from landfilling and towards waste prevention, recycling, composting and Energy-‐
from-‐Waste in that order of priority [7]. This means the Municipal Solid Waste (MSW) used for
conversion into energy should only be those that would otherwise be sent to landfills. Since the
amount of available land for landfill is finite, it is not a sustainable option to simply dump MSW into
landfills. In fact, New York City is already exporting its waste to neighbouring States such as
Pennsylvania, Ohio and Virginia [11]. Therefore there is a need to further reduce the amount of
waste going into landfills.
The technology to process such MSW has existed for decades, beginning with the use of
incinerators, which simply combust the waste into gases and leave ashes as residue. As technology
advanced, simple incinerators instead became waste to energy (WTE) facilities, with non-‐recyclable
MSW as the fuel source. The heat generated from combustion of MSW is used to turn water into
steam in a boiler. This steam can be used for either heating homes or for generating electricity via a
steam turbine [6,20]. However, simple incineration or combustion of waste has the public
perception of being environmentally unfriendly despite the emissions from incineration being within
EPA limits [23]. Therefore new technologies have been developed in recent years to process non-‐
recyclable MSW, namely pyrolysis, conventional gasification and plasma arc gasification. These
technologies operate at various temperatures and amounts of oxygen, which lead to them being
more environmentally friendly.
This paper is part of an overall project that studies the feasibility of implementing a WTE
facility for The Dow Chemical Company (Dow), which considers different aspects such as the
technologies, logistics and economics involved. Thus, the focus of this paper is to evaluate the
aforementioned WTE technologies with non-‐recyclable plastics (NRP) as the feedstock and to
recommend the best technology. Each technology will be evaluated based on the following criteria:
net conversion efficiency, environmental impact and commercial availability. However, each

2
technology has its own advantages and disadvantages. Therefore this paper also discusses a decision
tool for Dow to use to match the technology best suited. In the coming sections I will discuss and
evaluate each technology before making some recommendations for Dow and discuss possible
future work.

3
2.0 LITERATURE REVIEW This section provides background information on the technologies used to process waste, namely
incineration, conventional gasification, pyrolysis and plasma arc gasification.
2.1 Incineration Incineration is the oldest technology used to process waste, consisting of several types of
incinerators such as single stage, two stage, grate and fluidized bed incinerators [2,3,17]. They all
involve directly combusting the MSW in an oxygen-‐rich environment, typically at temperatures
between 700°C and 1,350°C [24,25]. An exhaust gas composed primarily of CO2 and water is
produced, which flows through a boiler to produce steam to drive a steam turbine generator,
producing electricity [4,24]. Inorganic materials in the MSW are converted to bottom ash and fly ash
[4]. These byproducts must be disposed in controlled and well-‐operated landfills to prevent ground
and surface water pollution [17]. Although incineration does not eliminate the need for landfills, it
does significantly reduce the amount being sent to landfills by about 90% by volume [20]. Over 90%
of WTE facilities in Europe utilize mass burn incineration technology, with the largest facility treating
approximately 750,000 tpy [17]. Typical systems in North America treat up to 3,000 tons/day of
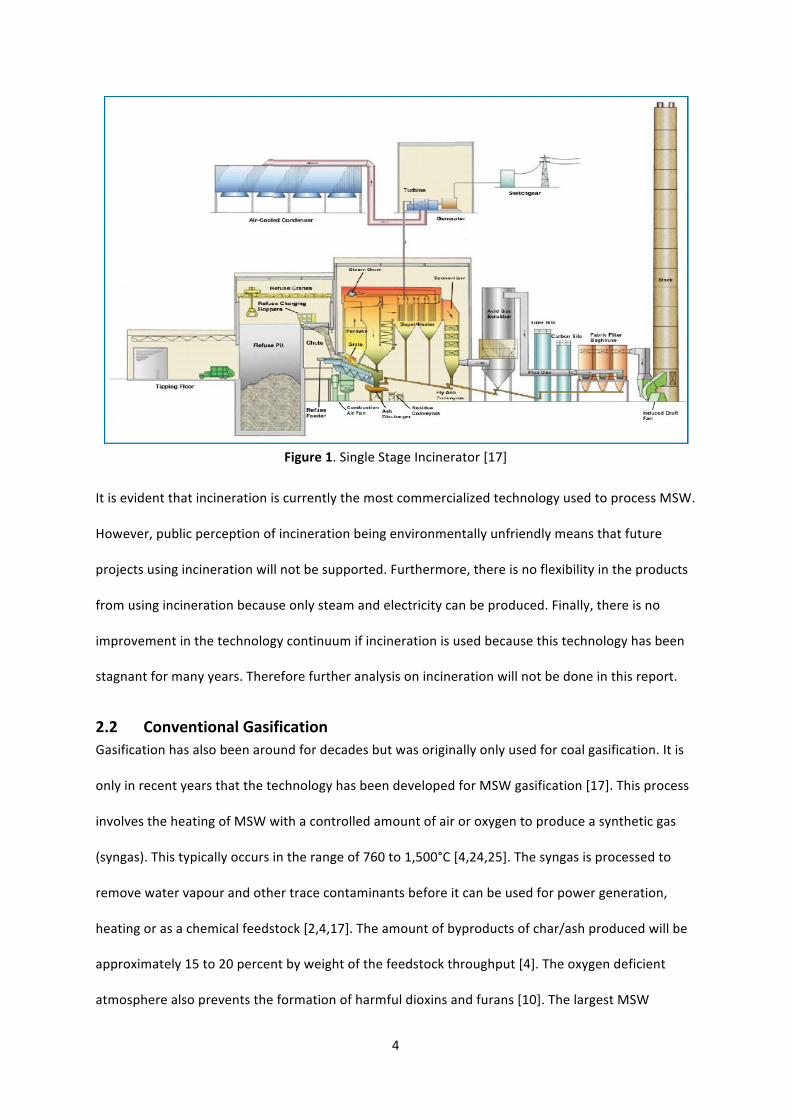
MSW, generating about 605 net kWh/ton of MSW [4]. Figure 1 shows an example of a single stage
incinerator.
4
Figure 1. Single Stage Incinerator [17]
It is evident that incineration is currently the most commercialized technology used to process MSW.
However, public perception of incineration being environmentally unfriendly means that future
projects using incineration will not be supported. Furthermore, there is no flexibility in the products
from using incineration because only steam and electricity can be produced. Finally, there is no
improvement in the technology continuum if incineration is used because this technology has been
stagnant for many years. Therefore further analysis on incineration will not be done in this report.
2.2 Conventional Gasification Gasification has also been around for decades but was originally only used for coal gasification. It is
only in recent years that the technology has been developed for MSW gasification [17]. This process
involves the heating of MSW with a controlled amount of air or oxygen to produce a synthetic gas
(syngas). This typically occurs in the range of 760 to 1,500°C [4,24,25]. The syngas is processed to
remove water vapour and other trace contaminants before it can be used for power generation,
heating or as a chemical feedstock [2,4,17]. The amount of byproducts of char/ash produced will be
approximately 15 to 20 percent by weight of the feedstock throughput [4]. The oxygen deficient
atmosphere also prevents the formation of harmful dioxins and furans [10]. The largest MSW
5
gasification plant is in Kawaguchi, Japan, processing 400 tons/day of MSW using three gasifier trains.
An analysis of conventional gasification technologies shows that they can produce up to 750 net
kWh/ton of processed feedstock [4]. However, there are operational issues that arise due to the
heterogeneous nature of MSW as the gasification process generally requires a fairly homogenous
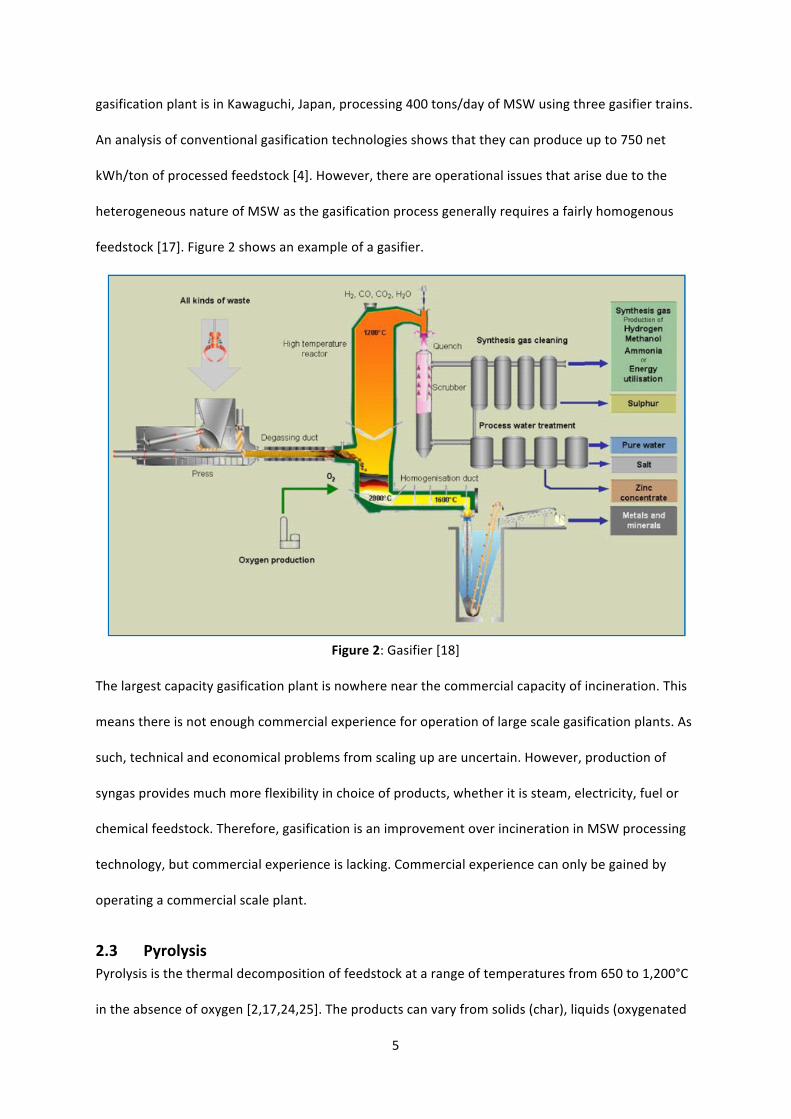
feedstock [17]. Figure 2 shows an example of a gasifier.
Figure 2: Gasifier [18]
The largest capacity gasification plant is nowhere near the commercial capacity of incineration. This
means there is not enough commercial experience for operation of large scale gasification plants. As
such, technical and economical problems from scaling up are uncertain. However, production of
syngas provides much more flexibility in choice of products, whether it is steam, electricity, fuel or
chemical feedstock. Therefore, gasification is an improvement over incineration in MSW processing
technology, but commercial experience is lacking. Commercial experience can only be gained by
operating a commercial scale plant.
2.3 Pyrolysis Pyrolysis is the thermal decomposition of feedstock at a range of temperatures from 650 to 1,200°C
in the absence of oxygen [2,17,24,25]. The products can vary from solids (char), liquids (oxygenated

6
oils), to syngas depending on the temperature of the system. The pyrolytic oils and syngas can be
used directly as boiler fuel or refined for higher quality uses such as engine fuels, chemicals,
adhesives, and other products. The solid residue is a combination of non-‐combustible inorganic
materials and carbon [1,17]. However, the pyrolysis process is highly sensitive to the presence of air.
Accidental incursions of air can result in process upsets and increase the risk of explosive reactions.
Analysis of a wide range of pyrolysis technologies shows that they can produce as much as 770 net
kWh/ton of MSW [4]. The largest MSW pyrolysis plant in operation is the Toyohashi City facility in
Japan, processing a total of 400 tons/day of MSW [4]. Currently, there is no facility worldwide that
produces above 9MW. Figure 3 shows an overview of the pyrolysis process.
Figure 3: Overview of Pyrolysis [13]
Similar to conventional gasification, the largest pyrolysis facility is nowhere near the commercial
capacity of incineration. Therefore technical and economic problems from scale up are uncertain.
However, pyrolysis also has the advantage of producing a flexible product in syngas and no
formation of dioxins and furans since no oxygen is present in the process. In terms of energy
recovery, pyrolysis is similar to conventional gasification and higher performing than incineration.

7
2.4 Plasma Arc Gasification Plasma arcs have been used for years to treat waste products and incinerator ash, converting them
to a non-‐hazardous, glassy slag [4,5,8]. It is only in recent years that plasma arcs have been used to
process MSW. It uses an electric current that passes through a gas (air) to create plasma which
gasifies waste into syngas. This typically occurs in the range of 4000 to 6000°C [2,8,24]. As with
conventional gasification, the syngas produced can be for power generation, heating or as a
chemical feedstock. Due to the high temperatures and throughput capability, these systems have
the potential to produce up to 1100 net kWh/ton of processed feedstock [4]. It has great potential to
convert MSW to electricity more efficiently than conventional pyrolysis and gasification systems due
to its high heat density, high temperature, almost complete conversion of carbon-‐based materials to
syngas, and conversion of inorganic materials to a glassy, non-‐hazardous slag [4]. However, plasma
arc gasification is not commercially proven to treat MSW. The primary reason appears to be the high
capital and operational costs for such facilities. Furthermore, the wear on the plasma chamber is
very high and redundant plasma chambers are needed to keep the process operating [17]. Figure 4
shows an example of AlterNRG’s plasma gasification unit.
Figure 4: AlterNRG’s Plasma Gasification Unit [22]

8
Plasma arc gasification clearly is the most advantageous in terms of energy recovery and byproducts
produced. Like conventional gasification and pyrolysis, it has flexibility in the syngas it produces.
However, plasma arc gasification also lacks the commercial availability, with the largest facility in
Japan only processing approximately 300 tons/day [7]. Furthermore, this technology has the highest
capital cost in addition to the high operating cost due to the high temperatures needed. Therefore
technical and economic problems for scale up are uncertain as well.

9
3.0 METHODOLOGY
3.1 Criteria In order to evaluate the different types of technology, a set of criteria is needed. As mentioned in
the Literature Review section, the criteria are net conversion efficiency, environmental impact and
commercial availability. An additional criterion, cost, will instead be evaluated in the financial report
of this project. The technologies can then be compared in a table using this set of criteria.
3.1.1 Net Conversion Efficiency Net conversion efficiency represents the ratio of the net energy recovered per ton of waste to the
energy value per ton of waste. Net energy recovered per ton of waste represents the amount of
energy recovered in the products less the parasitic load. This energy could be in the form of
synthetic oil or electrical power. The amount of energy recoverable from processing the waste
directly translates to the amount of revenue receivable. Therefore, the higher the energy recovered
per ton of waste, the higher the conversion efficiency and the better the technology. This data is
collected through interviews with technology vendors and literature.
3.1.2 Environmental Impact Environmental impact represents the reduction in landfill use as well as air emissions as a result of
processing the waste. The air emissions considered are particular matter (PM), hydrochloric acid
(HCl), nitrous oxides (NOx), sulphur oxides (SOx), mercury (Hg), dioxins and furans. Waste would be
processed at the waste-‐to-‐energy facilities and thus reduce the need for landfills and free up usable
land. That said, different technologies would also produce different byproducts which may or may
not require landfilling, albeit only about 10% by mass will be byproducts. These byproducts are ash
and char. In addition, the air emissions produced by each technology need to be regulated to be
within EPA standards. Therefore the technology that produces useful byproducts that do not require
landfilling and has the lowest air emissions would be the better technology. This data is collected
through interviews with technology vendors and literature. It should be noted that the

10
environmental impact of transporting the waste is not considered in this paper because all three
technologies would have equal environmental impact in this aspect.
3.1.3 Commercial Availability Commercial availability represents the technology’s market availability at a capacity that is
considered of commercial scale. Interviews with Dow Chemical indicate this to be at least a 25 MW
plant [12]. This translates to approximately a capacity of 300 tons of (NRP) waste per day, based on
an energy value of 28 MMBtu/ton for NRP and a net conversion efficiency of 22%. Different
technologies are at different stages of development, therefore, the technology that is most
commercially available would be the better technology. The data is collected through literature and
measured by the number of existing facilities for each technology.
3.2 Decision Tool It is difficult to compare the technologies across 3 criteria and choose the best technology because
some technologies could be good in one criterion but bad in another. Therefore each stakeholder’s
risk profile must be assessed to choose a technology which best fits the organization. This decision
tool is developed so that Dow can assess the preferences of different stakeholders, such as
municipalities. A questionnaire should be sent to the different stakeholders to ask them to rank the
importance of each criterion to them on a scale of 1 to 5. A sample of the questionnaire can be
found in Appendix A. The evaluation method procedure is described in the following section. This
decision tool is to be used in tandem with the location model and financial model.
3.2.1 Procedure First, each technology is ranked within each criterion. Let the rank of each technology in each
criterion be 𝑟!,! , 𝑓𝑜𝑟 𝑖 = 1… 3, 𝑗 = 1… 3, where 𝑖 represents the technology and 𝑗 represents the
criterion.

11
Second, the answers given by the stakeholders will give the relative weights of importance for each
criterion. Let the values awarded by the stakeholder for each criterion be 𝑎! , 𝑓𝑜𝑟 𝑗 = 1… 3 and the
weights of importance for each criterion be 𝑤! , 𝑓𝑜𝑟 𝑗 = 1… 3. Then,
𝑤! =𝑎!𝑎!!
!!!, 𝑓𝑜𝑟 𝑗 = 1… 3
Third, the total rank can be calculated by the following equation:
𝑟!,! = 𝑟!,!𝑤!
!
!!!
, 𝑓𝑜𝑟 𝑎𝑙𝑙 𝑖
Finally, the technology best suited to the stakeholder’s preference will be technology 𝑖 based on
max 𝑟!,!, 𝑟!,!, 𝑟!,! . A sample of how the data would be organized is shown in Tables 1 and 2.
Table 1: Results from questionnaire
Net Conversion Efficiency
Environmental Impact
Commercial Availability
Value of Importance Awarded 5 4 3 Weight of Criterion 0.42 0.33 0.25
Table 2: Best suited technology based on results from questionnaire
Individual Rank by Criteria
Technology Net Conversion
Efficiency Environmental
Impact Commercial Availability Total Rank
Pyrolysis 2 1 2 1.67 Conventional Gasification 1 1 3 1.50 Plasma Arc Gasification 3 3 1 2.50
12
4.0 DISCUSSION
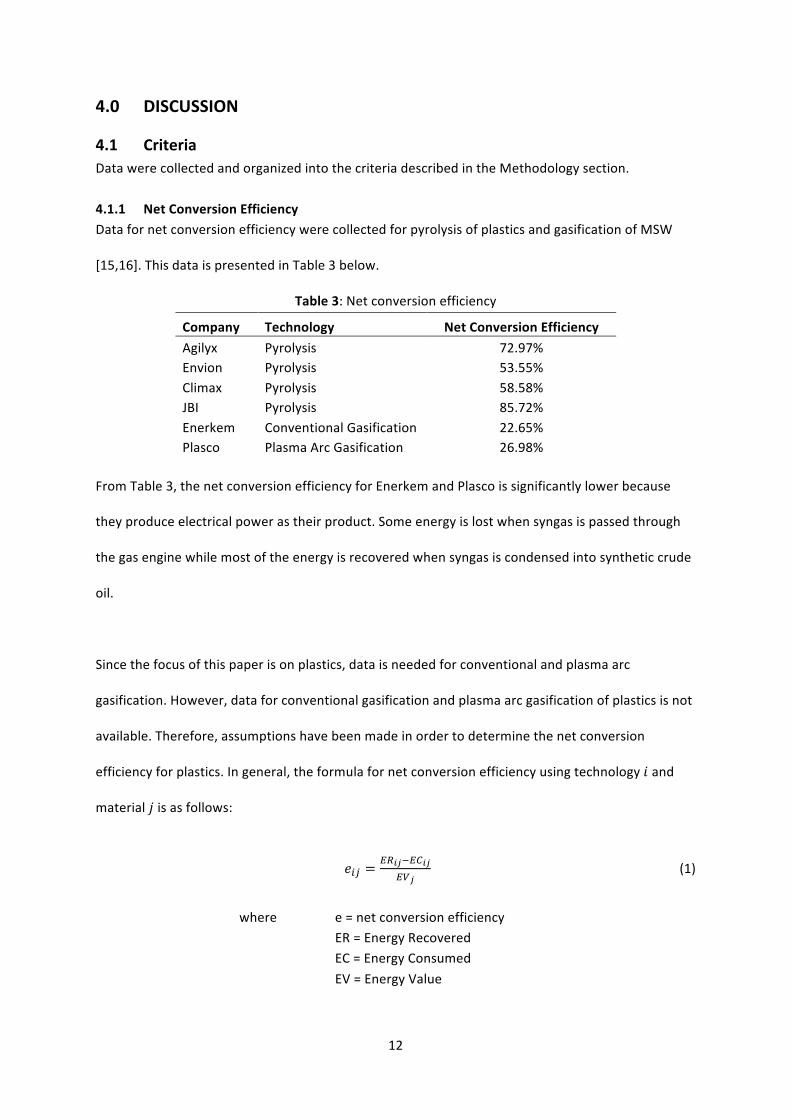
4.1 Criteria Data were collected and organized into the criteria described in the Methodology section. 4.1.1 Net Conversion Efficiency Data for net conversion efficiency were collected for pyrolysis of plastics and gasification of MSW
[15,16]. This data is presented in Table 3 below.
Table 3: Net conversion efficiency
Company Technology Net Conversion Efficiency Agilyx Pyrolysis 72.97% Envion Pyrolysis 53.55% Climax Pyrolysis 58.58% JBI Pyrolysis 85.72% Enerkem Conventional Gasification 22.65% Plasco Plasma Arc Gasification 26.98%
From Table 3, the net conversion efficiency for Enerkem and Plasco is significantly lower because
they produce electrical power as their product. Some energy is lost when syngas is passed through
the gas engine while most of the energy is recovered when syngas is condensed into synthetic crude
oil.
Since the focus of this paper is on plastics, data is needed for conventional and plasma arc
gasification. However, data for conventional gasification and plasma arc gasification of plastics is not
available. Therefore, assumptions have been made in order to determine the net conversion
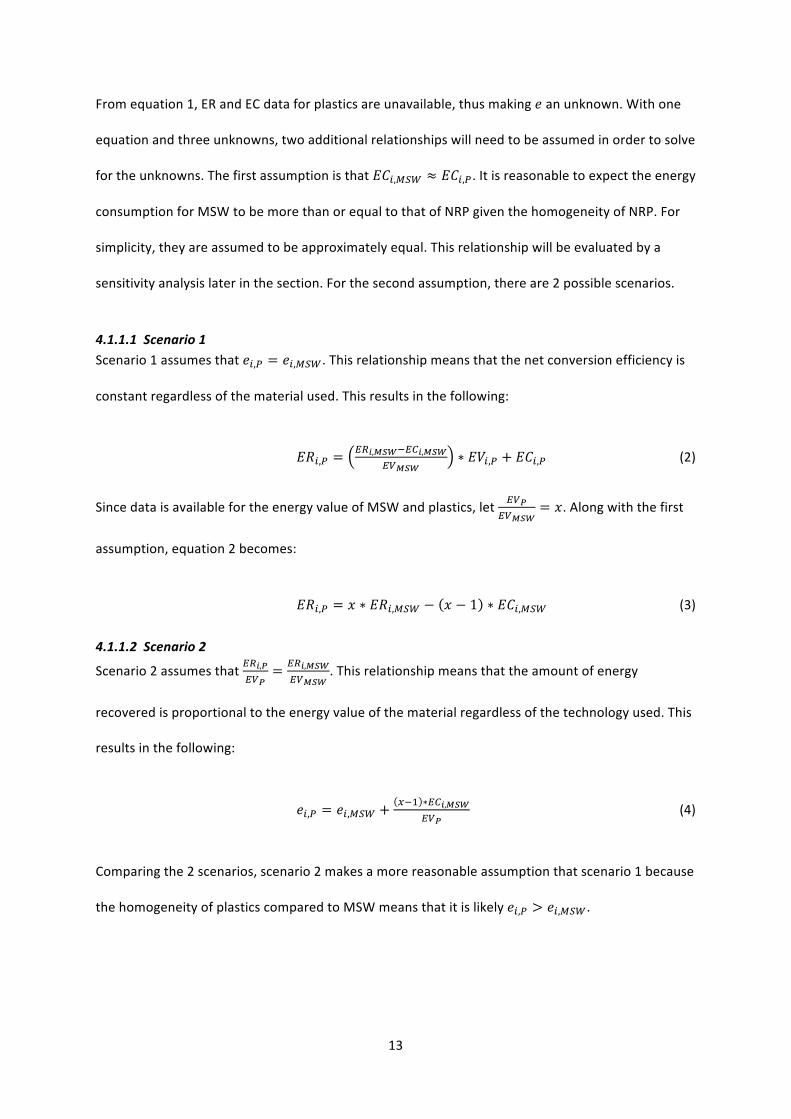
efficiency for plastics. In general, the formula for net conversion efficiency using technology 𝑖 and
material 𝑗 is as follows:
𝑒!" =!"!"!!"!"
!"! (1)
where e = net conversion efficiency
ER = Energy Recovered EC = Energy Consumed EV = Energy Value
13
From equation 1, ER and EC data for plastics are unavailable, thus making 𝑒 an unknown. With one
equation and three unknowns, two additional relationships will need to be assumed in order to solve
for the unknowns. The first assumption is that 𝐸𝐶!,!"! ≈ 𝐸𝐶!,!. It is reasonable to expect the energy
consumption for MSW to be more than or equal to that of NRP given the homogeneity of NRP. For
simplicity, they are assumed to be approximately equal. This relationship will be evaluated by a
sensitivity analysis later in the section. For the second assumption, there are 2 possible scenarios.
4.1.1.1 Scenario 1 Scenario 1 assumes that 𝑒!,! = 𝑒!,!"#. This relationship means that the net conversion efficiency is
constant regardless of the material used. This results in the following:
𝐸𝑅!,! =!"!,!"#!!"!,!"#
!"!"#∗ 𝐸𝑉!,! + 𝐸𝐶!,! (2)
Since data is available for the energy value of MSW and plastics, let !"!!"!"#
= 𝑥. Along with the first
assumption, equation 2 becomes:
𝐸𝑅!,! = 𝑥 ∗ 𝐸𝑅!,!"# − 𝑥 − 1 ∗ 𝐸𝐶!,!"# (3)
4.1.1.2 Scenario 2
Scenario 2 assumes that !"!,!!"!
= !"!,!"#!"!"#
. This relationship means that the amount of energy
recovered is proportional to the energy value of the material regardless of the technology used. This
results in the following:
𝑒!,! = 𝑒!,!"# + !!! ∗!"!,!"#!"!
(4)
Comparing the 2 scenarios, scenario 2 makes a more reasonable assumption that scenario 1 because
the homogeneity of plastics compared to MSW means that it is likely 𝑒!,! > 𝑒!,!"#.

14
Using scenario 2’s assumption, it is projected that the net energy recovered per ton of waste and net
conversion efficiency for conventional and plasma arc gasification will increase, as shown in Table 4
below.
Table 4: Projected net conversion efficiency
Company Technology Net Conversion Efficiency Enerkem Conventional Gasification 29.70% Plasco Plasma Arc Gasification 32.18%
4.1.1.3 Ranking In order to make a fair comparison between the technologies, it is assumed that if the crude oil from
pyrolysis is converted to electrical power, the net conversion efficiency will have to be multiplied by
the efficiency of a gas engine, which is 37.5% on average [9]. Table 5 shows the result.
Table 5: Net conversion efficiency compared on basis of production of electrical power
Company Technology Net Conversion Efficiency Agilyx Pyrolysis 21.89% Envion Pyrolysis 16.06% Climax Pyrolysis 17.57% JBI Pyrolysis 25.72% Enerkem Conventional Gasification 29.70% Plasco Plasma Arc Gasification 32.18%
Based on Table 5, the ranking of technologies by net conversion efficiency is as follows:
Table 6: Ranking by net conversion efficiency
Technology Ranking Pyrolysis 1 Conventional Gasification 2 Plasma Arc Gasification 3
As described in the methodology section, a rank of 3 means that that technology is the best.
Therefore plasma arc gasification has the best performance in the net conversion efficiency
criterion.
15
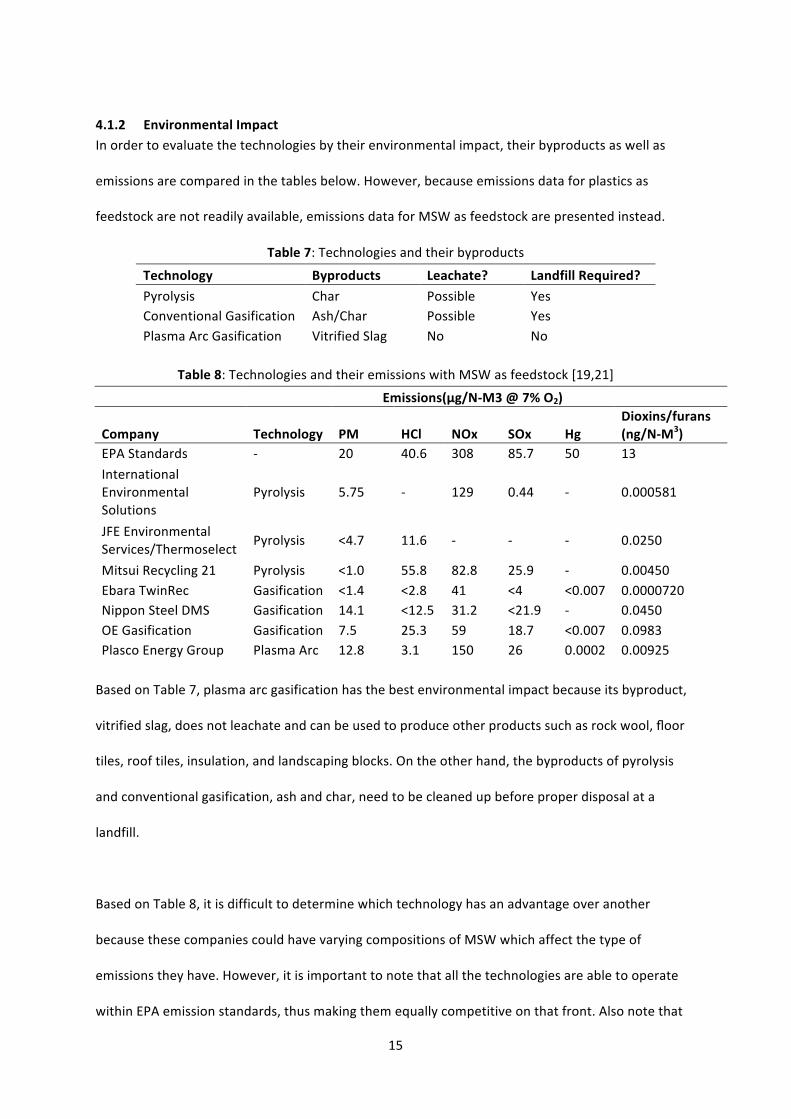
4.1.2 Environmental Impact In order to evaluate the technologies by their environmental impact, their byproducts as well as
emissions are compared in the tables below. However, because emissions data for plastics as
feedstock are not readily available, emissions data for MSW as feedstock are presented instead.
Table 7: Technologies and their byproducts
Technology Byproducts Leachate? Landfill Required? Pyrolysis Char Possible Yes Conventional Gasification Ash/Char Possible Yes Plasma Arc Gasification Vitrified Slag No No
Table 8: Technologies and their emissions with MSW as feedstock [19,21]
Emissions(μg/N-‐M3 @ 7% O2)
Company Technology PM HCl NOx SOx Hg Dioxins/furans (ng/N-‐M3)
EPA Standards -‐ 20 40.6 308 85.7 50 13 International Environmental Solutions
Pyrolysis 5.75 -‐ 129 0.44 -‐ 0.000581
JFE Environmental Services/Thermoselect Pyrolysis <4.7 11.6 -‐ -‐ -‐ 0.0250
Mitsui Recycling 21 Pyrolysis <1.0 55.8 82.8 25.9 -‐ 0.00450 Ebara TwinRec Gasification <1.4 <2.8 41 <4 <0.007 0.0000720 Nippon Steel DMS Gasification 14.1 <12.5 31.2 <21.9 -‐ 0.0450 OE Gasification Gasification 7.5 25.3 59 18.7 <0.007 0.0983 Plasco Energy Group Plasma Arc 12.8 3.1 150 26 0.0002 0.00925 Based on Table 7, plasma arc gasification has the best environmental impact because its byproduct,
vitrified slag, does not leachate and can be used to produce other products such as rock wool, floor
tiles, roof tiles, insulation, and landscaping blocks. On the other hand, the byproducts of pyrolysis
and conventional gasification, ash and char, need to be cleaned up before proper disposal at a
landfill.
Based on Table 8, it is difficult to determine which technology has an advantage over another
because these companies could have varying compositions of MSW which affect the type of
emissions they have. However, it is important to note that all the technologies are able to operate
within EPA emission standards, thus making them equally competitive on that front. Also note that

16
Mitsui Recycling 21’s HCl emissions exceed EPA’s standards but they operate in Japan and are within
Japan’s standards. This does not mean pyrolysis is unable to operate within EPA standards because
Thermoselect’s HCl emissions are within EPA standards.
4.1.2.1 Ranking After comparing the each technology’s environmental impact, their ranking is shown in Table 9.
Table 9: Ranking by environmental impact
Technology Ranking Pyrolysis 2 Conventional Gasification 1 Plasma Arc Gasification 3
Plasma arc gasification is given the highest rank because its byproduct, vitrified slag, does not impact
the environment compared to ash and char. Pyrolysis is given a rank of 2 because it has better
emissions that conventional gasification.
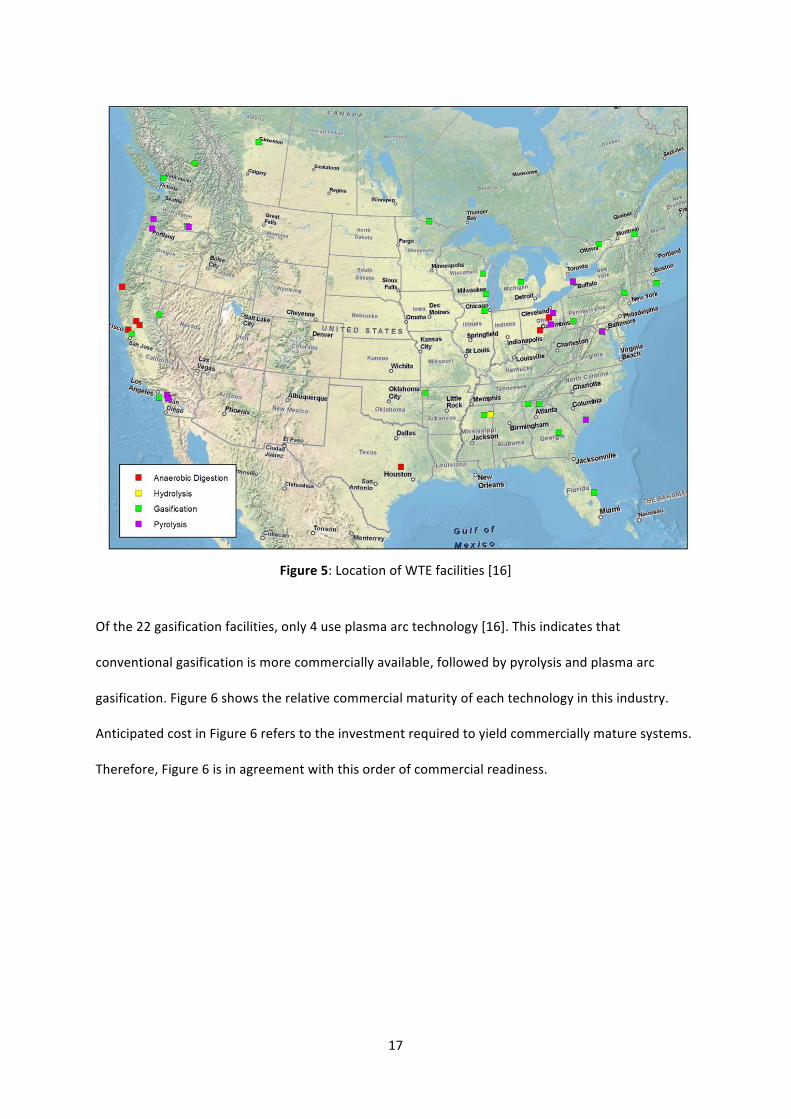
4.1.2 Commercial Availability This paper defines commercial availability as the number of facilities using the technology of
interest, which also directly correlates to the technology’s commercial maturity. In order to evaluate
the technology’s commercial availability, the number of facilities available in North America is
considered. From Figure 5 below, there are a total of 10 pyrolysis facilities and 22 gasification
facilities.
17
Figure 5: Location of WTE facilities [16]
Of the 22 gasification facilities, only 4 use plasma arc technology [16]. This indicates that
conventional gasification is more commercially available, followed by pyrolysis and plasma arc
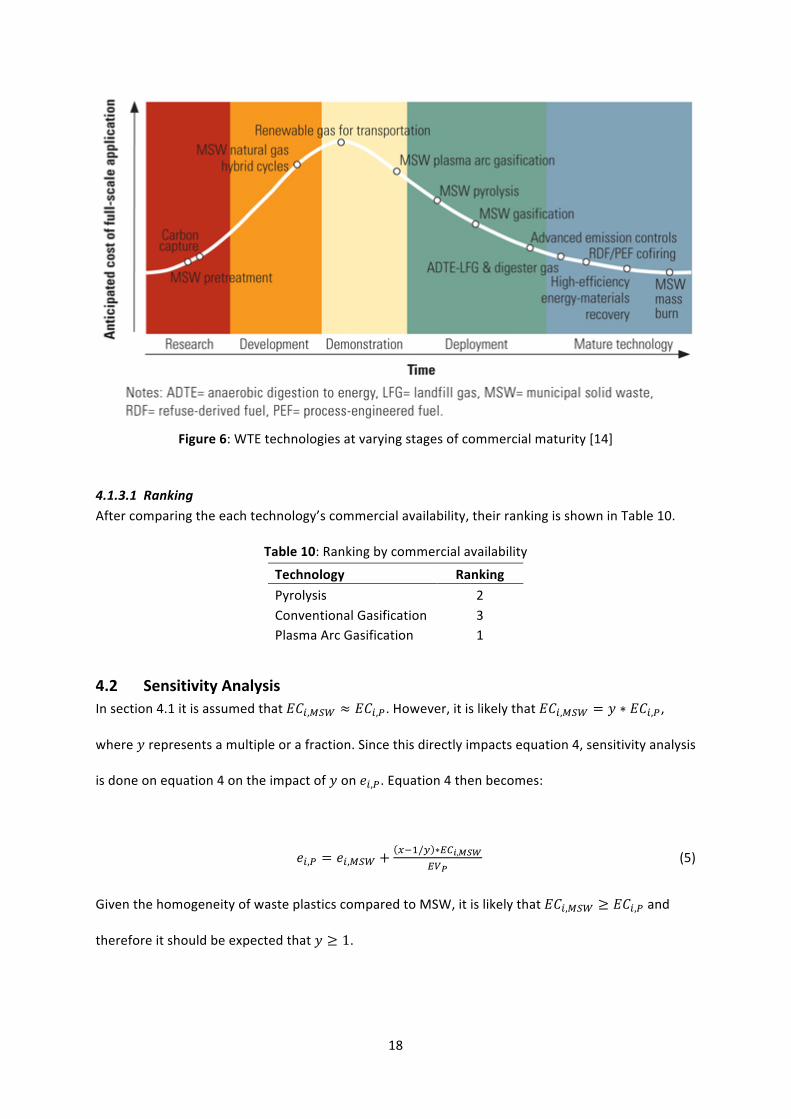
gasification. Figure 6 shows the relative commercial maturity of each technology in this industry.
Anticipated cost in Figure 6 refers to the investment required to yield commercially mature systems.
Therefore, Figure 6 is in agreement with this order of commercial readiness.
18
Figure 6: WTE technologies at varying stages of commercial maturity [14]
4.1.3.1 Ranking After comparing the each technology’s commercial availability, their ranking is shown in Table 10.
Table 10: Ranking by commercial availability
Technology Ranking Pyrolysis 2 Conventional Gasification 3 Plasma Arc Gasification 1
4.2 Sensitivity Analysis In section 4.1 it is assumed that 𝐸𝐶!,!"# ≈ 𝐸𝐶!,!. However, it is likely that 𝐸𝐶!,!"# = 𝑦 ∗ 𝐸𝐶!,!,
where 𝑦 represents a multiple or a fraction. Since this directly impacts equation 4, sensitivity analysis
is done on equation 4 on the impact of 𝑦 on 𝑒!,!. Equation 4 then becomes:
𝑒!,! = 𝑒!,!"# + !!!/! ∗!"!,!"#!"!
(5)
Given the homogeneity of waste plastics compared to MSW, it is likely that 𝐸𝐶!,!"# ≥ 𝐸𝐶!,! and
therefore it should be expected that 𝑦 ≥ 1.

19
Figure 7: Sensitivity of 𝑒!,! to 𝑦
Figure 7 shows that as 𝑦 increases, 𝑒!,! increases, albeit a 100% increase in 𝑦 results in only a 11%
increase in 𝑒!,!. Therefore the net conversion efficiency is not sensitive to a change in 𝑦, thus it is
relatively safe to assume 𝐸𝐶!,!"# ≈ 𝐸𝐶!,!.
Furthermore, in section 4.1.1.2, it is assumed !"!,!!"!
= !"!,!"#!"!"#
. However, it is possible that !"!,!!"!
= 𝑧 ∗
!"!,!"#!"!"#
, where 𝑧 represents a multiple or a fraction. This directly impacts equation 4, thus sensitivity
analysis is done on equation 4 on the impact of 𝑧 on 𝑒!,!. Equation 4 then becomes:
𝑒!,! = 𝑧 ∗ 𝑒!,!"# + !∗!!! ∗!"!,!"#!"!
(6)
It should be expected that 𝑒!,! and 𝑧 have a linear relationship of the form 𝑒!,! = 𝑧 ∗𝑚 + 𝑐.
0.3
0.31
0.32
0.33
0.34
0.35
0.36
0.37
1 1.1 1.2 1.3 1.4 1.5 1.6 1.7 1.8 1.9 2
e i,p
y
Sensibvity of ei,p to y
20
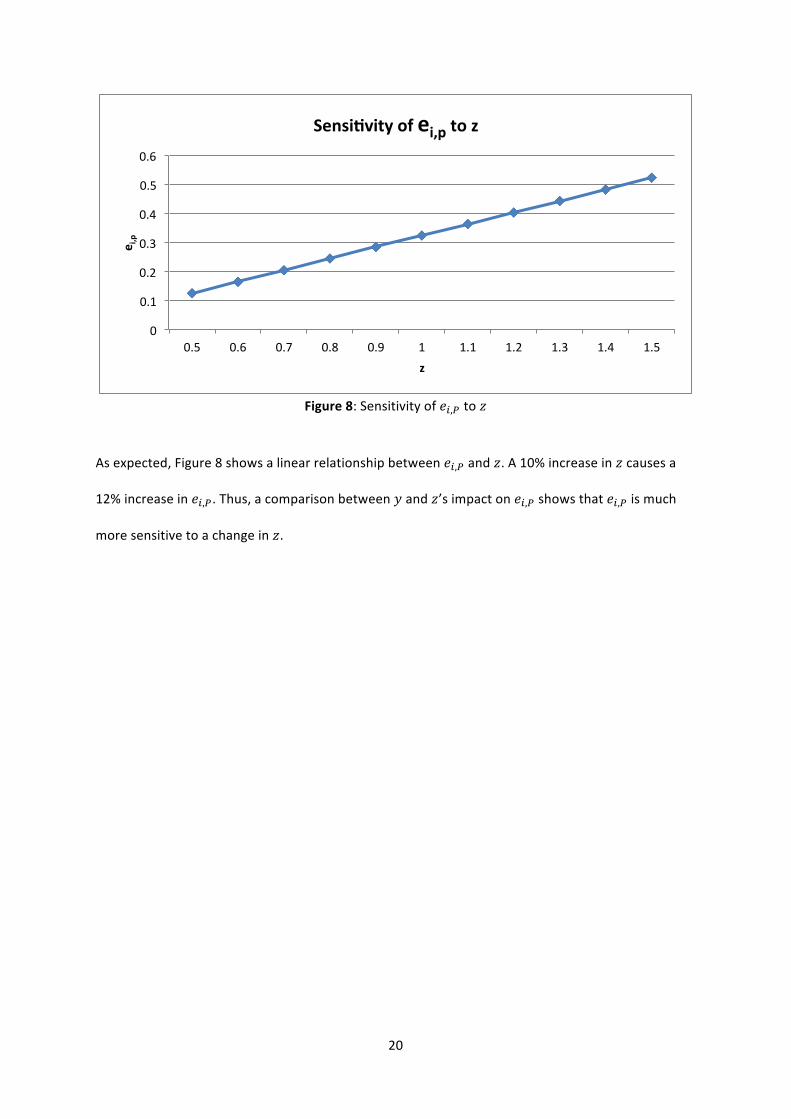
Figure 8: Sensitivity of 𝑒!,! to 𝑧
As expected, Figure 8 shows a linear relationship between 𝑒!,! and 𝑧. A 10% increase in 𝑧 causes a
12% increase in 𝑒!,!. Thus, a comparison between 𝑦 and 𝑧’s impact on 𝑒!,! shows that 𝑒!,! is much
more sensitive to a change in 𝑧.
0
0.1
0.2
0.3
0.4
0.5
0.6
0.5 0.6 0.7 0.8 0.9 1 1.1 1.2 1.3 1.4 1.5
e i,p
z
Sensibvity of ei,p to z

21
5.0 CONCLUSION Thus far in the analysis, there is no clear winner in any of the technologies based on the criteria
discussed. Table 11 shows a summary of the criteria evaluation.
Table 11: Summary of criteria evaluation
Technology Net Conversion
Efficiency Environmental
Impact Commercial Availability
Pyrolysis 1 2 2
Conventional Gasification 2 1 3
Plasma Arc Gasification 3 3 1 Therefore, the stakeholders need to consider their preferences and risk averseness and use the
decision tool developed and discussed in section 3.2. Although only 3 evaluation criteria are
considered in this report, additional evaluation criteria can be added by Dow by modifying the
technology decision tool. The technology decision tool has to be used in tandem with the location
decision tool and financial model developed by other reports of the same project to determine the
best suited technology and location for the most profits.
22
6.0 REFERENCES [1] Agilyx. http://www.agilyx.com/our-‐technology/. Accessed on 30 September 2012. [2] Alternative Resources Inc. Focused Verification and Validation of Advanced Solid Waste Management Conversion Technologies Phase 2 Study. Prepared for NYC Economic Development Corporation and NYC Department of Sanitation. [3] Perinaz Bhada. Feasibility analysis of waste-‐to-‐energy as a key component of integrated solid waste management in Mumbai, India. [4] CH2M HILL. Waste-‐to-‐Energy Alternatives. Prepared for Regional District of North Okanagan. http://www.durhamenvironmentwatch.org/Incinerator%20Solutions/WastetoEnergyReviewofAlternativesBC.pdf. Accessed on 19 November 2012. [5] Louis J. Circeo, Ph.D. Plasma Arc Gasification of Municipal Solid Waste. http://www.energy.ca.gov/proceedings/2008-‐ALT-‐1/documents/2009-‐02-‐17_workshop/presentations/Louis_Circeo-‐Georgia_Tech_Research_Institute.pdf. Accessed on 15 March 2013. [6] Citizens Budget Commission. Taxes in, Garbage out. The need for better solid waste disposal policies in New York City. [7] Marjorie J. Clarke. Introduction to Municipal Solid Waste Incineration. http://www.geo.hunter.cuny.edu/~mclarke/IntroMSWincineration.htm. Accessed on 3 December 2012. [8] Caroline Ducharme. Technical and economic analysis of Plasma-‐assisted Waste-‐to-‐Energy processes. [9] Gas Turbine. http://en.wikipedia.org/wiki/Gas_turbine. Accessed on 15 March 2013. [10] Gasification Technologies Council. http://www.gasification.org/page_1.asp?a=87&b=85. Accessed. On 3 December 2012. [11] Grow NYC. http://www.grownyc.org/recycling/facts. Accessed on 5 February 2013. [12] Keith Kenebrew, Dow Chemical. Interviewed on 7 November 2012. [13] Thomas Malkow. 2004. Novel and innovative pyrolysis and gasification technologies for energy efficient and environmentally sound MSW disposal. In Waste Management 24 (2004) 53-‐79 [14] Powermag. Waste-‐to-‐Energy Technology Options Increase but Remain Underutilized. http://www.powermag.com/issues/cover_stories/Waste-‐to-‐Energy-‐Technology-‐Options-‐Increase-‐but-‐Remain-‐Underutilized_4497_p3.html. Accessed on 15 March 2013.

23
[15] RTI International. Environmental and Economic Analysis of Emerging Plastics Conversion Technologies. Prepared for American Chemistry Council. [16] RTI International. State of Practice for Emerging Waste Conversion Technologies. Prepared for US Environmental Protection Agency. [17] Stantec. Waste to Energy. A Technical Review of Municipal Solid Waste Thermal Treatment Practices. Prepared for Environmental Protection Division, British Columbia. http://www.env.gov.bc.ca/epd/mun-‐waste/reports/pdf/BCMOE-‐WTE-‐Emissions-‐final.pdf. Accessed on 19 November 2012. [18] Thermoselect 2003. [19] University of California, Riverside. Evaluation of Emissions from Thermal Conversion Technologies Processing Municipal Solid Waste and Biomass. Prepared for BioEnergy Producers Association. [20] US Environmental Protection Agency. Combustion. http://www.epa.gov/osw/nonhaz/municipal/combustion.htm. Accessed on 3 December 2012. [21]US Environmental Protection Agency. Emission standards for large municipal waste combustors. http://www.epa.gov/ttn/atw/129/mwc/fr10my06.pdf. Accessed on 15 March 2013. [22] Westinghouse Plasma Corporation. 2007. [23] WORLD BANK TECHNICAL GUIDANCE REPORT. Municipal Solid Waste Incineration. http://www.worldbank.org/urban/solid_wm/erm/CWG%20folder/Waste%20Incineration.pdf. Accessed on 3 December 2012. [24] Gary C. Young. Municipal Solid Waste to Energy Conversion Processes: Economic, Technical, and Renewable Comparisons. John Wiley & Sons, Inc. 2010. [25] Heather Youngs. Waste to Energy in California: Technology, Issues and Context. Prepared for California Council on Science and Technology.

A-‐1
APPENDIX A – QUESTIONNAIRE We are a group of Master of Engineering students at UC Berkeley, working on a project studying the feasibility of implementing a solid waste to energy (WTE) plant. Part of this study includes choosing the right technology to process the waste. However, as each WTE technology has its own advantages and disadvantages, there will be trade-‐offs in choosing one technology over another. Thus, it is essential that we assess your organization's preferences through this survey to match the technology best suited to your organization. From a scale of 1 to 5, with 1 being low and 5 being high, please rank independently each criterion's importance to your organization. 1. What organization are you from? 2. Net conversion efficiency
This relates to the net amount of electricity or synthetic oil that can be recovered 1 2 3 4 5
3. Environmental Impact
This relates to the emissions as well as the byproducts that may require proper treatment before disposal. 1 2 3 4 5
4. Commercial Availability
The technologies are at different stages of development. This criterion will determine how much risk your organization is willing to take on relatively unproven technologies. 1 2 3 4 5