collegeofmarine studies newark, de 19716 euus
TRANSCRIPT
J ournal of Coastal Research Fort Lauderdale, Florida
Inter-Annual Spatial Variability in the Response ofSpartina alterniflora Biomass to Amount of Precipitation
Michael F. Gross' Michael A. Hardisky' Vytautas Klemas*
'Biology Department
Gettysburg College
Gettysburg, PA 17325
'Biolcgy Department
University of Scranton
Scranton, PA 18510
'College of Marine Studies
University of Delaware
Newark, DE 19716
ABSTRACT_••••••••••••••••_
,tllllllll:.:;,,;rr:r::y.euus'-:~ ",:..., a-
GROSS, M.F.; HARD/SKY, M.A., and KLEMAS, V., 1990. Inter-Annual Spatial Variability inthe Response of Spartina alterniflora Biomass to Amount of Precipitation. Journal of CoastalResearch, 6(4), 949-960. Fort Lauderdale, Florida, ISSN 0749-0208.
Although most plant species respond to increased precipitation by increasing biomass, thereare few reports that have examined long-term changes in the spatial distribution of biomasswithin a natural population in response to variability in precipitation. Qualitative comparisonsof biomass in 11 different drainage areas within a 580 ha area of smooth cordgrass (Spartinaalterniflora) in a Delaware, USA, salt marsh were made for eight different years, based onreflectance (vegetation index) values computed from Landsat MSS, Landsat TM, and SPOT satellite data. The vegetation index is highly correlated with live aerial biomass of this species.Significant correlation coefficients between quantity of precipitation and vegetation index values for seven of the drainage areas indicated that biomass was the most precipitation-sensitivein high salinity areas least influenced by upland runoff, and the least sensitive in parts of themarsh adjacent to large upland areas or freshwater creeks. Inter-annual variations in tidalflooding caused by varying mean sea level do not seem to influence spatial biomass patterns inthis marsh. These results indicate that (1) remote sensing can be used to monitor wetland biomass during periods of environmental (e.g., precipitation) change and (2) differences in thegrowth response of S. alternitlora to variability in precipitation exist on a relatively small spatial scale along a salinity gradient.
ADDITIONAL INDEX WORDS: Salt marsh, biomass, precipitation, vegetation index, salinity,remote sensing, Delaware, tidal inundation, Spartina alterniflora.
INTRODUCTION
One of the most biologically productive natural communities is the salt marsh. Coastalsalt marshes in eastern North America aredominated by smooth cordgrass, Spartina alterniflora (REIMOLD, 1977), which occurs as several height forms (VALlELA, TEAL and DEUSER, 1978; NIERING and WARREN, 1980). Itcommonly grows along a salinity gradient ranging from near freshwater salinities to oceanicsalinities, and its productivity is known to beinfluenced by salinity (LONGSTRETH andSTRAIN, 1977; NESTLER, 1977; LlNTHURSTand SENECA, 1981). Productivity and biomasscan therefore be expected to vary within amarsh as a function of interstitial salinity, aswell as other factors like sulfide levels (MENDELSSOHN and MCKEE, 1988), anaerobicconditions (PEZESHKI, DELAUNE and LIN-
89079 received 6 December 1989; accepted in revision 25 May 1990.
DAU, 1988), levels of available nitrogen(HOWES, DACEY and GOEHRINGER, 1986),and abundance of fiddler crabs and ribbed mussels (BERTNESS, 1984, 1985), Although it iscommon knowledge that, in the laboratory,decreasing the salinity increases production,the impact of soil salinity on production underfield conditions is less straightforward (DELEEUW, OLFF and BAKKER, 1990) because ofthe influence of other factors such as those mentioned above.
There have been many studies of the aerialbiomass and productivity of this Spartina species (KEEFE, 1972; TURNER, 1976; DAME andKENNY, 1986). Short form plants are usuallyless productive than taller plants. Most of theliterature values were obtained by harvestingthe vegetation, which has several drawbacks.Because this technique is destructive, it isimpossible to measure and compare the biomassof a particular clump of plants between years.Harvesting and processing of vegetation samples is also very tedious, time-consuming, and
950 Gross, Hardisky and Klemas
labor-intensive. Consequently, only a smallportion of a marsh can be studied at a time. Asa result of the above-mentioned disadvantagesof the harvest technique of measuring biomass,there have been few reports of changes in biomass between years for a particular area ofvegetation. DAME and KENNY (1986) did reportsubstantial year-to-year variability in thestanding crop biomass of Spartina alterniflorain South Carolina (SC), and noted that thequantity of biomass seemed to be related to thequantity of precipitation. MORRIS (pers.comm.) found a significant positive correlationbetween biomass in South Carolina and meanJuly/August sea level, suggesting that morefrequent flooding events lowered substrate salinities, thereby stimulating production. However, these investigators sampled only a smallportion of the marsh. In addition to the lack ofdata on inter-annual variability of biomass atone site, there have been few attempts to studyinter-annual changes in the spatial distribution of Spartina biomass throughout a marsh.
In recent years, remote sensing has beenemployed to predict salt marsh biomass rapidlyand nondestructively. The quantity of red andnear-infrared electromagnetic radiation reflected by as. alterniflora canopy is directlyrelated to its dry live aerial biomass, and canbe used to estimate standing crop biomass ornet annual primary productivity (HARDISKYet al., 1984; GROSS et al., 1987). With remotesensing, it is possible to derive estimates ofbiomass for entire marshes, year after year. Theobjectives of this study were to use satelliteimagery to determine (1) if there are interannual differences in the spatial distribution oflive standing crop biomass in a S. alternifloramarsh and, if so, (2) are the differences relatedto the amount of precipitation or to variabilityin sea level. We were attempting to answerquestions such as: Is the biomass of a high salinity part of the marsh affected by the quantityof precipitation as much as an area where thesalinity is lower? How does yearly variability inthe number and duration of tidal floodingevents influence biomass distribution in themarsh? In addition to its scientific value, thisinformation would be beneficial to resourcemanagers, who often need to make wetland usedecisions based on wetland value, and often usemacrophytic biomass as a criterion for measuring value.
MATERIALS AND METHODS
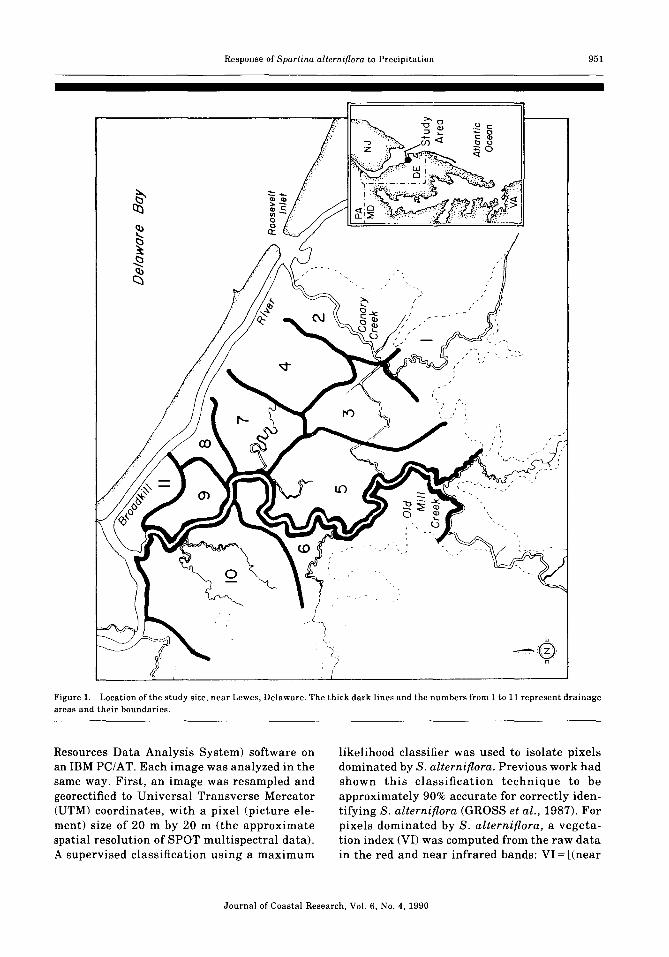
The area selected for study is a salt marshnear Lewes, Delaware (DE), USA, containing580 ha of S. alterniflora (Figure 1). The marshis drained by two creeks, Canary Creek and OldMill Creek. Both empty into the BroadkillRiver, which empties into the Delaware Bay atits mouth. The salinity of water at the mouth ofthe Broadkill River is often similar to that ofthe ocean. A strong salinity gradient is evidentin this marsh, particularly along Old MillCreek. Numerous measurements of interstitialand creekwater salinities in this marsh conducted as part of several studies during the lastten years consistently revealed higher salinities in the drainage areas closest to the mouthof Old Mill Creek and Canary Creek (typically30-40 parts per thousand [ppt] during the growing season), than in the drainage areas close tothe headwaters (typically 5-10 ppt). In addition, creekbank salinities are normally muchlower than inland marsh salinities. Spartinaalterniflora is dominant in areas where the salinity is usually greater than 5-10 ppt. In lowersalinity areas, other species such as S. cynosuroides, Scirpus spp., Phragmites australis,Acnida cannabina, and Hibiscus moscheutospredominate.
Based on topographic features visible onlarge scale aerial photographs, and the boundaries of tidal creeks and ditches, the parts of themarsh dominated by S. alterniflora weredivided into 11 segments corresponding todrainage areas (Figure 1).
Eight satellite images of the marsh were chosen for study. They were 27 September 1978Landsat Multispectral Scanner (MSS), 3 July1979 MSS, 21 September 1984 Landsat Thematic Mapper (TM), 23 August 1985 TM, 13September 1986 Systeme Probatoire d'Observation de la Terre (SPOT), 22 July 1987 SPOT,15 August 1988 SPOT, and 9 July 1989 SPOT.These images were selected because they represented the period of peak S. alterniflora biomass, were cloud-free, and were in the University of Delaware's archives. It would have beenpreferable to use images from the same date foreach year, but this was not possible because ofcloud cover. Only one image per year wasselected for analysis, so that each year wouldhave equal weight.
Images were analyzed using ERDAS (Earth
Journal of Coastal Research, Vol. 6, No.4, 1990
Response of Spartina alterniflora to Precipitation 951
Figure 1. Location of the study site, near Lewes, Delaware. The thick dark lines and the numbers from 1 to 11 represent drainageareas and their boundaries.
Resources Data Analysis System) software onan IBM PC/AT. Each image was analyzed in thesame way. First, an image was resampled andgeorectified to Universal Transverse Mercator(UTM) coordinates, with a pixel (picture element) size of 20 m by 20 m (the approximatespatial resolution of SPOT multispectral data).A supervised classification using a maximum
likelihood classifier was used to isolate pixelsdominated by S. alterniflora. Previous work hadshown this classification technique to beapproximately 90% accurate for correctly identifying S. alterniflora (GROSS et al., 1987). Forpixels dominated by S. alterniflora, a vegetation index (VI) was computed from the raw datain the red and near infrared bands: VI = [(near
Journal of Coastal Research, Vol. 6, No.4, 1990
952 Gross, Hardisky and Klemas
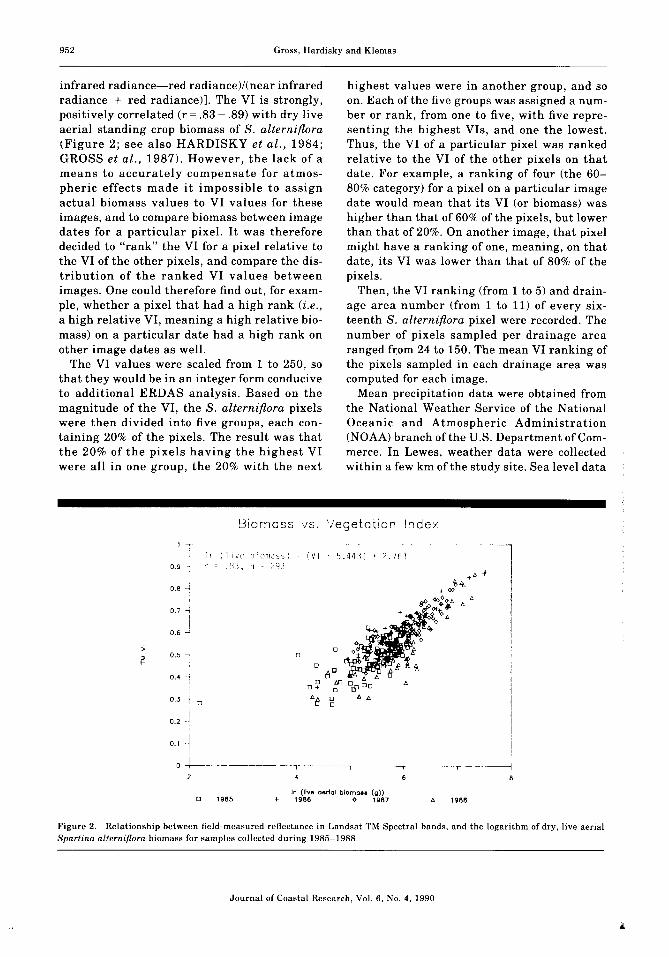
infrared radiance-red radiancel/tnear infraredradiance + red radiance)]. The VI is strongly,positively correlated (r = .83 - .89) with dry liveaerial standing crop biomass of S. alterniflora(Figure 2; see also HARDISKY et al., 1984;GROSS et al., 1987). However, the lack of ameans to accurately compensate for atmospheric effects made it impossible to assignactual biomass values to VI values for theseimages, and to compare biomass between imagedates for a particular pixel. It was thereforedecided to "rank" the VI for a pixel relative tothe VI of the other pixels, and compare the distribution of the ranked VI values betweenimages. One could therefore find out, for example, whether a pixel that had a high rank (z.e.,a high relative VI, meaning a high relative biomass) on a particular date had a high rank onother image dates as well.
The VI values were scaled from 1 to 250, sothat they would be in an integer form conduciveto additional ERDAS analysis. Based on themagnitude of the VI, the S. alterniflora pixelswere then divided into five groups, each containing 20% of the pixels. The result was thatthe 20% of the pixels having the highest VIwere all in one group, the 20% with the next
highest values were in another group, and soon. Each of the five groups was assigned a number or rank, from one to five, with five representing the highest VIs, and one the lowest.Thus, the VI of a particular pixel was rankedrelative to the VI of the other pixels on thatdate. For example, a ranking of four (the 6080% category) for a pixel on a particular imagedate would mean that its VI (or biomass) washigher than that of 60% of the pixels, but lowerthan that of 20%. On another image, that pixelmight have a ranking of one, meaning, on thatdate, its VI was lower than that of 80% of thepixels.
Then, the VI ranking (from 1 to 5) and drainage area number (from 1 to 11) of every sixteenth S. alterniflora pixel were recorded. Thenumber of pixels sampled per drainage arearanged from 24 to 150. The mean VI ranking ofthe pixels sampled in each drainage area wascomputed for each image.
Mean precipitation data were obtained fromthe National Weather Service of the NationalOceanic and Atmospheric Administration(NOAA) branch of the U.S. Department of Commerce. In Lewes, weather data were collectedwithin a few km of the study site. Sea level data
Biomass vs. \/egetation Index
oo
o
0.7 -i
I0.6 -
0.3
0.5 ~
:>
'1I I n (I I V p b i 011Ias, ) (V[ J . 443! • ;;. I h 1
0.9 - .:U, n ? 91
0.8 -"1
0.2
i0.1 -j
" 1988o 1985
o +--"-"" -~-------,------ -- "I---------~-T------___,__-- --~ - -- .. ------------14 8
In (live cerlct biomo•• (g»+ '966 o 1987
Figure 2. Relationship between field- measured reflectance in Landsat TM Spectral bands, and the logarithm of dry, live aerialSpartina alterniflora biomass for samples collected during 1985-1988.
Journal of Coastal Research, Vol. 6, No.4, 1990
Response of Spartina alterniflora to Precipitation 953
collected using a tide gauge near Lewes wereobtained from the National Ocean Service ofNOAA. For each drainage area and for all eightyears, yearly or seasonal precipitation and sealevel data were regressed with the mean VIranking to determine if there was a correlationbetween mean ranked VI and either precipitation amount or sea level. Four transformationsof sea level data were tested: mean sea level,and number of hours per month when the sealevel was greater than 2 m (6.5 ft), 2.14 m (7.0ft), or 2.44 m (8.0 ft). The mean tide gauge reading of sea level is about 1.5 m at this site. Meantidal or precipitation amounts for various combinations of months (e.g., March through June,January through May, June of previous yearthrough June of current year, etc.) wereregressed against mean ranked VI for eachdrainage area. Since the analyzed images werefrom the July-September period, no data laterthan June of the image year were used in theregression analysis. Tidal data were unavailable for 1978 and 1979.
To summarize the procedure, each pixel wasranked based on the value of its VI relative tothe value of the VI of all of the other pixels ina particular image. There were five VI rankingsor groups, each containing the same number ofpixels, regardless of sea level or quantity of precipitation in a particular year. Correlationsbetween the ranked, or relative VI of a drainagearea and precipitation or sea level are not correlations between actual VI and precipitationor sea level, but rather reflect the response ofthat drainage area to the independent variable,relative to the response of other drainage areas.For example, a positive correlation results ifthe mean ranked VI of a drainage areaincreases as precipitation increases (and therefore decreases as precipitation decreases). Thismeans that, relative to other drainage areas,this particular drainage area shows a greaterchange in VI (biomass) in response to precipitation events. In other words, its plants aremore sensitive to quantity of precipitation thanare plants in an "average" drainage area. Conversely, a negati ve correlation between theranked VI of an area and precipitation meansthat the VI (biomass) of the area is less responsive than average to precipitation. It does notnecessarily mean that biomass declines inresponse to an increase in precipitation. If vegetation in different drainage areas responds
equally, or to the same extent, to changes inprecipitation, one would not expect to find anysignificant correlations between mean rankedVI and precipitation (actually, for 11 drainageareas, one significant correlation would beexpected at p = .10 based on chance alone),because mean ranked VI for a particular drainage area would be relatively constant.
To determine if precipitation could indeedhave a substantial impact on interstitial salinity, salinity measurements were made fromwithin an area of short S. alterniflora in drainage area 2 at regular intervals throughout thesummer of 1989, a very wet summer (precipitation in Lewes during June, July and Augustwas about twice the normal amount). In addition, for three other sites, an area of shortplants, medium-height plants, and tall plantsgrowing along a creekbank, June and Augustinterstitial salinity levels were compared for1987 (a dry summer) and 1989. Salinity measurements were made by removing a core ofsoil, squeezing water from the soil using asyringe and filter paper, and then measuringthe salinity using a refractometer. Salinity wasmeasured at 5 em depth intervals.
RESULTS
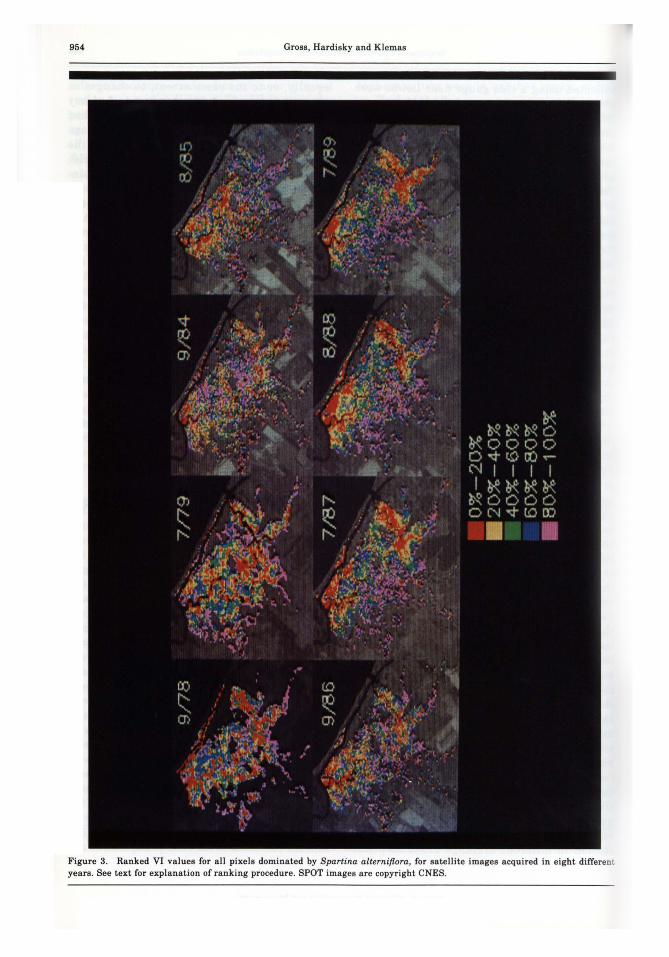
In looking at the distribution of pixels withinthe VI ranking in each image (Figure 3), it isapparent that a particular pixel did not alwayshave the same rank. This is manifest in thevariability of the color pattern between images.In addition, large patches of similar color (i.e.,similar relative VI or similar relative biomass)are evident: the distribution of pixels intoranked groups does not appear to be random.
Precipitation for various time periods prior tothe date of image acquisition was regressedagainst mean VI ranking for all eight years,performing separate regressions for each drainage area. There were strong, significant correlations for several drainage areas, particularlywith spring precipitation amounts, and withprecipitation from the previous growing season.The strongest set of correlations occurred withprecipitation from a ten month period: Marchthrough October of the year previous to imagecollection, plus May and June of the year of theimage acquisition. Using precipitation fromthis time period as a variable, there were significant correlations between precipitation and
Journal of Coastal Research, Vol. 6, No.4. 1990
954 Gross, Hardisky and Klemas
Figure 3. Ranked VI values for all pixels dominated by Spartina alterniflora, for satellite images acquired in eight differentyears. See text for explanation of ranking procedure. SPOT images are copyright CNES .
Response of Spartina alterniflora to Precipitation 955
DISCUSSION
Table 1. Pearson correlation coefficient between drainagearea and precipitation for eight years.
A main assumption of our procedure is thatthe nature of the correlation between dry live
n = 8 (1978, 79, 84, 85, 86, 87, 88, 89)* = significant at p < .10
** = significant at p < .05
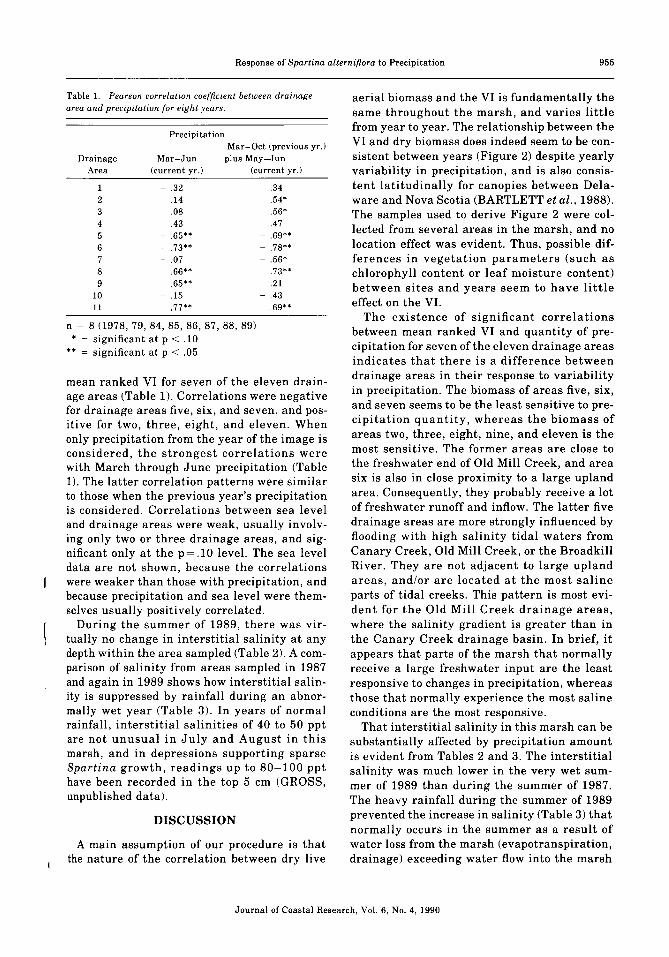
aerial biomass and the VI is fundamentally thesame throughout the marsh, and varies littlefrom year to year. The relationship between theVI and dry biomass does indeed seem to be consistent between years (Figure 2) despite yearlyvariability in precipitation, and is also consistent latitudinally for canopies between Delaware and Nova Scotia (BARTLETT et al., 1988) .The samples used to derive Figure 2 were collected from several areas in the marsh, and nolocation effect was evident. Thus, possible differences in vegetation parameters (such aschlorophyll content or leaf moisture content)between sites and years seem to have littleeffect on the VI.
The existence of significant correlationsbetween mean ranked VI and quantity of precipitation for seven of the eleven drainage areasindicates that there is a difference betweendrainage areas in their response to variabilityin precipitation. The biomass of areas five, six,and seven seems to be the least sensitive to precipitation quantity, whereas the biomass ofareas two, three, eight, nine, and eleven is themost sensitive. The former areas are close tothe freshwater end of Old Mill Creek, and areasix is also in close proximity to a large uplandarea. Consequently, they probably receive a lotof freshwater runoff and inflow. The latter fivedrainage areas are more strongly influenced byflooding with high salinity tidal waters fromCanary Creek, Old Mill Creek, or the BroadkillRiver. They are not adjacent to large uplandareas, and/or are located at the most salineparts of tidal creeks. This pattern is most evident for the Old Mill Creek drainage areas,where the salinity gradient is greater than inthe Canary Creek drainage basin. In brief, itappears that parts of the marsh that normallyreceive a large freshwater input are the leastresponsive to changes in precipitation, whereasthose that normally experience the most salineconditions are the most responsive.
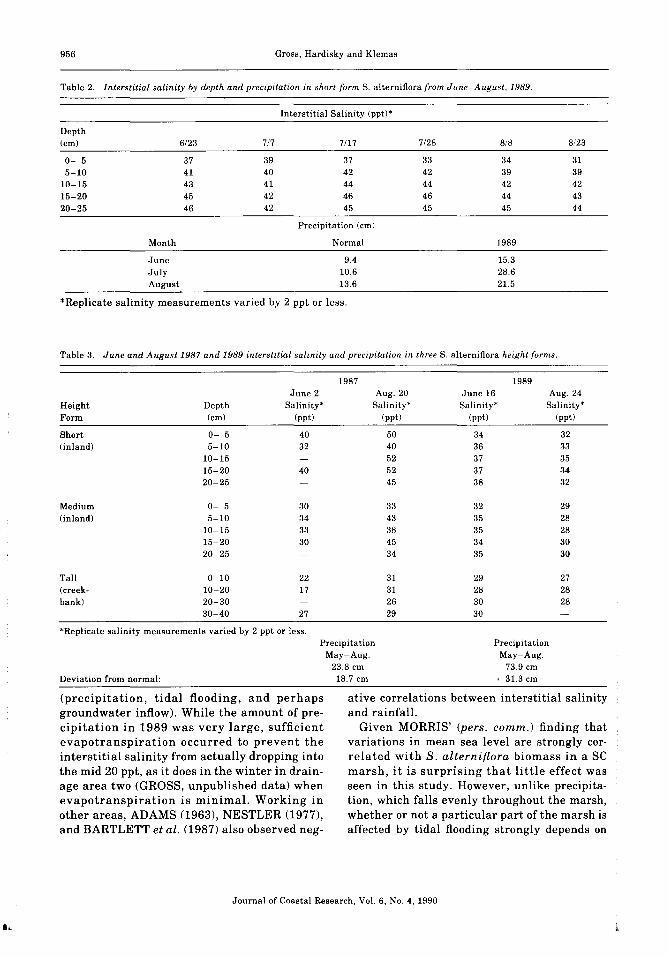
That interstitial salinity in this marsh can besubstantially affected by precipitation amountis evident from Tables 2 and 3. The interstitialsalinity was much lower in the very wet summer of 1989 than during the summer of 1987.The heavy rainfall during the summer of 1989prevented the increase in salinity (Table 3) thatnormally occurs in the summer as a result ofwater loss from the marsh (evapotranspiration,drainage) exceeding water flow into the marsh
PrecipitationMar-Oct (previous yr.)
plus May-Jun(current yr.)
- .32 .34- .14 .54*- .08 .56*
.43 .47- .65** - .69**- .73** - .78**- .07 - .56*
.66** .73**
.65** .21- .15 - .43
.77** .69**
Mar-Jun(current yr.)
123456789
1011
DrainageArea
mean ranked VI for seven of the eleven drainage areas (Table 1). Correlations were negativefor drainage areas five, six, and seven, and positive for two, three, eight, and eleven. Whenonly precipitation from the year of the image isconsidered, the strongest correlations werewith March through June precipitation (Table1). The latter correlation patterns were similarto those when the previous year's precipitationis considered. Correlations between sea leveland drainage areas were weak, usually involving only two or three drainage areas, and significant only at the p = .10 level. The sea leveldata are not shown, because the correlationswere weaker than those with precipitation, andbecause precipitation and sea level were themselves usually positively correlated.
During the summer of 1989, there was virtually no change in interstitial salinity at anydepth within the area sampled (Table 2). A comparison of salinity from areas sampled in 1987and again in 1989 shows how interstitial salinity is suppressed by rainfall during an abnormally wet year (Table 3). In years of normalrainfall, interstitial salinities of 40 to 50 pptare not unusual in July and August in thismarsh, and in depressions supporting sparseSpartina growth, readings up to 80-100 ppthave been recorded in the top 5 em (GROSS,unpublished data).
Journal of Coastal Research, Vol. 6, No.4, 1990
956 Gross, Hardisky and Klemas
Table 2. Interstitial salinity by depth and precipitation in short-form S. alterniftora from June-August, 1989.
Depth(em)
0- 55-10
10-1515-2020-25
Interstitial Salinity (ppt)'
6/23 7/7 7/17 7/28 8/8 8/23
37 39 37 33 34 3141 40 42 42 39 3943 41 44 44 42 4245 42 46 46 44 4346 42 45 45 45 44
Precipitation (ern)
Month Normal 1989
June 9.4 15.3July 10.6 28.6August 13.6 21.5
*Replicate salinity measurements varied by 2 ppt or less.
Table 3. June and August 1987 and 1989 interstitial salinity and precipitation in three S. alterniftora height forms.
HeightForm
Short(inland)
Medium(inland)
Tall(creekbank)
1987June 2 Aug. 20
Depth Salinity' Salinity'(em) (ppt) (ppt)
0- 5 40 505-10 32 40
10-15 5215-20 40 5220-25 45
0- 5 30 335-10 34 43
10-15 33 3815-20 30 4520-25 34
0-10 22 3110-20 17 3120-30 2630-40 27 29
1989June 16 Aug. 24Salinity' Salinity'
(ppt) (ppt)
34 3236 3337 3537 3438 32
32 2935 2835 2834 3035 30
29 2728 2830 2830
'Replicate salinity measurements varied by 2 ppt or less.
Deviation from normal:
PrecipitationMay-Aug.
23.8 ern-18.7 em
PrecipitationMay-Aug.
73.9 em+ 31.3 em
(precipitation, tidal flooding, and perhapsgroundwater inflow). While the amount of precipitation in 1989 was very large, sufficientevapotranspiration occurred to prevent theinterstitial salinity from actually dropping intothe mid 20 ppt, as it does in the winter in drainage area two (GROSS, unpublished data) whenevapotranspiration is minimal. Working inother areas, ADAMS (1963), NESTLER (1977),and BARTLETT et al. (1987) also observed neg-
ative correlations between interstitial salinityand rainfall.
Given MORRIS' (pers. comm.) finding thatvariations in mean sea level are strongly correlated with S. alterniflora biomass in a SCmarsh, it is surprising that little effect wasseen in this study. However, unlike precipitation, which falls evenly throughout the marsh,whether or not a particular part of the marsh isaffected by tidal flooding strongly depends on
Journal of Coastal Research, Vol. 6, No.4, 1990
Response of Spartina alterniflora to Precipitation 957
its elevation. Salinity will not be altered muchby increased tidal flooding due to higher thannormal sea levels if an area is frequentlyflooded at normal sea levels. Conversely, anarea relatively high in elevation could bestrongly affected by increased tidal flooding(MORRIS, pers. comm.). There are no recentdata available on the relative elevations of theparts of the marsh investigated in this study, soit is not possible to determine how much impacta particular change in sea level would have onthe number of tidal flooding events occurring inthe drainage areas. Another factor of importance is the salinity of the floodwaters themselves. In the parts of the marsh closest to theDelaware Bay waters, flooding waters have salinities of around 30-35 ppt, whereas sectionsof the marsh in drainage areas five and six areflooded by waters of around 10-15 ppt. Clearly,all else being equal, the lower salinity waterswill have a greater effect on lowering the interstitial salinity. Another factor of importance isthe degree of saturation of the substrate at thetime of flooding. Saturated soils will not be ableto absorb any water and will be less affected byprecipitation/tidal flooding than unsaturatedsoils.
It is interesting that precipitation amountsfrom the previous growing season appear tohave an impact on biomass. Perhaps variationsin salinity affect translocation of reserves usedduring the following spring for growth. Or,areas of decreased productivity during droughtyears may not be able to recover fully withinjust one year. This is a topic that should beresearched further.
The growth of S. alterniflora may be affectedby many factors, including salinity, aeration/anaerobiosis, and nitrogen availability (NESTLER, 1977; SMART and BARKO, 1978; LINTHURST and SENECA, 1981; HOWES,DACEY and GOEHRINGER, 1986; MENDELSSOHN and MCKEE, 1988; PEZESHKI,DELAUNE and LINDAU, 1988; among others),abundance of animals like fiddler crabs andribbed mussels (BERTNESS, 1984, 1985),genetic factors (GALLAGHER et al., 1988), andintraspecific competition (SMART, 1986;BERTNESS, 1988). Numerous controlled culture experiments have shown that salinity andaerial biomass are inversely correlated (seeHOWES, DACEY and GOEHRINGER, 1986,for a summary of the literature), but field evi-
dence of a salinity effect on growth is difficultto gather because of the influence of other factors such as anoxic conditions, nutrient availability, and sulfides. While acknowledging thatincreased water input to the marsh (such asthrough precipitation or tidal flooding) couldreplace oxygen in the substrate, resulting inanoxic conditions and increased formation oftoxins such as hydrogen sulfide, it appears that,in this marsh, on the spatial scale of drainageareas, the dominant effect of increased precipitation is to increase biomass production bylowering the interstitial salinity. Certainly, indepressions that collect water, the growthinhibiting effects caused by increased durationof anoxic conditions could be expected to outweigh growth stimulation caused by a decreasein salinity.
ZEDLER (1983) reported that a short-termreduction in salinity caused by heavy rainfallwas followed by a 40% increase in the biomassof S. foliosa, a North American West Coast relative of S. alterniflora. LINTHURST and BLUM(1981) and LINTHURST and SENECA (1981)reported major reductions in S. alterniflora biomass for plants grown in culture in 45 ppt NaCIus. those growing in 30-35 ppt NaC!. Salinitiesin the vicinity of 40-50 ppt are quite commonin DE salt marshes during summers of normalprecipitation, especially in the top 5 or 10 cm,where most live root material is located in shortform plants (GROSS et al., submitted). DRAKEand GALLAGHER (1984), working in the sameDE marsh as ourselves, found production andheight to be negatively correlated with salinity,determined that short form plants (low biomass) had lower turgor pressures than high biomass (tall) plants, and recorded interstitial salinities of up to 80 ppt in short form areas. Ourwork suggests that, in this marsh, yearly variability in precipitation causes variations ininterstitial salinity that are significant enoughto be manifest as satellite-detectable changesin the VI (biomass). The plants in the mostsaline parts of the marsh are the most saltstressed and therefore respond the most toshifts in precipitation quantity.
Many investigators have observed changes inwetlands herbaceous vegetation over time as aresult of changing environmental conditions.For example, CIVCO, KENNARD and LEFOR(1986) used aerial photographs to studychanges in areal coverage of S. alterniflora inresponse to tidal fluctuations and management
Journal of Coastal Research, Vol. 6, No.4, 1990
960 Gross, Hardisky and Klemas
o RESUMEN 0A pesar de que algunas especies de plantas responden con un incremento de biomasa a un aumento de las precipitaciones, sonpocos los estudios que se han preocupado por analizar las variaciones a largo plazo de la distribuci6n espacial de la biomasa enuna poblaci6n natural afectada por la variabilidad de las precipitaciones. Se ha realizado una comparaci6n cualitativa de biomasaen 11 zonas de drenaje diferentes, comprendidas en un area de 580 ha de Spartina alterniflora en Delaware, USA. Se estudiaronlas marismas en 8 anos diferentes basandose en los valores de reflectancia (indice de vegetaci6n) obtenidos por el Landsat MSS,Landsat TM y el satelite SPOT. EI indice de vegetaci6n esta altamente correlacionado con la biomasa viva de las especies. Lasignificativa correlaci6n obtenida entre los valores del volumen de precipitaciones y los indices de vegetaci6n para siete de laszonas estudiadas indican que la biomasa es la mas sensible a las precipitaciones en areas muy salinas y mucho menos en zonasde la marisma pr6ximas a terrenos mas elevados 0 a r ios de agua dulce. La distribuci6n de biomasa parece no verse influenciadapor las variaciones intermareales debidas a las inundaciones mareales causadas por variaciones del nivel media. Estos resultadosindican que (1) la teledetecci6n puede emplearse para conocer las variaciones de la biomasa en zonas humedas durante periodosde cambio ambiental (por ejemplo, precipitaciones) y (2) existen diferencias en la respuesta de la S. alterniflora a la variahilidadde las precipitaciones pero s610 a una escala espacial relativamente pequeria a 10 largo del gradiente de salinidades.-Departmentof Water Sciences, University of Cantabria, Santander, Spain.
o RESUME 0Bien que la plupart des especes de plantes reporident a une augmentation des pluies par une augmentation de la biomasse, il y apeu d'etudes qui aient examine les transformations along terme de la distribution spatiale de la biomasse au sein d'une populationnaturelle, comme reponse a des variations de precipitations. Une comparaison qualitative de la biomasse de 11 zones de drainagereparties dans une zone de 580 ha de marais maritime du Delaware (Etats Unis) et couverts de spartines, a ete faite pour 8 annees,a partir de donnees de reflectance (indice de vegetation) MSS et TMde Landsat, et de Spot. Les indices de vegetation sont fortementcorreles avec la biomasse foliaire de cette espece, II y a une correlation significative entre la quantitc de precipitations et I'indicede vegetation pour 7 des 8 zones de drainage. Cela indique que la biomasse est plus sensible aux precipitations dans les zones deforte salinite moins influencees par les eaux de ruisselIement, et moins sensible dans les parties du marais jouxtant les vasteshautes terres au les ruisseaux d'eau douce. Les variations interannuelles des inondations dues aux variations du niveau moyende la mer ne semblent pas influencer la repartition spatiale de la biomasse dans ces marais. Ces result.ats montrent, 1°) que l'onpeut utiliser la teledetection pour controler la biomasse des terres humides au cours de periodes OU se produisent des changementsde I'environnement (precipitations); 2°) qu'il y a des differences de croissance de Spartina alterniflora qui repondent ala var-iabil itedes precipitations a une echelle spatiale relativement petite, selon un gradient de slainite.-Catherine Bressolier, GeomorphologieEPHE, Montrouge, France.
o ZUSAMMENFASSUNG 0Obgleich die meisten pflanzenarten aufzunehmende Niederschlage mit zunehmender Biomassenproduktio reagieren, gibt es wenige Arbeiten, die die langzeitliche raumliche Verteilung der Biomasse innerhalb einer naturlichen Population in Abhangigkeitvon den Schwankungen der Niederschlage behandeln. In 11 unterschiedlichen Einzugsgebieten einer 580 ha groBen Schlickgrasflache aus Spartina alterniflora in Delaware, USAS, wurden in 8 Jahren qualitative Vergleiche der Biomasse mittels Reflexionsdaten (Vegetationsindex) aus Landsat MSS, Landsat TM und Spot SatelIitendaten vorgenommen. Der Vegetationsindex zeighteine sehr gute Korrelation mit der aktiven Biomasse dieser Pflanzenart. Straffe Beziehungen zwischen der Menge der Niederschlage und dem Vegetationsindex fur 7 der Einzugsgebiete zeigen, daf die Biomasse in "high salinity" Gebieten auf Niederschlagsanderungen und Abflusse aus dem Binnenland sensibel reagiert. Relativ unempfindlich sind dagegen kiistenferne Marschgebiete mit zunehmendem SiiBwassereinfluB. Jahrliche Variationen tidebedingter Uberflutungen durchMeereaspiegelanderungen beeinflussen die raumliche Biomassenverteilung der untersuchten Marschen nicht. Diese Ergebnissezeigen, daB die Methoden der Fernerkundung anwenbar sind, urn die Biomasse von Feuchtgebieten mit verandertichen Urn weltbedingungen zu iiberwachen und daB Wachetumeanderungen von Schlickgras aufgrund schwankender Niederschlage nur in einemrelative schmalen Bereich entlang des SalzgehaltsgefalIes stattfinden.-Reinhard Dieckmann, WSA Bremerhaven, FRG.
Journal of Coastal Research, Vol. 6, No.4, 1990