collegiate aviation review international - …uaa/docs/car(i)_journal_vol-34.1.v3.pdf ·...
TRANSCRIPT

ii

iii
COLLEGIATE AVIATION REVIEW
INTERNATIONAL
A PEER REVIEWED JOURNAL OF THE
UNIVERSITY AVIATION ASSOCIATION
Todd P. Hubbard
Editor-in-Chief

iv
COLLEGIATE AVIATION REVIEW INTERNATIONAL YEAR 2016 VOLUME # 34 ISSUE # 1 Todd P. Hubbard, Editor-in-Chief Copyright © 2016 University Aviation Association ISSN Number: 1523-5955 Electronic delivery: uaa.aero Managed by: David McAlister All correspondence and inquiries should be directed to: University Aviation Association 2415 Moore’s Mill Road, Ste. 265-216 Auburn, AL 36830 Tel. (334) 528-0300 Central E-mail: [email protected]

v
Editorial Board
of the
Collegiate Aviation Review International
Todd P. Hubbard University of Oklahoma
Editor-in-Chief
POC Europe/New East/Africa
Yi Gao Swinburne University of Technology
Associate Editor
POC Australia/New Zealand
Jason Newcomer Embry-Riddle Aeronautical University—Worldwide
Associate Editor
POC Americas
Mark Sherman Broward College
Associate Editor
POC Asia
David Ison Embry-Riddle Aeronautical University--Worldwide
Editor/Advisor
Scholarly Commons

vi
Managing Editorial Board of the
Collegiate Aviation Review International
Wendy Beckman Middle Tennessee State University Elizabeth Bjerke University of North Dakota Timm J. Bliss Oklahoma State University Thomas Carney Purdue University Gerald Chubb Ohio State University Patti Jo Clark Embry-Riddle Aeronautical University--Worldwide Chad Depperschmidt Oklahoma State University Peter Dittmer Utah Valley University Wayne Dorman Utah Valley University Richard Fanjoy Purdue University Ramon-Osvaldo Gonzalez Farmingdale State College Mavis Green CUNY Aviation Institute at York College Jacqueline Luedtke Embry-Riddle Aeronautical University--Prescott John H. Mott Purdue University David NewMyer Southern Illinois University at Carbondale Gary Northam Embry-Riddle Aeronautical University--Prescott Matthew Romero Southern Illinois University at Carbondale Lorelei Ruiz Southern Illinois University at Carbondale James Simmons Metropolitan State University of Denver Scott Winter Florida Institute of Technology

vii
ACKNOWLEDGEMENTS No juried publication can excel without the tireless efforts of experts from all aerospace disciplines who volunteer their time to serve as anonymous reviewers. Indeed, the ultimate guarantors of quality and appropriateness of scholarly materials for a professional journal are the knowledge, integrity, and thoroughness of those who serve in this capacity. The thoughtful, careful, and timely work of the Editorial Board and the issue reviewers add substantively to the quality of the journal. One behalf of our Editorial Board, we extend our thanks.

viii
STATEMENT OF OBJECTIVES The University Aviation Association publishes the Collegiate Aviation Review International throughout each calendar year. Papers published in each volume and issue are selected from submissions that were subjected to a blind peer review process. The University Aviation Association is the only professional organization representing all levels of the non-engineering/technology element in collegiate aviation education and research. Working through its officers, trustees, committees and professional staff, the University Aviation Association plays a vital role in collegiate aviation and in the aerospace industry. The University Aviation Association accomplishes its goals through a number of objectives:
To encourage and promote the attainment of the highest standards in aviation education at the college level To provide a means of developing a cadre of aviation experts who make themselves available for such activities as consultation, aviation program evaluation, speaking assignment, and other professional contributions that stimulate and develop aviation education To furnish an international vehicle for the dissemination of knowledge relative to aviation among institutions of higher learning and governmental and industrial organizations in the aviation/aerospace field To foster the interchange of information among institutions that offer non-engineering oriented aviation programs including business technology, transportation, and education To actively support aviation /aerospace oriented teacher education with particular emphasis on the presentation of educational workshops and the development of educational materials covering all disciplines within the aviation and aerospace field
University Aviation Association 2415 Moore’s Mill Road, Ste. 265-216
Auburn, AL 36830 Tel. (334) 528-0300
Central E-mail: [email protected]

ix
Editor’s Commentary What is the purpose of research inquiries as applied to aviation and aerospace? In some small way, each study we publish helps everyone on the planet get closer to our shared objective: to escape Earth and set up residence elsewhere before our Sun swallows us up in a spectacular supernova. So no matter how seemingly insignificant, studies with limited scope are necessary and vital. When editors easily dismiss the work of researchers, they unnecessarily slow our progress toward our objective. Peer reviews are valued and necessary, because they ensure the highest quality of research, if the reviewers resist too narrow a view of possibilities. It is good to disagree, but it is no sin to have either opposing view. The editorial board embraces the six elements of Thomas Kuhn’s structure of research: (1) normal science; (2) puzzle-solving; (3) paradigm; (4) anomaly; (5) crisis; and (6) revolution (in The Structure of Scientific Revolutions: 50th Anniversary Edition, 2012). The articles in Volume 34, Issue 1 fit nicely within Kuhn’s structure. Mehta and Rice studied the effect of system wide trust among U.S. and Indian passengers. Their study helps us understand the difference in paradigm between nationalities. Ison and Szathmary help us understand the nature of academic integrity, by describing and testing the plagiarism paradigm that underlies software snitching routines like SafeAssign. Morris’ paper on the question of whether the NTSB statistics support current FAA third class medical policy challenges our reliance on a certificate to forecast possible connections between accidents and recency of certification. Finally, Swartz, Donovan, and Clower lend support to decision-makers on whether or not to maintain and improve general aviation airports, if economic indicators show a direct correlation between adequate facilities and corporate use of the airport. I hope readers will enjoy this issue and will think about sending us their manuscripts as well. TpH

10
Table of Contents
System Wide Trust: A Possible Contagion Effect .................................................................................... 12
Assessing Academic Integrity Using SafeAssign Plagiarism Detection Software ................................. 35
Do NTSB Statistics Support Current FAA Third Class Medical Policy? ................................................ 48
Airport Capability, Aviation Activity and Economic Activity at General Aviation Airports ................... 55

11
Peer-Reviewed Researched Studies

12
System Wide Trust: A Possible Contagion Effect
Rian Mehta and Stephen Rice Florida Institute of Technology
Abstract
System Wide Trust (SWT) theory states that when dealing with independent components of one
systems, a failure in one component can have a negative effect on the person’s trust in other components. The
purpose of this study was to examine the extent of the declining trust and whether the failure of an automated
aid on board a commercial airline flight would have a contagion effect on the trust in other aids and human
entities. The study included 392 participants from the United States and India, who were presented with a
hypothetical scenario wherein the automated system that operates the oxygen masks on a commercial flight had
failed. Participants were asked to rate their trust in the failed automated aid, as well as four other independent
devices/aids on board the aircraft. They were then asked to rate their trust in the pilot, co-pilot, flight
attendants, the maintenance manager, and the CEO of the airline. The SWT effect as well as the contagion
effect was found to exist for both countries of origin thus suggesting that passengers treat all the automated
aids and human entities involved in a commercial airline flight as part of one system. The cross cultural analysis
between the two nationalities showed that American participants were more extreme in their responses under
both scenarios as compared to their Indian counterparts. Additionally, a mediation analysis revealed that affect
(emotion) was a mediating factor in the relationship between the condition and the trust ratings.
Introduction
Automation has increasingly become part of everyday life over the past two decades. This is especially
true for the commercial aviation industry. With the increased usage of automation over the years, has also come
an increase in the reliance or trust in these systems to perform accurately and effectively over and over again
(Dzindolet, Peterson, Pomranky, Pierce, & Beck, 2003; Parasuraman & Riley, 1997). There are many facets to
the complex relationship between trust and automation. One realm of this field of research has involved System
Wide Trust (SWT) Theory. SWT theory suggests that an operator tends assign a single level of trust in a system
as a whole rather than in the independent aids, and therefore treats a group of automated aids as one system
(Geels-Blair, Rice, & Schwark, 2013; Keller & Rice, 2010; Rice & Geels, 2010). The focus of previous SWT
studies has been on automated aids. For the purpose of this study aids, and automated aids refers to devices or
technological systems the assist or are necessary components in the overall task of operating a flight. This study
seeks to determine the presence of one possible contagion effect, wherein trust in human entities declines due to
the presence of a failure in an automated aid. The study will also conduct a cross-cultural analysis to determine if
the effects vary as a function of country of origin by utilizing participants from both India and the United States
of America. Lastly, the study will perform a mediation analysis using affect as a potential mediator to determine
whether participants are basing their decisions on emotions.

13
Trust and Automation
Trust can be defined in different ways, depending on the context of the research setting. The definition
of trust that is most apt for this research is the one put forth by previous studies (Deutsch, 1958; Eckel &
Wilson, 2004; Ergeneli, Saglam, & Metin, 2007) which states that trust is the predictability of another person.
Similarly, Meyer, et. al (1995) stated that trust could be explained in the form of vulnerability and
relinquishment of control to another person or object. Lastly, trust has also been defined as being dependent
on the performance of an object or an individual and the faith in the same to perform what is expected (Barber,
1983; Rempel et al., 1985; Rotter, 1967). The similarities in all the previous research lies in the idea of defining
trust as a psychological construct or emotion based on faith and dependence in what is expected of another
person or object. For the purpose of this study, the Meyer, et. al (1995) definition of trust is most appropriate.
Trust, while being a strong psychological construct, can be volatile. Once trust in a person, object or
system is lost, it can be difficult to regain. Slovic (1993) claimed that if trust is lost it might never be recovered.
This shows the importance of trust in any industry, especially one such as aviation. Trust is crucial in so many
of the relationships involved in aviation such as the human-human trust between the passengers and the pilots,
the human-automation relationship between the pilots and the automation, and many more.
Automation has begun to take leading role in the operation of commercial airline flights, and therefore
understanding the relationship between trust and the automation is of significance to the research industry.
Studies have shown that the perception of reliability significantly affects a person’ trust in the automation (Lee
& See, 2004; Geels-Blair, Rice, & Schwark, 2013; Wiegmann, Rich & Zhang, 2001; Parasuraman & Riley, 1997;
Rice, 2009; Muir, 1994; Rice & Geels, 2010; Muir, & Moray, 1996). While human-to-human trust has been
defined as a psychological construct, Geels-Blair, Rice and Schwark (2013) stated that the same idea of trust
could be applied to the trust relationship between the human and the machine. Additionally, Rice (2009)
showed a positive relationship between reliance and trust, whereby operators were more trusting when they
were able to predict the outcome of the automation.
Cultural Considerations
Aviation being a universal industry around the world, it is important to understand how consumers
from different countries and cultures perceive different situations. Culture has been defined as “a set of shared
values and beliefs that characterize national, ethnic, moral and other group behavior” (Faure and Sjostedt 1993;
Craig and Douglas 2006; Adapa 2008). For the purpose of this research, participants from the United States of
America and India were used to determine the presence of any differences between how consumers felt
towards the situation.
While these two nationalities represent participants from two widely separated geographic regions,
each also represents a different type of cultural society. Hofstede (1980, 2001) stated that the Indian culture was
collectivistic in nature. India scored a 48 out of a 100 on the individualistic versus collectivist dimension on
Hofstede’s Cultural Values Index (Robbins & Judge, 2009). Similarly, The United States scored a 91 out of 100
on the same index. Rice, et. al (2014) stated, however, that due to the median score of 48, Indian culture may
exhibit some individualistic tendencies even though being collectivistic in general. Markus and Kitayama (1991)
explained that in a collectivistic society citizens are considered to be interdependent on one another, while in an
individualistic culture such as the United States, citizens tend to be more independent.

14
Citizens of individualistic cultures are taught to not trust without questioning, and to always be
independent, while those of collectivistic societies are taught to never question authority and encouraged to
always trust (Han, 1994; Wu & Jang, 2008). Trubisky, et. al. (1991) also stated that individualists are more
confrontational in nature while collectivists tend to be more avoiding and obliging.
Individualistic cultures lay an emphasis on an individual’s autonomy and independence (Bochner, 1994;
Kashima & Callan, 1994), while collectivists tend to be focused on the well-being of others and the best
interests of the community. These cultural differences do have an impact on the mindset of consumers from
different countries and therefore do have an impact on the way they trust. Collectivistic citizens are more likely
to trust other people than their individualistic counterparts (Hofstede, 1980). These cultural differences are
therefore important to research and understand as they may have an impact on different consumers’ propensity
to trust, and may therefore provide plausible explanations for the differences in the participants’ feelings
towards the scenarios.
Previous studies that have employed similar cross-cultural analyses have shown that while participants
from both India and the United States shared many similar points of view, American participants were more
dramatic in their responses as compared to their Indian counterparts. These differences could be related to the
participants’ different mindsets when dealing with uncertain situations such as automation failures. Since
collectivists have a higher tendency to trust, this could be inferred as a form of taking more risks in uncertain
situations such as automation failures. The aim of this study is to see if these differences continue to exist
between the two cultures and if they continue to have similar impacts on the participants’ level of trust.
Passengers in commercial air travel are from around the world, and so it is important to research the
differences in passengers’ mindsets from all across the globe.
Affect
Affect, or emotion, is considered to bring about some variance and unpredictability when dealing with
a person’s decision-making process (Bechara, 2004). While this may not necessarily be a negative aspect, it is
important to research and understand the mindset of the participant, which may lead to providing the research
with valuable context and plausible explanations as to what impacts the consumers’ decisions. Alpert and
Rosen (1990) suggested that affect can have several different meanings and interpretations of emotions based
on the situation. Affect has been described by psychologists as a set of dimensions that include displeasure,
distress, depression, excitement, and many more (Russell, 1980). Similarly, it is important to note that Lewis
and Wiegert (1985) stated that interpersonal trust has cognitive and affective foundations. Russell (2003) went
on to state that at the heart of emtions are “core affect” states of feeling simply good or bad, and these states
can influence reflexes, perception, cognition, and behavior. Lastly, affect has also been analyzed from a
geographical perspective to understand its differences and influences around the globe (Thien, 2005).
Affect has been used in previous studies to determine whether it is a possible mediator for the
consumers’ perceptions of the scenario (Campbell, 2007; Winter, Rice, & Mehta, 2014; Baker & Cameron,
1996; Rice, Winter, Kraemer, Mehta, & Oyman, in press; Babin, & Attaway, 2000). These studies have shown
the influence emotions have on decision making, whereby affect often times mediates the relationship between
the condition and the effect. Previous sections have laid out the relationship between trust and automation,
where trust is deemed to be a psychological construct. Being a psychological construct based on past
experiences and memories, trust will also be influenced by emotions. For the context of this research setting, it
is appropriate to trust as an affect-based construct. Affect-based trust has been defined by McAllister (1995) as
a type of trust in which emotional ties between individuals are created by sincere concern and support. The
15
purpose of the mediation analysis in this research context is to determine whether affect mediates the effect of
the SWT theory and the possible contagion effect as well. If affect were found to mediate the relationship, it
would allow for a plausible explanation that emotions played a hand in the participants’ decline in trust in the
overall system of automated aids and human entities due to a failure at an individual level of one automated aid.
Current Study
The current study seeks to expand the SWT line of research. Previous studies have researched the
effect by utilizing operators and consumers in different forms of systems (Keller & Rice, 2009). While some of
these studies have been involved in the field of aviation automation (Geels-Blair, Rice, & Schwark, 2013), this
study is the first to analyze to possibility of a contagion effect from automation to humans. The study seeks to
determine whether there is transference of feelings or changes n trust levels towards human entities when there
is an automation failure on board a commercial airline flight.
Similar to previous SWT studies, participants will be given a hypothetical scenario of a commercial
airline flight. They were then asked to rate their feelings and levels of trust in a number of automated aids and
human entities. In the context of this research setting, the commercial airline flight with the automation and the
human operators all together will be considered as the system. The automated aids involved are the oxygen
masks, the auto-pilot system, the airplane’s flaps, the landing gear, and the video screens on the backs of the
seats. The human entities are the pilot, the co-pilot, the flight attendants, mechanics, and airline CEO. The
study utilizes participants from the United States and India in order to conduct a cross-cultural analysis to
determine whether differences exist between consumers from different geographic regions. Lastly, the study
utilizes the affect data in order to conduct a mediation analysis to determine if affect is in fact a mediator
between the condition and the effect. There is valuable insight to be gained from determining if the effect is
based on the participants’ emotions. The hypotheses for the current study were as follows:
H1: In the failure condition, there will be a drop in trust in the unrelated automated aids or human
entities compared to the non-failure condition.
H2: There will be a difference in trust and affect ratings for the unrelated automated aids or human
entities as a function of country of origin.
H3: The relationship between the condition and trust will be mediated by affect.
H4: There will be an interaction between the independent variables. However, this is a non-directional
prediction, as we have no a priori basis for a directional prediction.

16
Methods
The study includes a multistage process that includes a a two way factorial ANOVA, a three way
ANOVA, and a mediation analysis. These aspects are elaborated at each stage.
Participants. Three hundred ninety-two (131 females) participants from India and the United States participated
in the study. There were equal amounts of participants from each country. The mean age was 32.30 (SD =
9.87).
Materials and Stimuli. The study was conducted using an online instrument developed with FluidSurveys ®.
Participants were recruited via Amazon’s ® Mechanical Turk ® (MTurk). MTurk provides participants who
complete human intelligence tasks in exchange for monetary compensation. Prior research shows that data
from MTurk is as reliable as normal laboratory data (Buhrmester, Kwang, & Gosling, 2011; Germine, et al.,
2012). Participants were asked to fill out a consent form and then given instructions. All participation was
voluntary and anonymous through MTurk, and all participants were compensated for the completion of the
survey.
Procedure. Participants were presented with a hypothetical scenario of being on board a commercial airline flight.
There were two versions of the questionnaire, one containing a failure of an automated aid (failure condition),
and one containing no failure (control condition). Each of the hypothetical scenarios and their corresponding
questions are shown in Appendix A. In the failure condition, the automated aid that fails was the oxygen
masks. The participants were randomly assigned to either of the groups.
The survey asked participants to rate their feelings of trust in various different automated aids, and
human entities. The ratings were measured on a Likert-type scale from -3 (extremely distrust) to +3 (extremely
trust) with a neutral option of zero (neither trust nor distrust). Affect was measured using three questions on
the instrument to gauging how the participants feel about the scenario. The questions presented to the
participants are shown in Appendix B. Lastly, participants were asked for demographic information, debriefed
and dismissed.
Design
Stage 1. For the set of analyses, the study utilizes an experimental factorial design. First, a two-way factorial
ANOVA was conducted on the affect data to understand the differences between the affect ratings of the
participants from India and the United States. The independent variables were Failure/Non Failure of the
automation, and Country of Origin. Secondly, a three-way factorial ANOVA using a 2x2x10 design was
conducted on the trust data. The three independent variables being measured in this study were Failure/Non
Failure of the automation, Country of Origin, and type of automated device or category of human entity. The
dependent variable was trust.
Stage 2. The initial analysis performed a three-way ANOVA which included all five automated aids and five
human entities including the oxygen masks. The oxygen mask was the automated aid that was said to have
failed and so it is expected to experience a lower level of trust from the participant. For this reason, a second
analysis was performed. For this analysis the scored for the four remaining automated aid were averaged into
one rating, and the scores of the five human entities were averaged into another. This stage utilized a three-way
factorial ANOVA with a 2x2x2 design. The three independent variables being measured were still Failure/Non
Failure of the automation, Country of Origin, and type of automated device or category of human entity.

17
However, the levels of the last IV were the average ratings of the automated aids, and the average ratings of the
human entities. Trust remained the dependent variable.
Stage 3. The final analysis conducted in this study was a mediation analysis to determine whether affect was a
possible mediator for the effect. The mediation analysis was conducted for participants from both countries to
compare the failure condition to the non-failure condition with respect to their feelings towards the automated
aids and human entities. For this stage in the analysis, the oxygen mask ratings were excluded as well.
For all the analyses in the three stages, the scale of measurement for both DVs (trust and affect) is
ordinal, but the data was treated as an interval scale of measurement. This assumption was made as values of
equal magnitude difference were assigned to each response of the Likert type scale (Göb, McCollin, and
Ramalhoto, 2007).
Results
Stage 1
To produce a single value describing the participant’s overall trust in the situation, all the values of the
trust questions were averaged into one. The same was done for the affect data. A Cronbach’s Alpha test was
conducted for each as a measure of internal consistency. A two-way ANOVA was conducted on the affect
data, with Failure/Non Failure of the automation, and Country of Origin of the participants as the factors.
There was a main effect of Failure, F(1, 388) = 225.610, p < .001, partial-eta squared = 0.371. There was a main
effect of Country, F(1, 388) = 6.203, p = .001, partial-eta squared = 0.022. These effects were qualified by a
significant interaction between Failure and Country, F(1, 388) = 11.960, p < .001, partial-eta squared = .003. This
suggests that the American participants were more extreme in their views towards failure condition as
compared to their Indian counterparts. Figure 1 displays the affect data for both participant groups in both
conditions.
Figure 1. Affect Data for Indian and U.S. participants for Failure and Non- Failure.
Failure IndiaNon-Failure
IndiaFailure USA
Non-FailureUSA
Series1 -0.51 1.03 -1.30 1.16
-1.0
-0.5
0.0
0.5
1.0
1.5
2.0
Rat
ings
Affect

18
A 2x2x10 ANOVA was conducted on the Trust data, with Type of automated device or category of
human entity, Failure/Non Failure of the automation, and Country of Origin of the participants as the factors.
There was a main effect of Failure, F(1, 388) = 104.878, p < .001, partial-eta squared = .213. There were no other
significant effects. There was a main effect of Type of automated device or category of human entity, F(9, 388)
= 48.459, p < .001, partial-eta squared = .111; however, this effect was qualified by three significant interactions.
The first was between items and country, F(9, 388) = 12.621, p < .001, partial-eta squared = .032. The second
was between items and failure, F(9, 388) = 28.571, p < .001, partial- eta squared = .069. The final interaction was
a three way interaction between items, country and failure, F(9, 388) = 6.660, p < .001, partial-eta squared = .017.
Participants showed a significant decline in trust in both human entities and automated aids, suggesting the
presence of SWT effect and a contagion effect. The trust data for the Indian and American participants are
shown below in Figure 2 and Figure 3 respectively.
Figure 2. Trust Data for Indian participants for Failure and Non-Failure Conditions.
Figure 3. Trust Data for American participants for Failure and Non-Failure Conditions.

19
Stage 2
A 2x2x2 ANOVA was conducted on the Trust data, with Type of automated device or category of
human entity, Failure/Non Failure of the automation, and Country of Origin of the participants as the factors.
There was a main effect of Failure, F(1, 388) = 84.333, p < .001, partial-eta squared = .179. There were no other
significant effects. There was a main effect of Type of automated device or category of human entity, F(1, 388)
= 15.231, p < .001, partial-eta squared = .038; however, this effect was qualified by two significant interactions.
The first was between items and failure, F(1, 388) = 12.326, p < .001, partial- eta squared = .031. The second
interaction was a three way interaction between items, country and failure, F(1, 388) = 4.432, p < .001, partial-
eta squared = .011. This analysis suggested that the drop in trust was still significant indicating the presence of
the SWT effect and contagion effect with the effect of the oxygen masks removed from the analysis. Figure 4
shows the trust averages for both the Indian and American participants on the four automated aids and the five
human entities.
Figure 4. Trust data on the four automated aids and the five human entities
Stage 3
The first mediation analysis was conducted using Indian participants to compare the failure condition
to the non-failure condition with respect to their feelings towards the automated aids. The paths for this
mediation analyses can be found in Figure 5A. In order to conduct the mediation analysis, the correlation
between Condition and Trust was first found to be significant, r = -.349, p < .001, showing that the initial
variable correlated with the outcome variable. The standardized path coefficients were: condition to affect (β =
-.447, p < .001); affect to trust (β = .383, p < .001); condition to trust controlling for affect (β = -.178; p = .012).
These data show that Affect had a partial mediating effect on the relationship between Condition and Trust.
The second mediation analysis was conducted using Indian participants to compare the failure
condition to the non-failure condition with respect to their feelings towards the human entities. The paths for
this mediation analyses can be found in Figure 5B. In order to conduct the mediation analysis, the correlation

20
between Condition and Trust was first found to be significant, r = -.318, p < .001, showing that the initial
variable correlated with the outcome variable. The standardized path coefficients were: condition to affect (β =
-.447, p < .001); affect to trust (β = .404, p < .001); condition to trust controlling for affect (β = -.138; p = .052).
These data show that Affect completely mediated the relationship between Condition and Trust.
The third mediation analysis was conducted using American participants to compare the failure
condition to the non-failure condition with respect to their feelings towards the automated aids. The paths for
this mediation analyses can be found in Figure 5C. In order to conduct the mediation analysis, the correlation
between Condition and Trust was first found to be significant, r = -.524, p < .001, showing that the initial
variable correlated with the outcome variable. The standardized path coefficients were: condition to affect (β =
-.766, p < .001); affect to trust (β = .515, p < .001); condition to trust controlling for affect (β = -.130; p = .142).
These data show that Affect completely mediated the relationship between Condition and Trust.
The fourth mediation analysis was conducted using American participants to compare the failure
condition to the non-failure condition with respect to their feelings towards the human entities. The paths for
this mediation analyses can be found in Figure 5D. In order to conduct the mediation analysis, the correlation
between Condition and Trust was first found to be significant, r = -.441, p < .001, showing that the initial
variable correlated with the outcome variable. The standardized path coefficients were: condition to affect (β =
-.766, p < .001); affect to trust (β = .647, p < .001); condition to trust controlling for affect (β = .054; p = .544).
These data show that Affect completely mediated the relationship between Condition and Trust.
Figure 5. Paths for the mediation analyses

21
Figure 5 [continued]. Paths for the mediation analyses
Discussion
The aim of this study was to further research SWT theory and explores the possibilities of one possible
contagion effect. Additionally, this research sought to analyze the cultural differences between two different
countries of origins, to see whether they had an impact on the SWT effect. The findings of the study support
the research predictions for the most part.
The first hypothesis predicted that participants would have reduced levels of trust in the automated
aids and human entities when the oxygen masks were said to have failed. The findings of the data analysis
supported this hypothesis, and therefore suggest the presence of the contagion effect. This was found to be
true for in both stages of the data analysis. Stage 2 attempted to remove the effect of the failed aid, the oxygen
mask, and determine whether the SWT contagion effect was still statistically significant. Once an automated aid
failed, the participants’ trust in other unrelated aids and unrelated human entities decreased as well, supporting
the theory of the presence of a contagion effect. One possible explanation for the same is that consumers
consider all parts of a commercial airline operation, i.e. automated aids and human entities, as one large system.
Failure in one part of the system negatively affects trust levels in several other parts of the system. The results
of the study showed a decrease in trust in the airline CEO. This relationship is interesting to note. Tsui, Zhang,
Wang, Xin, and Wu (2006) suggest that there is a direct relationship between the values, leadership and
behavior of a CEO and the organizational culture. This could suggest that passengers believe the CEO to be
ultimately responsible for the safety culture of the airline, and is therefore indirectly responsible for all potential
dangerous occurrences.
The second research prediction stated that there would be differences in trust ratings based on country
of origin. The data was collected from participants in India and the United States in order to perform the cross-

22
cultural analysis. As mentioned earlier, prior research has suggested that these two countries represent two
different cultures and mindsets. India is a said to be a more collectivistic society with the focus being placed on
the well-being of others and the community as a whole. On the other hand, the United States is said to be a
more individualistic society, which emphasizes placing concern for one above all else. The results of the study
supported the research prediction, where significant differences were identified between the trust ratings of
participants from each country. The data suggested that American participants were more extreme in their
responses as compared to their Indian counterparts. The American participants were more trusting in control
condition and less trusting in the failure condition as compared to the Indian counterparts. One plausible
explanation for the same could be the differences in cultural upbringing and the differences in mindsets of
participants from these different cultures. Since citizens of collectivistic cultures are taught to trust without
question, their viewpoints may be different from those brought up in individualistic societies.
The third hypothesis stated that affect would mediate the relationship between the condition and trust.
As stated earlier, affect refers to the participants’ emotion which may be an influencer in the decision making
process. The mediation analysis suggested that affect did mediate the relationship, thereby suggesting that the
participants were basing their decisions of trust on their emotions. While emotions are not necessarily a
negative aspect of decision-making, they do provide a fair amount of variance and unpredictability. The results
of the mediation analysis additionally showed that affect mediated the relationship for both Indian and
American participants. This suggests that even though differences in trust ratings was observed between the
participants of these two countries, they were both basing their decisions on emotions. The findings of this
study align with the results of previous research on the fact that affect was found to mediate the relationships
between participants’ trust and the scenarios. This adds to the scientific research on the decision-making
mindset of aviation consumers.
Lastly, the study predicted that there would be an interaction between the variables. The results
supported this hypothesis as the main effect was qualified by three significant interactions. These interactions
were between items and country, items and failure, and a three-way interaction between items, country and
failure.
Limitations and Practical Implications
All research studies, including this one, are subject to some limitations. The limitations for this study
have been identified and must be kept in mind when analyzing the results and interpreting the findings of the
same. The most salient limitation of this study is data collection technique and methodology used. Participants
for the study were recruited via Amazon’s ® Mechanical Turk ® (MTurk). The issue with such a data collection
tool is that the researcher is not in complete control and unable to supervise the testing environment. The
convenience and ability of collecting large samples makes it necessary accept this limitation as part of the study.
Buhrmester, Kwang and Gosling (2011) and Germine, et al. (2012) stated that data collected from MTurk is as
reliable as laboratory data.
While the data collection method does allow for a fairly large convenient sample, the generalizability of
the results is limited. Due to the fact that participants were used from only two countries, the study is able to
perform a cross-cultural analysis, however the findings cannot be generalized to apply to aviation in all the
countries across the globe. Similarly, the study does not discriminate against persons that have never flown on a
commercial airline flight before. This is a limitation when attempting to interpret these findings as those of
aviation consumers. A participant may not in fact be an aviation consumer, but may be allowed to participate in

23
the study. When attempting to conduct such a complex study design, a large sample size is required and in
order to achieve that, certain limitation must be accepted.
While there are certain limitations to the study, the research does have partial implications on the
aviation industry. Research in any field provides a better understanding of the industry. System Wide Trust has
been research in previous studies but this research suggests the presence of the contagion effect of decreased
trust, due to failed automation, in human entities. This is useful information to be aware of in any commercial
aviation setting. Aviation is an essential mode of travel, but airlines are always in heavy competition, and
therefore customer service and satisfaction is a big priority for all air service operators to ensure loyal
customers and sustain revenue flow. This study shows that due to a negative experience, passengers may
experience a system wide contagion effect that could decrease their trust in the CEO, which in turn could
decrease their trust in that particular airline as a whole. This may motivate a passenger to choose to fly on a
different airline on following journeys. In this manner it is entirely possible that the contagion effect could have
significant financial implications for an airline, and therefore this research is of value and importance to the
industry by providing a better understanding of the mindset of the passengers.
Another possible practical implication of this research is that if a SWT contagion effect was found in
aviation, it could suggest that it is also present in other industries. This could lead to important research leading
to a more in depth understanding of several other fields as well. Lastly, since this study is a continuation of the
line of research involving SWT, this study reinforces the foundation of the theory, which is of importance to
the scientific community.
Future Research
There are several research opportunities that still remain in this new line of research involving SWT.
Previous studies in this field have mainly been centered on the aviation industry. While this is useful to the
understanding of passenger mindsets, there may be several other applications for this theory in other fields and
industries. Future research could use this study as a foundation upon which to analyze the mindset of
customers in other consumer-oriented fields, and could additionally research whether the contagion effect does
exist as well.
The main goal of future studies should be to focus on the aforementioned limitations of the current
research. Future research should seek to replicate the study using participants from different countries, in order
to gain a more globally representative analysis of the effect. It would be interesting to study how the SWT
effect varies as a function of country of origin.
Conclusion
The aim of the study was to explore the System Wide Trust theory deeper in order to determine the
presence of a possible contagion effect. The results of the data analysis suggested that passengers’ trust in
several different human entities and automated aids were negatively affected by the presence of one failed
automated aid. The practical implications are of importance to the aviation industry in an effort to better
understand the mindset of the travelling public. However, the secondary layer of the study showed the
differences in trust ratings of passengers from different cultures, i.e. two different countries of origin. The
cross-cultural analysis provides global perspective of the difference existent within the aviation industry. This
study provides a platform for future research to further examine these psychological impacts of trust within
aviation and other industries as well. SWT has been researched in several different studies, mainly with respect

24
to the aviation industry, but with the expansion of the theory in terms of a possible contagion effect, future
research may begin to apply the theory in several other industries.
References
Adapa, S. (2008). Adoption of internet shopping: Cultural considerations in India and Australia, Journal of
Internet Banking and Commerce, 13(2), 1-17.
Alpert, M., & Rosen, A. (1990). A semantic analysis of the various ways that the terms “affect,”“emotion,” and
“mood” are used. Journal of communication disorders, 23(4), 237-246.
Babin, B. J., & Attaway, J. S. (2000). Atmospheric affect as a tool for creating value and gaining share of
customer. Journal of Business research, 49(2), 91-99.
Baker, J., & Cameron, M. (1996). The effects of the service environment on affect and consumer perception of
waiting time: An integrative review and research propositions. Journal of the Academy of Marketing
Science, 24(4), 338-349.
Barber, B. (1983). The logic and limits of trust (Vol. 96). New Brunswick, NJ: Rutgers University Press.
Bechara, A. (2004). The role of emotion in decision-making: evidence from neurological patients with
orbitofrontal damage. Brain and cognition, 55(1), 30-40.
Bochner, S. (1994). Cross-Cultural Differences in the self concept a test of Hofstede's
individualism/collectivism distinction. Journal of cross-cultural psychology, 25(2), 273-283.
Buhrmester, M., Kwang, T., & Gosling, S. D. (2011). Amazon’s Mechanical Turk: A new source of
inexpensive, yet high-quality data? Perspectives on Psychological Science, 6(3), 3-5.
Campbell, M. C. (2007). “Says who?!” How the source of price information and affect influence perceived price
(un) fairness. Journal of Marketing Research,44(2), 261-271.
Craig, C. S., & Douglas, S. P. (2006). Beyond national culture: implications of cultural dynamics for consumer
research, International Marketing Review, 26(3), 322-342.
Deutsch, M. (1958). Trust and suspicion. The Journal of Conflict Resolution, 2, 265-279.
Dzindolet, M. T., Peterson, S. A., Pomranky, R. A., Pierce, L. G., & Beck, H. P. (2003). The role of trust in
automation reliance. International Journal of Human-Computer Studies, 58(6), 697-718.
Eckel, C. C. & Wilson, R. K. (2004). Is trust a risky decision? Journal of Economic Behavior & Organization, 55, 447-
465.
Ergeneli, A., Saglam, G., & Metin, S. (2007). Psychological empowerment and its relationship to trust in
immediate managers. Journal of Business Research, 60, 41-49.

25
Faure, G. O. & Sjostedt, G. (1993). Culture and negotiation: An introduction, Newbury Park: Sage
Publications.
Geels-Blair, K., Rice, S., & Schwark, J. (2013). Using system-wide trust theory to reveal the contagion effects of
automation false alarms and misses on compliance and reliance in a simulated aviation task. The
International Journal of Aviation Psychology, 23(3), 245-266, DOI: 10.1080/10508414.2013.799355
Germine, L., Nakayama, K., Duchaine, B.C., Chabris, C.F., Chatterjee, G., & Wilmer, J.B. (2012) Is the web as
good as the lab? Comparable performance from web and lab in cognitive/perceptual experiments.
Psychonomic Bulletin & Review, 19(5), 847-857.
Göb, R., McCollin, C., & Ramalhoto, M. F. (2007). Ordinal methodology in the analysis of Likert scales.
Quality & Quantity, 41(5), 601-626.
Han, S. & Shavitt, S. (1994). Persusion and Culture: Advertising Appeals in
Individualistic and Collectivistic Societies. Journal of Experimental Social
Psychology, 30, 326-350.
Hofstede, G. (1980). Motivation, leadership and organization: do American theories apply abroad?
Organizational Dynamics, 9( 1 ): 42-63.
Hofstede, G. (2001). Culture 's Consequences: Comparing Values, Behaviors Institutions, and Organizations
across Nations - 2nd Edition, Thousand Oaks: Sage Publications.
Kashima, Y., Callan, V. J., Triandis, H. C., Dunnette, M. D., & Hough, L. M. (Eds.) (1994). Handbook of
industrial and organizational psychology. Palo Alto, CA: Consulting Psychologists Press.
Keller, D. & Rice, S. (2010). System-wide versus component-specific trust using multiple aids. The Journal of
General Psychology, 137(1), 114-128.
Lee, J. D., & See, K. A. (2004). Trust in automation: Designing for appropriate reliance. Human Factors: The
Journal of the Human Factors and Ergonomics Society, 46(1), 50-80.
Lewis, J. D., & Weigert, A. 1985. Trust as a social reality. Social Forces, 63: 967-985.
Markus, H. R. & Shinobu K. (1991). Culture and the self: Implications for cognition, emotion, and motivation.
Psychological Review, 98(2): 224-253.
McAllister, D.J. (1995) Affect- and cognition-based trust as foundations for interpersonal cooperation in
organizations. academy of Management Journal, 38, 24–59.
Meyer, J. (2001). Effects of warning validity and proximity on responses to warnings. Human Factors, 43, 563–
572.
Meyer, J. (2004). Conceptual issues in the study of dynamic hazard warnings. Human Factors, 46(2), 196–204.
Muir, B. M. (1994). Trust in automation: Part I. Theoretical issues in the study of trust and human intervention
in automated systems. Ergonomics, 37(11), 1905-1922.

26
Muir, B. M., & Moray, N. (1996). Trust in automation. Part II. Experimental studies of trust and human
intervention in a process control simulation.Ergonomics, 39(3), 429-460.
Parasuraman, R., & Riley, V. (1997). Humans and automation: Use, misuse, disuse, abuse. Human Factors, 39,
230-253.
Rempel, J. K., Holmes, J. G., & Zanna, M. P. (1985). Trust in close relationships. Journal of Personality and
Social Psychology, 49(1), 95-112. doi:http://dx.doi.org/10.1037/0022- 3514.49.1.95.
Rice, S. (2009). Examining Single- and Multiple-Process Theories of Trust in Automation. Journal Of General
Psychology, 136(3), 303-319.
Rice, S. & Geels, K. (2010). Using system-wide trust theory to make predictions about dependence on four
diagnostic aids. The Journal of General Psychology, 137(4), 362-375.
Rice, S., Kraemer, K., Winter, S. R., Mehta, R., Dunbar, V., Rosser, T. G., & Moore, J. C. (2014). Passengers
from India and the United States Have Differential Opinions about Autonomous Auto-Pilots for
Commercial Flights. International Journal of Aviation, Aeronautics, and Aerospace, 1(1). Retrieved from
http://commons.erau.edu/ijaaa/vol1/iss1/3
Rice, S., Winter, S.R., Kraemer, K., Mehta, R. & Oyman, K. (in press). How do
depression medications taken by pilots affect passengers' willingness to fly? A mediation analysis.
Review of European Studies.
Robbins, S. P. & Judge, T. A. (2009). Organizational behavior (13th Ed.). Upper Saddle River NJ: Prentice Hall.
Rotter, J. B. (1967). A new scale for the measurement of interpersonal trust. Journal of personality, 35(4), 651-665.
Russell, J. A. (1980). A circumplex model of affect. Journal of personality and social psychology, 39(6), 1161.
Russell, J. A. (2003). Core affect and the psychological construction of emotion. Psychological review, 110(1), 145.
Slovic, P. (1993). Perceived Risk, Trust, and Democracy. Risk Analysis, 13: 675–682. doi: 10.1111/j.1539-
6924.1993.tb01329.x
Thien, D. (2005). After or beyond feeling? A consideration of affect and emotion in geography. Area, 37(4),
450-454.
Trubisky, P., Ting-Toomey, S. and Lin, S.L. (1991). The influence of individualism
collectivism and self-monitoring on conflict styles, International Journal of Intercultural Relations, Vol.
15 No. 1, 65-84.
Tsui, A. S., Zhang, Z. X., Wang, H., Xin, K. R., & Wu, J. B. (2006). Unpacking the relationship between CEO
leadership behavior and organizational culture.The Leadership Quarterly, 17(2), 113-137.
Winter, S. R., Rice, S., & Mehta, R. (2014). Aviation Consumers’ Trust in Pilots: A Cognitive or Emotional
Function. International Journal of Aviation, Aeronautics, and Aerospace, 1(1). Retrieved from
http://commons.erau.edu/ijaaa/vol1/iss1/2

27
Wiegmann, D. A., Rich, A., & Zhang, H. (2001). Automated diagnostic aids: The effects of aid reliability on
users' trust and reliance. Theoretical Issues in Ergonomics Science, 2(4), 352-367.

28
Appendices
Appendix A - Questions measuring trust
Failure Condition

29

30
Control Condition

31

32
Appendix B – Questions measuring affect
Failure Condition

33
Control Condition

34
Appendix C – Variables
Stage 1 - Independent Variables Levels
The levels of the first IV were the failure condition and the control condition. The levels of the second
were the participants’ countries of origin, India and the United States. The ten levels of the last IV included the
five different automated aids and the five different human entities that the participant will rate. The automated
aids were the oxygen masks, the auto-pilot system, the airplane’s flaps, the landing gear, and the video screens
on the backs of the seats. The human entities were the pilot, the co-pilot, the flight attendants, mechanics, and
airline CEO. As mentioned previously, in the failure condition scenario, the oxygen mask is the automated aid
that experiences the failure.

35
Assessing Academic Integrity Using SafeAssign
Plagiarism Detection Software
David C. Ison, Ph.D.
Kimberly J. Szathmary, Ph.D.
Embry-Riddle Aeronautical University – Worldwide
Abstract
Higher education has struggled with the problem of plagiarism since institutions were first founded. In the current
educational environment where technology and access are integral to institutional functionality and student
learning, the concern about plagiarism has been elevated with claims that the availability of sources, commonly
sought from the Internet, has made the incidence plagiarism worse. In light of this sentiment and research
literature that indicates a systemic problem, it is critical that institutions are aware of their current academic
integrity environment. Such information is necessary to address problems, if they exist, and to best manage
integrity issues as well as how to assist students in avoiding these quandaries. This study sought to provide
baseline data for a large, online, aviation oriented postsecondary institution. A sample of 659 student records
were collected in this study of which 520 (78.9%) included a SafeAssign index. The uncorrected SafeAssign index
mean was 22.2% (Md = 17%, s2 = 390.9, s = 19.8). Among the uncorrected SafeAssign submissions, 216 (41.5%)
had initial report values in excess of 15% similarity and 57 (11.0%) had originality indices in excess of 40%. When
making corrections for potential false positive results, the mean corrected SafeAssign index was 20.9% (Md =
17%, s2 = 220.4, s = 14.8) with 206 (39.6%) of papers equaling or exceeding the 15% threshold and 19 (3.7%) of
corrected cases had originality indices in excess of 40%. Additional statistical analysis was conducted to evaluate
the relationship between SafeAssign values and final grades. Also, comparisons were made with previous studies.
The findings indicate that the institution needs to evaluate its plagiarism policies and student education on the
topic. It also highlights the importance of such studies at other institutions to determine benchmarks. Suggestions
for future research are provided.
While the problem of plagiarism has existed since the beginning of the sharing of ideas in text and art, it
is purported in exigent research that the incidence of plagiarism is widespread and has been rapidly growing in
conjunction with the increasing prevalence of the Internet (Bretag, 2013; Evering & Moorman, 2012; Jones,
2011). Of particular concern is that the online research environment makes plagiarism extremely tempting and
easy to conduct from the simple cutting and pasting of materials to the ability of students to purchase entire
papers for submission from so-called term paper mills (Embleton & Helfer, 2007). Plagiarism occurs at all levels
of education from K-12 through the doctorate. Several studies have highlighted the incidence of plagiarism at
the culminating stages of graduate degrees within theses and dissertations (Grose, 2006; Ison, 2012, 2014, 2015;
Jones, 2011). These findings have also surfaced within the media with high profile individuals having their
doctorates revoked as well as cases where numerous students have had their degrees rescinded due to plagiarized
theses and dissertations (Ison, 2015). Yet aside from these limited high profile cases, the majority of evidence
concerning student plagiarism is a result of self-report surveys of anecdotal evidence rather than empirical data.
Thus the knowledge about actual prevalence of plagiarism in higher education, as well as in general, is rather

36
limited (Ison, 2015; Walker, 2010). As aviation programs have progressed towards a more competency based
approach to assessment, especially in terms of how they are evaluated for program-specific accreditation, writing
assignments become ever more prevalent and critical to curricula. Moreover, as aviation higher education has
migrated to a more research focus, the issue of academic integrity is central to perceptions of veracity and quality
(Southeast Oklahoma State University, 2008).
More concerning is that many institutions have little, if any, awareness of the current levels of the
occurrence of plagiarism and related misconduct on campus (Novotney, 2011). Some faculty and students may
not even understand their responsibilities in terms of academic integrity (Mahmud & Bretag, 2013). As noted by
Bretag (2013), Brimble, and Stevenson-Clarke (2005), as well as Cole and Swartz (2013), it is paramount that
colleges and universities grasp the level of misconduct residing within such institutions, particularly in light of
the concerns about the negative influence of the Internet coupled with the rapid growth of online education.
Therefore, it has been advocated that higher education stakeholders determine baseline data concerning the
current state of academic integrity within their institutions. In particular, milestone documents are of particular
concern (e.g., theses, dissertations, and similar rigorous works) as they are critical components of a course of
study (Bretag, 2013; Chertok, Barnes, & Gilleland, 2014; Cole & Swartz, 2013; Ison, 2012, 2015; Novotney, 2011).
This study sought to establish the existing levels and severity of plagiarism, and faculty handling thereof, in
capstone courses at a large, online aviation related institution.
Purpose
The purpose of this study was to ascertain the current incidence and severity of plagiarism within
graduate capstone courses at a large, online aviation related institution as determined by SafeAssign originality
reports. The resultant data will provide administration, faculty, and other stakeholders with empirical evidence
of the academic integrity environment at the study institution to determine the adequacy and effectiveness of
current policies and procedures in addition to being able to monitor trends in integrity over time. This study will
also provide the methodological basis for future studies on integrity in other parts and levels of study at the study
institution and others.
Literature Review
Defining Plagiarism
The American Psychological Association (2010) defines plagiarism as instances where authors “present
the work of another as if it were their own work” (p. 16). A plethora of literature addresses the prevalence of
various types of academic misconduct amongst students (McCabe, 2009; Scanlon, 2003; Walker, 2010). College
students are generally exposed to definitions of plagiarism and the penalties that will be imposed should they be
found guilty of committing plagiarism (Tabor, 2013). Course catalogs, syllabi, and course websites define
plagiarism and often link to various mediums where the topic is further explained. Certainly, by the time they
reach their final capstone course, students have been thoroughly exposed to the issue, and accurate citations and
references have been practiced in a host of course term papers and other assignments.
Plagiarism is sometimes labeled as either intentional or unintentional plagiarism. When committing
intentional plagiarism, the author intentionally attempts to mislead the reader. Such an offense might be
accomplished by purchasing a paper from a paper-writing website, using creative methods to avoid detection by
plagiarism detection software, or by portraying material as paraphrased and citing the source incorrectly.
Alternatively, unintentional plagiarism most often occurs when students are not instructed in proper paraphrasing
37
and citation (Gilmore, Strickland, Timmerman, Maher, & Feldon, 2010). It is often difficult to determine whether
plagiarism is intentional or unintentional without questioning the student (Gilmore et al., 2010).
A subset of plagiarism is self-plagiarism, in which authors recycle portions of their own previous work.
In academic circles, reuse of one’s previously submitted or published work is generally regarded as acceptable if
cited appropriately, though in limited amounts (Bretag & Mahmud, 2009). The lack of clear guidelines leaves
academics to rely largely on the concept of fair use, which is itself a gray area. In any case, appropriate attribution
is required.
Previous Studies on Plagiarism in Higher Education
While subjects of academic integrity, including plagiarism, have been an assumed warrant constant
attention within higher education since its advent, it has more frequently come into the spotlight in research
literature due to the concern that the Internet and online education have had a negative influence on the moral
environments at colleges and universities across the globe (Brimble & Stevenson-Clarke, 2005; Ison, 2012;
McCabe, 2009; Walker, 2010). Concurrently, there has been increasing interest by researchers and related
stakeholders to go beyond simply collecting student opinions about academic integrity and plagiarism instead
quantifying the actual incidence of such misconduct in various educational environments. This approach provides
a clearer, empirically-based depiction for faculty and administrators as to what is actually occurring within their
institutions. Such feedback is necessary to understand if, and to what extent, there may be an integrity problem
that may need to be addressed (Cabral-Cardoso, 2004; Walker, 2010). Thus this review focuses primarily on
quantitative studies utilizing direct observations of plagiarism pervasiveness.
Examining two major assignments in sophomore year courses at a postsecondary institution in New
Zealand, Walker (2010) found 25% of what was submitted (n = 569) exhibited indications of plagiarism. A study
of roughly 1,000 students’ work which was submitted without knowledge that it would be computer analyzed for
originality had 16.5% textual overlaps with source material. Within the same study, an equivalently sized sample
of students who knew their work would be scrutinized by plagiarism detection software had a mean overlap of
10% (Heckler, Rice, & Bryan, 2013). Martin et al. (2009) utilized originality checking software to analyze
submissions within postsecondary business courses and found that 61% of the sample (n = 158) showed evidence
of plagiarism with these works having a mean similarity of 11%. A subsequent and much larger study (n = 40,000)
using detection software across a broader range of institutions and subject areas found that over 30% of
submissions had evidence of plagiarism (Martin et al., 2011). Exploring graduate level work, Chao, Wilhelm, and
Neureuther (2009) examined 116 papers written by master’s in business administration students. Among those
works, 39% were identified as to contain suspected plagiarized material. In another study of master’s student
work, Homberg and McCullough (2015) (n = 68) discovered that 67.8% of theses had highly suspicious levels of
textual overlap with source material. A study by Ison (2015) discovered that among 184 dissertations written in
recent years (since 2010), 52% had suspicious levels of commonality with source material.
Not only is it clear that students are actively engaging in plagiarism at disquieting rates, the nature of
such occurrences are also concerning. In a study of work by 700 students, Scanlon and Neumann (2002) found
that 25% included materials that was literally “cut and pasted” from the sources. Walker (2010) also found that
among papers in their sample, 14% had verbatim phrases and sentences directly drawn from source material
although students made an attempt, albeit inaccurate, to cite such material while another 11% had the exact text
as found in source material but without any citation. Gilmore et al. (2010) discovered “instances of cutting and
pasting large chunks of text without quotation or citation” (p. 18).

38
Another notable commonality within recent related literature is the concern that the online environment
is fostering academic dishonesty. This is of particular concern as online education has become more ubiquitous.
Kennedy, Nowak, Raghuraman, Thomas, and Davis (2000) stated that students felt as though it was simpler to
cheat in the virtual environment and, as such, as online education grows, the authors posited that the occurrence
of academic misconduct such as plagiarism will also escalate. Lanier (2006) discovered “that cheating was much
more prevalent in online classes compared to traditional lecture courses” (p. 244). Moreover, the Internet has
been reported as an easy pathway for students to copy work as research has transformed, in many cases, into an
exercise of cutting and pasting of source material (Auer & Krupar, 2001). Postle (2009) found that there has been
a clear increase in plagiarism with significant inappropriate use of text increasingly borrowed from online sources.
Reinforcing this premise, Townley and Parsell (2004) stated that the Internet allows students to more efficiently
misappropriate materials from both other students and the literature. In a 2005 study, McCabe found that 60%
of the 80,000 graduate and undergraduate papers analyzed from 83 institutions included cut-and-pasted material
from the Internet. Similarly, Selwyn (2008) discovered that approximately 60% of students reported inserting
verbatim text from online sources into their work.
As students progress to higher levels of education, such indiscretions have even greater implications.
Master’s and doctoral degrees hang greater weight on significant written works (e.g., theses and dissertations). If
these efforts are marred with plagiarized material, they call into question the merit of the awarded degree. As
cases of plagiarism become rampant, such can have negative consequences on academic reputation and
accreditation Other recent studies have highlighted actual cases which have resulted in academic scandals that
eventually led to significant negative media attention. Further, in some of these instances, institutions revoked
the graduate degrees of the transgressors (Powers, 2008; Riog, 2010).
One particular problem revealed within the literature is that institutions often do not have a real sense
of the prevalence of plagiarism within their classes (Brimble & Stevenson-Clarke, 2005; Ison, 2012; 2015;
Novotney, 2011; Powers, 2008; Roig, 2010). While many colleges and universities have dedicated personnel or
entities charged with monitoring and supervising academic integrity, some do not (Brimble & Stevenson-Clarke,
2005; Embry-Riddle Aeronautical University, 2015; Grand Canyon University, 2015; Ison, 2015). The study
institution appears to fit what the International Center for Academic Integrity (2012) classifies as “Stage One:
Primitive” in terms of its awareness and handling of plagiarism: “this stage describes a school with no policy or
procedures (or minimalist ones) and where there is great variation in faculty and administrative handling of
cheating” (para. 1). While the institution has academic integrity statements and procedures, there is no one central
database or tracking thereof, no office of academic integrity, nor a central figure overseeing the process across
the campus. These realities reinforce the need to appraise the current academic integrity environment at the study
institution.
Method
Sample characteristics
Research participants were graduate-level students seeking a master’s degree at a large, online aviation
related institution. All students were enrolled in the institution’s capstone course, which has, as its prerequisite,
the completion of at least three graduate-level courses prior to enrollment. Admission to the master’s degree
programs require students to have achieved at least a bachelor’s degree.

39
Sampling
All 2014 capstone students whose SafeAssign scores and final grade point values were available were
included in the sample. Students were excluded if either the SafeAssign score was not present, or the final grade
point value awarded was not available in the grading management system.
Sample size
Among 659 initial student data captures, only 456 students’ records that included both the SafeAssign
score and the final grade point value were utilized. This far exceeded the necessary sample sizes for the statistical
testing utilized in this study at the .80 level per G*Power sample size and power software calculations.
Measures
A total of 38 individual course sections were evaluated to determine if the capstone papers associated
with students enrolled in those sections met the criteria. Some instructors managed the capstone submission and
evaluation process independent of the learning management system, and either SafeAssign scores or final grade
point values were not available to the researchers in the course grade center. The researchers retrieved records
by downloading the data from the final course grade centers into MS Excel spreadsheets, and by individually
retrieving and adding SafeAssign scores to those spreadsheets for each student record, where available.
Research Design
This descriptive study sought to define the pervasiveness of plagiarism in the graduate capstone
submissions at a large, online aviation related institution. All 2014 graduate capstone courses were mined for
SafeAssign indices and final grade point values. Data was recorded for each student whose data included both a
SafeAssign index and a final grade point value. Where individual student SafeAssign indices exceeded 15%,
reports were examined by the researchers to determine erroneous indications, and indices were corrected
manually. This 15% threshold is outlined by SafeAssign as the cutoff for suspect plagiarism while those above
40% have high evidence (Blackboard, 2016). Corrected errors included quoted materials that were counted
towards the total percentage, typical academic writing and statements (e.g. related to hypothesis testing or the
statement of hypotheses), and copyright or document identification language. Although SafeAssign generally can
successfully identify quoted material, there are, on occasion, some legitimate overlaps which are flagged by the
software. This type of quality checking has been advocated by similar studies by Batane (2010) and Bretag (2013).
Where no error was indicated, the indices were not adjusted.
Results
Missing Data
Because of the lack of reporting by faculty teaching and students enrolled in the capstone courses, there
were some missing values in some cases among grades and SafeAssign indices. So as not to corrupt statistical
calculations, these cases were omitted from calculations individually (descriptive statistics) or pair-wise
(correlation analysis).

40
Descriptive Statistics
Among the 659 student records collected in this study, 486 (73.7%) included a point value (grade) for
the capstone submission and 520 (78.9%) included a SafeAssign index. Only 456 (69.2%) records included both
a grade value and a SafeAssign index. The mean grade for the sampled capstones was 91.3% (Md = 92%, s2 =
2323.5, s = 48.2). See figure 1 for the histogram of reported grades. The uncorrected SafeAssign index mean was
22.2% (Md = 17%, s2 = 390.9, s = 19.8). See figure 2 for the histogram of the uncorrected SafeAssign indices.
Among the uncorrected SafeAssign submissions, 216 (41.5%) had initial report values in excess of 15% similarity
and 57 (11.0%) had originality indices in excess of 40% (value at which SafeAssign deems to have a high likelihood
of significant plagiarism).
Cases with index values in excess of 15% were manually examined to remove any erroneous indication
of overlap (false positives). In some cases, no correction was warranted. The mean correction applied to the
SafeAssign indices was 6.6%. The resultant mean corrected SafeAssign index was 20.9% (Md = 17%, s2 = 220.4,
s = 14.8) with 206 (39.6%) of papers equaling or exceeding the 15% threshold and 19 (3.7%) of corrected cases
had originality indices in excess of 40%. See figure 3 for the histogram of corrected SafeAssign indices.
Figure 1. Frequency of grade values of sampled capstones

41
Figure 2. Frequencies of uncorrected SafeAssign index values among sampled capstones
Figure 3. Frequencies of corrected SafeAssign index values among sampled capstones

42
Correlation Analysis
Because the grade and SafeAssign index data were not normally distributed, relationships between data
sets were evaluated with the non-parametric correlation Kendall’s tau-b (rτb). The selection of this test was guided
by literature by Howell (2013) in which the case was made that Kendall’s tau-b is generally superior to Spearman’s
rho and takes into account cases of pairwise ties. Correlations could only be calculated among available pairs of
data.
Results of the analysis indicated a negligible negative correlation, albeit non-significant, relationship
between grade and the uncorrected index values, rτb = -0.041, p = 0.198, d = 0.129.1 Similarly, there was effectively
no relationship, yet again negative and non-significant, between grade and corrected index values, rτb = -0.012, p
= 0.785, d = 0.038. As noted by Lewis-Beck, Bryman, and Liao (2004), findings such as these when sample sizes
are large, as is true in this case, indicate that no noteworthy correlation exists.
Comparisons with Previous Studies
Although not a central premise of the current study, comparisons of findings with other related studies
places the aforementioned data in perspective of the exigent literature. Table 1 compares the current findings
with those in recent studies. Specifically, the percentage of papers in each study that were suspected to contain
plagiarism are provided. Table 2 provides the mean similarity indices of the current study in comparison to those
in other studies.
Table 1.
Comparison of results: Percentage of papers with suspected plagiarism.
Study Documents with plagiarism (%)
Ward (2002) 25
Walker (2010) 25
Martin et al. (2011) 30
Gilmore et al. (2010) 38
Chao et al. (2009) 39
Current Study 39.6 (corrected); 41.5 (uncorrected)
Ison (2012) 60
Martin et al. (2009) 61
Holmberg and McCullough (2015) 67.8
Batane (2010) 100
When comparing the corrected indices of the current study with those given in Ison (2015) and Ison
(2012), a Kruskal-Wallis H test showed that there was a statistically significant difference among the findings of
the studies, χ2(2) = 43.27, p < 0.001, with a mean rank index of 550.78 for the current study, 424.57 for Ison
(2015), and 444.01 for Ison (2012). Post-hoc Mann-Whitney U tests were conducted on pairs which indicated that
there were differences between the indices in the current study and both Ison studies (2015: U = 56524, p <
0.001, r = 0.17; 2012: U = 35890, p < 0.001, r = 0.21), but no differences existed between the Ison studies (2015
& 2012: U = 24406, p = 0.322, r = 0.05).
1 Effect sizes calculated via r = sin (.5πτ) then d = 2r/[(1-r2).5] per Walker (2003).
43
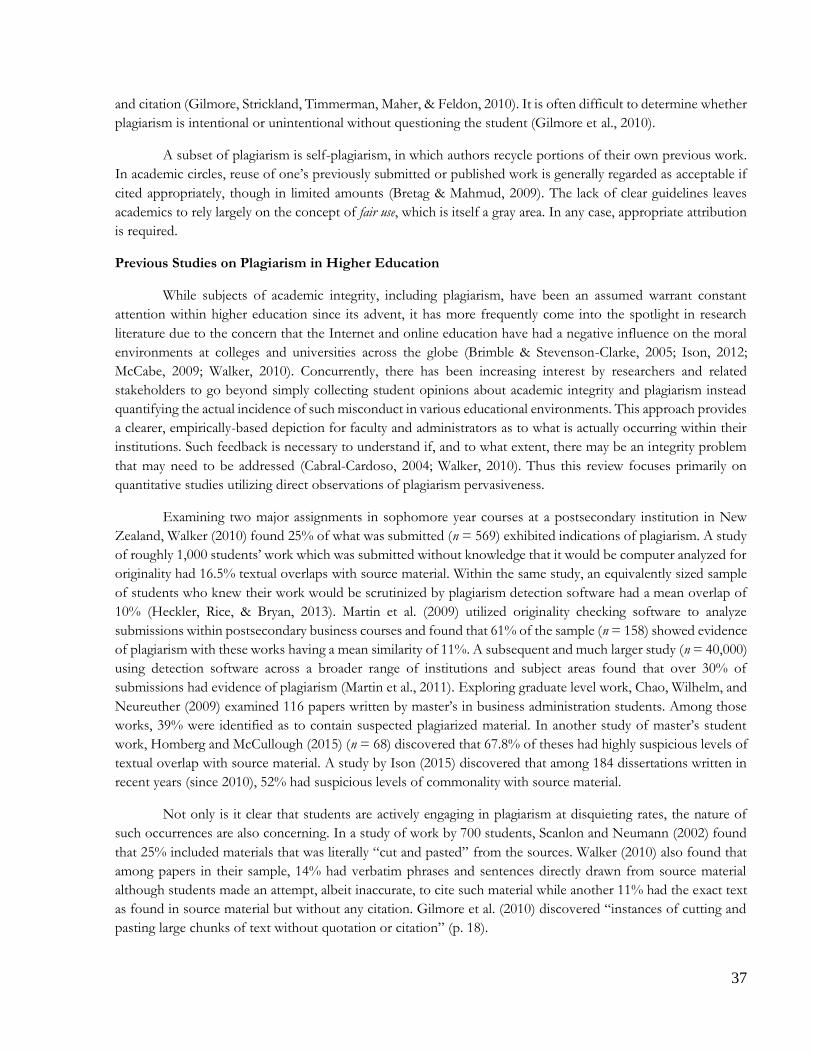
Table 2
Comparison of results: Similarity/Originality indices
Study Similarity/Originality Indices (%)
Martin et al. (2011) 10.6
Ison (2012) 15.1
Ison (2015) 13.4
Batane (2010) 20.5
Current Study 20.9 (corrected); 22.2 (uncorrected)
Additional comparisons were made with studies that specifically focused on master’s capstone/theses
utilizing Chi square tests for independence with Yates’ correction. When comparing counts of corrected
capstones that had suspicious levels of textual overlap (>15%) with theses indicating evidence of plagiarism in
Holmberg and McCullough (2015), a significant relationship was present (χ2 [1, N = 708] = 29.341, p < 0.001).
When comparing study data with that in Martin et al. (2009), a significant relationship was present (χ2 [1, N =
784] = 28.826, p < 0.001). In both of the aforementioned cases, the samples in Holmberg and McCullough (2015)
as well as Martin et al. (2009) had higher levels of suspected plagiarism than that of this study. Yet in a comparison
between the present study data and that of Chao et al. (2009), no significant relationship was present (χ2 [1, N =
732] = 1.105, p = 0.313).
Discussion
The results of this study should cause great concern not only to the study institution, but also to academic
researchers in general. The findings of this study reinforce the sentiment that academic integrity issues are a factor
for a wide range of institutions and subjects of study. With more than 39% of graduate student capstones
containing at least some plagiarized material, standards for research are not being taught and enforced at a level
to ensure ethical behavior. Furthermore, the final grade point values are not positively correlated to the high safe
assign indices, indicating that the capstone instructors do not always monitor the SafeAssign reports and enforce
academic integrity expectations.
Of note in this study, the institution does not enforce a limiting score for SafeAssign indices, and grading
and enforcement are at the instructor’s discretion. Faculty members are expected to investigate scores where the
possibility of plagiarism exists, but specific training is not provided. Assistance in interpreting the information is
available, but not often sought.
It is critical to recognize that some of the studies used for comparison utilized samples of different types
of educational milestones (e.g. papers, theses, and dissertations) at different levels (undergraduate versus
graduate). Therefore, some of the differences in similarity indices may be explainable due to this variation among
sample constructs. What is clear, regardless of sample, is that plagiarism is likely occurring in all facets of
education and warrants the attention of stakeholders. Without similar such studies, institutions are not able to
identify, monitor, or correct these deficiencies.

44
Conclusion
This study further cements the findings of a large body of research that indicates the significance of
plagiarism in postsecondary education. While the percentage of capstone papers with plagiarism in this study is
much lower than percentages in many other studies (Batane, 2010; Holmberg & McCullough, 2015; Ison, 2012;
Martin et al., 2009), the percentage was still much higher than others. Lack of monitoring of SafeAssign indices
and the awarding of passing grades to students whose work contains probable plagiarism could be construed as
legitimizing misconduct, and could encourage new faculty to overlook such behavior, versus correcting and
promoting ethical behavior.
Recommendations
The results of this study should motivate institutional stakeholders to address the problem by increasing
faculty awareness and training in the area of plagiarism. Students should also receive at least minimal training in
research, paraphrasing, citing, and referencing early in the graduate program, and should be monitored and
corrected throughout their journey to the capstone course. While establishing a standard for formatting,
references, and citation is a first step, ensuring faculty have the tools to correct students’ errors in paraphrasing,
citations, and ethics in research is imperative. While this study provides a baseline for the incidence of plagiarism
in capstones, the institution must move forward by establishing expectations for faculty that include actions to
take for submissions with high similarity indices as well as criteria for grading that requires the faculty member
to delve deeper into a capstone submission with a high SafeAssign index in an effort to rule out potential
plagiarism. Faculty members carry some measure of responsibility to the institution to ensure that instances of
plagiarism are addressed. Hopefully, this study will lead to positive change in the institution’s capstone course
product. As the institution moves to forward in technological advances and changes the time to set expectations,
policies, and procedures is now.
References
About SafeAssign. (2010). Blackboard Inc. Retrieved from http://library.blackboard.com /ref/a86c3648-80a5-43cc-8fed-b3f5d24518ce/Content/SafeAssign /About%20SafeAssign.htm
American Psychological Association. (2010). Publication manual of the American Psychological Association, (6th ed.).
Washington, DC: Author. Auer, N. J., & Kupar, E. M. (2001). Mouse click plagiarism: The role of technology in plagiarism and the librarian’s role in combating it. Library Trends, 49(3), 415-432. Batane, T. (2010). Turning to Turnitin to fight plagiarism among university students. Journal of Educational Technology & Society, 13(2), 1-12. Blackboard. (2016). SafeAssign originality report. Retrieved from https://en- us.help.blackboard.com/Learn/9.1_2014_04/Instructor/100_Assignments/025_Use_Safe Assign/010_SafeAssign_Originality_Reports Bretag, T. (2013). Challenges in addressing plagiarism in education. PLoS Med, 10(12), e1001574. doi:10.1371/journal.pmed.1001574

45
Bretag, T., & Mahmud, S. (2009). Self-plagiarism or appropriate textual re-use? Journal of Academic Ethics, 7, 193-205. doi: 10.1007/s10805-009-9092-1
Brimble, M., & Stevenson-Clarke, P. (2005). Perceptions of the prevalence and seriousness of academic
dishonesty in Australian universities. The Australian Educational Researcher, 32(3), 19-44. Cabral-Cardoso, C. (2004). Ethical misconduct in the business school: A case of plagiarism that turned bitter. Journal of Business Ethics, 49, 75-89. Chao, C. A., Wilhelm, W. J., & Neureuther, B. D. (2009). A study of electronic detection and pedagogical approaches for reducing plagiarism. The Journal of Research in Business Education, 51(1), 31. Chertok, I. R., Barnes, E. R., & Gilleland, D. (2014). Academic integrity in the online learning environment for health sciences students. Nurse Education Today, 34(10), 1324-1329. doi:10.1016/j.nedt.2013.06.002 Cole, M. T., & Swartz, L. B. (2013). Understanding academic integrity in the online learning environment: A
survey of graduate and undergraduate business students. In Proceedings of the 20th Annual ASBBS Conference (pp. 738-746).
Embleton, K., & Helfer, D. S. (2007). The plague of plagiarism and academic dishonesty. Searcher, 15(6), 23. Evering, L. C., & Moorman, G. (2012). Rethinking plagiarism in the digital age. Journal of Adolescent & Adult Literacy, 56(1), 35-44. doi:10.1002/JAAL.00100 Gilmore, J., Strickland, D., Timmerman, B., Maher, M., & Feldon, D. (2010). Weeds in the flower garden: An
exploration of plagiarism in graduate students' research proposals and its connection to enculturation, ESL, and contextual factors. International Journal for Educational Integrity, 6(1).
Grand Canyon University. (2015). Academic integrity. Retrieved from http://www.gcu.edu/Academics/Academic-Integrity.php Grose, T. (2006). The burden of plagiarism: The cheating scandal at Ohio University has raised all sorts of
questions. ASEE (American Society for Engineering Education) Prism, 16(3). Retrieved from http://www.prism-magazine.org/nov06/feature_plagiarism.cfm
Heckler, N. C., Rice, M., & Bryan, C. H. (2013). Turnitin systems: A deterrent to plagiarism in college classrooms. Journal of Research on Technology in Education, 45(3), 229-248. Holmberg, M., & McCullough, M. (2006). Plagiarism in science and technology master's theses: A follow-up
study. New Review of Information Networking, 12(1-2), 41-45. doi: 10.1080/13614570601136255 Howell, D. C. (2013). Statistical methods for psychology (8th ed.). Belmont, CA: Wadsworth. International Center for Academic Integrity. (2012). Resources. Retrieved from http://www.academicintegrity.org/icai/resources-4.php Ison, D. C. (2012). Plagiarism among dissertations: Prevalence at online institutions. Journal of Academic Ethics, 10(3), 227-236. doi:10.1007/s10805-012-9165-4

46
Ison, D. C. (2014). Does the online environment promote plagiarism: A comparative study of dissertation from brick-and-mortar versus online institutions. MERLOT Journal of Online Learning and Teaching, 10(2), 272-281. Ison, D. C. (2015). The influence of the Internet on plagiarism among doctoral dissertations: An empirical study. Journal of Academic Ethics, 13(2), 151-166. Jones, D. L. (2011). Academic dishonesty: Are more students cheating? Business Communication Quarterly, 74(2), 141-150. doi:10.1177/1080569911404059 Lewis-Beck, M. S., Bryman, A., & Liao, T. F. (Eds.). (2004). Encyclopedia of social science research methods.
(Vols. 1-3). Thousand Oaks, CA: Sage Publications, Inc. doi: http://dx.doi.org/10.4135/9781412950589
Mahmud, S., & Bretag, T. (2013). Postgraduate research students and academic integrity: “It’s about good
research training.” Journal of Higher Education Policy and Management, 35(4), 432-443. Martin, D. E., Rao, A., & Sloan, L. R. (2009). Plagiarism, integrity, and workplace deviance: A criterion study. Ethics & Behavior, 19(1), 36-50. Martin, D., Rao, A., & Sloan, L. (2011). Ethnicity, acculturation, and plagiarism: A criterion study of unethical academic conduct. Human Organization, 70(1), 88-96. McCabe, D. L. (2005). Cheating among college and university students: A North American perspective. International Journal for Educational Integrity, 1(1). McCabe, D. L. (2009). Academic dishonesty in nursing schools: An empirical investigation. Journal of Nursing Education, 48(11), 614-623. Novotney, A. (2011). Beat the cheat. American Psychological Association Monitor, 42(6), 54. Postle, K. (2009). Detecting and deterring plagiarism in social work students: Implications for learning for practice. Social Work Education, 28(4), 351-362. doi:10.1080/02615470802245926 Powers, E. (2008, February 22). "Distinguished" no longer. Inside Higher Ed. Retrieved from http://www.insidehighered.com/news/2008/02/22/ohio Roig, M. (2010, June). Plagiarism: An ounce of prevention. ASQ Higher Education Brief. Retrieved from http://www.asq.org/edu/2010/06/continuous-improvement/plagiarism-an-ounce-of-prevention-.pdf Scanlon, P. M. (2003). Student online plagiarism: How do we respond? College Teaching, 51(4), 161-165. Scanlon, P. M., & Neumann, D. R. (2002). Internet plagiarism among college students. Journal of College Student Development, 43(3), 374-385. Selwyn, N. (2008). "Not necessarily a bad thing ...": A study of online plagiarism amongst undergraduate students. Assessment & Evaluation in Higher Education, 33(5), 465-479. doi:10.1080/02602930701563104 Southeastern Oklahoma State University. (2008). Outline for a self-study report: Form 204. Retrieved from http://www.se.edu/dept/academic-affairs/files/program-reviews-special- accreditations/docs/SE%20AABI%20Self%20Study%202011.pdf

47
Southern Association of Colleges and Schools. (2014). Policies and publications. Retrieved from http://www.sacscoc.org/policies.asp Tabor, E. L. (2013). Is cheating always intentional? The perception of college students toward the issues of plagiarism
(Doctoral dissertation). Retrieved from ProQuest Dissertations & Theses. (Order No. 3557437) Townley, C., & Parsell, M. (2004). Technology and academic virtue: Student plagiarism through the looking
glass. Ethics and Information Technology, 6(4), 271-277. doi:10.1007/s10676-005-5606-8 Walker, D. C. (2013). Converting Kendall’s Tau for correlational or meta-analytic analyses. Journal of Modern Applied Statistical Methods, 2(2), 525-530. Walker, J. (2010). Measuring plagiarism: Researching what students do, not what they say they do. Studies in Higher Education, 35(1), 41–59. Ward, J. (2002, May 23). University sees rise in reports of cheating. Washington Times, p. B-1.

48
Do NTSB Statistics Support Current FAA Third Class Medical Policy?
Don Morris Southern Illinois University, Carbondale
Abstract
Third Class Medical Reform is currently being considered by the FAA and by Congress. This study analyzes
past incident data gathered by the NTSB from 1982 to the present to determine if a link exists between the
amount of time that has elapsed since a pilot’s medical certification and his or her likelihood of involvement in
an incident or accident caused by medical incapacitation or impairment. A control population of 26,987
incidents was formed from all recorded incidents in which the pilot held a valid third class medical. This
population was used to compare with a smaller population of 172 incidents for which the NTSB has
determined that medical incapacitation or impairment not related to illegal drug or alcohol use was at least a
factor. A Chi-Squared distribution returned a 17% probability that the two populations were identical.
Incidentally, descriptive statistics of the control population show an unexpected negative linkage between
recentness of medical certification and likelihood of being involved in an incident (R2 = .821). This
counterintuitive finding indicates that recent third class medical certification correlates to increased pilot risk,
rather than increased levels of safety.
Background If a pilot is involved in an incident or accident, they are required to notify the National Transportation
Safety Board (NTSB) (49 CFR 830.15). The NTSB investigates the incident and, whenever possible,
determines contributing factors. They record these along with details of the incident in the enhanced Accident
Data Management System (eADMS) database. The database has hundreds of thousands of entries, and is
publicly available. One of the details recorded for each occurrence in the database is the date of the pilot’s last
medical exam.
In order to maintain pilot safety, the Federal Aviation Administration (FAA) requires pilots to see a
designated medical examiner (DME) to certify that they are medically fit to fly (14 CFR 61.23). The DME
checks the pilot’s physical condition, current medications, and medical history. If the DME finds that the pilot
is capable of safely operating an aircraft and is unlikely to develop any conditions that would put them in
danger while operating an aircraft, they are certified as medically fit. Unfortunately, as time elapses, a pilot’s
condition may unexpectedly deteriorate. This is why medical certificates only last a certain period of time
before they must be renewed. Current FAA regulations require medical certificates to be renewed in intervals
from six to 60 calendar months, depending on the class of medical certificate and the age of the pilot at the
time of the exam (Federal Aviation Administration, 2008).
In order to exercise the privileges of an airline transport pilot, a pilot must have a first class medical.
Commercial pilot privileges require a second class medical. Private pilot privileges require a third class medical.
Currently, third class medical reform is before the FAA and Congress (Aircraft Owners and Pilots Association,
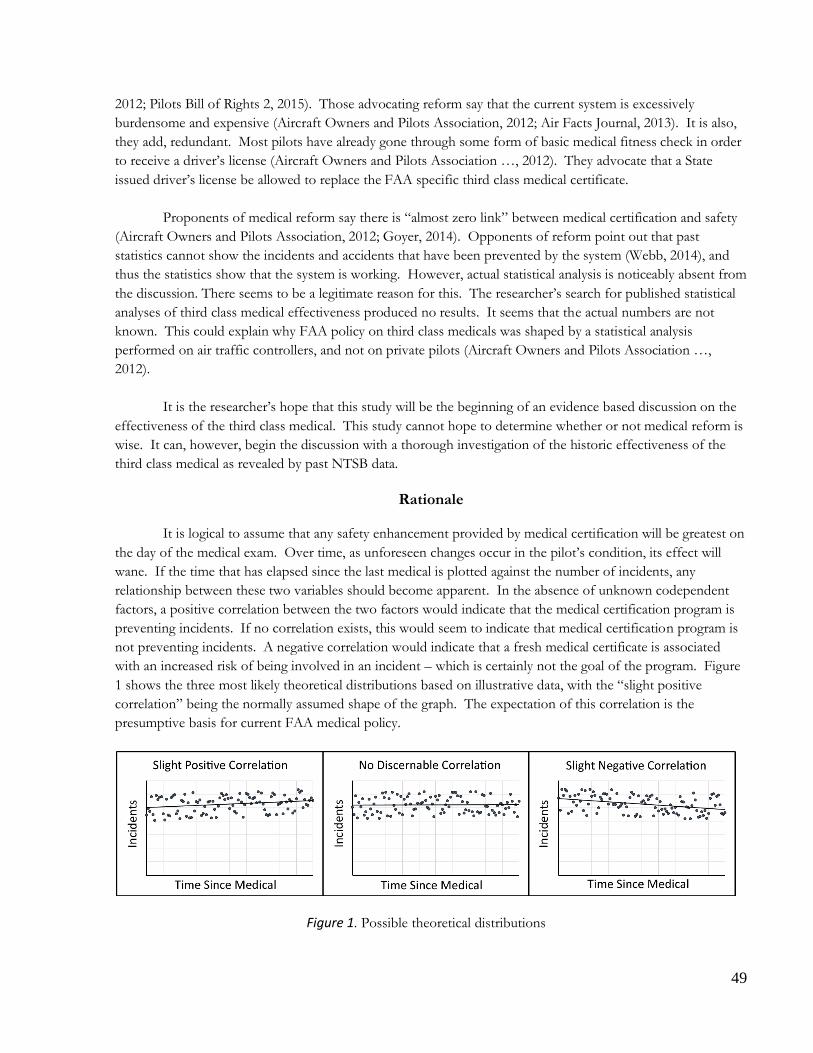
49
2012; Pilots Bill of Rights 2, 2015). Those advocating reform say that the current system is excessively
burdensome and expensive (Aircraft Owners and Pilots Association, 2012; Air Facts Journal, 2013). It is also,
they add, redundant. Most pilots have already gone through some form of basic medical fitness check in order
to receive a driver’s license (Aircraft Owners and Pilots Association …, 2012). They advocate that a State
issued driver’s license be allowed to replace the FAA specific third class medical certificate.
Proponents of medical reform say there is “almost zero link” between medical certification and safety
(Aircraft Owners and Pilots Association, 2012; Goyer, 2014). Opponents of reform point out that past
statistics cannot show the incidents and accidents that have been prevented by the system (Webb, 2014), and
thus the statistics show that the system is working. However, actual statistical analysis is noticeably absent from
the discussion. There seems to be a legitimate reason for this. The researcher’s search for published statistical
analyses of third class medical effectiveness produced no results. It seems that the actual numbers are not
known. This could explain why FAA policy on third class medicals was shaped by a statistical analysis
performed on air traffic controllers, and not on private pilots (Aircraft Owners and Pilots Association …,
2012).
It is the researcher’s hope that this study will be the beginning of an evidence based discussion on the
effectiveness of the third class medical. This study cannot hope to determine whether or not medical reform is
wise. It can, however, begin the discussion with a thorough investigation of the historic effectiveness of the
third class medical as revealed by past NTSB data.
Rationale
It is logical to assume that any safety enhancement provided by medical certification will be greatest on
the day of the medical exam. Over time, as unforeseen changes occur in the pilot’s condition, its effect will
wane. If the time that has elapsed since the last medical is plotted against the number of incidents, any
relationship between these two variables should become apparent. In the absence of unknown codependent
factors, a positive correlation between the two factors would indicate that the medical certification program is
preventing incidents. If no correlation exists, this would seem to indicate that medical certification program is
not preventing incidents. A negative correlation would indicate that a fresh medical certificate is associated
with an increased risk of being involved in an incident – which is certainly not the goal of the program. Figure
1 shows the three most likely theoretical distributions based on illustrative data, with the “slight positive
correlation” being the normally assumed shape of the graph. The expectation of this correlation is the
presumptive basis for current FAA medical policy.
Figure 1. Possible theoretical distributions

50
Data
This study defines two separate populations both taken from the eADMS database covering the time
period from January 1st of 1982 and extending to April 30th of 2015.
1. The first population will be referred to as the control population. It consists of all incidents in which a
pilot had a valid third class medical, a valid date of last medical was recorded, and a valid pilot age was
recorded. This population includes 26,987 distinct incidents.
2. The second population will be referred to as the research population. It consists of all the incidents
out of the control population in which the NTSB determined that impairment or incapacitation (not
relating to alcohol or illegal drug usage) was at least a factor. This population includes 172 distinct
incidents.
The final data required to complete this study is the percentage of elapsed time between the issuance of the
last medical and each incident that has been recorded in the database. Obtaining this data is not simple because
the regulations pertaining to medical duration changed twice during the time period covered by the data
(Federal Aviation Administration, 2008). Between 1982 and 1996, all third class medicals were valid for 24
calendar months. Between 1996 and 2008, third class medical validity for those under the age of 40 was
extended to 36 calendar months. After 2008, third class medical validity for those under 40 years of age was
again extended – this time to 60 calendar months. Conditional statements were used to model these
regulations, and the percentage of time that had elapsed from the medical at the time of the incident was added
to the data. This was done for both populations. Descriptive statistics for each population are shown in table
1.
Table 1. Time is shown as the percentage of time elapsed from the valid medical time period
Analysis
Preliminary analysis was the same for both populations. Probability histograms (0 to 100) were
constructed by rounding the percentage of time elapsed to the nearest percent, and by doubling the number of
occurrences in the 0 and 100 buckets to compensate for the fact that these buckets were only half the width of
the rest. Scatter plots were made for each population, and a regression line was calculated for each. These
plots are shown in figures 2 and 3, along with regression lines and their respective R2 values. For simplicity
sake, only linear regressions were used in this study, although other unknown models might better fit the data.
As can be seen from figure 2, the regression line for the control population has a strongly negative slope. This
in counterintuitive, as it appears to associate recentness of medical exam with increasing risk of accident or
incident, rather than with increasing levels of safety. Figure 3 shows the regression line for the research

51
population. It has a similar negative slope, but both the slope and the coefficient of determination are less
pronounced.
Figure 2. Percentage of medical elapsed vs. occurrences (Control population)
Figure 3. Percentage of medical elapsed vs. occurrences (Research population)

52
The objective of this study is to determine if a link exists between time elapsed and the risk of being
involved in an incident involving incapacitation or impairment. The control population shows a definite link,
but this is the likelihood of being in an “incident,” and not the likelihood of being involved in an “incident
involving impairment or incapacitation.” In order to show the latter, it is necessary that the research
population be statistically distinguishable from the control population.
In accordance with conventional hypothesis testing logic, two alternative hypotheses can be identified.
The research hypothesis is that the research population can be statistically distinguished from the control
population. This is to say that an underlying variable other than random chance is statistically unlikely to have
created the observed differences between them. The null hypothesis is that the research population cannot be
statistically distinguished from the control population. This is to say that the observed differences are within
the level that is likely explained by random factors.
In order to test the null hypothesis, the control population was used to calculate how many
occurrences would be expected to occur in the research population for each histogram bucket, assuming that
the populations were indistinguishable. This was determined by scaling the control population for sample size.
The expected occurrences were then compared to the actual occurrences found in the research population
using a Chi Squared test for goodness of fit. This test shows a probability of 17% (p=0.17) that the differences
between the two populations are due to random factors.
Figure 4. Control population and research population (Data for goodness of fit)
Conclusion
Most studies report a linkage if the probability that the null hypothesis is correct is found to be below
5%. Some studies use a less rigorous standard of 10%. The 17% probability found in this study does not meet
53
either of these criteria. The statistics do not allow rejection of the null hypothesis, and so do not show a
statistically significant linkage between percentage of medical elapsed and likelihood of incident occurrence.
However, in the interest of safety, it is important to point out that the data does indicate an 83% likelihood that
the two populations are statistically distinguishable in some form, however minute it may be.
While these findings are significant, they pale in significance compared to the unexpected negative
correlation between percentage of elapsed medical time and likelihood of incident found in the control
population. Statistically speaking, the more time that has elapsed since the third class medical, the less likely a
pilot is to be involved in an incident or accident. This result is implied the existence of other unknown
codependent variables, as it is not logical to assume that a medical evaluation in itself makes a pilot more
dangerous. Logically, there are many possible explanations. The researcher and his colleagues have identified
the following:
1. A private pilot who is not intending to fly is unlikely to renew his or her medical until that intention
changes. Initial medical certification is certainly tied to an increase in flight activity as training
commences. Recent medical recertification is probably tied to a similar increase in flight activity. Even
if the per-hour likelihood of being involved in an incident is not increased, the increase in actual hours
of flight activity would logically lead to an increased likelihood of incident.
2. Recent medical certification may be tied to complacency about emerging medical conditions that may
lead to incapacitation or impairment.
3. Initial medical certification is tied to a lack of experience as a pilot. Recent medical certification is
often tied to a lack of recent experience as a pilot. Decreased actual experience and decreased recent
experience are both likely to increase the probability of involvement in incidents.
Regardless of the reasons for this statistical correlation, it is very strong. The coefficient of determination
(R2) was 82.1%. This indicates that 82.1% of the observed variation in incident rate can be attributed to the
linear regression model. Stated another way, 82.1% of a private pilot’s historic risk of being involved in an
accident or incident can be determined based solely on how recently he or she was issued his or her last third
class medical. The likelihood that this variance could be attributed to random chance was calculated to be
nearly zero (p<1x10-160), based on a T test against randomly generated data.
As previously noted, proponents of third class medical reform believe that the current medical certification
process is burdensome and expensive. Opponents insist that the process is neither costly nor burdensome
(Eidson, 2014; Webb, 2014). It is difficult to imagine why the amount of elapsed time since the issuance of a
medical certificate is so strongly correlated to the likelihood of a pilot being involved in an accident or incident
if the issuance of a third class medical is trivial to the pilot in question.

54
References
Air Facts Journal (2013). The great debate: Should the 3rd class medical be eliminated? Retrieved from
http://airfactsjournal.com/2013/03/the-great-debate-should-the-3rd-class-medical-be-eliminated/ Aircraft Owners and Pilots Association & Experimental Aviation Association (2012). Petition for exemption ...
FAA-issued medical certificate. Available from from http://www.regulations.gov/ Eidson, M. (2014). Example letter to Congressman or Senator. Retrieved from
http://www.supercub.org/forum/showthread.php?46526-Want-to-Know-What-the-AME-Organization-Is-Saying-about-the-3rd-Class-Exemption
Federal Aviation Administration. (2008). FAR Final Rule. Retrieved from
https://www.leftseat.com/nprm_faa_medical_certificate_duration.htm Goyer, R. (2014). AMA Vote Reveals Dirty Secret of 3rd Class Medical. Flying Magazine. Retrieved from
http://www.flyingmag.com/blogs/going-direct/ama-vote-reveals-dirty-secret-3rd-class-medical
Pilot’s Bill of Rights 2, S.571. 114th Cong. (2015) Retrieved from https://www.congress.gov Spence, C. (2014). Third Class Medical Reform Caught in Government Maze. General Aviation News. Retrieved
from http://generalaviationnews.com/2014/09/17/ third-class-medical-reform-caught-in-government-maze/
Webb, J. (2014). Third Class Medical Letter to FAA Administrator. Retrieved from
http://www.asma.org/asma/media/asma/pdf-policy/2014/Third-Class-Medical-Letter-to-FAA-Administrator-4-9-2014.pdf

55
Airport Capability, Aviation Activity and Economic Activity
at General Aviation Airports
Stephen M. Swartz
Auburn University
Pamela S. Donovan
University of North Texas
Terry L. Clower
George Mason University
Abstract
Previous research has established support for the overall premise that there are relationships between
investments in airport infrastructure and economic activity. The nature of the investment and resulting
increased capabilities seem to act in specific ways that are as yet materially unexplained. In addition, the role of
how increased capabilities support (or make possible) increased activity at the airport, and how increased
activity in general leads to economic outcomes are also ripe for additional clarification. The purpose of this
investigation is to shed light on the relationships between airport capabilities, aviation activity at the airport,
and the economic activity generated for the community served by the airport. In this study we have
demonstrated that strong, significant positive relationships exist between Airport Capabilities (Accessibility and
Infrastructure), Airport Size (Class), Airport Activity, and Economic Activity. Practical, managerial inferences
can also be drawn. First, it is not unreasonable to expect that investment (public or private) in improved airport
capability does indeed stimulate increased economic activity directly, and indirectly by increasing the number
and importance of activities taking place at the airport. It is anticipated that the results of this and related future
research efforts can better inform public policy decisions in general aviation.
Introduction
Public entities at Local, State, and Federal levels collect revenues from taxpayers and invest those revenues
to provide a variety of services and capabilities to serve their constituencies and ensure public welfare. The
development of federally and state funded transportation infrastructure is one such public investment designed
to promote multiple objectives. For example, the primary purpose of the U.S. Department of Transportation
(USDOT) is to ensure a “a fast, safe, efficient, accessible and convenient transportation system” that enhances
quality of life, supports current and future national interests, and enables the nation’s economic growth
(USDOT, 2012). The most recent piece of U.S. legislation, Moving Ahead for Progress in the 21st Century Act
(MAP-21), allocated $105 billion for fiscal years 2013-2014 to ensure the “growth and development of the
country’s vital transportation infrastructure” (USDOT, 2014). Allocating public funding to projects that will

56
achieve these goals falls to a variety of decision-makers depending on the scope and scale of the project. For
example, the Federal Aviation Administration (FAA), State Departments of Transportation, and Local County
and City councils manage and develop the aviation infrastructure across the U.S. and prioritize publicly funded
airport projects.
The FAA manages air transportation infrastructure as part of the National Plan of Integrated Airport
Systems (NPIAS) and uses the Airport Improvement Plan (AIP) program as the primary funding vehicle (FAA,
2012b; 2014b). These investments are intended to increase the capabilities of the airports and facilitate aviation
activities in the National Airspace System (NAS). For example, AIP grants have been used to widen and
lengthen runways to allow for a wider variety of aircraft operations; and to upgrade navigational aids to increase
the range of weather conditions under which safe operations can be conducted. One anticipated outcome from
an increase in airport activities is an increase in economic activity in the community served by the airport (FAA,
2012a).
While aviation’s role in economic development is widely accepted, Freestone and Baker (2011)
acknowledge that airports as economic drivers are under-researched. The airport planning literature,
historically, has focused on safety, land-use compatibility, and environmental impacts in an effort to balance the
economic and social benefits of the airport with the costs and negative perceptions associated with the
accompanying congestion and noise. Airports were first recognized as economic zones in the 1960’s and 70’s,
with the introduction of jet aircraft, contributing to the development of industrial parks at major metropolitan
airports (Kasner, 1997). However, it wasn’t until the late 1990’s that research considered airports as economic
drivers when the contribution of aviation to globalization was realized in the post-deregulation era with the
growth and expansion of airline networks and the development of multi-modal hubs at or near metropolitan
airports (Freestone & Baker, 2011). One stream of research focuses on defining the typology of airport-centric
development, such as on- or near-airport development (Blanton, 2004), airport cities (Peneda, Reis & Macario,
2011), and “Aerotropolis” metropolitan development (Kasarda, 2000) versus the “Airea” sub-regional
development approaches (Schlaack, 2010). This existing body of research is primarily directed at large
commercial airports and urban development, identifying the factors that contribute to or constrain urban
growth.
However, fewer studies have examined the mechanisms of airport-centric economic growth (Freestone &
Baker, 2011), particularly in context of general aviation (GA) airports. This raises the question about whether
the same factors that facilitate airport-centric economic growth in a metropolitan setting translate to the GA
airport. Furthermore, the approval authority for airport investment at GA airports often resides with the City
or County Councils, where airport investment decisions are not well understood (Weisbrod, 1990) and compete
with other community investment interests. Therefore, a better understanding of the types of airport
investment at GA airports that contribute the greatest to economic growth is needed to help decision makers in
allocation of public funds. For example, a decision surrounding the allocation of tax monies for investment in
airport infrastructure, capacity, navigational aids, or in generating business vs. leisure related aviation activities
would be a concern for the leadership of airport governance organizations.

57
The purpose of this investigation addresses this last question, by examining the nature of the relationships
between airport capabilities (in support of aviation activities) and economic activity at general aviation airports.
Three research questions guided this study:
1. What is the nature of the relationships between Airport Capabilities and Aviation Activities at GA
airports?
2. What is the nature of the relationships between Aviation Activities and Economic Activity at GA
airports?
3. What aspects of Airport Capability and Airport Activity are most closely related to Economic Activity
at GA airports?
This paper makes three important contributions to the body of knowledge. First, we provide empirical
evidence for the relationships between Airport Capabilities, Aviation Activity, and Economic Activity. Second,
we provide insight on the relative contributions of Airport Capabilities and Aviation Activity to the Economic
Activity at GA airports. Airport owners and managers can use these insights to establish investment and
operational priorities at their airports. And finally, we provide a foundation to guide future research.
The Nature of Economic Activity at the Airport
The economic role of an airport is complex, varied and difficult to classify—even at small general aviation
facilities (Kanafani & Abbas, 1987). The direct economic impact can be measured in terms of economic activity
(expenditures, sales revenue, and wages) at the airport. Additionally, there is an indirect economic impact that
extends beyond the airport. These indirect effects include the activities of business travelers in the local
economy (hotel, restaurant, and retail spending), business expansion and development (associated jobs and
business income) due to access to transportation at the airport, and user benefits (time and cost savings).
The Federal Aviation Administration (FAA) regularly conducts analyses of costs and benefits of the 3,330
airports included in the NPIAS eligible for public funding (FAA, 2012a). Of the 3,330 airports in the NPIAS,
only 378 are large airports offering regularly scheduled air service and familiar to the travelling public, while the
remainder includes smaller commercial service airports and general aviation facilities (FAA, 2012b). In 2012,
the FAA conducted an assessment of GA airports in the United States in order to assist decision makers in
allocating public investment into more effective projects to improve airport capabilities (FAA, 2012a). One
outcome of the assessment was a new classification system for GA airports based on the scope and number of
aviation activities at the airport, specifically identifying airports as National, Regional, Local or Basic general
aviation airports. The FAA identified 30 discrete activities in 5 major categories, as shown in Table 1. This new
classification system replaced the older classification system (limited commercial service or reliever) and more
accurately captures the diverse manner in which GA airports have evolved to support their local communities
and the NAS. The FAA will use the new GA classification system to assist in the allocation of investment
funds through the AIP among the GA airports in an effort to improve the “public payback” as part of the
NPIAS (FAA, 2012a).

58
Table 1. General Aviation (GA) Airport Activity Classification
Category Examples of Aviation Activities
Emergency Preparedness and Response
Aeromedical Law Enforcement Homeland Security Aerial Fire Fighting Search and Rescue
Critical Community Access Air Taxi Air Charter Essential Scheduled Air Service
Other Aviation Specific Functions
Self Piloted Business Corporate Aviation Flight Instruction Personal Flying Aircraft Storage Aerospace Research
Commercial, Industrial, and Economic Activities
Agricultural Application Aerial Surveying Oil and Mineral Survey Express Delivery Air Cargo
Destination and Special Events Tourism Intermodal Passenger Connections Special Aeronautical (skydiving, airshows, etc.)
In addition to the contribution of GA airports to the general public welfare, studies have also focused on
quantifying the magnitude of the contribution of related aviation activities at GA airports to economic activity
(ACI-NA, 2012; FAA, 2011). For one example, “Business Aviation” (separate from air transportation services
holding out commercial carriage to the general public) became an area of interest relatively recently. Business
aviation is an increasing activity at GA airports. In 2012, 9,600 business aircraft operated in North America
and is expected to grow by 2% annually; up to 13,640 by 2032 (Bombardier, 2013). The FAA estimated that the
national economic impact of civil aviation totaled $1.3 trillion and accounted for 5.2% of U.S. gross domestic
product (GDP) in 2009. Of the $1.3 trillion in total aviation output, general aviation was credited with
contributing $14.4 billion (FAA, 2011).
This study followed standard practice in estimating economic impact by measuring economic activity
based on the value of aviation-related expenditures by private industry (payrolls, taxes paid, operating expenses)
and public agencies (federal, state and local spending on infrastructure, payrolls, services contracts, supplies).
The effects were disaggregated into 7 primary categories: airline operations, airport operations, general aviation,
aircraft manufacturing, air couriers, visitor expenditures, and travel arrangements. The impact analysis also
included an estimate of economic activity as a result of the “enabling effects” of air transportation; e.g., activity
that would not otherwise have occurred but for some air transportation capability represented by aviation
related activities (FAA, 2011).
Typically, economic impact studies assess “direct,” “indirect,” and “induced” or “multiplier” activity as
separable components of overall activity. Direct activity is the flow of dollars as a result of the aviation activity
specifically (e.g., operational spending by the airport or airport tenants). The indirect economic activity includes

59
the flow of dollars that result from activities that are a consequence of secondary and tertiary aviation-related
business activities—these are the second- or higher-order effects that would not have occurred without the
aviation activity (e.g., purchase of parts by aircraft maintenance shops and payrolls of on-site restaurants and
shops at the airport). Induced effects represent economic activity associated with household spending from the
salaries and wages earned through direct and indirect business activities and spending. The FAA study used
data from existing government databases and filings from the Census Bureau, Bureau of Transportation
Statistics, Bureau of Labor Statistics, and State and Federal budget data among other sources. Using a slightly
different approach, the aviation group at consulting, engineering, and research firm CDM Smith performed a
comprehensive, nationwide survey of state economic impact studies in 2012 (ACI-NA, 2012). While the
methods vary slightly among states, most economic impact studies follow the FAA procedure relatively closely,
defining “economic activity” as the sum total of aviation related spending by public and private entities. The
ACI-NA study estimated direct economic activity to be over $460 billion, with secondary or “multiplier
effects” up to $718 billion for a total economic activity related to aviation activity around $1.2 trillion. These
studies included “commercial aviation” which is comprised of both scheduled and unscheduled aviation activity
across a broad variety of specific aviation activities like air transportation, agricultural application, flight
training, aerial surveying, medical evacuation, etc. This study is particularly interested in the role of aviation
activity defined under the subcategory “general aviation” or non-airline type operations conducted at the vast
majority of smaller airports without any scheduled air services.
While the generation of economic activity as a result of infrastructure investment continues to be an area
of interest for investigation, few studies have attempted to explicitly include specific activities being performed
as a significant variable of interest. Researchers have used a variety of “input” measures (operating costs or
investment) and “output” measures (service provided, taxable revenue generated) as the main factors of
interest. Airport characteristics (similar to “capabilities” as used in this research) are frequently classified as a
type of output; e.g. runway length or number and type of operations as the result of investment input. Another
common practice is to use airport characteristics/capabilities as moderating or mediating variables between
inputs and outputs. The use of efficiency or productivity assessments (some ratio of inputs to outputs) is a very
common approach. Many international studies provide examples of this approach (Francis, Humphreys & Fry,
2002; Humphreys & Francis, 2002; ICAO, 2002; Oum, Yu & Fu, 2002). Airport characteristics are included as
moderators or mediators; capacity measures like runway length, nature of navigational aids available, ramp
space, type of services offered, etc. are commonly used. Of course, productivity or efficiency measures are
commonly used in lieu of “profit” type measures due to the involvement of public monies used in the
development and management of many airports.
An early example of research intended to describe relationships between economic activity at airports and
economic development investment was conducted by Cambridge Systematics (Weisbrod, Reed, & Neuwirth,
1993). Their analysis of a sample of 30 airports in Europe, Japan, and North America was part of an effort to
develop a predictive model for economic development associated with large commercial and smaller general
aviation airports. The model inputs considered as predictor variables were: Economic Characteristics of the
Airport Area (population, GDP, employment, etc.), Air Service Functional Characteristics (number of flights,
cities served, regional/national/international connections, etc.), Other Airport Functions (maintenance, charter,
military, etc. activities), Airport Land Characteristics (landside connections, nearby business space, distance to
prestige locations, etc.), and Metropolitan Market Orientation (main business activities of closest city). They
developed a classification system for economic development activity or output associated with the airport that

60
included: employment by location, gross and net regional and local income, and gross and net building floor
space utilized.
A more recent representative example of the “productivity” approach was published in 2002 and
summarized in 2003. The Air Transport Research Society (ATRS) published the results of their Global Airport
Benchmarking Task Force. The study attempted to measure the productivity performance of 50 major airports
in Asia, Europe, and North America. The team explicitly recognized that “The airport industry is very diverse
and heterogeneous with a high degree of quality differentiation, different ownership and regulatory structures,
different mixes of services and operating characteristics, as well as external constraints such as location and
environmental factors” (Oum et al., 2002).
Previous studies of airport economic performance have differentiated airport activities using two
categories of activity; primarily “landside” vs. “airside” (Gillen & Lall, 1997; Pels, Nijkamp, & Rietveld, 2001).
Differentiating on this basis was rejected by the ATRS study and Oum. This decision was based on the
recognition that activity on the landside was directly driven by and integrated with activity on the airside. Also,
previous work had not uncovered significant enough differences to merit this analytical contrast. Other studies
have used a three dimensional taxonomy of airport economic activity proposed by Doganis (Doganis, 1992;
Doganis, Lobbenberg, & Graham, 1995). This model includes Essential Operational Services, Traffic-Handling
Services, and Commercial Activities. Theory supports the use of this contrast based on two related
assumptions. First, Operational Services and Traffic Handling Services, while both inherently “governmental”
functions, have very different organizational goals and hence performance expectations and measures. This
would separate them each from the other; and certainly separate them from the very different “for profit”
motivations of Commercial Services. The second assumption is that organizations with different objectives and
performance expectations need to be assessed differently by different metrics. This approach was also rejected
by Oum in analyzing the ATRA data set.
As with some previous studies, Oum et. al. (2002) do not specifically focus on categorizing activities on
airports. They defined airport characteristics using 2 aggregate measures of “capacity” (annual enplanements
and average flight capacity), one measure of “connectedness” (% of flights operating internationally), and one
“economic” measure (percent of revenues generated from transportation vs. support activities). The economic
measure was the only attempt to classify airports by the type of activities performed by organizations on the
airport. The output measure focused on productivity/efficiency and the authors developed many complex
measures of productivity in their analysis.
In a case study, Peneda et. al. (2011) identified four critical factors that facilitate the development of
airport cities: connectivity of transportation infrastructure and markets, economic potential of the area,
commercial attitude of the airport operator, and sustainable development via collaborative and integrated
planning. Robertson (1995) examined the ability of airports to drive job growth and economic regeneration in
the United Kingdom. Of course, economic growth often comes at a cost; long standing concerns about noise,
pollution, congestion, property value, and accident risk are legitimate citizen concerns about airport operations,
and various governance organizations are receptive to those arguments in limiting growth (Freestone & Baker,
2011). Indirectly, if economic growth is designed to attract labor, commercial and industrial companies,
entrepreneurs, investment, political interest, and intellectual capital (Sheffi, 2012), then the associated costs
associated with those activities are also considered as airport costs.

61
Previous research has established support for the overall premise that there are relationships between
investments in airport infrastructure and economic activity. However, these studies are also very careful to
recognize that understanding the nature of this relationship is confounded by the influences of the various
externalities involved. The nature of the investment and resulting increased capabilities seem to act in specific
ways that are as yet materially unexamined. In addition, the role of how increased capabilities support (or make
possible) increased activity at the airport, and how increased activity in general leads to economic outcomes are
also ripe for additional clarification. It is the purpose of this investigation to shed light on the relationships
between airport capabilities, aviation activity at the airport, and the economic activity generated for the
community served by the airport.
Methodology
To study the relationships between Airport Capabilities (AC), Aviation Activities (AA), and Economic
Activity (EA) at general aviation airports, we propose the baseline theoretical model in Figure 1. “Airport
Capability” refers to ease of use and variety of operations supported, based on the characteristics of the airport
and associated navaids and infrastructure. “Airport Activity” refers to the nature, number, and type of
operations (both ground and air based) conducted in and around the airport, that rely on the airport in some
material way (would not otherwise happen but for the presence of the airport). “Economic Activity” refers to
the flow of dollars and products associated with the operations being conducted at the airport, assessed using
standard practices recognized by economists and the FAA in analyzing aviation-related commerce. Each
construct will be described in greater detail (variables used and how they were measured and analyzed) in the
following paragraphs.
Figure 1. Baseline Theoretical Model With the broad theoretical model as a foundation, we propose that higher levels of AC and AA lead to
an increase in EA. Furthermore, we suggest that AA at the airport mediates the relationship between AC and
EA.
Data Collection
The data used in this study was collected using surveys, interviews, and secondary data sources as part of
project funded by the Texas Department of Aviation (TXDOT) to assess the economic significance of general
aviation airports in Texas (TXDOT, 2011). There are 1,461 airports in Texas, the state airport system plan
includes 292 of them for public investment and development. Of these, 25 provide scheduled air service (“non
GA”) and 42 are very small rural airports that were not surveyed. Therefore, 225 GA airports included in the
state system plan were surveyed, and 146 responded for an overall 65% response rate.
The survey instruments used in this research (airport managers surveys, airport business tenant surveys,
and itinerant pilot surveys) followed the format and content of previous research projects undertaken by the
Texas Department of Transportation (TXDOT, 2005). This allowed comparisons to be made with the previous
Airport
Capability
Airport
Activity
Economic
Activity

62
research to identify possible errors and omissions in completing the survey instruments. In the case of airport
manager surveys, this also meant that many of the respondents had completed the same survey for an earlier
time period. Surveys from business tenants were compared to data available from a national business database
published by InfoGroup. The InfoUSA database was also used to provide employment estimates from non-
respondent tenants. Due to incomplete responses on some key variables used in this study, 112 usable
instruments were analyzed.
Total Annual Economic Activity
The economic activity data was collected through a combination of interviews, surveys and secondary data
sources. Interviews and surveys were conducted with airport managers and managers of airport tenant
operations. Investment and spending (capital improvement), revenue, cost, aviation activity and airport
capability data were collected for 2010. Secondary data sources were used (government and regulatory agency
filings) to collect and verify employment and sales economic data as well as the numbers and levels of various
aviation activities conducted at the airport. Over 300 transient and itinerant pilots operating at general aviation
airports in Texas also provided data on spending in support of aviation related activities. The data gathered
from transient and itinerant pilots was compared with the results of other similar surveys performed by Wilbur
Smith & Associates to verify the reasonableness of spending estimates.
Spending, revenue, or employment data served as input for the IMPLAN economic input-output model
from MIG, Inc (2014). For each spending category, appropriate industry sectors were selected using the
IMPLAN sectoring scheme. We treat the spending data as output to final demand. Where appropriate, retail
trade margins were applied before entering the spending data. For most of the participating business tenants,
the response of choice was employment levels at the relevant facility. The IMPLAN model has the option of
using employment as a data input and then estimates output to final demand based on national product
account prepared by the Bureau of Economic Analysis. The IMPLAN model produces estimates of total direct,
indirect and induced effects for output, employment, and labor income for the defined study area. In this
analysis, the defined study area for each airport is the airport’s host county. If an airport’s property falls within
the jurisdictional boundaries of more than one county, the study area is the combined counties.
The total economic activity (EA) at each airport measures the total amount of dollars flowing as a result of
airport and related business operations in calendar year 2010 (see Table 2). The EA variable is the sum of the
direct, indirect, and induced impacts of airport operations spending, business operations at business tenants,
and the spending of transient and itinerant pilots for lodging, fuel, dining, entertainment and other spending.
The total EA variable was transformed using the Box-Cox transformation to correct a positive skew in the
dataset (Box & Cox, 1964). Normality was confirmed using histograms, probability plots, and a scatter plot
against the independent variables.
Airport Activity
The airport activity (AA) data were collected from survey data reported by each airport manager and
secondary sources (air traffic control count data). Airport activity measures the total number of aircraft
operations at the airport in 2010, as shown in Table 2. Airport activity included a full range of operations such
as business support, flight training, commercial and military operations, etc. following the characterizations
from the 2012 FAA study FAA (2012a).

63
Table 2. General Aviation Airport Sample (N = 112)
Mean SD Min Max
Economic Activity $50,514,014 $257,566,496 $169,975 $2,022,220,389
Annual Airport Activity 15,003 33,475 36 208,248
The survey instrument included 21 types of activities and items for respondent provided activity
descriptions as described earlier in the paper (see Table 1. General Aviation Airport Activity Classification).
Airport executives were asked to provide numerical counts per month and an estimate of the overall
importance of the activity to the community. A lognormal data transformation was used to correct a positive
skew in the dataset and normality was confirmed.
Airport Capability: Accessibility and Infrastructure
Airport Capability (AC) refers to the degree to which the airport is accessible under a wide range of
environmental conditions by a range of aircraft. We considered AC a multidimensional construct, with the
range of weather conditions that impact aircraft operations separable from the range of aircraft (e.g., size,
speed, type) that can use the airport. “Accessibility” (ACCESS) refers to the range of weather conditions under
which safe operations can be conducted. “Infrastructure” refers to the inherent ability of the airport to handle
larger and faster (more capable) aircraft. We hypothesize that some airport capabilities particularly well suited to
stimulate airport activity at and through the airport as a way to stimulate economic development and the quality
of life/standard of living for a served population.
Airport Accessibility. We examined several variables that comprise the decision set for safe landings at
an airport under a range of weather conditions. One of the primary considerations is the suitability of the
terminal navigational guidance under reduced visibility and the height of clouds during inclement weather
(FAA, 2014a). The FAA certifies “Approaches” to a safe landing based on how low to the ground the cloud
bases can be, and what visibility distance exists under the clouds. Less accessible airports have higher cloud
base minimums and longer visibility requirements for a safe landing; in other words, better weather. More
accessible airports have navigational aids that allow pilots to land safely (flight crew training and aircraft
capability permitting) during very low clouds and greatly reduced visibility.
Four variables were selected to measure the airport accessibility construct. First, the number of
“precision” vs. “non-precision” landing approaches was used. Precision and non-precision approaches are
defined by the FAA as meeting higher standards for accuracy and reliability (precision) or lower standards
(non-precision). Next, we measured the “decision height” (in feet) above the approach end of the runway. This
corresponds to the minimum height above the ground the pilot may descend in the clouds before having to
cancel his or her landing and fly to an airport with better weather. We also measured the instrument landing
system (ILS) runway visual range required for a safe landing (in miles). Better, more accurate ILS equipment
allow pilots to continue their landing under lower visibility distances. Lower minimums and lower visibility
numbers correspond to higher levels of accessibility during inclement weather.

64
Data for these variables were collected from the FAA published landing minimums for each airport in the
dataset. The number of runway approaches was standardized by dividing each variable (the number of
precision and non-precision approaches) by the number of runways at the airport. We standardized the number
of approaches because the objective was to measure the airport capability rather than airport size. For example,
if we compare two airports, each with a single runway, we assumed that the airport with two precision
approaches on the runway is accessible under a wider variety of aircraft and weather conditions than the airport
with only one precision approach on the runway. Additionally, we included the number of runways in the
airport infrastructure construct and wanted to avoid collinearity or construct overlap in the model. The data for
decision height above the approach end of the runway and ILS visibility range were reverse scored, so that
larger values correspond to higher levels of accessibility by aircraft under adverse weather conditions.
Principal component analysis (PCA) was used to reduce the airport accessibility variables into a single
measure for each airport (see Table 3). PCA is appropriate when there is redundancy among the observed
variables and the objective is to reduce the number of variables, while accounting for the majority of the
variance in a set of observed variables. The components were extracted, keeping those with an Eigen value >1.
One component was extracted (λ = 2.64) that accounted for 66 percent of the total variance in the variables. A
factor loading greater than 0.5 can be considered meaningful (Pedhazur & Schmelkin, 1991), in PCA. The only
factor loading that did not meet this criterion was the number of precision approaches per runway, as shown in
Table 3. This was most likely due to the large number of general aviation airports in our sample that do not
have precision approach runways. However, as a measure of airport accessibility, we believe it was important to
include this variable, particularly since it is very close to the recommended factor loading. The extracted
component was negatively skewed. To correct this, a Box-Cox transformation was applied (Box & Cox, 1964).
Normality was confirmed using histograms, probability plots, and a scatter plot against the dependent variable,
Economic Activity.
Table 3. Airport Accessibility: Factor Loadings, Descriptive Statistics, and Correlations
Factor Loadings
Mean SD 1 2 3 4
1 Num_PrecAprch/Runway 0.446 0.112 0.291 1.000
2 Num_NonPrecAprch/Runway
0.793 1.705 1.102 0.145 1.000
3 Rev_BestDecisionHeight 0.947 965.393 432.044 0.294** 0.657*** 1.000
4 Rev_BestVisualRange 0.957 1.755 0.784 0.357*** 0.650*** 0.949*** 1.000
** p < 0.01, *** p < 0.001 (2-tailed)
Airport Infrastructure. The second measure of airport capabilities included the airfield infrastructure at
the airport. Airport infrastructure (INFRA) measured the capability of the airfield in terms of the number of
runways, the length of the longest runway (in feet), the maximum weight bearing capacity of the runway system
(in thousands of pounds), and whether there was an air traffic control tower on the airfield (0 = no, 1 = yes).
The airfield infrastructure data were collected from the FAA Airport Master Record Data (Form 5010) for the
airports in this study. Principal component analysis was used to construct a single variable to measure the
airport infrastructure. The components were extracted, keeping those with an Eigen value >1. One component
was extracted (λ = 2.345) that accounted for 58.6 percent of the total variance in the variables. The factor

65
loadings (see Table 4) suggest that each variable satisfactorily measures airport infrastructure. The extracted
component was positively skewed. To correct this, a Box-Cox transformation was applied to the infrastructure
component (Box & Cox, 1964). Normality was confirmed using histograms, probability plots, and a scatter plot
against the dependent variable, Economic Activity.
Table 4. Airport Infrastructure: Factor Loadings, Descriptive Statistics, and Correlations
Factor Loadings
Mean SD 1 2 3 4
1 Number Runways 0.599 1.55 0.68 1.000
2 Longest Runway (in feet)
0.854 5129.49 1306.70 0.400*** 1.000
3 Max Wt Bearing Capacity
0.838 53.26 100.50 0.309*** 0.655*** 1.000
4 ATCT 0.745 0.14 0.35 0.268** 0.481*** 0.511*** 1.000
** p < 0.01, *** p < 0.001 (2-tailed) Airport Size
Airport Class (SIZE) was used as a proxy for airport size and measures the scale of operations at the
airport in terms of airport employees. The airports in the sample were categorized based on the number of
airport employees (FTE, full-time equivalents) as shown in Table 5. We assume that as the scale and scope of
airport operations increase so does the number of employees required to manage these operations. Class 1
through 3 was assigned to the dataset based on self-reported employment data for calendar year 2010. Class 4
was assigned to airports designated as commercial service airports or general aviation reliever airports in the
FAA National Plan of Integrated Airport Systems (NPIAS). This variable was used as a control variable.
Table 5. Airport Class Definitions (N = 112)
Airport Class Airport Employees Number
in Sample
1 < 0.6 FTE 15
2 0.6 – 4.0 FTE 17
3 > 4.0 FTE 63
4 Comm Service or GA
Reliever 17
Constructs, Hypotheses and Theoretical Model
The individual constructs have been described and tested for internal reliability and validity in the previous
sections. Before proceeding to the analysis, it would be instructive to restate and clarify the overall relationships
between the constructs and associated hypotheses in light of the theoretical model. The revised model (shown

66
in Figure 2) describes and includes the results of clarifying and disaggregating the constructs of interest and the
relationships between them.
Figure 2. Full Theoretical Model
Next, summary statistics and biserial correlations between the constructs were calculated and are
presented in Table 6. Given the established internal validity within each construct, the relationships between
them appear quite promising and merit further investigation.
Table 6. Descriptive Statistics and Pearson Correlation Coefficients (N = 112)
Mean SC Min Max 1 2 3 4 5
1 EA 0.047 0.868 -1.80 2.57 1.000
2 AA 8.178 1.714 3.61 12.25 0.510*** 1.000
3 ACCESS 0.000 1.004 -1.91 2.05 0.609*** 0.481*** 1.000
4 INFRA 0.006 1.002 -2.45 2.19 0.666*** 0.382*** 0.457*** 1.000
5 SIZE 2.732 0.880 1.00 4.00 0.673*** 0.435*** 0.575*** 0.562*** 1.000
*** p < 0.001
Referring to Figure 2, Full Theoretical Model, and the factor loadings and relationships in Table 6, the
following hypotheses were investigated:
H1a: Higher levels of airport accessibility results in higher levels of airport activity.
H1b: Higher levels of airport infrastructure results in higher levels of airport activity.
H2a: Higher levels of airport accessibility results in higher levels of EA.
H2b: Higher levels of airport infrastructure results in higher levels of EA.
H2c: Higher levels of airport activity results in higher levels of EA.
H2d: Larger airports is associated with higher levels of EA.
H3a: Airport Activity amplifies the relationship between airport accessibility and EA.
H3b: Airport Activity amplified the relationship between airport infrastructure and EA.
Airport
Size
Economic
Activity
Airport
Capability
Airport Activity

67
The conditioned dataset with all variables and constructs as described was used to test the hypotheses.
The process for analyzing the data is described in the next section.
Analysis
Path analysis was performed using IBM SPSS AMOS 21 to analyze the theoretical relationships (direct and
indirect effects) between airport accessibility, infrastructure, airport activity, and economic activity. The path
coefficients were estimated using the maximum likelihood method and the variance-covariance matrix.
The model demonstrated good fit with the sample data. The chi-squared statistic was not significant (χ2 =
2.566, df = 1, N = 112, p = 0.109) indicating that we cannot reject the null that the covariance matrix in the
sample can be modeled as shown in Figure 3. The normed fit index (NFI = 0.989), and comparative fit index
(CFI = 0.993) confirm good fit with values greater than 0.9. In smaller samples, such as in this study, the CFI
has been shown to be less biased (Bentler, 1989). The standardized path coefficients, shown in Figure 3, were
all statistically significant at the p<0.05 confidence level or better.
Figure 3. Airport Economic Activity Model A traditional tabular representation of the association strengths and weight coefficients is presented in
Tables 7 and 8. The model demonstrates both statistical and practical significance well within generally
accepted norms for data of this type. Even with a relatively small number of data points, the relationships are
strong and non-random. Inference is clouded by the transformations used on some of the variables, and will
be discussed in the next section.
Airport Access
Airport
Infrastructure
Airport
Class
Total Annual
Activity
Economic
Activity
0.212***
0.149*
0.291***
0.351***
0.387***
0.205*
0.457***
0.562***
0.575***
1Standardized path weights are reported
(*** p < 0.001, ** p < 0.01, * p < 0.05)

68
Table 7. Regression Analysis
Variable1 Model 12
DV: Airport Activity (AA) Model 22
DV: Economic Activity (EA)
Constant *** *** (58.299) (-4.028) ACCESS 0.387 *** 0.212 ** (4.233) (2.771) INFRA 0.205 * 0.351 *** (2.239) (4.981) AA 0.149 * (2.210) SIZE 0.291 *** (3.756)
N 112 112
R2 0.265 0.632
Adj R2 0.251 0.619 F 19.605 *** 46.003 *** df 2 4
1: t-statistics are in parentheses 2: *** p < 0.001, ** p < 0.01, * p < 0.05
Table 8. Decomposition of the Airport Economic Activity Model
Causal Structural Relationships1
Direct Effect
Indirect Effect
Total Effects
Annual Airport Activity (AA)
ACCESS 0.387 0.387
INFRA 0.205 0.205
Annual Economic Activity (EA)
ACCESS 0.212 0.058 0.270
INFRA 0.351 0.031 0.382
AA 0.149 0.149
SIZE 0.291 0.291
1 Standardized Path Coefficients
Results and Discussion
We first examined whether higher levels of airport capabilities resulted in higher levels of airport activity,
as measured by annual aircraft operations. We found that both airport accessibility (H1a) and airport
infrastructure (H1b) resulted in higher levels of airport activity. While this is a basic expectation for any airport,
we found that accessibility, in terms of instrument landing capability, has a greater impact on the number of
aircraft operations than airport infrastructure. A one standard deviation increase in ACCESS results in a 38.7%

69
increase in the number of operations, while a one standard deviation increase in INFRA only results in a 20.5%
increase in number of operations. This is likely due to the dependence of all operations on the unrestricted (by
weather) flow of aircraft into and out of the airport itself; compared to simply having wider, longer runways
and more ramp space. Infrastructure cannot be leveraged if it remains idle due to suspended air operations.
Activity at the airport not directly dependent on access (e.g. aircraft maintenance, underwriting, research,
tourism, or sales activities) do not seem to counterbalance the core dependence on traffic or “fundamentally
aviation” type activities. From a managerial standpoint, this suggests that efforts to “broaden” the range of
activity aside from flight would not have the same level of results as better approaches with lower decision
heights and shorter RVRs. This finding could be used to support resource allocation decisions.
This is somewhat challenged when we looked at “Economic Activity” specifically. We next examined the
impact of airport capabilities, airport activity, and airport size on the economic activity at the airport. We found
that airport infrastructure (H2b) and airport size (H2d) had a larger impact on economic activity than airport
accessibility (H2a) and airport activity (H2c), although all relationships were statistically significant. A one
standard deviation increase in INFRA resulted in a 0.351 standard deviation increase in the economic activity –
the most powerful single contributor to economic outcomes. More and longer/wider runways, with higher load
bearing capabilities, allows for potentially a wider range of operations from cargo handling to business jets.
The explanation for this seeming contradiction is provided by the (properly described in the model)
mediating role of “Activity” with respect to the baseline factors against “Economic Activity.” We hypothesized
that the number of aircraft operations mediates the relationship between airport capabilities (H3a, b) and
economic activity at the airport. We found that airport activity does mediate this relationship, though only
partially. If airport activity fully mediated this relationship, then ACCESS and INFRA would not be significant
in the full model. However, after decomposing the causal structural relationships, we found the total effect of
airport capability is larger than the direct effect for both ACCESS (H3a) and INFRA (H3b). To simplify: while
it can generally be said that having both unrestricted access and more capable infrastructure are associated with
more operations and therefore more economic activity, a “bigger airport” is not necessarily the key to
generating increased economic activity- at least for general aviation airports in the State of Texas. Furthermore,
not all activities at the airport are created equal; certain activities (generally those most closely related to flight
operations) generate more economic activity than others. The question of “where to invest scarce resources
for the highest rate of return” is only partially answered by this investigation.
Summary and Recommendations
In this study we have demonstrated that strong, significant positive relationships exist between Airport
Capabilities (Accessibility and Infrastructure), Airport Size (Class), Airport Activity, and Economic Activity.
Investments in infrastructure and access do indeed result in increased economic activity; more so than just
“size” (as measured by number of employees). The statistical models used also provided the relative strengths
of the relationships; only relative inference is possible due to the variable transformations used. Practical,
managerial inferences can also be drawn. First, it is not unreasonable to expect that investment (public or
private) in improved airport capability does indeed stimulate increased economic activity directly, and by
increasing the number and importance of activities taking place at the airport. In this study, Airport Capability
was measured in the form of navaids and associated physical infrastructure to improve the range of operations
that can be conducted at the airport.

70
Additional research of this type is needed, however, in an effort to more deeply understand these
relationships in order to improve the return on investment. It would be helpful, for example, to be able to tell
which specific capabilities and activities lead to the greatest increases in economic activity. If there are
additional factors that moderate the relationships (increasing or decreasing their strength), analysis of the
presence or absence of these factors may indicate better or worse investment choices among airports and
capabilities. In addition, these initial results may reflect the dynamics of what works in the state of Texas; a
multi-state or national study would be needed to determine if local or regional factors affected the model.
Texas is a “block grant” state; where great autonomy is given to local and state level planners when making
public investment decisions under the AIP. The nature of the relationships in the model described by this study
may differ for non-block grant states. Finally, this study analyzed the contribution of General Aviation
operations to economic activity. It is believed the model can be tested against Commercial Aviation (scheduled
air service) operations. The efficiency of public investment in airport capabilities may depend on different
factors or to different degrees under one market segment vs. the other. It is anticipated that the results of such
future research efforts can instruct public policy decisions.
References ACI-NA. (2012). The Economic Impact of Commercial Airports in 2010: Airports Council International -
North America. Bentler, P. M. (1989). EQS Structural Equations Program Manual: BMDP Statistical Software. Blanton, W. (2004). On the Airfront. Planning, 70(5), 34-35. Bombardier. (2013). Bombardier Business Aircraft Market Forecast 2013-2032. Box, G. E. P., & Cox, D. R. (1964). An analysis of transformations. Journal of the Royal Statistical Society. Series B
(Methodological), 26(2), 211-252. Doganis, R. (1992). The Airport Business. New York: Routledge. Doganis, R., Lobbenberg, A., & Graham, A. (1995). The economic performance of European airports. Cranfield
University, Bedford, UK: Department of Air Transport. FAA. (2011). The Economic Impact of Civil Aviation on the U.S. Economy: Economic Impact of Civil
Aviation by State. Washington DC. FAA. (2012b). Report to Congress: National Plan of Integrated Airport Systems (NPIAS) 2013-2017.
Washington DC. FAA. (2014a). Aeronautical Information Manual: Official Guide to Basic Flight Information and ATC Procedures. FAA. (2014b). Airport Improvement Program (AIP). Retrieved March 15, 2014, from
http://www.faa.gov/airports/aip/ Francis, G., Humphreys, I., & Fry, J. (2002). The benchmarking of airport performance. Journal of Air Transport
Management, 8(4), 239-247.

71
Freestone, R., & Baker, D. (2011). Spatial planning models of airport-driven urban development. Journal of
Planning Literature, 26(3), 263-279. DOI: 10.1177/0885412211401341 Gillen, H. W. , & Lall, A. (1997). Developing measures of airport productivity and performance: an application
of data envelopment analysis. Paper presented at the Proceedings of the Aviation Transport Research Group Conference, Vancouver
Humphreys, I., & Francis, G. (2002). Performance measurement: A review of airports. International Journal of
Transport Management, 1(2), 79-85. ICAO. (2002). Highlights in the Economic Development of Airports and Air navigation Services. Quebec,
Canada: International Civil Aeronautics Organization. Kanafani, A., & Abbas, M. (1987). Local air service and economic impact of small airports. Journal of
Transportation Engineering, 113(1), 42-55. DOI: 10.1061/(ASCE)0733-947X(1987)113:1(42) Karsner, D. (1997). Aviation and Airports: The Impact on the Economic and Geographic Structure of
American Cities, 1940s-1980s. Journal of Urban History, 23(4), 406-436. Kasarda, J. D. (2000). Aerotropolis: Airport-driven urban development. Urban Land, 59(9 Supp/1), 32-41. MIG. Inc. (2010). IMPLAN Economic Input-Output Modeling System [software]. Oum, T. H., Yu, C., & Fu, X. (2002). A comparative analysis of productivity performance of the world's major
airports: summary report of the ATRS global airport benchmarking research report—2002. Journal of Air Transport Management, 9(5), 285-297. DOI: 10.1016/s0969-6997(03)00037-1
Pedhazur, E. J., & Schmelkin, L. P. (1991). Measurement, design, and analysis: An integrated approach. Hillsdale, NJ:
Lawrence Erlibaum Associates, Publishers. Pels, E., Nijkamp, P., & Rietveld, P. (2001). Relative efficiency of European airports. Transport Policy, 8, 182-
192. Peneda, M., Reis, V., & Macário, M. (2011). Critical factors for development of airport cities. Transportation
Research Record: Journal of the Transportation Research Board, 2214(Aviation 2011), 1-9. DOI: 10.3141/2214-01 Robertson, J. A. W. (1995). Airports and economic regeneration. Journal of Air Transport Management, 2(2), 81-88.
DOI: http://dx.doi.org/10.1016/0969-6997(95)00033-X Schlaack, J. (2010). Defining the Airea: Evaluating Urban Output and Forms of Interaction Between Airport
and Region. In U. Knippenberger & A. Wall (Eds.), Airports in Cities and Regions: Research and Practise (pp. 113-126). Karlsruhe: KIT Scientific Publishing.
Sheffi, Y. (2012). Logistics clusters: Delivering value and driving growth. Cambridge Massachusetts: The MIT Press. TXDOT (2005). Economic impact of general aviation in Texas. Wilbur Smith and Associates TXDOT. (2011). Economic Impact 2011: General Aviation in Texas. University of North Texas, Department
of Economics: Center for Economic Development and Research (CEDR).

72
USDOT. (2012). US Department of Transportation Mission Statement. Retrieved March 15, 2014, from http://www.dot.gov/mission/about-us
USDOT. (2014). Moving Ahead for Progress in the 21st Century Act (MAP-21). Retrieved March 15, 2014,
from http://www.dot.gov/map21 Weisbrod, G. (1990). Economic Impacts of Improving General Aviation Airports. Transportation research
record, 1274, 134-141. Weisbrod, G. E., Reed, J. S., & Neuwirth, R. M. (1993). Airport area economic development model. Paper
presented at the PTRC International Transport Conference, Manchester, England.

73
Call for Papers The Collegiate Aviation Review--International (CaRi) is the refereed journal of the University Aviation Association. The CaRi the following types of manuscripts: Feature Articles – Research studies; qualitative and quantitative research manuscripts relevant to aviation are acceptable. Professional Views/Editorials – Professional aviation viewpoints regarding a given topic. Literature Reviews – A survey of books, articles, or other works that does not contain a methodology or results section and requires no quantitative or qualitative analysis. Book Reviews – Constructive summaries of the quality, strengths, weaknesses, and impact of an existing, published book. Research Collaborative Abstracts – A proposal abstract submitted for publication with the intent on attracting collaborators willing to join the author in the full study. It is indexed by the EBSCO, Elsevier and ProQuest indexing services. The CaRi feature article review process incorporates a blind peer review by a panel of individuals who are active in the focus area of each manuscript. All other manuscripts are provided by the editors of the CaRi. Authors should e-mail their manuscript, in Microsoft Word format, to the editor at [email protected]. The 2016 CaRi Author’s Handbook should be consulted for formatting guidance. Please see the CaRi website at www.uaa.aero under publications for a copy of the guide. All submissions must be accompanied by a statement that the manuscript has not been previously published and is not under consideration for publication elsewhere. Further, all submissions will be evaluated with plagiarism detection software. Submissions that include plagiarized passages will not be considered for publication. If the manuscript is accepted for publication, the author(s) will be required to submit a final version of the manuscript via e-mail, in “camera-ready” Microsoft Word format, by the prescribed deadline. All authors will be required to sign a “Transfer of Copyright and Agreement to Present” statement in which the copyright to any submitted paper which is subsequently published in the CaRi will be assigned to UAA. Students are encouraged to submit manuscripts to the CaRi. A travel stipend for conference attendance up to $500 may be available for successful student submissions. Please contact the editor or UAA for additional information.
Questions regarding the submission or publication process may be directed to the editor, Dr. Todd Hubbard, at (405) 474-5199, or may be sent by email to [email protected].