collision cross-section determination of lipids on the
TRANSCRIPT
goalTo determine the collision cross-sections of
singly charged lipid ions analyzed by MALDI
mass spectrometry.
BackgroundLipidomics is a rapidly expanding field of
research, where mass spectrometry plays a key
role. Moreover, visualizing the localization of
lipids within a tissue section is challenging since
there are no antibodies specific to lipids. However,
imaging by MALDI mass spectrometry allows the
location of different classes of lipids directly from
tissue sections to be visualized, thereby enhanc-
ing lipid studies.
The use of ion mobility to evaluate the size and
shape of ions in the gas phase is a technique
which is rapidly gaining recognition. Initial
studies were carried out on proteins; however, it
has now been demonstrated that it is possible to
use ion mobility to measure the collision cross-
section of other types of molecules, like lipids.
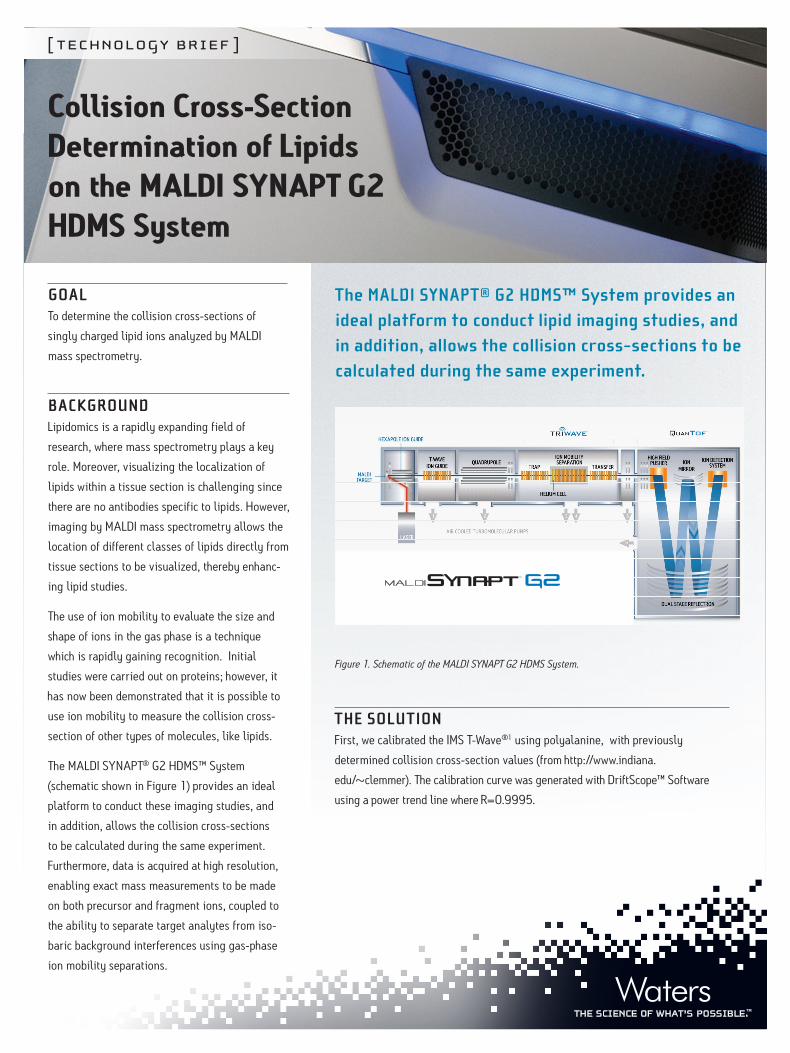
The MALDI SYNAPT® G2 HDMS™ System
(schematic shown in Figure 1) provides an ideal
platform to conduct these imaging studies, and
in addition, allows the collision cross-sections
to be calculated during the same experiment.
Furthermore, data is acquired at high resolution,
enabling exact mass measurements to be made
on both precursor and fragment ions, coupled to
the ability to separate target analytes from iso-
baric background interferences using gas-phase
ion mobility separations.
Figure 1. Schematic of the MALDI SYNAPT G2 HDMS System.
The MaldI SYnaPT® g2 HdMS™ System provides an ideal platform to conduct lipid imaging studies, and in addition, allows the collision cross-sections to be calculated during the same experiment.
[ technology brief ]
Collision Cross-Section Determination of Lipids on the MALDI SYNAPT G2 HDMS System
THe SoluTIon First, we calibrated the IMS T-Wave®1 using polyalanine, with previously
determined collision cross-section values (from http://www.indiana.
edu/~clemmer). The calibration curve was generated with DriftScope™ Software
using a power trend line where R=0.9995.
TM
Waters Corporation 34 Maple Street, Milford, MA 01757 U.S.A. T: 1 508 478 2000 F: 1 508 872 1990 www.waters.com
Waters and SYNAPT are registered trademarks of Waters Corporation. The Science of What’s Possible, and HDMS are trademarks of Waters Corporation. All other trademarks are the property of their respective owners. ©2010 Waters Corporation. Produced in the U.S.A.May 2010 720003536EN AO-PDF
To calculate the collision cross-sections of each lipid
standard, PC (16:0/16:0), PS (18:1/18:1), and PG
(16:0/18:1) (Avanti Polar Lipids ) were mixed individu-
ally with α-cyano-4-hydroxycinnamic acid (CHCA)
matrix, spotted onto a MALDI stainless steel target, and
analyzed under identical conditions to those used for
the polyalanine standard. The analysis was performed
using a 1 kHz Nd:YAG laser system on a MALDI SYNAPT
G2 operated in HDMS mode. CCS calculations were also
determined for the sodiated and potassiated species,
when present.
Figure 2 shows that the collision cross-section,
which was calculated to be 214.9 Å2 for MH+ of PC
(16:0/16:0). This is in accordance with previously
published results2 by Ridenour et. al., where their CCS
calculation of these lipids on a MALDI SYNAPT (G1)
HDMS instrument were found to be 215.3 Å2 +/- 3.6.
The collision cross-section of the Na+ and K+ species of
the PC and PS standards indicate a more open configu-
ration in the gas phase relative to the MH+ species when
compared to the PG lipid standard. Here the Na+ and
K+ of the PG ion appear to be more compact in the gas
phase versus their MH+, which could indicate that the
lipid may be folded around the salt.
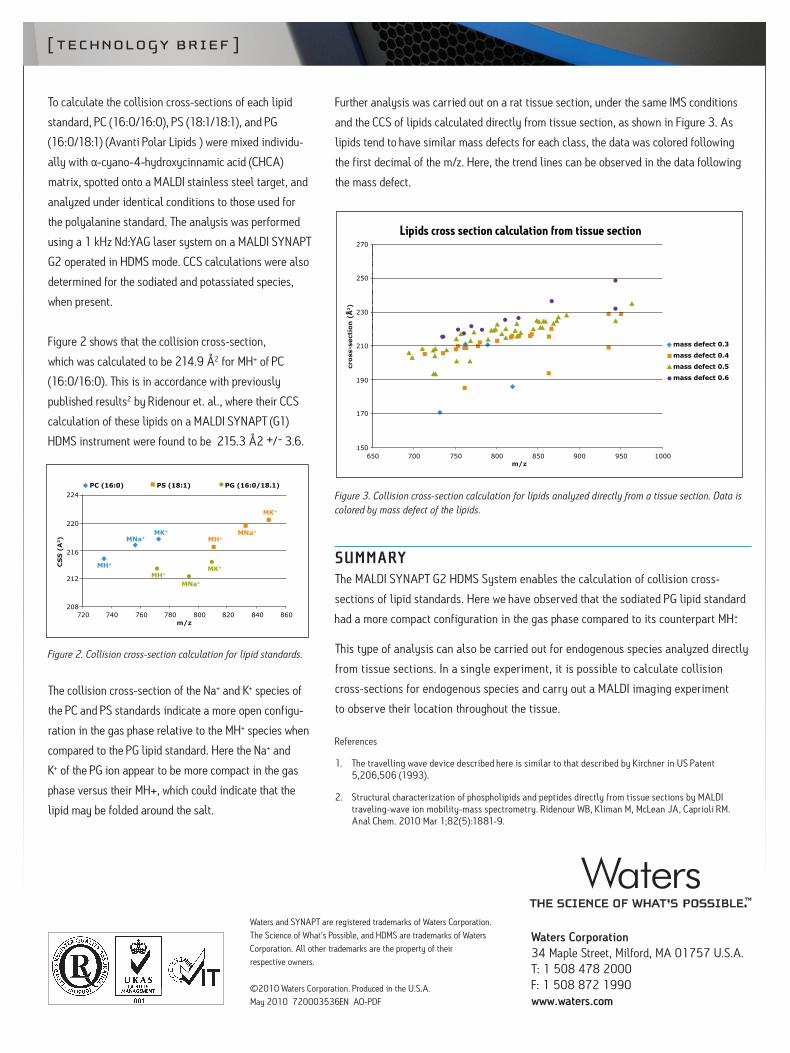
Further analysis was carried out on a rat tissue section, under the same IMS conditions
and the CCS of lipids calculated directly from tissue section, as shown in Figure 3. As
lipids tend to have similar mass defects for each class, the data was colored following
the first decimal of the m/z. Here, the trend lines can be observed in the data following
the mass defect.
Figure 3. Collision cross-section calculation for lipids analyzed directly from a tissue section. Data is colored by mass defect of the lipids.
SuMMarYThe MALDI SYNAPT G2 HDMS System enables the calculation of collision cross-
sections of lipid standards. Here we have observed that the sodiated PG lipid standard
had a more compact configuration in the gas phase compared to its counterpart MH+.
This type of analysis can also be carried out for endogenous species analyzed directly
from tissue sections. In a single experiment, it is possible to calculate collision
cross-sections for endogenous species and carry out a MALDI imaging experiment
to observe their location throughout the tissue.
References
1. The travelling wave device described here is similar to that described by Kirchner in US Patent 5,206,506 (1993).
2. Structural characterization of phospholipids and peptides directly from tissue sections by MALDI traveling-wave ion mobility-mass spectrometry. Ridenour WB, Kliman M, McLean JA, Caprioli RM. Anal Chem. 2010 Mar 1;82(5):1881-9.
720 740 760 780 800 820 840 860m/z
CS
S (
A2)
PC (16:0)
MH+
MNa+ MK+
MH+ MNa+
MK+
MK+
MNa+ MH+
PS (18:1) PG (16:0/18.1)
208
212
216
220
224
Figure 2. Collision cross-section calculation for lipid standards.
mass defect 0.3
mass defect 0.4
mass defect 0.5
mass defect 0.6
Lipids cross section calculation from tissue section
650150
170
190
210
230
250
270
700 750 800 850 900 950 1000m/z
cro
ss-s
ect
ion
(A
2)
[ technology brief ]